ey - usf | universal service fund
TRANSCRIPT

~
EY Building a better working world
- ,
~
EY Building a better working world
UNIVERSAL SERVICE FUND
FINANCIAL STATEMENTS FOR THE YEAR ENDED 30 JUNE 2016
EY Ford Rhodes Chartered Accountants Eagle Plaza 75-West. Fazlui-Haq Road Blue Area, P.O. Box 2388 Islamabad 44000, Pakistan
Tel: +9251 234 4160-62 Fax: +9251 234 4163 ey. [email protected] .com ey.com/pk
Building a better working world
EY Forcl Rhodes Chartered Accountants Eagle Plaza 75-West, Fazlui-Haq Road Blue Area, P.O. Box 2388 Islamabad 44000, Paldstan
Tel: +9251 234 4160-62 Fax: +9251 234 4163 ey. isb@lpk .ey.com ey.com/pk
AUDITORS' REPORT TO THE MEMBERS
We have audited the annexed balance sheet of Universal Service Fund ("the Company") as at 30 June,
2016 and the related income and expenditure account, cash flow statement and statement of changes
in equity together with the notes forming part thereof, for the year then ended and we state that we have obtained all the information and explanations, which to the best of our knowledge and belief, were necessary for the purposes of our audit.
It is the responsibility of the Company's management to establish and maintain a system of internal control, and prepare and present the above said statements in conformity with the approved accounting standards and the requirements of the Companies Ordinance, 1984. Our responsibility is to
express an opinion on these statements based on our audit.
We conducted our audit in accordance with the auditing standards as applicable in Pakistan. These
standards require that we plan and perform the audit to obtain reasonable assurance about whether the above said statements are free of any material misstatement. An audit includes examining on a test basis, evidence supporting the amounts and disclosures in the above said statements. An audit also includes assessing the accounting policies and significant estimates made by management, as well as, evaluating the overall presentation of the above said statements. We believe that our audit provides a reasonable basis for our opinion and, after due verification, we report that:
a) in our opinion, proper books of account have been kept by the Company as required by the
Companies Ordinance, 1984;
b) in our opinion:
i) the balance sheet and income and expenditure account together with the notes thereon have been drawn up in conformity with the Companies Ordinance, 1984, and are in agreement with the books of account and are further in accordance with accounting policies consistently
applied except for the changes as stated in note 4.4 with which we concur;
ii) the expenditure incurred during the year was for the purpose of the Company's business; and
iii) the business conducted, investments made and the expenditure incurred during the year were
in accordance with the objects of the Company;
c) in our opinion and to the best of our information and according to the explanations given to us, the balance sheet, income and expenditure account, statement of other comprehensive income, cash flow statement and statement of changes in funds and reserves together with the notes forming part thereof conform with the approved accounting standards as applicable in Pakistan, and, give the information required by the Companies Ordinance, 1984, in the manner so required and
respectively give a true and fair view of the state of the Company's affairs as at 30 June, 2016 and,
its cash flows and changes in equity for the year then ended; and
d) in our opinion, no Zakat was deductible at source under the Zakat and Ushr Ordinance, 1980 (XVIII
of 1980).
A member firm of Ernst & Young Global Limited

Building a better working world
Emphasis of Matter
We draw attention to note 14.2 to the financial statements, which describes the uncertainty related to the outcome of certain legal cases. Based upon the advice of the Company's tax advisor, management of the Company is confident of a favorable outcome in these cases. Accordingly, no provision has been recognized, by the Company, in the financial statements. Our opinion is not qualified in respect of this matter.
Other Matter
The financial statements of the Company for the year ended 30 June, 2015, were audited by another firm of chartered accountants, who expressed an unqualified opinion, with the inclusion of an emphasis on the same matter as reported above in their report on those financial statements, on 03 August. 2016.
~ (v--t ~_,.L_, Chartered Accountants Audit Engagement Partner's name: Mr. Khayyam Mushir Date: 16 February, 2017 Place: Islamabad
A mernb<:f i ;rm o f Ernst & Young Globa l Limited
- - --------
1
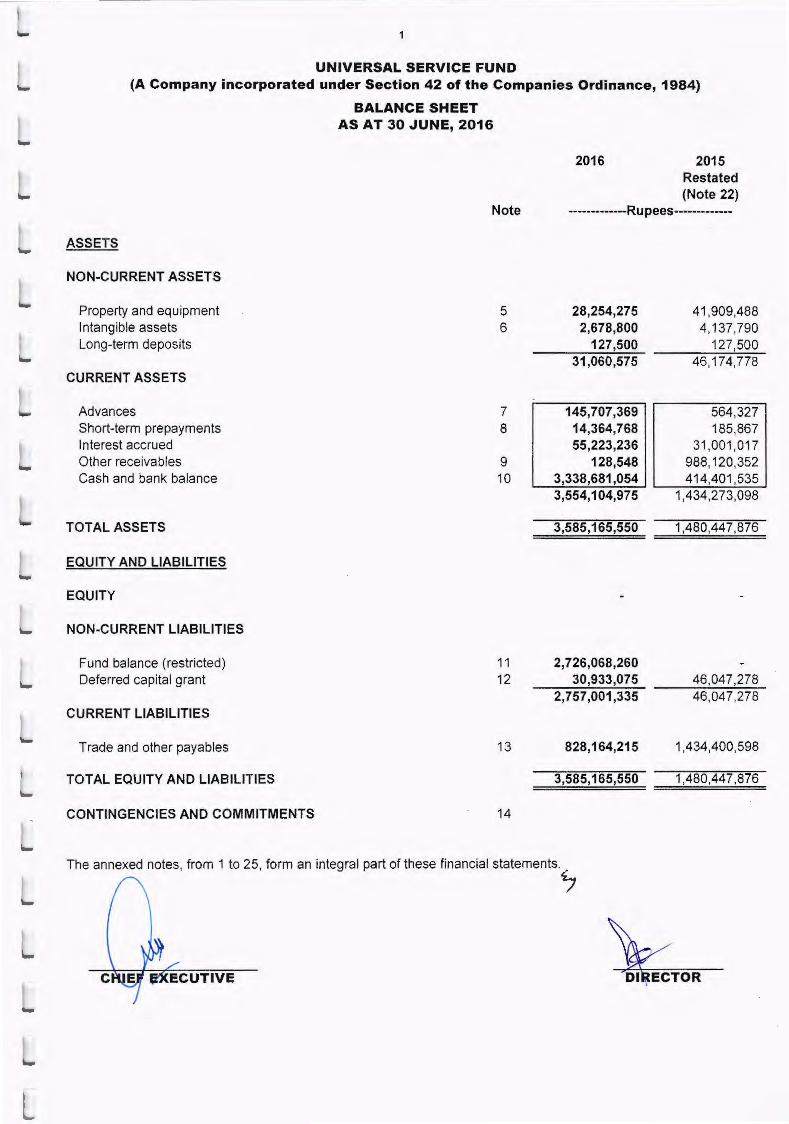
UNIVERSAL SERVICE FUND (A Company incorporated under Section 42 of the Companies Ordinance, 1984)
ASSETS
NON-CURRENT ASSETS
Property and equipment Intangible assets Long-term deposits
CURRENT ASSETS
Advances Short-term prepayments Interest accrued Other receivables Cash andbankba~nce
TOTAL ASSETS
EQUITY AND LIABILITIES
EQUITY
NON-CURRENT LIABILITIES
Fund balance (restricted) Deferred capital grant
CURRENT LIABILITIES
Trade and other payables
TOTAL EQUITY AND LIABILITIES
CONTINGENCIES AND COMMITMENTS
BALANCE SHEET AS AT 30 JUNE, 2016
2016 2015 Restated (Note 22)
Note -------------Rupees-------------
5 28,254,275 41 ,909,488 6 2,678,800 4,137,790
127,500 127,500 31 ,060,575 46,174,778
7 145,707,369 564,327 8 14,364,768 185,867
55,223,236 31,001,01 7 9 128,548 988,120,352 10 3,338,681 ,054 414,401 ,535
3,554,104,975 1,434,273,098
3,585,165,550 1,480,447,876
11 2,726,068,260 12 30,933,075 46,047,278
2,757,001,335 46,047,278
13 828,164,215 1,434,400,598
3,585,165,550 1,480,447,876
14
The annexed notes, from 1 to 25, form an integral part of these financial statements.
'7

2
UNIVERSAL SERVICE FUND (A Company incorporated under Section 42 of the Companies Ordinance, 1984)
INCOME AND EXPENDITURE ACCOUNT
FOR THE YEAR ENDED 30 JUNE, 2016
2016 2015
Restated (Note 22)
Note -------------Rupees-------------
INCOME
Amortization of deferred capital grant
EXPENDITURE
Administrative and general expenses
Subsidy grant for projects
Fee to technical auditors for projects
EXPENDITURE CHARGED TO FUND BALANCE
NETLOSSFORTHEYEAR
OTHER COMPREHENSIVE INCOME
Item not to be reclassified to income and expenditure
accountinsubsequentperiods
Remeasurement gain on deferred benefit plan
TOTAL COMPREHENSIVE INCOME FOR THE YEAR
12
15
16
17
11
16,174,453
243,431,865 4,311,898,653
10,305,100 4,565,635,618
(4,549,461 '165)
4,548,901,950
(559,215)
559,215
The annexed notes, from 1 to 25, form an integral part of these financial statements.
~
13,106,578
225,477,354
4,315,694,709
21 ,168,957
4,562,341 ,020
(4 ,549,234,442)
4,548,888,771
(345,671 )
345,671
3
UNIVERSAL SERVICE FUND
(A Company incorporated under Section 42 of the Companies Ordinance, 1984)
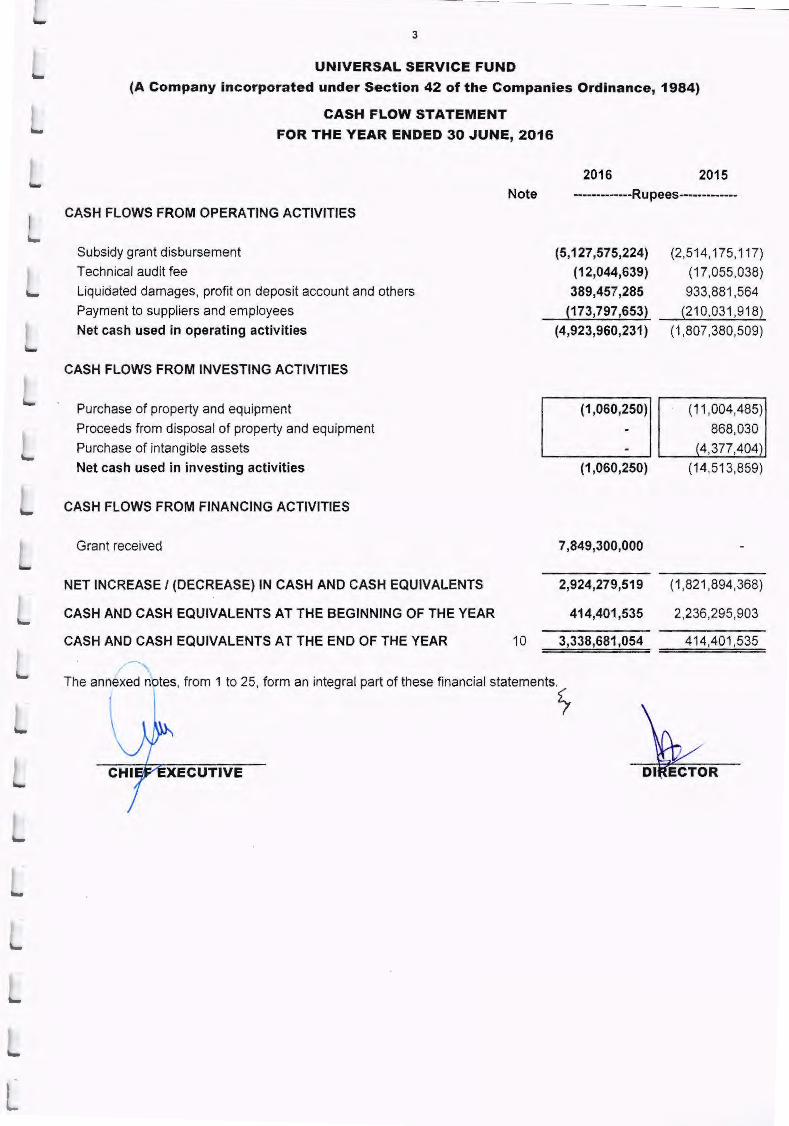
CASH FLOW STATEMENT
FOR THE YEAR ENDED 30 JUNE, 2016
2016 2015 Note -------------Rupees-------------
CASH FLOWS FROM OPERATING ACTIVITIES
Subsidy grant disbursement
Technical audit fee
Liquidated damages, profit on deposit account and others
Payment to suppliers and employees
Net cash used in operating activities
CASH FLOWS FROM INVESTING ACTIVITIES
Purchase of property and equipment
Proceeds from disposal of property and equipment
Purchase of intangible assets
Net cash used in investing activities
CASH FLOWS FROM FINANCING ACTIVITIES
Grant received
NET INCREASE I (DECREASE) IN CASH AND CASH EQUIVALENTS
CASH AND CASH EQUIVALENTS AT THE BEGINNING OF THE YEAR
CASH AND CASH EQUIVALENTS AT THE END OF THE YEAR 10
(5,127,575,224)
(12,044,639)
389,457,285
(173,797,653)
(4,923,960,231)
(1 ,060,250)
(1 ,060,250)
7,849,300,000
2,924,279,519
414,401 ,535
3,338,681 ,054
The annexed notes, from 1 to 25, form an integral part of these financial statements.
\ ~
(2,514,175, 117)
(17,055,038)
933,881 ,564
(210,031,918)
(1,807,380,509)
(11,004,485)
868,030
_(4,377,404)
(14,51 3,859)
(1,821,894,368)
2,236,295,903
414,401,535

4
UNIVERSAL SERVICE FUND
(A Company incorporated under Section 42 of the Companies Ordinance, 1984)
Balance at 01 July, 2014
Net loss for the year Other comprehensive income
Balance as at 30 June, 2015
Net loss for the year Other comprehensive income
Balance as at 30 June, 2016
STATEMENT OF CHANGES IN EQUITY
FOR THE YEAR ENDED 30 JUNE, 2016
The annexed notes, from 1 to 25 , form an integral part of these financial statements.
)
EQUITY ---------Rupees---------
(345.671 )I 345,671
(559,215)1 559,215

-
--
-
-
-- --------· ---------- ---- -------
5
UNIVERSAL SERVICE FUND (A Company incorporated under Section 42 of the Companies Ordinance, 1984)
NOTES TO AND FORMING PART OF THE FINANCIAL STATEMENTS FOR THE YEAR ENDED 30 JUNE, 2016
1 STATUS AND ACTIVITIES
The Universal Service Fund ("the Company"/"USF") was incorporated in Pakistan as a Public Company, limited by guarantee, not having a share capital and licensed under section 42 of the Companies Ordinance, 1984 on 12 December, 2006 as a not-for-profit entity. The Company was formed under Section 10 of the Universal Service Fund Rules, 2006 ("the Rules") and its registered office is situated at 5th floor, HBL Tower, Jinnah Avenue, Islamabad.
Pursuant to Section 16 of the Rules, operations of the Company are funded by the Ministry of Information Technology (MolT), Government of Pakistan through the Universal Service Fund ("USF"), a separate entity established under section 33 A of the Telecommunication Re-organization Act, 1996. Effective from 29 June, 2013, the USF is kept in the Federal Consolidated Fund and the Ministry of Finance releases the funds of the USF. The primary objective of the Company is to plan, develop, finance and execute communication network projects and services to un-served or under-served areas of Pakistan as defined under Section 26 of the Rules mainly through disbursement of grants received from Government of Pakistan, in the form of subsidies to selected contributories to USF, for execution of the related teleco projects.
2 STATEMENT OF COMPLIANCE
These financial statements have been prepared in accordance with the approved accounting standards as applicable in Pakistan. Approved accounting standards comprise of such International Financial Reporting Standards (IFRS) issued by the International Accounting Standards Board as are notified under the Companies Ordinance, 1984, provisions of and directives issued under the Companies Ordinance, 1984. In case requirements differ, the provisions or directives of the Companies Ordinance, 1984 shall prevail.
3 BASIS OF PREPARATION
These financial statements have been prepared under the historical cost convention except for liability for gratuity, which is carried at present value of defined benefit obligation, and plan asset, which is carried at fair value.
4 SUMMARY OF SIGNIFICANT ACCOUNTING POLICIES AND ESTIMATES
4.1 Functional and presentation currency
These financial statements have been presented in Pak Rupees which is the Company's functional and presentation currency.
4.2 Significant accounting judgments and estimates
The preparation of financial statements in conformity with approved accounting standards requires the use of certain critical accounting estimates. It also requires management to exercise its judgment in the process of applying the Company's accounting policies. Estimates and judgments are continually evaluated and are based on historic experience and other factors, including expectations of future events that are believed to be reasonable under the circumstances. Revisions to accounting estimates are recognized in the period in which the estimate is revised and in future periods affected.
In the process of applying the Company's accounting policies, management has made the following estimates and judgments, which are significant to the financial statements:
4.2.1
4.2.2
Property and equipment and intangible assets
The Company reviews the appropriateness of the rate of depreciation, useful lives and residual values used in the calculation of depreciation/ amortization on an annual basis. Any change in estimates in the future years might affect the carrying amounts of the respective items of property and equipment and intangible assets, with a corresponding effect on the depreciation and amortization charge.
Employee benefits
Certain actuarial assumptions have been adopted for valuation of present value of defined benefit obligations. Changes in these assumptions in future years may affect the liability under these schemes in those years~

6 Universal Service Fund
4.2.3 Provision for doubtful advances, project and other receivables
The Company has used judgments, based on the history of its transactions and the future outlook of the concerned receivable party, for making provisions for doubtful advances, project receivables and other receivables. Any change in estimates in future years might affect the carrying amounts of the respective assets with a corresponding affect on income and expenditure account. Management believes that the changes in the outcome of these estimates will not have a significant effect on the financial statements.
4.2.4 Taxation
In making the estimate for income tax payable by the Company, the Company takes into account the applicable tax laws, and decisions taken by the taxation authorities. In instances where the Company's views differ from the views taken by the income tax department at the assessment stage, and where the Company considers that its views on items of a material nature are in accordance with the law, the related amounts are disclosed as contingent liabilities.
4.2.5 Provisions and contingencies
A provision is recognized if, as a result of a past event, the Company has a present legal or constructive obligation that can be estimated reliably, and it is probable that an outflow of economic benefits will be required to settle the obligation. Provisions are determined by discounting the expected future cash flows at a pre-tax rate that reflects current market assessments of the time value of money and the risks specific to the liability. The unwinding of the discount is recognized as a finance cost, if any.
Where it is not probable that an outflow of resources embodying economic benefits will be required to settle the obligation or the amount of the obligation cannot be measured with sufficient reliability, it is disclosed as contingent liability.
4.3 Amendments to approved accounting standards that are not yet effective
The following amendments with respect to the approved accounting standards, as applicable in Pakistan, would be effective from the dates mentioned below against the respective standard and have not been adopted early by the Company:
Standard
I FRS 2 Classification and Measurement of Share-based Payment Transactions (Amendment)
IFRS 10 Consolidated Financial Statements, IFRS 12; Disclosure of Interests in Other Entities and lAS 27 Separate Financial Statements Investment Entities:
Effective date (annual periods beginning on or after)
01 January, 2018
Applying the Consolidation Exception (Amendment) Not yet finalized
IFRS 10 Consolidated Financial Statements and lAS 28 Investment in Associates and Joint Ventures Sale or Contribution of Assets between an Investor and its Associate or Joint Venture (Amendment)
I FRS 11 Joint Arrangements Accounting for Acquisition of Interest in Joint Operation (Amendment)
lAS 1
lAS 7
Presentation of Financial Statements Disclosure Initiative (Amendment)
Statement of Cash Flows (Amendments) Disclosure initiative
lAS 12 Income Taxes (amendments) Recognition of Deferred Tax Assets for unrecognized losses
lAS 16 Property, Plant and Equipment and lAS 38 Intangible assets: Clarification of Acceptable Method of Depreciation and Amortization (Amendment)
lAS 16 Property, Plant and Equipment and lAS 41 Agriculture: Bearer Plants (Amendment)
lAS 27 Separate Financial Statements: Equity Method in Separate Financial Statements (Amendment)
01 January, 2016
01 January, 2016
01 January, 2016
01 January, 2017
01 January, 2017
01 January, 2016
01 January, 2016
01 January, 2016
~

I -
-
-
7 Universal Service Fund
The above amendments are not expected to have any material impact on the Company's financial statements in the period of their initial application.
In addition to the above amendments, improvements to various accounting standards (under the Annual Improvements 2012-14 cycle) have also been issued by the IASB. Such improvements are generally effective for accounting periods beginning on or after 01 January, 2016. The Company expects that such improvements to the standards will not have any material impact on the Company's financial statements in the period of initial application.
Further, the following new standards have been issued by the IASB, which are yet to be notified by the SECP for the purpose of applicability in Pakistan:
Standard
IFRS 1 IFRS 9 IFRS 14 IFRS 15 IFRS 16
First-time Adoption of International Financial Reporting Standards Financial Instruments: Classification and Measurement Regulatory Deferral Accounts Revenue from Contracts with Customers Leases
Effective date (annual periods beginning on or after)
01 July, 2009 01 January, 2018 01 January, 2016 01 January, 2018 01 January, 2019
Further, the SECP has also notified the application of an Accounting Standard for Not-For-Profit Organizations, issued by the Institute of Chartered Accountants of Pakistan, for companies licensed under section 42 of the Companies Ordinance, 1984, for the annual financial period beginning on or after 01 July , 2016, The Company is in the process of assessing the implication of adopting this standard.
4.4 Changes in accounting policies and disclosures resulting from adoption of standards during the year
4.5
The accounting policies adopted in the preparation of these financial statements are consistent with those of the previous financial year except as described below:
New Standards
The Company has adopted the following accounting standards, which became effective for the current year:
IFRS 10 IFRS 11 IFRS 12 IFRS 13 IFRS 14 lAS 1 lAS 16 lAS 19 lAS 27 lAS 28
Consolidated Financial Statements Joint Arrangements Disclosure of Interests in Other Entities Fair Value Measurement Regulatory deferral accounts Presentation of financial statements Property, plant and equipment Employs benefits Separate Financial Statements Investments in Associates and Joint Ventures
The adoption of the above accounting standards did not have any effect on the financial statements.
Property and equipment
These are stated at cost less accumulated depreciation and impairment losses (if any). Cost comprises of acquisition cost, non-refundable indirect taxes and any other directly attributable costs.
Depreciation is charged on assets using the straight line method, at the rates stated in note 5. A full month's depreciation is charged in the month of acquisition of an asset, while no depreciation is charged in the month of an assets' retirement.
Useful lives are determined by the management based on the expected usage of an asset, expected physical wear and tear, technical and commercial obsolescence, legal and similar limits on the use of assets and other similar factors.
The assets' residual values, useful lives and methods are reviewed, and adjusted if appropriate, at each financial year end. The effects of adjustments to residual values, useful lives and methods are recognized prospectively as a change in accounting estimates.
An item of property and equipment is derecognized upon disposal or when no future economic benefits are expected from its use or disposal. Any gain or loss arising on derecognition of the assets (calculated as the difference between the net disposal proceeds and the carrying amount of the asset) is included in the income and expenditure account in the year the asset is derecognized.
~

-
-
-
4.6
8 Universal Service Fund
The cost of replacing part of an item of property and equipment is recognized in the carrying amount ·of the item if it is probable that the future economic benefits embodied within the part will flow to the Company and its cost can be measured reliably. The carrying amount of the replaced part is derecognized. The cost of the day-to-day servicing of property and equipment is recognized in the income and expenditure account as incurred.
Intangibles
An intangible asset is recognized if it is probable that future economic benefits that are attributable to the asset will flow to the Company and that cost of such an asset can also be measured reliably.
Intangible assets are measured on initial recognition at cost, being the fair value of the consideration given. Following initial recognition, intangible assets are carried at cost less accumulated amortization and accumulated impairment, if any.
The useful lives of intangible assets are assessed either as finite or indefinite. The Company does not have an intangible asset with indefinite useful life. Intangible assets with finite useful lives are amortized over the period of their useful life, at rate mentioned in note 6. In respect of additions and disposal of intangible assets during a year, amortization is charged to income and expenditure account from the month of acquisition and up to the month preceding the disposal of such intangible assets.
Gains and losses arising from the derecognition of intangible assets are measured as the difference between the net disposal proceeds and carrying amount of the asset, and recognized in income and expenditure account when the asset is derecognized.
Changes in expected useful lives or the expected pattern of consumption of future economic benefits, embodied in intangible assets, are accounted for by changing the useful life or amortization method, as appropriate, and treated as a change in accounting estimate.
4.7 Advances, deposits and other receivables
These are recognized at cost, which is the fair value of the consideration given. However, an assessment is made at each balance sheet date to determine whether there is an indication that a financial asset or group of assets may be impaired. If such an indication exists, the estimated recoverable amount of that asset is determined and any impairment loss is recognized for the difference between the asset's recoverable amount and its carrying value .
4.8 Cash and cash equivalents
Cash and cash equivalents are carried at cost in the balance sheet in case of local currency balances and at closing exchange rate, in case of foreign currency balances.
4.9 Fund balance (restricted)
Amounts received from the MolT are included in the fund balance. Any income earned on these funds is also included in the fund. Expenditure incurred, as reduced by the income earned on these funds, is transferred from the fund balance to the income and expenditure account to match the net expenditure incurred during the year.
4.10 Deferred capital grant
Restricted funds utilized for capital expenditure are transferred from the Fund Balance (restricted) and accounted for as a deferred capital grant. An amount equal to the charge for depreciation and amortization for the year, on fixed assets acquired , is then recognized in the income and expenditure account.
4.11 Trade and other payables
Creditors and other payables are carried at cost which is the fair value of the consideration to be paid in future for goods and services received.
4.12 Provision
Provisions are recognized when the Company has a present legal or constructive obligation, as a result of past events, it is probable that an outflow of resources embodying economic benefits will be required to settle the obligation, and a reliable estimate can be made of the amount of the obligation.
4.13 Staff benefits
i) Defined Contribution Plan
The Company operates a funded gratuity scheme for employees who have completed the mm1mum qualifying period of service to the Company. Provision for gratuity is made to cover obligations under the scheme in accordance with the actuarial recommendations using the Projected Unit Credit Method. The latest actuarial valuation was carried out as at 30 June 2016, details are given in the note 13 of the financial
statements. <.
-
-
-
-
9 Universal Service Fund
ii) Compensated absences
The compensated absences provides a short-term leave encashment benefit to its employees whereby, employees can carry forward upto a maximum of 10 leaves for a year. Employees can either avail these leaves or encash them.
4.14 Taxation
i) Current
Provision for taxation is based on taxable profits, at the current rates of taxation, after taking into account tax credits and tax rebates, if any. Further, the Company's income is not liable for minimum tax, under Section 113 of the Income Tax Ordinance, 2001 , as the Company considers the amount received from the MolT as grant.
No provision for current tax has been recognized in these financial statements, owing to tax losses in current and prior years.
ii) Deferred
Deferred tax is recognized using the liability method, on all major temporary differences at the balance sheet date, between the tax bases of assets and liabilities and their carrying amounts for financial reporting purposes.
Deferred income tax assets are recognized for all deductible temporary differences and carry-forward of unused tax losses, to the extent that it is probable that taxable profit will be available against which the deductible temporary differences and I or carry-forward of unused tax losses can be utilized.
The carrying amount of all deferred tax assets is reviewed at each balance sheet date and reduced to the extent that it is no longer probable that sufficient taxable profits will be available to allow all or part of the deferred tax assets to be utilized.
Deferred income tax assets and liabilities are measured at the tax rates that are expected to apply to the period when the asset is realized or the liability is settled, based on the tax rates (and tax laws) that have been enacted or substantively enacted at the balance sheet date.
4.15 Income
i) Profit on bank deposits
Profit on bank deposit is accrued using the effective interest rate method.
ii) Other income
Any other income is recorded on an accrual basis.
Profit on bank deposits and other receipts are made part of fund balance (restricted) and are adjusted against future funding from MolT.
4.16 Foreign currency translation
Foreign currency transactions during the year are recorded at the exchange rates approximating those ru ling on the date of the transaction . Monetary assets and liabilities in foreign currencies are translated at the rates of exchange which approximate those prevailing on the balance sheet date. Gains and losses on translation are taken to the income and expenditure account. Non-monetary items that are measured in terms of historical cost in a foreign currency are translated using the exchange rates as at the dates of the initial transactions. Nonmonetary items measured at fair value in a foreign currency are translated using the exchange rates at the date when the fair value was determined.
4.17 Financial instruments
All financial assets and financial liabilities are recognized at the time when the Company becomes a party to the contractual provisions of the instrument. All the financial assets are derecognized at the time when the Company loses control of the contractual rights that comprise the financial assets. All financial liabilities are derecognized at the time when they are extinguished that is, when the obligation specified in the contract is discharged, cancelled, or expired. Gains or losses on derecognition of the financial assets and financial liabilities are taken to the income and expenditure account immediately. s
10 Universal Service Fund
(a) Financial assets
Classification, initial recognition and subsequent measurement
The Company classifies its financial assets in the four categories: financial assets at fair value through profit or loss, held-to-maturity investments , loans and receivables and available-for-sale financial assets. The classification depends on the purpose for which the financial assets were acquired. Management determines the classification of its financial assets at initial recognition. Regular purchases and sales of financial assets are recognized on the trade date - the date on which the Company commits to purchase or sell the asset.
(i) Financial assets -at fair value through profit or loss
Financial assets at fair value through profit or loss account include financial assets held-for-trading and financial assets designated upon initial recognition at fair value through profit or loss.
Financial assets are classified as held-for-trading if they are acquired for the purpose of short-term profit making. These are initially measured at fair value. Whereas on subsequent reporting dates, these are measured at fair value on the basis of observable market yields, and any changes in fair value are recognized in the income and expenditure account.
The Company has not designated any financial asset at fair value through profit or loss.
(ii) Held-to-maturity investments
Non-derivative financial assets with fixed or determinable payments and fixed maturities are classified as held-to-maturity when the Company has a positive intention and ability to hold these assets to maturity. These are initially recognized at fair value plus transaction costs. After initial recognition, held· to-maturity investments are subsequently measured at amortized cost using the Effective Interest Rate (EIR) method. Gains and losses are recognized in the income and expenditure account when the investments are derecognized, as well as through the EIR amortization process. Amortized cost is calculated by taking into account any discount or premium on acquisition, and fees or costs that are an integral part of the EIR. The EIR amortization is included in other operating income in the Income and Expenditure account.
No financial asset of the Company has been classified as held-to-maturity.
(iii) Available-for-sale financial assets
Available-for-sale financial assets are non-derivative financial assets, which are either designated in this category, or not classified in any of the other categories. These are included in non-current assets, unless management intends to dispose them off Within 12 months from the balance sheet date.
These are initially recognized at fair value plus any transaction costs. After initial measurement, available-for-sale financial investments are subsequently measured at fa ir value, with unrealized gains or losses recognized as other comprehensive income until the investment is derecognized, at which time the cumulative gain or loss is recognized in other operating income; if determined to be impaired, the cumulative loss is reclassified to the Income and Expenditure account.
The Company has not classified any financial asset as available-for-sale investment.
(iv) Loans and receivables
Loans and receivables are non-derivative financial assets with fixed or determinable payments that are not quoted in an active market. Financial assets, classified as loans and receivables, are initially measured at fair value. At subsequent reporting dates, these are carried at amortized cost using the EIR method less impairment losses, if any. The Company's loans and receivables comprise of deposits, accrued interest, other receivables and cash and bank balances.
Derecognition of financial assets
A financial asset (or, where applicable part of a financial asset or part of a group of similar financial assets) is derecognized when:
·The right to receive cash flows from the asset have expired;
• The Company has transferred its right to receive cash flows from the asset, or has assumed an obligation to pay the received cash flows in full , without material delay to a third party under a 'pass-through' arrangement; and either
(a) the Company has transferred substantially all the risks and rewards of the asset, or (b) the Company has neither transferred nor retained substantially all the risks and rewards of the
asset, but has transferred control of the asset~

.....
11 Universal Service Fund
When the Company has transferred its right to receive cash flows from an asset or has entered into a passthrough arrangement, and has neither transferred nor retained substantially all of the risks and rewards of the asset nor transferred control of the asset, the asset is recognized to the extent of the Company's continuing involvement in the asset.
In that case, the Company also recognizes an associated liability. The transferred asset and the associated liability are measured on a basis that reflects the rights and obligations that the Company has retained. Continuing involvement that takes the form of a guarantee over the transferred asset is measured at the lower of the original carrying amount of the asset and the maximum amount of consideration that the Company could be required to repay.
(b) Financial liabilities
Classification, initial recognition and subsequent measurement
The Company classifies its financial liabilities in the following categories: at fair value through profit or loss and other financial liabilities. The Company determines the classification of its financial liabilities at initial recognition. All financial liabilities are recognized initially at fair value and in the case of other financial liabilities, also include directly attributable transaction costs.
The subsequent measurement of financial liabilities depend on their classification, as follows:
(i) Fair value through profit or Joss
Financial liabilities at fair value through profit or loss include financial liabilities held-for-trading and financial liabilities designated upon initial recognition as being at fair value through profit or loss. The Company has not designated any financial liability, upon recognition, as being at fair value through profit or loss.
(ii) Other financial liabilities
After initial recognition, other financial liabilities which are interest bearing subsequently measured at amortized cost, using the EIR method. Gain and losses are recognized in the income and expenditure account, when the liabilities are derecognized as well as through effective interest rate amortization process.
Derecognition of financial liabilities
A financial liability is derecognized when the obligation under the liability is discharged or cancelled or expired. When an existing financial liability is replaced by another from the same lender on substantially different terms, or the terms of an existing liability are substantially modified, such an exchange or modification is treated as a derecognition of the original liability and the recognition of a new liability, and the difference in the respective carrying amounts is recognized in the income and expenditure account.
4.18 Impairment
i) Financial assets
A financial asset is considered to be impaired if objective evidence indicates that one or more events have had a negative effect on the estimated future cash flows of that asset.
An impairment loss in respect of a financial asset measured at amortized cost, and is calculated as the difference between its carrying amount and the present value of the estimated future cash flows, discounted at the original EIR.
Individually significant financial assets are tested for impairment on an individual basis . The remaining financial assets are assessed collectively in groups that share similar credit risk characteristics. All impairment losses are recognized in the income and expenditure account.
An impairment loss is reversed if the reversal can be related objectively to an event occurring after the impairment loss was recognized. For financial assets measured at amortized cost, the reversal is recognized in the income and expenditure account.
~
12 Universal Service Fund
ii) Non-financial assets
The carrying amounts of the Company's non-financial assets are reviewed at each reporting date to determine whether there is any indication of impairment. If any such indication exists then the asset's recoverable amount is estimated.
An impairment loss is recognized if the carrying amount of an asset or its cash-generating unit exceeds its recoverable amount. A cash-generating unit is the smallest identifiable asset group that generates cash flows that largely are independent from other assets and groups. Impairment losses are recognized in the income and expenditure account. Impairment losses recognized in respect of cash-generating units are allocated first to reduce the carrying amount of any goodwill allocated to the units and then to reduce the carrying amount of the other assets in the unit (group of units) on a pro-rata basis.
The recoverable amount of an asset or cash-generating unit is the greater of its value in use and fair value less cost to sell. In assessing value-in-use, the estimated future cash flows are discounted to their present value using a pre-tax discount rate that reflects current market assessments of the time value of money and the risks specific to the asset.
An impairment loss recognized in the prior periods is assessed at each reporting date for any indications that the loss has decreased or no longer exists. An impairment loss is reversed if there has been a change in the estimates used to determine the recoverable amount. An impairment loss is reversed only to the extent that the asset's carrying amount does not exceed the carrying amount that would have been determined, net of depreciation or amortization, if no impairment loss had been recognized.
4.19 Fair value measurement
Fair value is the price that would be received to sell an asset or paid to transfer a liability in an orderly transaction between market participants at the measurement date. The fair value measurement is based on the presumption that the transaction to sell the asset or transfer the liability takes place either:
In the principal market for the asset or liability; or ii In the absence of a principal market, in the most advantageous market for the asset or liability.
The principal or the most advantageous market must be accessible by the Company. The fa ir value of an asset or a liability is measured using the assumptions that market participants would use when pricing the asset or liability, assuming that market participants act in their economic best interest.
A fair value measurement of a non-financial asset takes into account a market participant's ability to generate economic benefits by using the asset in its highest and best use or by selling it to another market participant that would use the asset in its highest and best use.
The Company uses valuation techniques that are appropriate in the circumstances and for which sufficient data are available to measure fair value, maximizing the use of relevant observable inputs and minimizing the use of unobservable inputs.
All assets and liabilities for which fair value is measured or disclosed in the financial statements are categorized within the fair value hierarchy, described as follows, based on the lowest level input that is significant to the fair value measurement as a whole:
Level 1 - Quoted (unadjusted) market prices in active markets for identical assets or liabilities; ii Level 2 - Valuation techniques for which the lowest level input that is significant to the fair value
measurement is directly or indirectly observable; and iii Level 3 - Valuation techniques for which the lowest level input that is significant to the fair value
measurement is unobservable.
For assets and liabilities that are recognized in the financial statements at fair value on a recurring basis, the Company determines whether transfers have occurred between levels in the hierarchy by re-assessing categorization (based on the lowest level input that is significant to the fair value measurement as a whole) at the end of each reporting period.
The Company's Chief Financial Officer determines the policies and procedures for both recurring fair value measurement and for non-recurring measurement. External valuers may be involved for valuation of significant assets and significant liabilities. For the purpose of fair value disclosures, the Company determines classes of assets and liabilities on the basis of the nature, characteristics and risks of the asset or liability and the level of the fair value hierarchy, as explained above.
The Company does not measure any of its assets or liabilities at fair value, except plan assets for gratuity, under the gratuity scheme.~

1
I J
1
1
)
5
5.1
5.2
6
13
PROPERTY AND EQUIPMENT
COST ACCUMULATED DEPRECIATION As at 01
Additions Disposals As at 30
Rate As at 01 Charge for On As at 30
July June July the year disposals June 2016 ----------------------------- Rupees ----------------------------- % ----------------------------- Rupees -----------------------------
Vehicles 29,704,498 29,704,498 20 18,512,749 4,773,564 23,286,313 Furniture and equipment 32,447,268 812,320 33,259,588 20 10,480,949 6,184,864 16,665,813 Computer and accessories 27,095,584 247,930 27,343,514 33 18,495,840 3,690,715 22,186,555 Communication equipment 799,289 799,289 20-33 647,613 66,320 713,933
90,046,639 1,060,250 91,106,889 48,137,151 14,715,463 62,852,614
Additions during the year represent assets purchased, by the Company, utilizing the grant received by the Company from the MolT.
Depreciation for the year is charged to Administrative and General expenses (refer to note 15).
COST ACCUMULATED DEPRECIATION As at 01
Additions Disposals As at 30
Rate As at 01 Charge for On As at 30
Jul:t June Jul:i the :tear dis~osals June 2015 ----------------------------- Rupees ----------------------------- % ----------------------------- Rupees -----------------------------
Vehicles 29,902,632 1,688,874 (1 ,887,008) 29,704,498 20 14,901,263 4,775,136 (1 '163,650) 18,512,749 Furniture and equipment 24,077,067 8,370,201 32,447,268 20 4,826,657 5,654,292 10,480,949 Computer and accessories 19,412,309 7,781,275 (98,000) 27,095,584 33 16,254,714 2,339,126 (98,000) 18,495,840 Communication equipment 954,789 (155,500) 799,289 20-33 704,903 98,210 (155,500) 647,613
74,346,797 17,840,350 (2 , 140,508) 90,046,639 36,687,537 12,866,764 (1 ,417,150) 48,137,151
INTANGIBLE ASSETS
COST ACCUMULATED AMORTIZATION As at 01
Additions Disposals As at 30
Rate As at 01 Charge for On As at 30
Jul:t June Jul:t the year disposals June 2016 ----------------------------- Rupees ----------------------------- % ----------------------------- Rupees -----------------------------
Digital Maps 7,500,000 7,500,000 25 7,499,990 7,499,990 Software 10,491,993 10,491,993 25 6,354,213 1,458,990 7,813,203
17,991,993 17,991,993 13,854,203 1,458,990 15,313,193
6.1 Amortization for the year is charged to Administrative and General expenses (refer to note 15).
2015
Digital Maps Software
COST As at01 As at 30
Additions Disposals Jul:t June
---------------------------- Rupees -----------------------------
7,500,000 6,114,589
13,614,589
4,377,404
4,377,404
7,500,000 10,491 ,993
17,991,993
Rate
%
25 25
ACCUMULATED AMORTIZATION As at 01 Charge for On As at 30
Jul:t the :tear disposals June ----------------------------- Rupees -----------------------------
7,499,990 6,114,399
13,614,389
239,814
239,814
7,499,990 6,354,213
13,854,203
Universal Service Fund
WRITTEN DOWN As at 30
June Rupees
6,418,185
16,593,775 5,156,959
85,356
28,254,275
WRITTEN DOWN As at 30
June Rupees
11,191 ,749 21 ,966,319
8,599,744 151 ,676
41,909,488
WRITTEN DOWN VALUE As at 30
June Rupees
10
2,678,790
2,678,800
WRITTEN DOWN As at 30
June Rupees
10
4,137,780
4,137,790
)-

14
Note 7 ADVANCES
considered good, secured
To employees To contributory to a USF 7.1
Universal Service Fund
2016 2015 ------------Rupees------------
832,404 144,874,965 145,707,369
564,327
564,327
7.1 This represents unutilized portion of an advance paid to Telenor Pakistan (Private) Limited , in respect of a project in Zhob (refer to note 16).
8 SHORT-TERM PREPAYMENTS
Rent Insurance Others
8.1 14,185,600 130,900
48,268 14,364,768
145,250 40,617
185,867
8.1 This represents advance rent paid to the landlord of the Company's head office, for the period from 01 July, 2016 to 28 March, 2017.
9 OTHER RECEIVABLES
Receivable from USF Tax refund due from Government Gratuity fund Other receivables
10 CASH AND BANK BALANCE
Cash in hand
Cash at bank
Deposit account - local currency
Note
11
13.1
10.1
2016 2015 ------------Rupees------------
128,548 128,548
43,758
3,338,637,296 3,338,681,054
986,845,453 438,735 831 ,664
4,500 988,120,352
2,765
414,398,770 414,401,535
10.1 This carries mark-up at rates ranging between 5.35% to 5.6% per annum (2015: 4.5% to 8.0% per annum).
11
The profit on bank deposit is receivable with reference to the daily balance in the bank account.
FUND BALANCE (RESTRICTED)
Balance at the beginning of the year
Grant received during the year
Profit on deposit account
Gain on disposal of property and equipment
Miscellaneous receipts
Grants transferred to:
Deferred capital grant
Income and expenditure account
Experience adjustment
Transferred from/(to) other receivables
Note
11 .1
11 .1
11.1 & 11 .2
12
9
2016 2015
------------Rupees------------
7,849,300,000
81,235,682
332,899,446
8,263,435,128
1,060,250
4,548,901,950
559,215
4,550,521 ,415
3,712,913,713
(986,845,453)
2,726,068,260
2,272,596,370
115,203,613
144,672
1,195,938,730
3,583,883,385
21,494,396
4,548,888, 771
345,671
4,570,728,838
(986,845,453)
986,845,453
11.1 Profit on bank deposit and other receipts are adjustable against future funding from MolT, Government of Pakistan and accordingly they are included in the fund balance.
11.2 This includes amount of Rs. 332,365,822 (2015: Rs. 1,084,467,746) against liquidated damages recovered from operators/vendors.
<r

12
15
DEFERRED CAPITAL GRANT
Balance at beginning of the year
Transferred from fund balance (restricted)
Depreciation I amortization charged during the year Balance at end of the year
Note
11
12.1
Universal Service Fund
2016 2015
------------Rupees------------
46,047,278
1,060,250
(16,174,453) 30,933,075
37,659,460
21 ,494,396
(13,106,578) 46,047,278
12.1 As at the report date, the Company has utilized Rs.116. 70 million (2015: Rs.115.64 million) out of grant received for capital expenditure.
13 TRADE AND OTHER PAY ABLES
Project subsidy payable
Technical auditor fee payable
Payable to suppliers
Accrued liabilities Payable to gratuity fund
Earnest money
13.1 Debit balance is shown under Other Receivables.
13.2 The movement in net liability is as follows:
Balance at beginning of the year
Charge for the year
Remeasurement gain
Contribution
Balance at end of the year- (payable) I receivable
Note
13.1 & 13.2
2016 2015
------------Rupees------------
741,299,016 1 ,412, 100,622
3,019,882 4,759,421
5,743,295 15,497,896
2,335,885 1,465,483 2,811,474
72,954,663 577,176
828,164,215 1,434,400,598
2016 2015
------------Rupees------------
(831 ,664)
9,012,114
(559,215)
(4,809, 761)
2,811,474
5,793,627
9,373,994
(345,671)
(1 5,653,614)
(831 ,664)
13.3 The details of actuarial valuation carried out as at 30 June, 2016 and 2015 are as follows:
13.3.1 Reconciliation of payable to Defined Benefit Plan
Present value of the defined benefit obligation
Fair value of the plan assets
13.3.2 Change in the present value of defined benefit obligation
Opening balance
Current service cost
Interest cost on defined benefit obligation
Benefits paid
Actuarial loss
13.3.3 Charge for the year is as follows:
Current service cost
Interest expense
Interest income on plan assets Interest income - net
Note
13.3.2
13.3.5
13.3.3
13.3.3
2016 2015
------------Rupees--·····-----
47,779,970
(44,968,496)
2,811,474
38,771,756
9,327,677
3,702,842
(1,587,786)
(2,434,519)
47,779,970
9,327,677
3,702,842
(4,018,405)
(315,563)
9,012,114
38,771,756
~39,603,420)
(831 ,664)
32,245,569
9,738,644
3,949,449
(4,876,819)
(2 ,285,087)
38,771,756
9,738,644
3,949,449
(4,314,099)
(364,650)
9,373,994

16 Universal Service Fund
2016 2015 13.3.4 Remeasurement gain - net is as follows : Note ------------Rupees------------
Actuarial (gain) /loss recognized
Return on plan assets, excluding the amount
included in interest income
13.3.5 Change in fair value of plan assets
(2,434,519)
1,875,304
(559,215)
Opening balance 39,603,420
Interest income 4,018,405
Contribution made directly to Fund 3,221,975
Payments made on behalf of the Fund 1,587,786
Benefits paid (1 ,587,786)
Return on plan assets, excluding the amount included in interest incomE __ .l...(1...:.,8.;..;7:....5...:.,3.;..;0:....4..L-) 44,968,496
Major categories of the plan assets as a percentage of total plan assets are as follows:
Cash and other deposits
30 June, 2016
30 June, 2015
13.3.6 The principal actuarial assumptions used were as follows:
Rupees
44,968,496
39,603,420
(2 ,285,087)
1,939,416
(345,671)
27,889,732
4,314,099
8,837,379
6,816,235
(6,314,609)
(1,939,416) 39,603,420
%
100
100
Actuarial valuation of the plan was carried out as at 30 June, 2016, by an independent valuer using Projected Unit Credit Method, on following assumptions:
Valuation discount rate Salary increase used for year end obligation
Salary Increase FY 2016
Salary Increase FY 2017
Salary Increase FY 2018
Salary Increase FY 2019
Salary Increase FY 2020
Salary Increase FY 2021 onwards
Expected return on plan assets Next salary is increased on Mortality rates
Withdrawal rates
Retirement assumption
13.3.7 Estimated expenses to be charged to income and expenditure in
Current service cost Net Interest
2016 9.00%
N/A
8.00%
8.00%
8.00%
8.00%
8.00% 8.00% 9.00%
1-Jul-1 6 SLIC 2001-2005 Setback 1 ~ear
Age-Based {Qer aQQendix)
Age60
Financial Year 2017
9,327,677 (31 5,563!
9,012,114
2015 9.75%
N/A
8.75%
8.75%
8.75 %
8.75%
8.75 % 8.75 % 9.75%
1-Jul-15 sue 2001-2oo5 Setback 1 1:ear
Age-Based ((2er a(2(2endix}
Age60
Financial Year 2016
9,327,677 ~375,882~
8,951,795
13.4 For a change of 1 00 basis points in these assumptions, keeping other present value of defined benefit obligation as at 30 June, 2016 would have been as follows:
Discount rate
Salary increase rate
2016 2015 Present value of obligation Present value of obligation
1 % Increase 1 % decrease 1 % Increase 1 % decrease
---------------------------------Rupees' ---------------------------------
43,023,855
53,262,764
53,182,689
42,738,704
35,699,466
42,525,297
42,331,129
35,482,571

17 Universal Service Fund
2016 2015 The average duration of the defined benefit obligation is 9 Years 9 Years
13.5 Historical information 2016 2015 2014 2013
Net staff retirement benefit liability
Experience adjustment
2,811,474 (559,215)
Rupees
(831 ,664)
(345,671)
5,793,627 (306,098)
147,343 884,265
13.6 Expected maturity profile
Following is the expected distribution and timing of benefit payments at reporting date;
2016 2015 ------------Rupees------------
Year1
Year2
Year 3
Year4
Year5 Year 6 to Year 10
Year 11 and above
6,552,710 3,841,496 3,796,259 3,430,894 3,238,287
18,706,483 623,361,834
7,832,230
5,354,349
5,168,676
5,021,429
4,981,488 28,048,903
449,784,065
13.7 Risks associated with defined benefit plans
14
Investment risks:
The risk arises when the actual performance of the investments is lower than expectation and thus creating a shortfall in the funding objectives.
Longevity Rrisks:
The risk arises when the actual lifetime of retirees is longer than expectation. This risk is measured at the plan level over the entire retiree population.
Salary increase risk:
The most common type of retirement benefit is one where the benefit is linked with final salary. The risk arises when the accrual increases are higher than expectation and impacts the liability accordingly.
Withdrawal risk:
The risk of actual withdrawals varying with the actuarial assumptions can impose a risk to the benefit obligation. The movement of the liability can go either way.
CONTINGENCIES AND COMMITMENTS 2016 2015
Note -------------- Rupees --------------14.1 Commitments
Subsidy grant disbursements
Technical auditors
16
17
15,538,512,341 9,149,386,886
28,887,379 28,787,666

18 Universal Service Fund
14.2 Contingencies
15
During FY 2013-14, the Additional Commissioner Inland Revenue (ACIR) raised a demand in respect of tax years 2008 to 2013, amounting to Rs. 3,939,571 ,607, by treating the grant received from MolT as taxable income, after giving benefit for the Company's Administrative and General expenses. The Company filed appeals against th is demand, with the Commissioner Inland Revenue Appeals [CIR(A)], for re-examining of facts for disallowing subsidy grant for projects and fee for technical auditors. The Company has filed appeals with the Appellate Tribunal Inland Revenue (ATIR) against the ACIR's refusal to treat the Company as a welfare organization. The decision of the ATIR is pending.
Management, based upon the advice of its tax advisors, is confident of a favorable outcome of the above cases. Accordingly, no provision in this regard has been recognized.
In respect of the Tax Year 2013, the taxation officer raised a demand of Rs.139,511,568, under section 161/205 of the Income Tax Ordinance 2001 , alleging short payment of withholding tax. On an appeal filed by the Company, the CIR(A) set-aside the order and directed the CIR to re-examine the matter, which is pending.
ADMINISTRATIVE AND GENERAL EXPENSES
Salaries and benefits
Legal and professional charges
Rent
Utilities and office supplies
Communication charges
Entertainment
Traveling
Printing and stationery
Vehicle fuel expenses
Repairs and maintenance
Advertisement
Depreciation
Amortization of intangible asset
Auditors' remuneration
Insurance expense
Bank charges
Income tax refund written-off
Note
15.1
5 6
15.2
2016 2015
------------Rupees------------
164,301,590 155,389,057
7,388,037 4,355,111
21,278,400 19,988,800
2,613,398 3,723,953
949,006 1,268,446
679,734 667,733
8,322,182 10,440,883
1,431,657 1,066,136
5,508,593 7,812,966
7,527,658 2,762,116
4,674,189 3,100,560
14,715,463 12,866,764
1,458,990 239,814
400,000 285,000
1,558,427 1,489,692
20,318 20,323
604,223 243,431,865 225,477,354
15.1 Salaries and benefits include Rs. 9,012,114 (2015: Rs. 9,373,994) charged in respect of staff retirement gratuity.
15.2 Auditor's remuneration
EY Ford Rhodes Audit of statutory financial statements
Review of interim financial information Statement of Compliance with the Public Sector
Companies (Corporate Governance) Rules, 2013
KPMG Taseer Hadi & Co.
Audit of statutory financial statements
Review of interim financial information
2016 2015 ------------Rupees------------
215,000
85,000
100,000
400,000
200,000
85,000 285,000

J 19 Universal Service Fund
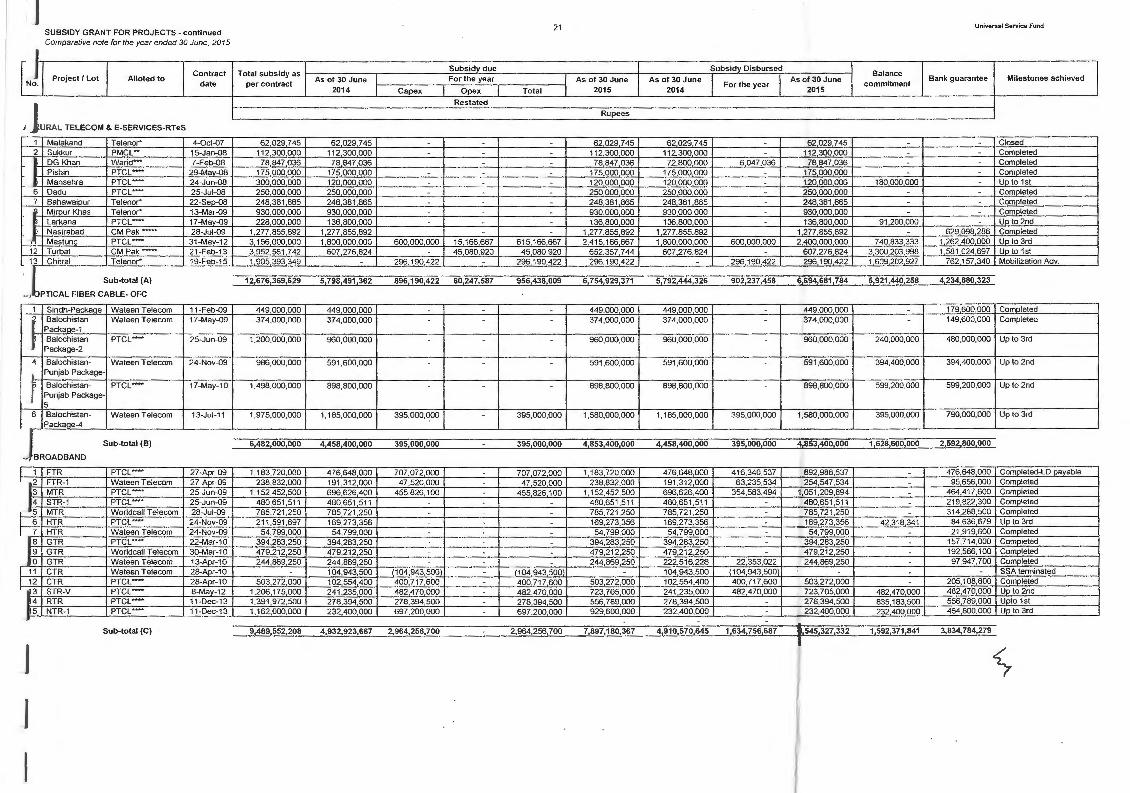
16 SUBSIDY GRANT FOR PROJECTS
Sr. Contract Total subsidy as Subsidydue _I Subsidy_ disbursed Balance
Project/ Lot Allotted to As of 30 June For the year As of 30 June As of 30 June As of 30 June Bank guarantee Milestones achieved No. date per contract For the year commitment
2015 Capex Opex Total 2016 2015 2016 Rupees
A) RURAL TELECOM & E·SERVICES-RTeS
1 Malakand Telenor'" 4-0ct-07 62 029.745 62 029.745 62 029 745 62 029 745 62 029.745 Closed 2 Sukkur PMCL .. 15-Jan-08 112.300 000 112 300.000 . 112 300 000 112.300 000 11 2 300 000 Completed 3 DG Khan Warid- 7-Feb-08 78 847 036 78 847 036 78 847 036 78 847 036 78 847 036 . Comoleted 4 Pishin PTCL .... 2fl..Mayc08 175 000 000 175 000,000 . . 175 000 000 175 000,000 175000,000 Comoleted 5 Mansehra PTCL 24-Jun-08 40 548,153 120 000 000 (79 451 847 (79 451,847 40 548 153 120 000 000 (79 451 847 40 548 153 . Descoped Closed 6 Dadu PTCL 25-Jul-08 250 000 000 250 000 000 . 250 000 000 250 000 000 250 000 000 Completed 7 Bahawalpur Telenor• 22-Sep-08 248 381 865 248 381 865 . 248 381,865 248 381 865 248 381 865 Completed 8 Mirpur Khas Telenor• 13-Mar-09 930 000,000 930 000 000 . 930 000 000 930 000 000 930 000 000 Completed 9 Larkana Prcv-· 17-May.09 228 000 000 136 800 000 136 BOO 000 136,800 000 136 800 000 91 200,000 Up to 2nd
10 Nasirabad CM Pak•-- 2fl..Jul-09 1.277 855 ,892 1 277 855 892 . 1 277 855 892 1 277 855 892 1 277 855 892 . 629,098 286 Completed .... 11 Mas tung PTCL- 31-May-12 3,155 516 334 2,415 166,667 30 860 779 30 860 779 2 446 027 446 2,400 ,000 000 43,391 334 2 443 391 334 709 488 888 1 262,400 000 UR to 3rd & Qpex
12 Turbat CM Pak ..... 21-Feb-13 3.952 561 742 652 357 744 303 638 412 383 187 820 686 826,232 1 339 183 976 607 276 824 303 638 412 910 915,236 2 613 377 766 1 581 024 697 UP to 2nd 13 Chitral Telenor• 19-Feb-15 1,905 393 349 296 190 422 592 380 844 14,203 742 606 ,584 586 902 775 008 296 190 422 296 190,422 592 380 844 1 002 618 341 762 157 340 Uoto 2nd 14 Shanala Telenor"' 15-Jun-15 1 950 000 000 . 327 718 197 . 327,718 197 327.718 197 327 718 197 327 718 197 1 622 281 803 780 000 000 Mobilization Adv.
I 15 Zhob Telenor· 7-Aua-15 3,614 575,335 543 281 118 . 543 281 118 543 ,281 118 688 156 083 688 156,083 3 071 294 217 1 445 953 618 Mobilization Adv.
I 16 Sibi PTML- 14-Sep-15 3 195 107 745 . 571 437 001 . 571 437 001 571 437 00 1 571437001 571 437 001 2 623 670 744 1 278 100 000 Mobilization Adv. 17 Kalal PTML 16-Dec-15 2,184 483 291 425 000 000 . 425 000 000 425 000 000 425,000 000 425 000 000 1 759 483,291 873,800 000 Mobilization Adv.
J Sub-total (A) 23,360,600,487 6,754,929,371 2,684,003,725 428,252,341 3,112,256,066 9,867,185,437 6,694,681,784 2,576,079,602 9,270,761,386 13,493,415,050 8,612,533,941
B) OPTICAL FIBER CABLE· OFC
J 1 Sindh-Packaae Waleen Telecom 11-Feb-09 449 000 000 449 000 000 449 000 000 449,000,000 449 000 000 . 179 600 000 Completed 2 Balochislan Wateen Telecom 17-May-09 374 ,000,000 374 ,000,000 374,000,000 374,000,000 374 ,000,000 . 149,600,000 Completed
Package-1 3 Balochislan PTCL .... 25-Jun-09 1,200,000,000 960,000,000 960,000,000 960,000,000 960,000,000 240,000,000 480,000,000 Up to 3rd
J Packaae-2
4 Balochistan- Wateen Telecom 24-Nov-09 986,000,000 591,600,000 . 591,600,000 591,600,000 591,600,000 394,400,000 394,400,000 Up to 2nd Punjab Package. 3
5 Balochistan- PTCL••- 17-May-10 1,498,000,000 898,800,000 898,800,000 898,800,000 898,800,000 599,200,000 599,200,000 Up to 2nd Punjab Package· 5
6 Balochistan- Wateen Telecom 13-Jul-11 1,965,000,000 1,580,000,000 385,000,000 385,000,000 1 ,965,000,000 1,580,000,000 385,000,000 1,965,000,000 . 790 ,000,000 Completed Package-4 J
Sub-total (B) 6,472,000,000 4,853,400,000 385,000,000 385,000,000 5,238,400,000 4,853,400,000 385,000,000 5,238,400,000 1,233,600,000 2,592,800,000
1 C)BROADBAND
1 FTR PTCL··- 27-Apr-09 1 183 720 000 1 183 720 000 . . 1 183 720 000 892 988 537 290,731 463 1 183 720 000 476 648 000 Completed 2 FTR- 1 Wateen Telecom 27-Apr-09 238,832 000 238 832 000 238 832 000 254 547 534 (15 715 534 238,832 000 95 656 000 Completed 3 MTR PTCL• 25-Jun-09 1152 452 500 1 152 452 500 1 152 452 500 1 051 209 894 101 242 606 1 152 452 500 . 464 417 600 Completed 4 STR-1 PTCL .... 25-Jun-09 480 651 511 480 651 511 . 480 651 511 480 651,511 480 651 511 219 822 300 Completed 5 MTR Worldcall Telecom 2fl..Jul-09 785 721 250 785 721 250 . . 785 721 250 785 721 250 . 785 721 250 314 288 500 Completed 6 HTR PTCL .... 24-Nov..Q9 211 591 697 169 273 356 169 273 356 169 273,356 169 273 356 42 318 341 84 636 679 Up to 3rd 7 HTR Wateen Telecom 24-Nov..Q9 54 799000 54 799 000 . . . 54 799 000 54 799 000 54 799,000 21 919 600 Completed J 8 GTR PTCL··- 22-Mar-10 394 283 250 394 283 250 . . . 394 283 250 394 283,250 394 283,250 . 157 714 000 Completed 9 GTR Worldcall Telecom 3G-Mar-10 479 212 250 479 212 250 . . 479 212 250 479 212 250 479 212 .250 192 566 100 Completed
10 GTR Wateen Telecom 13-Apr-10 244 869 250 244 869 250 . . 244 869 250 244 869 250 244 869 250 . 97 947 700 Completed 11 CTR Wateen Telecom 2fl..Apr-10 . . . . . . SSA terminated 12 CTR PTCL .... 2fl..Apr-10 503 272 000 503 272 000 . 503 272 000 503 272 000 503 272,000 . 205 108 800 Comoleted 13 STR-V PTCL• 8-Mav-12 1,206175 000 723 705 000 . 723 705 000 723 705 000 723 705,000 482 470 000 482 470 000 Up to 2nd 1 14 RTR PTCL- 11-Dec-13 1,391 972 500 556 789 000 556 789 000 . 556 789 000 1 113 578 000 278,394.500 835 183 500 1 113 578 000 278,394 500 556 789 000 Up to 3rd 15 NTR-1 Prcv·- 11-Dec-13 1,162 000 000 929 600,000 232,400 000 . 232 400 000 1 162 000 000 232,400,000 929 600000 1 162 000 000 464800000 Completed
1 Sub-total (C) 9,489,552,208 7,897,180,367 789,189,000 789,189,000 8,686,369,367 6,545,327,332 2,141,042,035 8,686,369,367 803,182,841 3,834,784,279

l
Sr. No.
Allotted to
D) SPECIAL PROJECTS- TELECENTERS
1 Broadband NAY A TEL-Mera Baghwal Broadband for MCT
Mera Bhaqwal 2 Broadband PTCL- Broadband
Pilot MGT Sites for Pilot MGT Sites 3 Broadband World Call-
Pilot MGT Sites Broadband for Pilot MGT Sites
Contract date
15-Mar-10
16-Mar-10
31-Mar- 10
J Sub-total (D)
E) SPECIAL PROJECTS-OTHER ICT SERVICES
1 Rawalpindi I Alshifa Trust- ICT 8-Jul-08 Sukkur I Kohat for Disabled- Up
gradation I Establishment of Computerized Low Vision rehabilitation centre
2 Rawalpindi Pakistan 15-Sep-08 /Islamabad Foundation Fighting
Blindness-PFFB -ICT for Disabled- Up gradation of Audio World & Access Internet Cafe( I.T Help & Audio World Programmes)
3 Rawalpindi I Ora tier 14-0ct-11 Karachi I Multan Technologies Pvt
Ltd - Telemedicine Pro·ect
4 Petaro Cadet College 2-Apr-11 Petaro- Model ICT Labs
5 Educational Establishment of 13 5-Nov-15 Institutions , Bait Computer labs in ul Mall , Sweet Selected Institutions-Homes Analytical Solutions
Pvt Ltd
J Sub-total (E)
J Total (A+B+C+D+E)
• Telenor Pakistan (Private) Umited (Telenor) - Pakistan Mobile Communications Umited (PMCL)
- Warid Telecom (Private) Umited (Wand)
20 Universal Service Fund
Total subsidy as l--o--c~,--,---,---------'i'=:::;.::"-'='---------,---,--..,..,--=-cc--+--,--..,..,--:-c----F==L.::==::.=;::_-,-A_s_o""'f""'370-J,..u-n-e-+---=--.,....----l,----------1 Milestones achieved per contract
2016 Bank guarantee
9,210,918 9.210.918 - 9,210 ,918 9.210,918 9,210,918 Completed
34,873,934 27,899,147 - 27,899,147 27 ,899,147 27,899,147 6,974,787 Up to 3rd
5,944,157 5,944 ,157 - 5,944,157 5,944,157 5,944 ,157 Completed
50 029 009 43 054 222 43 054 222 43 054 222 43 054 222 6 974 787
24,716,660 24 .716,660 - 24,716,660 24,7 16,660 24 ,716,660 Completed
6,494,118 6,494 ,118 - 6,494,118 6,494,1 18 6,494 ,11 8 - - Completed
59,657 ,213 59 ,657 ,213 - 59 ,657 ,213 59,657,213 59,657 ,21 3 Completed
23,690,883 23,690,883 - - 23,690,883 23,690,883 23,690.883 - Completed
26,793,250 25,453,587 25,453,587 25,453,587 25,453,587 25,453,587 1,339,663 2,679,325 Upto 3rd
141,352,124 114,558,874 25,453,587 25,453,587 140,012,461 114,558,874 25,453,587 140,012,461 1,339,663 2,679,325
39,513,533,828 19,663,122,834 3 883,646,312 428 252,341 4,311 898 653 23,975,021,487 18,251,022,212 5,127,575,224 23 378,597,436 15,538,512,341 15,042,797,545
-- Pakistan Telecommunication Company Umited (PTCL) (a related party) - CM Pak Umited (a related party) ·-- Pakistan Telecomm Mobile Umited (PTML Ufone)
J
1 SUBSIDY GRANT FOR PROJECTS - continued Comparative note for the year ended 30 June, 2015
I
GJ 1 Project/ Lot I I Contract Alloted to
date
I JURAL TELECOM & E-SERVICES-RTeS
1 Malakand Telenor• 4-0ct-07 2 Sukkur PMCL- 15-Jan-08 I DG Khan Warid- 7-Feb-08 I Pi shin PTCL 29-May-08 J Mansehra PTCL 24-Jun-08 6 Dadu PTCL-- 25-Jul-08 7 Bahawalpur Telenor· 22-Sep-(8
il Mirpur Khas Telenor• 13-Mar-09 IJ Larkana PTCL 17-May-09 IJ Nasirabad CMPak -- 28-Jul-09
.'I Mast una PTCL -- 31-Mav-12 12 Turbat CMPak-- 21 -Feb-13 13 Chitral Telenor• 19-Feb-15
.ll Sub-total (A)
-, PTICAL FIBER CABLE- OFC
1 Sindh-Packaae Wateen Telecom 11-Feb-09
r Balochistan Wateen Telecom 17-May-09 Package-1
J Balochistan PTCL 25-Jun-09 Package-2
4 Balochistan- Wateen Telecom 24-Nov-09
I Punjab Package-
~r Balochistan- PTCL - · 17-May-10
Punjab Package-5 I 6 Balochistan- Wateen Telecom 13-Jul-11 Packaae-4
J BROADBAND
Sub-total (B)
I 1 FTR PTCL-- 27-Apr-09 , 2 FTR-1 Wateen Telecom 27-Apr-09 L3 MTR PTCL-- 25-Jun-09 14 STR- 1 PTCL 25-Jun-09
J 5 MTR Worldcall Telecom 28-Jul-09
I 6 HTR PTCL*- 24-Nov-09
I L~ HTR Wateen Telecom 24-Nov-09 GTR PTCL-* 22-Mar-10
9 GTR Worldcall Telecom 30-Mar-10 JO GTR Wateen Telecom 13-Apr-10
I 11 CTR Wateen Telecom 28-Apr-10 I 12 CTR PTCL 28-Apr-10 ~3 STR-V PTCL 8-Mav-12 ~ 4 RTR PTCL_. 11-Dec-1 3 ~5 NTR-1 PTCL 11-Dec-13 ..
Sub-total (C)
J
J
Total subsidy as i Subsidy due
As of 30 June I For the year per contract
2014 I Capex I Opex I Restated
62 029 745 62 029 745 -112 300000 112 300 000 -78 847 036 78 847 036 -
175 000000 175 000 000 -300 000 000 120 000 000 -250 000 000 250 000 000 -248 381 865 248 381 865 930 000 000 930 000 000 -228 000 000 136 800 000
1 277 855 892 1 277 855 892 -3156 000 000 1 800 000 000 600 000 000 15 166 667 3 952 561 742 607 276 824 45 080 920 1 905 393 349 296 190422 -
12,676,369,629 5, 798,491 ,362 896,190,422 60,247,587
449 000 000 449 000 000 374,000,000 374,000,000 -
1,200,000,000 960,000,000
986,000,000 591,600,000
1,498,000,000 898,800,000
1,975,000,000 1,185,000,000 395,000,000
6,482,000,000 4,458,400,000 395,000,000 -
1,183,720,000 476,648,000 707,072,000 -238,832,000 191,312,000 47,520,000 -
1,152,452,500 696,626,400 455,826,100 480,651,511 480,651,511 -785,721,250 785,721 ,250 211,591,697 169,273,356
54,799,000 54,799,000 394,283,250 394,283,250 479,212,250 479,212,250 -244,869,250 244,869,250 -
104,943,500 104,943,500 -503,272,000 102,554,400 400,71 7,600
1,206,175,000 241,235,000 482,470,000 1,391,972,500 278,394,500 278,394,500 1,162,000,000 232,400,000 697,200,000
9,489,552,208 4,932,923,667 2,964,256, 700
21 Universal Service Fund
I Subsidy Disbursed I Balance I Bank guarantee I I As of 30 June I As of 30 June I For the year I As of30 June I Milestones achieved commitment
Total I 2015 2014 2015
Rupees
62 029 745 62 029 745 62 029 745 - Closed
- 112 300 000 112 300 000 112 300 000 - - Completed 78 847 036 72 800 000 6 047 036 7B 847 036 Completed
175 000 000 175 000 000 175 000 000 Comoleted 120 000 000 120 000.000 120 000 000 180 000000 Up to 1st 250 000 000 250000 000 - 250 000 000 Completed 248 381 865 248 381,865 248 381 865 Completed 930 000 000 930000 000 930 000 000 - Comoleted 136 800 000 136 800 000 136 800 000 91 200 000 - Up to 2nd
1 277 855 892 , 277 855 892 1 277 855 892 629 098 286 Completed 615 186667 2 415 166 667 1 800 000 000 600 000.000 2 400 000 000 740 833 333 1 262 400 000 Up to 3rd
45 080 920 652 357 744 607 276 824 607 276 824 3 300 203 998 1 581 024 697 Up to 1st 296 190 422 296 190 422 296 190 422 296 190 422 1 609 202 927 762 157 340 Mobilization Adv.
956,438,009 6,754,929,371 5,792,444,326 902,237,458 6,694,681,784 5,921,440,258 4,234,680,323
449 000 000 449 000 000 449 000 000 - 179 600000 Completed 374,000,000 374,000,000 374,000,000 - 149,600,000 Completed
960,000,000 960,000,000 960,000,000 240,000,000 480,000,000 Up to 3rd
- 591,600,000 591,600,000 591,600,000 394,400,000 394,400,000 Up to 2nd
898,800,000 898,800,000 898,800,000 599,200,000 599,200,000 Up to 2nd
395,000,000 1,580,000,000 1,185,000,000 395,000,000 1,580,000,000 395,000,000 790,000,000 Up to 3rd
395,000,000 4,853,400,000 4,458,400,000 395,000,000 4,853,400,000 1 ,628,600,000 2,592,800,000
707 072 000 1,183,720,000 476,648,000 416,340,537 892,988,537 476,648,000 Completed-LD payable
47 520 000 238,832,000 191,312,000 63,235,534 254,547,534 95,656,000 Completed
455 826 100 1,152,452,500 696,626,400 354,583,494 1 051,209,894 - 464,417,600 Completed 480,651,511 480,651,511 - 480,651,511 - 219,822,300 Completed
- 785,721,250 785,721,250 785,721,250 314,288,500 Completed 169,273,356 169,273,356 169,273,356 42318341 84,636,679 Up_ to 3rd
54,799,000 54,799,000 54,799,000 - 21,919,600 Completed 394,283,250 394,283,250 394,283,250 157,714,000 Completed
- 479,212,250 479,212,250 479,212,250 192,566,100 Completed 244,869,250 222,516,228 22,353,022 244,869,250 - 97,947,700 Completed
104 943 500 - 104,943,500 (104,943,500 - SSA terminated
400 717 600 503,272,000 102,554,400 400,717,600 503,272,000 - 205,1 08,800 Completed
482 470 000 723,705,000 241 ,235,000 482,470,000 723,705,000 482 470 000 482,470,000 Up to 2nd
278 394 500 556,789,000 278,394,500 278,394,500 835 183 500 556,789,000 Upto 1st 697 200 000 929,600,000 232,400,000 232,400,000 232 400 000 464,800,000 Up to 3rd
2,964,256,700 7,897,180,367 4,910,570,645 1,634,756,687 6,545,327,332 1,592,371,841 3,834, 784,279

J
1 ,J sr.l I No.
Project I Lot I Alloted to
1) SPECIAL PROJECTS- TELECENTERS
1 Broadband NAY A TEL-Mera Baghwal Broadband for MCT
Mera Bhagwal 2 Broadband PTCL- Broadband
Pilot MCT Sites for Pilot MCT Sites 3 Broadband World Call-
Pilot MCT Sites Broadband for Pilot MCT Sites
Sub-total (D)
I Contract
date
15-Mar-10
16-Mar-10
31-Mar-10
E) SPECIAL PROJECTS-OTHER ICT SERVICES
1 Rawalpindi I Alshifa Trust- ICT 8-Jul-08 Sukkur I Kohat for Disabled- Up
gradation I Establishment of Computerized Low Vision rehabi litation centre
2 Rawalpindi I Pakistan 15-Sep-08 Islamabad Foundation Fighting
Blindness-PFFB . ICT for Disabled-Up gradation of Audio World & Access lntemet Cafe( I.T Help & Audio World Programmes)
3 Rawalpindi I Oratier 14-0ct-11 Karachi/Mullan Technologies Pvt
Ltd- Telemedicine Pro·ect
4 Petaro Cadet College 2-Apr-11 Petaro- Model ICT Labs
Sub-total (E)
Total (A+B+C+D+E)
• Telenor Pakistan (Private) Umited (Telenor) .. Pakistan Mobile Communications Umited (PMCL)
... Warid Telecom (Private) Umited (Warid)
Total subsidy as 1
1 per contract
9.210,918
34,873,934
5,944,157
50 029 009
24,716,660
6,494,118
59,657,213
23,690,883
114,558,874
28,812,509,720
- Pakistan Telecommunication Company Umited (PTCL) (a related party) - CM Pak Umiled (a related party)
1
II
22
0
As of 30 June 11--------,--F_o_r.,.th_e__,_y_ea_r--.------ll As of 30 June 2014 I Capex I Opex I Total I 2015
Rupees
9,210,918 9,210,918
27,899,147 27,899,147
5,944.157 5,944,157
43 054 222 43 054 222
24,716,660 24,716,660
6,494,118 . 6,494,118
59,657,213 . 59,657,213
23,690,883 23,690,883 .
114,558,87 4 114,558,874
15,347,428,125 4,255,447,122 60,247,587 4,315,694,709 19,663,122,834
I
I As of 30 June 2014
9,210,918
27,899,147
5.944,157
43 054 222
24,716,660
6,494,118
59.657,213
23,690,883
114,558,874
15,319,028,067
Subsidy Disbursed
I For the year I
2,931,994,145
I As of 30 June I
2015
9,210,918
27,899,147
5,944,157
43 054 222
24,716,660
6,494,118
59,657,213
23,690,883
114,558,87 4
18,251,022,212
Balance commitment
6,974,787
6 974 787
9,149,386,886
Universal Service Fund
I Bank guarantee Milestones achieved I
Completed
Up to 3rd
Completed
Completed
. Completed
Completed
Completed
10,662,264,602

J 17 FEE TO TECHNICAL AUDITORS FOR PROJECTS
1 I ~:·. 1 Project/ Lot I Allotted to I Contract date
A) RURAL TELECOM & E-SERVICES-RTeS
1 Malakand Telecom Services • 02-Aug-08
2 OG Khan Telecom Services· 01-Jan-09 3 Sukkur Optiwave ** 01 -Jan-09 4 Bahawalpur Telecom Services* 26-Mar-09
1 5 Oadu Myson Engineering 15-Apr-09 6 Pishin Mvson Engineering 15-Ajlr-09 7 Mansehra Optiwave ** 09-0ec-09
8 MirpurKhas Telecom Services* 30-0ec-09 9 Nasirabad Technology at Work 08-Feb-10
10 Turbat Technology at Work 21-Mav-14 11 Mastung Komkonsult **** 23-M8}':14 12 Chitral Myson Engineering 03-Nov-15 13
Sub-total (A)
1 B) OPTICAL FIBER CABLE- OFC
1 Sindh-Package Technology at Work 29-Sep-09
J 2 Ba.lochistan Technology at Work 17-Mar-10
Package-1 3 Balochistan ShaukatHayatJaved 21-May-10
Package-2
1 4 Balochistan- Teralight Limited 27-Sep-10 Punjab Package-3
1
5 Balochistan- TEACH*** 19-May-11 Punjab Package-S
6 Balochistan- TEACH*** 28-0ct-13 Puniab Package-4
7 Balochistan- TEACH*** 16-Apr-14
J Punjab Package-3
Sub-total (B)
j
23
Total cost as I Technical audit fee due I Technical audit fee disbursed I Balance
I As of 30 June I F th I As of 30 June I As of 30 June I F th I As of 30 June I commitment per contract 2015
or e year 2016 2015
or e year 2016
Rupees
5.000.000 5.000,000 - 5,000,000 5,000,000 - 5,000,000 -
12,594,400 12,594,400 - 12,594,400 12,594,400 I - 12,594,400 -11 ,327 ,700 11,327,700 - 11,327,700 11,327,700 - 11 ,327,700 -8.975,000 8,975,000 - 8,975,000 8,975,000 - 8,975,000 -6,400,000 6,400,000 - 6,400,000 6,400,000 - 6,400,000 -6,700,000 6,700,000 - 6,700,000 6,700,000 - 6,700,000 -5.264,040 5,264,040 - 5,264,040 5,264,040 - 5,264,040 -
3,375,000 3,375,000 - 3,375,000 3,375,000 - 3,375,000 -7,809,678 7,809,678 - 7.809,678 7,809,678 - 7,809,678 -
6,916,952 1,383,390 1,383,390 2,766,780 1,383,390 1 383,390 2,766,780 4,150,172 2,974,21 1 1,784,526 - 1,784,526 1,784,526 1,784,526 1,189,685
10.258,912 - 4,103,564 4,103,564 - 2,051,782 2,051,782 6,155,348 - - - - -
87,595,893 70,613,734 5,486,954 76,100,688 70,613,734 3,435,172 74,048,906 11,495,205
12,002,488 12,002,488 - 12,002,488 12,002,488 - 12,002,488 -
7,226,443 7,226,443 - 7,226,443 7,226,443 - 7,226,443 -
8,601,988 6,245,588 - 6,245,588 6,245,588 - 6,245,588 2,356,400
835,858 835,858 835,858 835,858 835,858 -
2,850,000 1,767,000 - 1,767,000 1,767,000 - 1,767,000 1,083,000
3,952,193 2,687,488 1,264,705 3,952,193 2,687,488 1,264,705 3,952,193 -
8,974,928 2,243,732 - 2,243,732 2,243,732 - 2,243,732 6,731,196
44,443,898 33,008,597 1,264,705 34,273,302 33,008,597 1,264,705 34,273,302 10,170,596
Universal Service Fund
Milestones I achieved
Contract Closed
Completed Com!)leted Completed Completed Completed Up to 2nd,
Contract Closed Completed Upto 4th 5th
50% and Idle days Up to 2nd Up to 3rd Up to 2nd
Completed and Idle days Completed and 21dle davs Up to 3rd, 2 Idle
days/Adl node
Up to 1st, Contract Closed
Up to 2nd, 3rd 50% Completed
Up to 2nd
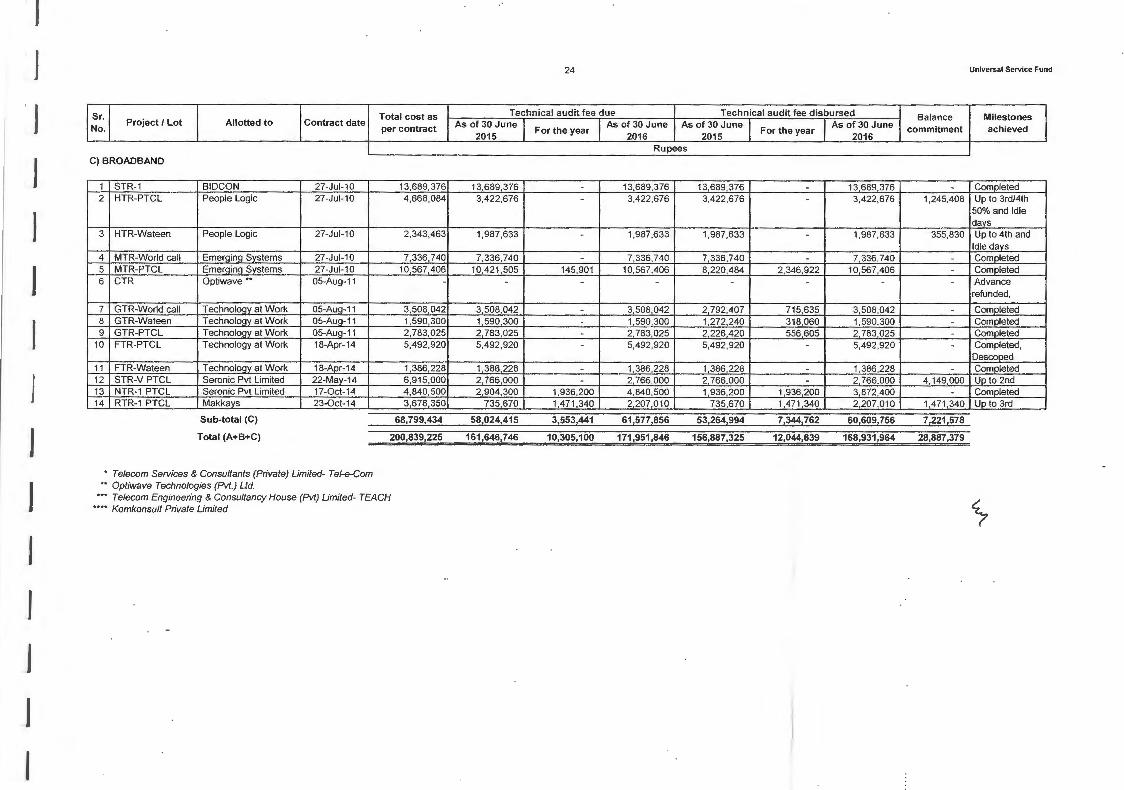
J
J
J
J
J
J
J
J
24
lsr.,
Project I Lot I Allotted to I Contract date Total cost as I Technical audit fee due I Technical audit fee disbursed I Balance
per contract I As of 30 June I I As of 30 June I As of 30 June I F th I As of 30 June I commitment No.
C) BROADBAND
1 STR-1 BIDCON 27-Jul-10 13.689.376 2 HTR-PTCL People Logic 27-Jul-10 4,668,084
3 HTR-Wateen People Logic 27-Jul-10 2,343,463
4 MTR-World call EmerQinQ Systems 27-Jul-10 7,336,740 5 MTR-PTCL Emerging Systems 27-Jul-10 10,567,406 6 CTR Optiwave •• 05-Aug-11 -
7 GTR-World call Technology at Work 05-Aug-11 3,508,042 8 GTR-Wateen Technology at Work 05-Aug-11 1,590,300 9 GTR-PTCL Technology at Work 05-AuQ-11 2,783,025
10 FTR-PTCL Technology at Work 18-Apr-14 5,492,920
11 FTR-Wateen Technology at Work 18-Apr-14 1,386,228 12 STR-V PTCL Seronic Pvt Limited 22-May-14 6,915,000 13 NTR-1 PTCL Seronic Pvt Limited 17-0ct-14 4,840,500 14 RTR-1 PTCL Makkays 23-0ct-14 3,678,350
68,799,434 Sub-total (C)
Total (A+B+C) 200,839,225
* Telecom Services & Consultants (Private) Limited- Tel-e-Com ** Optiwave Technologies (Pvt.) Ltd.
••• Telecom Engineering & Consultancy House (Pvt) Limited- TEACH •••• Komkonsult Private Limited
2015 For the year 2016 2015 or e year 2016
Rupees
13,689,376 - 13,689,376 13,689,376 - 13,689,376 -
3,422,676 - 3,422,676 3,422,676 - 3,422,676 1,245,408
1,987,633 - 1,987,633 1,987,633 - 1,987,633 355,830
7,336,740 - 7,336,740 7,336,740 - 7,336,740 -10,421 ,505 145,901 10,567,406 8,220,484 2,346,922 10,567,406 -
- - - - - - -
3,508,042 - 3,508,042 2,792,407 715,635 3,508,042 -1,590,300 - 1,590,300 1,272,240 318,060 1,590,300 -2,783,025 - 2,783,025 2,226,420 556,605 2,783,025 -5,492,920 - 5,492,920 5,492,920 - 5,492,920 -
1,386,228 - 1,386,228 1,386,228 - 1,386,228 -2,766,000 - 2,766,000 2,766,000 - 2,766,000 4,149,000 2,904,300 1,936,200 4,840,500 1,936,200 1,936,200 3,872,400 -
735,670 1,471,340 2,207,010 735,670 1,471 340 2 207,010 1,471 ,340
58,024,415 3,553,441 61,577,856 53,264,994 7,344,762 60,609,756 7,221 ,578
161,646,746 10,305,100 171,951 ,846 156,887,325 12,044,639 168,931 ,964 28,887,379
Universal Service Fund
Milestones I achieved
Completed Up to 3rdl4th
50% and Idle days Up to 4th and
Idle days Completed Completed Advance refunded,
Completed Completed Completed Completed, Descoped Completed Up to 2nd Completed Up to 3rd
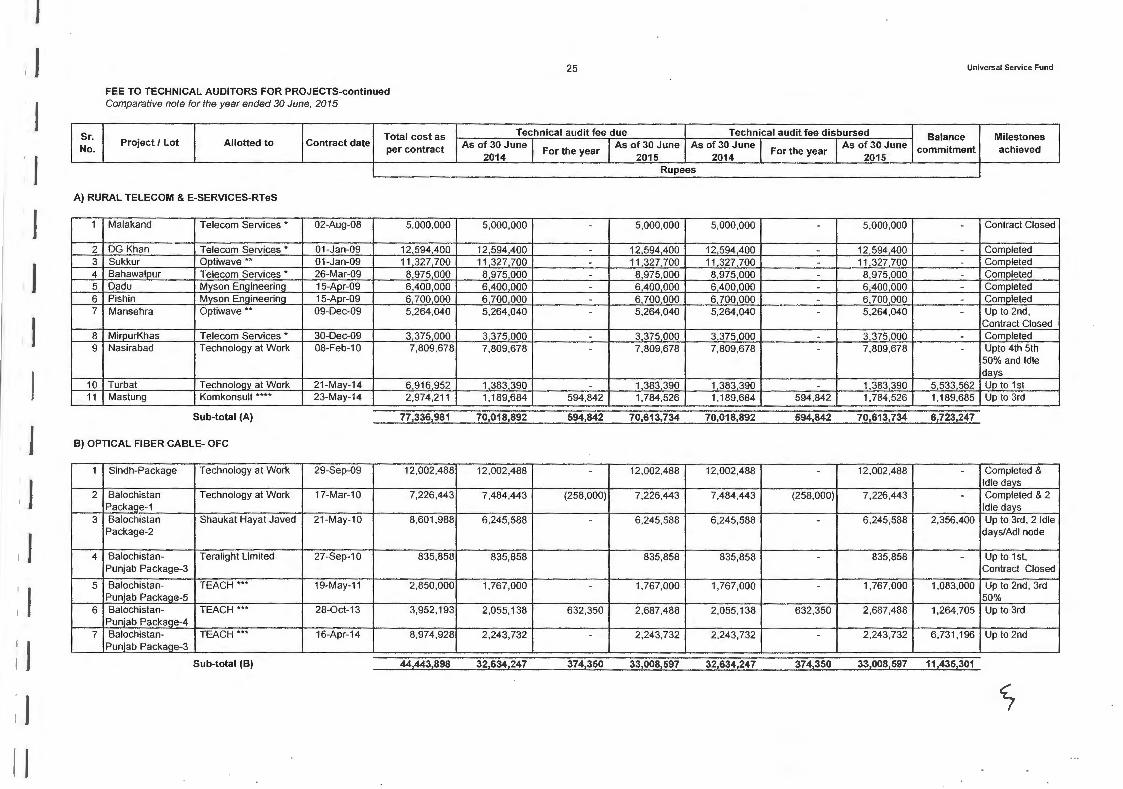
J
J
1
J
Sr. No.
FEE TO TECHNICAL AUDITORS FOR PROJECTS-continued Comparative note for the year ended 30 June, 2015
Total cost as Project I Lot Allotted to Contract date
per contract
A) RURAL TELECOM & E-SERVICES-RTeS
1 Malakand Telecom Services • 02-Aug-08 5,000,000
2 DG Khan Telecom Services • 01 -Jan-09 12,594,400 3 Sukkur Optiwave •• 01-Jan-09 11,327,700 4 Bahawalpur Telecom Services • 26-Mar-09 8,975,000 5 Dadu Myson Engineering 15-Apr-09 6,400,000 6 Pishin Myson Engineering 15-Apr-09 6,700,000 7 Mansehra Optiwave •• 09-Dec-09 5,264,040
8 MirpurKhas Telecom Services* 30-Dec-09 3,375,000 9 Nasirabad Technology at Work 08-Feb-10 7,809,678
10 Turbat Technology at Work 21-May-14 6,916,952 11 Mas tung Komkonsult •••• 23-May-14 2,974,211
Sub-total (A) 77,336,981
1 B) OPTICAL FIBER CABLE- OFC
1 Sindh-Package Technology at Work 29-Sep-09 12,002,488
1 2 Balochistan Technology at Work 17-Mar-10 7,226,443 Package-1
3 Balochistan ShaukatHayatJaved 21-May-10 8,601,988
1 Package-2
4 Balochistan- Teralight Limited 27-Sep-10 835,858 Punjab Package-3
J
5 Balochistan- TEACH *** 19-May-11 2,850,000 Punjab Package-S
6 Balochistan- TEACH *** 28-0ct-13 3,952,193 Punjab Package-4
7 Balochistan- TEACH*** 16-Apr-14 8,974,928 Punjab Package-3
Sub-total (B) 44,443,898
II
25 Universal Service Fund
Technical audit fee due Technical audit fee disbursed I Balance Milestones As of 30 June I F th I As of 30 June As of 30 June I F th I As of 30 June I commitment achieved 2014 or e year 2015 2014 or e year 2015
Rupees
5,000,000 - 5,000,000 5,000,000 - 5,000,000 - Contract Closed
12,594 400 - 12,594,400 12,594,400 - 12,594,400 - Completed 11 327,700 - 11,327,700 11,327,700 - 11 ,327,700 - Completed 8,975,000 - 8,975,000 8,975 000 - 8,975,000 - Completed 6,400,000 - 6,400 000 6,400,000 - 6,400,000 - Completed 6,700,000 - 6,700,000 6,700 000 - 6,700,000 - Completed 5,264,040 - 5,264,040 5,264,040 - 5,264,040 - Up to 2nd,
Contract Closed 3,375,000 - 3,375,000 3,375,000 - 3,375,000 - Completed 7,809,678 - 7,809,678 7,809,678 - 7,809,678 - Upto 4th 5th
50% and Idle days
1,383,390 - 1,383,390 1,383,390 - 1,383,390 5,533 562 Up to 1st 1,189,684 594 ,842 1,784,526 1,189,684 594,842 1,784,526 1,189,685 Up to 3rd
70,018,892 594,842 70,613,734 70,018,892 594,842 70,613,734 6,723,247
12,002,488 - 12,002,488 12,002,488 - 12,002 ,488 - Completed & Idle days
7,484,443 (258,000) 7,226,443 7,484,443 (258,000) 7,226,443 - Completed & 2 Idle days
6,245,588 - 6,245,588 6,245,588 - 6,245,588 2,356,400 Up to 3rd, 2 Idle days/Adl node
835,858 835,858 835,858 - 835,858 - Up to 1st, Contract Closed
1,767,000 - 1,767,000 1,767,000 - 1,767,000 1,083,000 Up to 2nd, 3rd 50%
2,055,138 632,350 2,687,488 2,055,138 632,350 2,687,488 1,264,705 Up to 3rd
2,243,732 - 2,243,732 2,243,732 - 2,243,732 6,731,196 Up to 2nd
32,634,247 374,350 33,008,597 32,634,247 374,350 33,008,597 11,435,301

J
J
J
J
J
J
1
J
J
J
J
j
J
J
Sr. No.
Project I Lot Allotted to Contract date
C) BROADBAND
1 STR-1 BIOCON 27-Jul-10 2 HTR-PTCL People Logic 27-Jul-10
3 HTR-Wateen People Logic 27-Jul-10
4 MTR-World call Emerging Systems 27-Jul-10 5 MTR-PTCL Emerging Systems 27-Jul-10 6 CTR Optiwave •• 05-Aug-1 1
7 GTR-WorldCall Technology at Work 05-Aug-11 8 GTR-Wateen Technology at Work 05-Aug-11 9 GTR-PTCL Technology at Work 05-Aug-11
10 FTR-PTCL Technology at Work 18-Apr-14
11 FTR-Wateen Technology at Work 18-Apr-14 12 STR-V PTCL Seronic Pvt Limited 22-May-14 13 NTR-1 PTCL Seronic Pvt Limited 17-0ct-14 14 RTR-1 PTCL Makkays 23-0ct-14
Sub-total (C)
Total (A+B+C)
• Telecom Services & Consultants (Private) Limited- Tel-e-Com •• Optiwave Technologies (Pvt.) Ltd.
Total cost as per contract
13,689,376 4,668,084
2,343,463
7,336,740 10,421,505
-
3,508,042 1,590,300 2,783,025 5,492,920
1,386,228 6,915,000 4,840,500 3,678,350
68,653,533
190,434,412
••• Telecom Engineering & Consultancy House (Pvt) Limited- TEACH •••• Komkonsult Private Limited
26 Universal Service Fund
Technical audit fee due Technical audit fee disbursed Balance Milestones As of 30 June~ F th lAs of 30 June As of 30 June I F th I As of 30 June commitment achieved 2014 or e year 2015 2014 or e year 2015
Rupees
13,689,376 - 13,689,376 13,689,376 - 13,689 ,376 - Completed 3,422,676 - 3,422,676 3,422,676 - 3,422,676 1,245,408 Up to 3rdl4th
50% and Idle days
1,987,633 - 1,987,633 1,987,633 - 1,987,633 355,830 Up to 4th and Idle days
7,336,740 - 7,336,740 7,336,740 - 7,336 ,740 - Completed 4,402,044 6,019,461 10,421,505 4,402,044 3,818,440 8,220,484 - Completed
- - - - - - - Advance refunded, Contract Closed
2,792,407 715,635 3,508 042 2,146 905 645,502 2,792,407 - Completed 1,272,240 318,060 1,590,300 1,272 240 - 1,272 240 - Completed 2,226,420 556,605 2,783,025 2,226 420 - 2,226,420 - Completed
- 5,492,920 5,492,920 - 5,492,920 5,492,920 - Completed, Des coped
695,114 691,114 1,386,228 695,114 691,114 1,386,228 - Completed - 2,766,000 2,766.000 - 2,766,000 2,766,000 4,149,000 Up to 2nd - 2,904,300 2,904,300 - 1,936,200 1,936,200 1,936,200 Up to 3rd
- 735,670 735,670 - 735 ,670 735 670 2,942,680 Up to 1st
37,824,650 20,199,765 58,024,415 37,179,148 16,085,846 53,264,994 10,629,118
140,477,789 21,168,957 161,646,746 139,832,287 171055,038 156,887,325 28,787,666

27 Universal Service Fund
18 FINANCIAL RISK MANAGEMENT OBJECTIVES AND POLICIES
The Company has exposure to the following risks from its use of financial instruments:
- Credit risk - Liquidity risk and - Market risk
The Board of Directors has overall responsibility for the establishment and oversight of the Company's risk management framework and developing and monitoring the Company's risk management policies.
The Company's risk management policies are established to identify and analyze the risks faced by the Company, to set appropriate risk limits and controls, and to monitor risks and adherence to limits. Risk management policies and systems are reviewed regularly to reflect changes in market conditions and the Company's activities. The Board of Directors of the Company oversees how management monitors compliance with the Company's risk management policies and procedures, and reviews the adequacy of the risk management framework in relation to the risks faced by the Company.
18.1 Credit risk
Credit risk is the risk which arises with the possibility that one party to a financial instrument will fail to discharge its obligation and cause the other party to incur a financial loss. The Company attempts to control credit risk by monitoring credit exposures, limiting transactions with specific counterparties and continually assessing the creditworthiness of counterparties. The Company's credit risk is primarily attributable to advances, deposits, interest accrued, other receivables and balance at bank.
The Company limits its exposure to credit risk by maintaining bank account only with counterparties that have a credit rating of at least A 1 and A. Considering the high credit rating, the credit risk in respect of bank balance is considered to be low. The Company's other financial assets are not significant to its operations. The carrying values of financial assets represents the maximum credit exposure at the reporting date are as follows:
Long-term deposits Advances Interest accrued Other receivables Bank balance
2016 2015 ------------Rupees------------
127,500 832,404
55,223.236 128,548
3,338,637,296 3,394,948,984
127,500 564,327
31,001,017 986,849,953 414,398,770 1 ,432,941,56i
Geographically there is no concentration of credit risk. None of the financial assets are overdue. Based on the past experience, the management believes that no impairment allowance is necessary in respect of the Company's financial assets.
The credit quality of financial assets, for which the counter party is a bank, can be assessed by reference to external credit ratings as shown below:
Bank name
National Bank of Pakistan
Bank balance Interest accrued
Rating
AANA-1+
Rating Agency
JCR-VIS
2016 2015 ------------Rupees------------
3,338,637,296 55,223,236
3,393,860,532
414,398,770 31,001,017
445,399,787
The management believes that no impairment allowance is necessary in respect of these financial assets unless expl icitly stated in the respective notes.
~

28 Universal Service Fund
18.2 Liquidity risk
Liquidity risk is the risk that an entity will encounter difficulty in meeting obligations associated with financial liabilities. The Company's approach to managing liquidity is to ensure, as far as possible, that it will have sufficient liquidity t9 meet its liabilities when due, under both normal and stressed condition , without incurring any unacceptable loss or damage to the Company's reputation .
The maturity profile of the Company's financial liabilities based on the contractual amounts is as follows:
Contractual Maturity upto 1 Maturity over 1
Carrying amount cash flows year
year and upto 5 years
Rupees 2016 Project subsidy payable 741,299,016 741,299,016 741,299,016 Technical auditor fee payable 3,019,882 3,019,882 3,019,882 Payable to suppliers 5,743,295 5,743,295 5,743,295 Accrued liabilities 2,335,885 2,335,885 2,335,885 Earnest money 72,954,663 72,954,663 72,954,663
825,352,741 825,352,741 825,352,741 2015 Project subsidy payable 1,412,100,622 1,412,100,622 1,412,100,622 Technical auditor fee payable 4,759,421 4,759,421 4,759,421 Payable to suppliers 15,497,896 15,497,896 15,497,896 Accrued liabilities 1,465,483 1,465,483 1,465,483 Earnest money 577,176 577,176 577,176
1 434 400 598 1 434 400 598 1 434 400 598
It is not expected that the cash flows included in the maturity analysis would occur significantly earlier or at sionificantlv different amounts.
18.3 Market risk
The risk that the fair value or future cash flows of a financial instrument will fluctuate because of changes in market prices, due to changes in market sentiments, speculative activities, supply and demand of securities and liquidity in the market. Market risk comprises of three types of risk: currency risk, interest rate risk and other price risk. The Company is not significantly exposed to market risk.
18.3.1 Currency risk
Currency risk is the risk that the value of financial asset or a liability will fluctuate due to a change in foreign exchange rates. It arises mainly where receivables and payables exist due to transactions entered into foreign currencies.
The Company is not exposed to currency risks as it has no transaction in foreign currency.
18.3.2 Interest rate risk
'Interest rate risk represents the risk that the fair value or future cash flow of a financial instrument will fluctuate because of changes in market interest rate.
The Company has no significant long-term interest bearing financial asset and liabil ity whose fa ir value or future cash flows will fluctuate because of changes in market interest rates.
Financial assets include Rs. 3,338,637,296 (2015: Rs. 414,398,770 ) which earn interest. Applicable interest rates for financial assets have been indicated in note 1 0.1.
As the interest rates on the Company's financial assets are fixed, there is no exposure to any fluctuation in future cash flows.
Fair value sensitivity analysis for fixed rate instruments
The Company does not hold any financial asset at fair value through profit and loss. Therefore a change in interest rate at reporting date would not affect income and expenditure account of the Company.
~

29 Universal Service Fund
18.3.3 Other price risk
Price risk is the risk that the fair value or future cash flows of a financial instrument will fluctuate because of changes in market prices (other than those arising from interest rate risk or currency risk), whether those changes are caused by factors specific to the individual financial instrument or its issuer, or factors affecting all similar financial instruments traded in the market.
At the year end the Company is not exposed to price risk since there are no financial instruments whose fair value or future cash flows will fluctuate because of changes in market prices.
18.4 Off-setting of financial assets and liabilities
The Company does not off-set any of its financial assets and financial liabilities.
18.5 Determination of fair values
Fair values of financial and non-financial assets and liabilities are determined for measurement and/or disclosure on the basis of accounting policies disclosed in the financial statements. As at the reporting date, carrying value of the Company's financial assets and liabilities are reasonable approximation of their fair value. Accordingly, no fair value information has been disclosed in these financial statements.
18.6 Capital risk management The Board of Directors monitors the Company's performance against target set on an annual basis. All of the financing required by the Company, for its activities, is provided through Grant from MolT. The outstanding balance of the Grant is normally adequate for a year's operation. MolT remains committed to met the requirements of the company.
19 TRANSACTIONS AND BALANCES WITH RELATED PARTIES
The. Company is governed by the Ministry of Information Technology, Government of Pakistan (GoP). Therefore, all departments and agencies controlled by the GoP ("State-controlled entities") are related parties of the Company. Other related parties include directors, members, key management personnel, USF Employees' Gratuity Fund and entities under common directorship. Remuneration to the Chief Executive is disclosed in note 20 to these financial statements. Balances with related parties are disclosed in note 11 and 16 to the financial statements and significant transactions with related parties are as follows:
State-controlled entities Grant received during the year
Associate due to common directorship Subsidy grant disbursement
Pakistan Telecommunication Company Limited Pak Telecom Mobile Limited (Ufone) CMPak Limited
USF Employees' Gratuity Fund Contributions paid by the Company
20 REMUNERATION OF CHIEF EXECUTIVE
Managerial remuneration
Allowances
Bonus
Compensated absences
Note
16
13
20.1
2016 2015 Rupees Rupees
7,849,300,000
2,120,697,056 2,254, 11'1 ,631 996,437,001 303,638,412
3,420, 772,469 2125411111631
4,809,761 15,653,614
8,869,872 8,175,000
6,725,928 6,309,000 1,090,000
354,795 333,333 17,040,595 14,817,333
20.1 This includes monetization allowance, amounting to Rs. 1,140,000 (2015: Rs. 1,140,000) provided in lieu of the Company maintained car to the entitled employees across the Board. Further, the Chief Executive Officer is also entitled to gratuity, the provision for which is determined by the actuary.
20.2 The Directors of the Company were not paid any remuneration during the year except for the meeting fee of Rs. 340,000 ( 2015: Rs. 440,000). The total number of directors amount to 9 ( 2015: 9). ~

30 Universal Service Fund
21 NUMBER OF EMPLOYEES 2016 2015
Employees at the year end (Number) 82 76
Average employees during the year (Number) 79 80
22 CORRECTION OF PRIOR YEAR ERROR
In the previous year, the Company did not recognize the project subsidy payable to Pakistan
Telecommunication Company Limited and CMPak Limited in respect of operating expenditure incurred by them
for projects in Mastung and Turbat, respectively, for the periods from Feb 2015 to June 2015 and May 2015 to
June 2015. The correction of the error has been made retrospectively in these financial statements by restating
the corresponding figures, in accordance with International Accounting Standard - 8 "Accounting policies,
Change in Accounting Estimates and Errors".
The effect of the restatements on the financial statements for the current year are as follows:
Restatement in balance sheet
Other receivables
Trade and other payables
Restatement in income and expenditure account Subsidy grant for projects
Expenditure charged to fund balance
As originally reported in
2015
Effect of prior period errors
2015 Restated
·······-·····-·······-··-··Rupees---·--·-··············-····
927,872,765
1,37 4,153,011
4,255,447,122
4,488,641 '184
60,247,587 988,120,352
60,247,587 1,434,400,598
60,247,587 4,315,694,709
60,247,587 4,548,888,771
As the above rectifications did not effect the balances at the beginning of the preced ing period, no third balance sheet has been presented.
23 CORRESPONDING FIGURES
Corresponding figures have been re-arranged and reclassified, wherever necessary, for more appropriate presentation of transactions and events for the purpose of comparisons. Significant reclassification is as follows:
From
Advances, deposits and prepayments
To
Long-term deposits
Advances
Short-term prepayments
2015 Rupees
127,500 564,327 185,867
24 DATE OF AUTHORIZATION FOR ISSUE
These financial statements were authorized for issue by the Board of Directors of the Company on
1 6 FEB 2017 25

EY I Assurance I Tax I Transactions I Advisory
About EY
EY is a global leader in assurance, tax, transaction and advisory services. The insights and quality services we deliver help build trust and confidence in the capital markets and in economies the world over. We develop outstanding leaders who team to deliver on our promises to all of our stakeholders. In so doing, we play a critical role in building a better working world for our people, for our clients and for our communities.
EY refers to the global organizat ion, and may refer to one or more, of the member firms of Ernst & Young Global Limited, each of which is a separate legal entity. Ernst & Young Global Limited , a UK company limited by guarantee, does not provide services to clients. For more information about our organization, please visit ey.com.
© 2016 EY Ford Rhodes Al l Rights Reserved. ey.com/pk