extrinsic factors in software reliability - microsoft.com · application testers cannot simply test...
TRANSCRIPT

Extrinsic Influence Factors in Software Reliability: A Study of 200,000 Windows Machines
Christian Bird * Venkatesh-Prasad Ranganath # Thomas Zimmermann * Nachiappan Nagappan * Andreas Zeller +
* Microsoft Research
Washington, USA
{cbird tzimmer nachin}@microsoft.com
Kansas State University
Kansas, USA
+ Saarland University
Saarbrücken, Germany
ABSTRACT
Reliability of software depends not only on intrinsic factors such as
its code properties, but also on extrinsic factors—that is, the proper-
ties of the environment it operates in. In an empirical study of more
than 200,000 Windows users, we found that the reliability of indi-
vidual applications is related to whether and which other applications
are installed: While games and file-sharing applications tend to de-
crease the reliability of other applications, security applications tend
to increase it. Furthermore, application reliability is related to the us-
age profiles of these applications; generally, the more an application
is used, the more likely it is to have negative impact on reliability of
others. As a consequence, software testers must be careful to inves-
tigate and control these factors.
Categories and Subject Descriptors
D.2.4 [Software Engineering]: Software/Program Verification – re-
liability, statistical methods; D.4.5 [Operating Systems]: Reliabil-
ity; C.4 [Performance of Systems] – measurement techniques; re-
liability, availability, and serviceability; D.2.5 [Software Engineer-
ing]: Testing and Debugging – monitors, tracing;
General Terms
Reliability, Measurement
Keywords
Windows
1. INTRODUCTION When assessing the reliability of an application, for instance during
in-house testing, one must make reasonable assumptions on what can
and what cannot happen in the environment. For instance, a new ap-
plication would be tested on a specific set of hardware and operating
system configurations. As the operating system shields applications
from influencing each other directly, one might assume that it should
not matter whether other applications are installed or being used. But
does this assumption hold?
As a computer user, you may have experienced applications being
incompatible with each other. If you install the popular Steam games
platform on your Windows PC, for instance, there are no less than
75 other applications known to cause issues with Steam and playing
games [1]. The list includes popular anti-virus software such as
BitDefender, communication software such as Skype, or backup
software such as Western Digital Backup Anywhere. For six out of
the 75 applications, Steam support recommends that they “be fully
uninstalled from your system if disabling them does not resolve the
issue.”
Such incompatibilities are not uncommon: When installing
Kaspersky Anti-Virus software, it automatically uninstalls incom-
patible products (most of these being other anti-virus programs)
from a list of 593 programs; another 173 are deleted after obtaining
user confirmation [2]. Clearly, some programs are not meant to
peacefully co-exist on your system.
In this paper we investigate how the environment of a software ap-
plication determines its reliability. We address questions such as:
How frequent are such incompatibilities between applications? How
would an application’s reliability be affected by its environment—
be it other applications, the system configuration, or hardware? What
do such influences imply as it comes to assessing software reliabil-
ity?
To answer these questions, we analyzed reliability data from more
than 200,000 users of Microsoft Windows and associated crashes of
the most frequently used applications with software and hardware
features. We introduce and use a method of data analysis that we
term “Influence Factors” – a general pattern that untangles the influ-
ences of many factors on many different outcomes that we describe
in detail in Section 3.5. This pattern enabled us to determine which
software and hardware configurations are the most failure-prone; and
which extrinsic factors (factors in the environment) determine the
reliability of individual applications. Our key findings include:
A lower reliability of an application can be related to simply us-
ing another single application;
Usage of file-sharing programs universally correlates with lower
application reliability;
The mere installation of one application may affect the reliability
of others;
While most security applications increase reliability, there are
also ones that correlate with decreased reliability; and
Less powerful hardware correlates with lower application relia-
bility.
In practice, this means that even the best-written software may fail
due to interference with other applications; and therefore, users do
and will experience failures for which no single vendor is responsi-
ble. This alone may not come as a surprise to computer users. How-
ever, to our knowledge, this study is the first to analyze the problem
and to quantify its extent.
Our findings have a number of consequences for future research and
development, ranging from inconvenient to challenging:
Permission to make digital or hard copies of all or part of this work for
personal or classroom use is granted without fee provided that copies are not made or distributed for profit or commercial advantage and that copies
bear this notice and the full citation on the first page. To copy otherwise, or
republish, to post on servers or to redistribute to lists, requires prior specific permission and/or a fee.
ICSE'14, May 31 – June 7, 2014, Hyderabad, India.
Copyright 2014 ACM 978-1-4503-2768-8/14/05... $15.00.

Application testers cannot simply test on out-of-the-box sys-
tems (which is the standard practice). Instead, they must test on
environments with several applications that could possibly inter-
fere. With the permission of users, they must collect and aggre-
gate usage and failure data, and use an analysis such as ours to
detect interference.
Application designers must anticipate and handle issues stem-
ming from interference with third party applications. In essence,
we need mechanisms to express expected interaction, and to de-
tect and prevent unexpected interaction.
Operating systems of the future will need much better orga-
nized ecosystems, with clear, enforceable rules such that appli-
cations can better coexist. How do we specify this? Who en-
forces the rules? Can we keep systems flexible and reliable at the
same time? Who will be in charge of the computer – vendors or
users? Moving and enforcing specifications and architectural
rules from applications to the system level brings plenty of chal-
lenges for research.
The remainder of the paper is organized as follows: Section 2 dis-
cusses our data source. Section 3 presents the most frequently used
applications, their features, and their categorization and discusses the
study design, based on logistic regression and frequent itemset min-
ing; it also generalizes the study setting to the general “Influence
Factors” data analysis pattern. Section 4 discusses the influence of
hardware and software features on reliability of Windows and appli-
cations. Section 5 presents the impact that specific combinations of
hardware and/or application features have on reliability. Section 6
discusses our results in detail, including threats to validity; Section 7
discusses related work and Section 8 closes with conclusions and
consequences.
2. THE WINDOWS CUSTOMER EXPERI-
ENCE IMPROVEMENT PROGRAM (CEIP) When first starting a new installation of Windows 7, customers can
opt to participate in the Windows Customer Experience Improvement
Program (CEIP), a program to collect information about computer
hardware and operating system usage. When the program is acti-
vated, the computer will automatically collect information on the
system configuration and software reliability, including
Hardware configuration—such as the number of processors,
processor speed, screen resolution, or graphics card;
Software usage and reliability—i.e., which binaries were
started, whether they terminated normally, crashed or hung.
When the PC is connected to the Internet via a broadband connec-
tion, this data is securely sent to servers in Microsoft-controlled fa-
cilities, and made available to the Windows team [3]. CEIP was de-
signed with customer privacy in mind and goes to great lengths to
preserve such privacy. As one such measure, CEIP randomly gener-
ates a number called a globally unique identifier (GUID) that is sent
to Microsoft with every CEIP report. The GUID lets Microsoft de-
termine which data is sent from a particular machine over time. How-
ever, the GUID does not contain any personal information and is not
used to identify anyone.
In this study, our goal was to learn how system and application reli-
ability would be affected by the extrinsic factors listed above. We
therefore accessed a slice of CEIP data collected in the period of Jan-
uary to March, 2011, representing configuration, usage, and reliabil-
ity information of more than 200,000 individual machines whose us-
ers opted into the CEIP.
The CEIP attempts to relate reliability to usage profiles—that is, how
the computer is actually used. For this purpose, it tracks the follow-
ing information:
Binary launches. For each binary (an individual executable file
launched by the operating system), the CEIP tracks when and
how often it was launched.
Binary meta-data. For each binary, the CEIP tracks meta-data
such as file name, program name, or vendor name.
Binary crashes. The CEIP records the number of normal and
abnormal terminations for each binary.
We use application crashes (abnormal terminations) as our measure
of reliability. From the CEIP data, one can see how frequently, for
example, a specific image manipulation application and a specific
antivirus application were launched, and how frequently they
crashed. Data, files, settings or any other information accessed or
produced by these programs is not collected, however. We can thus
characterize usage only by the programs launched.
3. METHODOLOGY We first describe how we identified and categorized the applications
that we analyzed in our study (Section 3.1), the features that we use
to model reliability (Section 3.2) and our analysis methods based on
logistic regression (Section 3.3), influence networks (Section 3.4),
and frequent itemset mining (Section 3.5).
3.1 Identification and Selection of Applications Software application typically consists of multiple binaries. These
binaries and applications also come in multiple versions; there may
even be variants of binaries for specific locales or hardware config-
urations. Our first task thus was to map binaries to applications. For
this purpose, for each binary, we identified the application it was part
of from the attached meta-data. All binaries related to, for example
Skype, would thus be mapped to a single application.
In order to limit the size of our study, we focused on the most fre-
quently used applications. Aiming for the top 50 applications, we
collected data for the top 55, out of which two were found to be du-
plicates. We retained 53 applications, which we grouped into seven
categories. The functionality of each application was the primary
attribute used for categorization.
14 internet applications. This category contained Internet
browsers, e-mail as well as instant messaging programs.
5 file applications. This included popular file sharing programs
as well as unarchivers.
5 office applications. This included “classic” productivity ap-
plications such as word processors, spreadsheet systems, and
presentation programs.
3 photography applications. This category contained programs
to manage and manipulate digital photographs.
11 security applications. This includes anti-virus software as
well as firewall and other network protection software.
3 games. All are graphics-intensive and highly interactive.
12 media applications. This category included software for
managing, playing, and streaming music and video files.
From an experimental design perspective, the categorization was in-
itially performed by the last author and all researchers reviewed and
agreed on the final categorization used in this paper. As this catego-
rization is an important attributed of this study, we took additional
steps to validate that the categorization was as objective as possible.
We measured inter-rater agreement for the categorization with three
additional, independent raters (who are not co-authors of this paper);
the Fleiss’ Kappa [4] values between the external raters and our cat-
egorization were 0.679, 0.736, and 0.815 (all values statistically sig-
nificant at p<0.001), which can be considered a substantial agree-
ment [5].
These categories also reflect what the PCs were mainly used for:
Browsing the web, playing games, office work, managing music,
photos, or videos—and sharing and downloading files. (We did not
find a single programming or scientific application in the most used
applications.) The proportions of the categories do not reflect the
proportions of usage, though; it is just that there are many more
games than office applications; hence, for a single game, it is more
difficult to end up in the top 53 applications. The distribution also
reflects how PCs are configured by their vendors; on a new PC, you
would more likely find recent security software than a recent block-
buster game.
For confidentiality reasons we are not able to explicitly name these
applications specifically other than to note that these are some of the
most commonly used applications in each domain. Throughout this
paper, we refer to applications in an anonymized way; Internet-1
through Internet-14, Files-1 through Files-5, etc. This serves to show
the intensity and trends of reliability effects within and between ap-
plication domains without indicating the exact product or the associ-
ated organization that produced it.
Again, note that these categories only refer to machines whose users
opted to send usage data. We discuss such issues in our threats to
validity in Section VII.
3.2 Characterizing Systems with Features For each machine observed, we analyzed configuration information
and reliability data for the first week after the first startup of the op-
erating system after installation. That is, when a new machine was
enlisted in the CEIP between January and March, 2011, we examined
data collected from the machine for just the first week. We specifi-
cally investigated this first week, as the initial impression with a new
system very much determines user satisfaction; if the user experience
is negative, he or she may even return a new computer.
The data consisted of a set of features that describe several aspects
of each system: hardware configuration, applications installed and
used as well as application failures. For the purpose of our study and
to allow a more natural comparison, we dichotomized all features
into binary variables. For app usage and installation this was fairly
straightforward. For continuous measurements such as the amount of
RAM installed or processor speed, we split about the median (the
mean was not used due to skew in the data, indicating that a non-
parametric measure was appropriate).
1. Hardware features. This includes seven features, which were
true if they were above the median, and false if not. Generally,
“true” values indicate more powerful machines.
# processors. True if more than two processors.
Processor speed. True if 2,262 MHz or more.
# logical drives. True if four or more logical drives.
# physical drives. True if two or more physical drives.
Drive size. True if 227,273 MB or more total space (used
or unused) on all drives.
Memory size. True if 2,933 MB or more total memory.
Video memory. True if more than 128 MB video
memory.
2. Applications installed. If an application was launched once
or more in the one-week period, we considered it to be “in-
stalled”. (Note that a “launch” of an application may also be
the launch of an installer belonging to that application.)
3. Applications used. If an application was launched more than
five times in the one-week period, we considered it to be
“used”. (If an application was used less than five times, this
indicates that it was just installed or tried, but never used
again.)
4. Application failures. If any of the binaries of the application
terminated abnormally at least once in the one-week period,
we considered the application “crashing”, indicating lowered
reliability.
3.3 Logistic Regression In order to relate application failures to hardware features, and to the
presence and usage of specific applications, we used logistic regres-
sions to determine how the individual factors influence failure prob-
ability [6]. Logistic regression allows us to determine the relation-
ship that one factor has with a dichotomous outcome when control-
ling for other factors that may also be related to the outcome.
In our case, this allows us to answer questions such as for example
“How is AdventureWorks reliability related to SouthBridge Video us-
age when controlling for the effects of system memory constraints?”
By including many factors in one logistic model, we can take a global
view of the interplay between many factors in different categories
such as processor speed, specific applications installed, and specific
applications used. Each logistic model has the following compo-
nents:
Reliability variable. For each application we built logistic mod-
els for a reliability variable z, which has a value of 0 if the appli-
cation crashed in the first week after OS startup and 1 otherwise.
Binary factors. For each regression model, we use as independ-
ent variables a set of binary factors, 𝑥1, 𝑥2, … , 𝑥𝑛, which repre-
sent hardware features, applications installed, and/or applica-
tions used.
Regression coefficients. Given a set of observations (z, x1, …,
xn) from our data set, each observation corresponding to one
user’s experience, logistic regression computes the best fit re-
gression coefficients 𝛽0, 𝛽1 , … , 𝛽𝑛 such that
𝑃(𝑧) =1
1 + 𝑒−(𝛽0+𝛽1𝑥1+𝛽2𝑥2+⋯+𝛽𝑛𝑥𝑛)
models the probability that 𝑧 has a value of 1, that the application
encounters no crashes.
Each of the regression coefficients βi indicates the sign and strength
of the influence of the factor xi within the model. The model also
indicates the statistical significance of the variables (the probability
that the variable actually has no effect on application reliability). For
the statistical analysis we accounted for multiple hypothesis testing
and considered only coefficients that are statistically significant at
p<0.05 after adjusting p-values with Benjamini-Hochberg [7] cor-
rection.
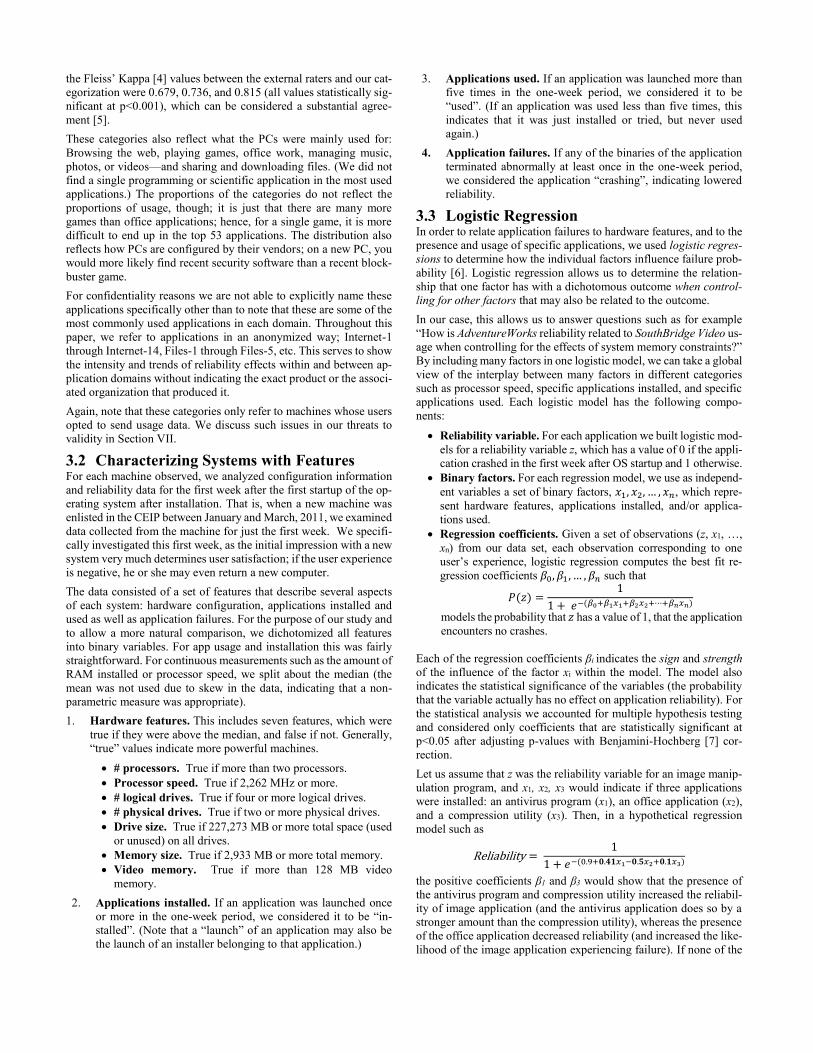
Let us assume that z was the reliability variable for an image manip-
ulation program, and x1, x2, x3 would indicate if three applications
were installed: an antivirus program (x1), an office application (x2),
and a compression utility (x3). Then, in a hypothetical regression
model such as
Reliability = 1
1 + 𝑒−(0.9+𝟎.𝟒𝟏𝑥1−𝟎.𝟓𝑥2+𝟎.𝟏𝑥3)
the positive coefficients β1 and β3 would show that the presence of
the antivirus program and compression utility increased the reliabil-
ity of image application (and the antivirus application does so by a
stronger amount than the compression utility), whereas the presence
of the office application decreased reliability (and increased the like-
lihood of the image application experiencing failure). If none of the
three is present (all xi = 0), the expected likelihood of image applica-
tion not failing would still be 1/(1 + 𝑒−0.9) = 0.71.
In logistic regression models, the coefficient βi corresponds to the
change in the log of the odds for a one unit change in factor xi given
that all other factors remain fixed. The odds ratio between absence
and presence of a factor x1 can be computed by raising e to the power
of the logistic coefficient, that is OR =𝑒𝛽𝑖. In order to focus on strong
effects, we considered only coefficients with a corresponding odd
ratio of greater or equal than 3/2 , i.e., 𝛽𝑖 ≥ ln 1.5 = 0.40546, or
an odd ratio less or equal than 2/3, 𝛽𝑖 ≤ ln(2/3) = −0.40546. In
the hypothetical regression model above, we would only consider the
antivirus program (β1=0.41) and the office application (β1=–0.5) to
have strong effects on reliability.
Since all factors in our logistic regression model are binary, the di-
rection (positive or negative) and magnitude of the coefficients can
be directly compared to each other.
3.4 Influence Networks For each application we built logistic models to model if the appli-
cation failed in the first week after OS startup based on hardware
features and other applications installed. We then used the coeffi-
cients to construct influence networks (similar to Heckerman et al.
[8]). Each hardware feature and application is represented as a node.
We create an edge between two nodes X and Y (where Y is an appli-
cation), if the coefficient β for X in the reliability model for Y was
statistically significant at p<0.05 after adjusting for multiple hy-
pothesis testing [7], and
strong, that is ≥ 0.40546 or ≤ −0.40546, corresponding to an
odds ratio of 3/2 and 2/3 respectively.
Each edge is annotated with its corresponding coefficient β. The po-
larity of an edge is the sign of the coefficient; it can either be positive
or negative.
In the resulting graph, the degree of nodes is an indicator of influ-
ence: nodes with many outgoing edges have strong influence on
other applications, while nodes with many incoming edges are
strongly influenced by others. We quantify influence of factors
(nodes) within the graph as follows:
Strength. The strength of a group of factors is the total number
of outgoing edges from the group (actual influence) normalized
by the total number of edges that are possible (maximum possi-
ble influence).
Positivity. The positivity of a group of factors is the percentage
of outgoing edges from the group that have positive coefficients,
that is 𝛽𝑖 ≥ 0.40546.
Let us explain these measures with a few examples. The factor Pro-
cessor speed influenced 11 out of 53 applications in our experiments,
resulting in a strength of 11/53=20.8%. All coefficients were positive
and correlated with an increase in the reliability of the applications,
resulting in a positivity of 11/11=100%. The factor Internet-1 influ-
enced 8 out of 52 applications, a strength of 19.6%. (Note that here
we have only 52 applications because we did not include the factor
Internet-1 in the model for Internet-1.) Out of the 9 coefficients 8
were positive, resulting in a positivity of 88.9%.
We also compute strength and positivity between groups of applica-
tions, for example to characterize the influence between Internet and
other Internet applications or Internet and Security applications. The
examples above are for influence relations, but strength and positiv-
ity can be computed in a similar way for relationships of type influ-
enced by: instead of outgoing edges, one would consider ingoing
edges.
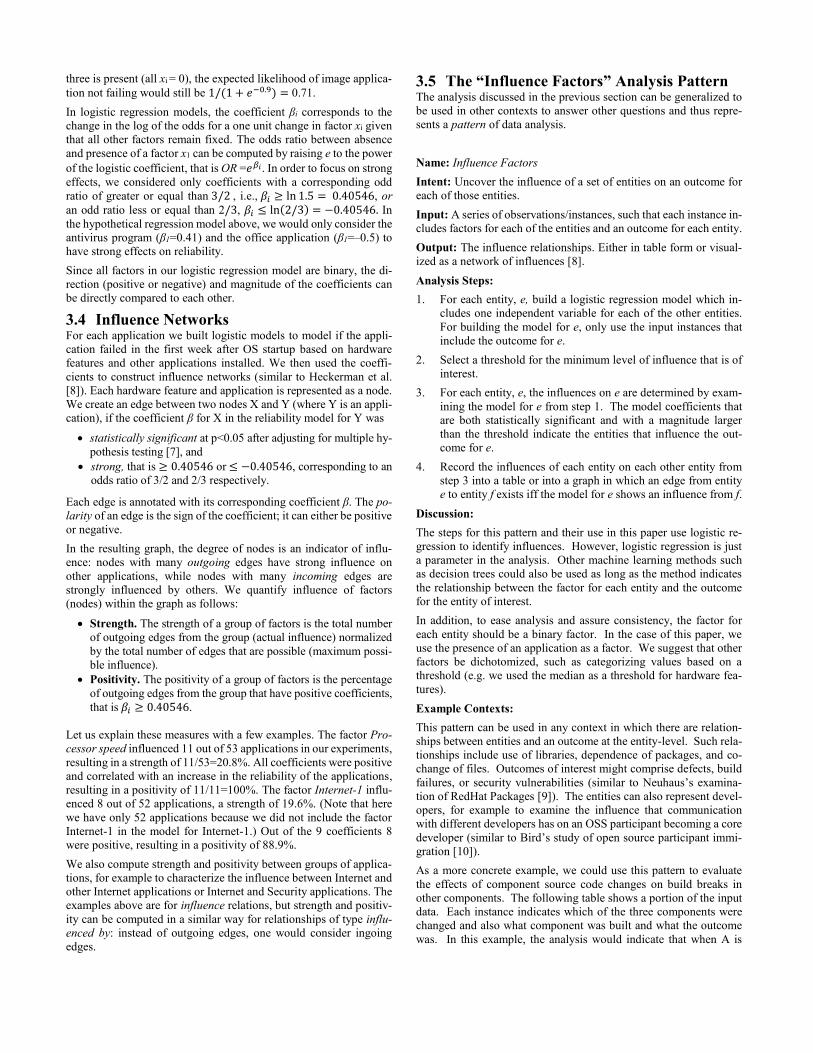
3.5 The “Influence Factors” Analysis Pattern The analysis discussed in the previous section can be generalized to
be used in other contexts to answer other questions and thus repre-
sents a pattern of data analysis.
Name: Influence Factors
Intent: Uncover the influence of a set of entities on an outcome for
each of those entities.
Input: A series of observations/instances, such that each instance in-
cludes factors for each of the entities and an outcome for each entity.
Output: The influence relationships. Either in table form or visual-
ized as a network of influences [8].
Analysis Steps:
1. For each entity, e, build a logistic regression model which in-
cludes one independent variable for each of the other entities.
For building the model for e, only use the input instances that
include the outcome for e.
2. Select a threshold for the minimum level of influence that is of
interest.
3. For each entity, e, the influences on e are determined by exam-
ining the model for e from step 1. The model coefficients that
are both statistically significant and with a magnitude larger
than the threshold indicate the entities that influence the out-
come for e.
4. Record the influences of each entity on each other entity from
step 3 into a table or into a graph in which an edge from entity
e to entity f exists iff the model for e shows an influence from f.
Discussion:
The steps for this pattern and their use in this paper use logistic re-
gression to identify influences. However, logistic regression is just
a parameter in the analysis. Other machine learning methods such
as decision trees could also be used as long as the method indicates
the relationship between the factor for each entity and the outcome
for the entity of interest.
In addition, to ease analysis and assure consistency, the factor for
each entity should be a binary factor. In the case of this paper, we
use the presence of an application as a factor. We suggest that other
factors be dichotomized, such as categorizing values based on a
threshold (e.g. we used the median as a threshold for hardware fea-
tures).
Example Contexts:
This pattern can be used in any context in which there are relation-
ships between entities and an outcome at the entity-level. Such rela-
tionships include use of libraries, dependence of packages, and co-
change of files. Outcomes of interest might comprise defects, build
failures, or security vulnerabilities (similar to Neuhaus’s examina-
tion of RedHat Packages [9]). The entities can also represent devel-
opers, for example to examine the influence that communication
with different developers has on an OSS participant becoming a core
developer (similar to Bird’s study of open source participant immi-
gration [10]).
As a more concrete example, we could use this pattern to evaluate
the effects of component source code changes on build breaks in
other components. The following table shows a portion of the input
data. Each instance indicates which of the three components were
changed and also what component was built and what the outcome
was. In this example, the analysis would indicate that when A is

changed together with B, A fails to build. Thus B influences A’s
build outcome.
Changed Component Built Build
A B C Component Outcome
1 1 0 A Fail
1 0 1 A Pass
1 1 1 A Fail
0 1 1 C Pass
1 1 1 B Pass
3.6 Association Rule Mining In addition to the identification of influence of individual factors
(with logistic regression and influence networks), we identified the
influence of factor combinations on application reliability. For this
purpose, we employed association rule mining [11] to mine associa-
tion rules of the form X → Y, read as “if X occurs, then Y will oc-
cur”, where X is a set of factors (such as an application installed) and
X is called the antecedent and Y is the consequent.
For our study, we focus on rules in which X is a non-empty and non-
singleton set of features describing either hardware or application in-
stallation or application usage and Y describes the application relia-
bility. Further, we only focus on rules that are statistically significant
(i.e., support >= 0.1), have high predictability (to protect the privacy
of certain aspects of data, we cannot report the exact confidence
threshold), and have high interest (i.e., lift >= 1.1). A rule X → Y
with high lift suggests that the probability of Y increases (or de-
creases) by at least 10% when X occurs. To mine application-specific
association rules, we consider for each application the application
profiles of all machines on which the application was launched. Fur-
ther, for each application, we mine three sets of rules by considering
features describing hardware, application installation, and applica-
tion usage separately. (We used the Apriori algorithm provided by
the R arules library [12] to mine rules.)
4. RELIABILITY FACTORS In this section, we show our results: How do individual features in-
fluence the reliability of individual applications? We start with hard-
ware features.
4.1 Hardware Features Our first hypothesis relates hardware features to application reliabil-
ity:
H1. Less powerful hardware (processor speed, memory size…) is
correlated with lower application reliability.
Our findings regarding the influence of hardware features are sum-
marized in Table 1. The table lists for each feature the number of
outgoing edges in the influence network with negative and positive
polarity, followed by the Strength and Positivity scores for the fea-
ture. With regard to hardware factors, the number of processors,
Figure 1. The strongest influence relationships between applications. Solid orange lines indicate that the source application has a
positive relationship with reliability of the target application while dashed blue lines indicate a negative relationship. Regression
coefficients for the models are also presented.
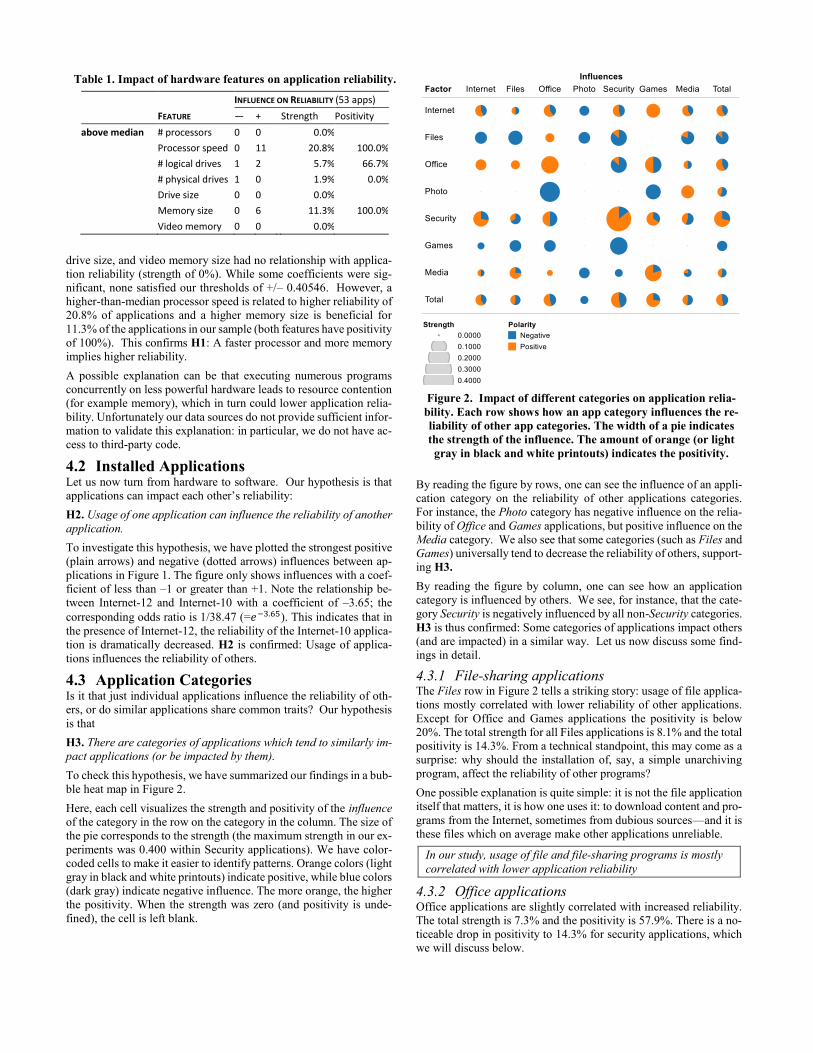
drive size, and video memory size had no relationship with applica-
tion reliability (strength of 0%). While some coefficients were sig-
nificant, none satisfied our thresholds of +/– 0.40546. However, a
higher-than-median processor speed is related to higher reliability of
20.8% of applications and a higher memory size is beneficial for
11.3% of the applications in our sample (both features have positivity
of 100%). This confirms H1: A faster processor and more memory
implies higher reliability.
A possible explanation can be that executing numerous programs
concurrently on less powerful hardware leads to resource contention
(for example memory), which in turn could lower application relia-
bility. Unfortunately our data sources do not provide sufficient infor-
mation to validate this explanation: in particular, we do not have ac-
cess to third-party code.
4.2 Installed Applications Let us now turn from hardware to software. Our hypothesis is that
applications can impact each other’s reliability:
H2. Usage of one application can influence the reliability of another
application.
To investigate this hypothesis, we have plotted the strongest positive
(plain arrows) and negative (dotted arrows) influences between ap-
plications in Figure 1. The figure only shows influences with a coef-
ficient of less than –1 or greater than +1. Note the relationship be-
tween Internet-12 and Internet-10 with a coefficient of –3.65; the
corresponding odds ratio is 1/38.47 (=𝑒−3.65). This indicates that in
the presence of Internet-12, the reliability of the Internet-10 applica-
tion is dramatically decreased. H2 is confirmed: Usage of applica-
tions influences the reliability of others.
4.3 Application Categories Is it that just individual applications influence the reliability of oth-
ers, or do similar applications share common traits? Our hypothesis
is that
H3. There are categories of applications which tend to similarly im-
pact applications (or be impacted by them).
To check this hypothesis, we have summarized our findings in a bub-
ble heat map in Figure 2.
Here, each cell visualizes the strength and positivity of the influence
of the category in the row on the category in the column. The size of
the pie corresponds to the strength (the maximum strength in our ex-
periments was 0.400 within Security applications). We have color-
coded cells to make it easier to identify patterns. Orange colors (light
gray in black and white printouts) indicate positive, while blue colors
(dark gray) indicate negative influence. The more orange, the higher
the positivity. When the strength was zero (and positivity is unde-
fined), the cell is left blank.
By reading the figure by rows, one can see the influence of an appli-
cation category on the reliability of other applications categories.
For instance, the Photo category has negative influence on the relia-
bility of Office and Games applications, but positive influence on the
Media category. We also see that some categories (such as Files and
Games) universally tend to decrease the reliability of others, support-
ing H3.
By reading the figure by column, one can see how an application
category is influenced by others. We see, for instance, that the cate-
gory Security is negatively influenced by all non-Security categories.
H3 is thus confirmed: Some categories of applications impact others
(and are impacted) in a similar way. Let us now discuss some find-
ings in detail.
4.3.1 File-sharing applications The Files row in Figure 2 tells a striking story: usage of file applica-
tions mostly correlated with lower reliability of other applications.
Except for Office and Games applications the positivity is below
20%. The total strength for all Files applications is 8.1% and the total
positivity is 14.3%. From a technical standpoint, this may come as a
surprise: why should the installation of, say, a simple unarchiving
program, affect the reliability of other programs?
One possible explanation is quite simple: it is not the file application
itself that matters, it is how one uses it: to download content and pro-
grams from the Internet, sometimes from dubious sources—and it is
these files which on average make other applications unreliable.
In our study, usage of file and file-sharing programs is mostly
correlated with lower application reliability
4.3.2 Office applications Office applications are slightly correlated with increased reliability.
The total strength is 7.3% and the positivity is 57.9%. There is a no-
ticeable drop in positivity to 14.3% for security applications, which
we will discuss below.
Table 1. Impact of hardware features on application reliability.
INFLUENCE ON RELIABILITY (53 apps)
FEATURE — + Strength Positivity
above median # processors 0 0 0.0%
Processor speed 0 11 20.8% 100.0%
# logical drives 1 2 5.7% 66.7%
# physical drives 1 0 1.9% 0.0%
Drive size 0 0 0.0%
Memory size 0 6 11.3% 100.0%
Video memory 0 0 0.0%
Figure 2. Impact of different categories on application relia-
bility. Each row shows how an app category influences the re-
liability of other app categories. The width of a pie indicates
the strength of the influence. The amount of orange (or light
gray in black and white printouts) indicates the positivity.
We found usage of the office applications in our set to be
slightly correlated with higher application reliability.
As with file-sharing applications, we believe that it is not the appli-
cations themselves, but the context in which they are being used that
determines reliability. One might suspect that office applications are
most often used in relatively well secure enterprise environment, and
these environments contribute to improved application reliability.
The office applications in our dataset are day-to-day applications
used to view documents and perform minimal editing. Hence, it is
indeed possible that office applications improve application reliabil-
ity.
4.3.3 Security applications Given the discussions on file sharing and office usage, one might
assume that security applications generally improve reliability—af-
ter all, their purpose is to protect users from negative influences. Un-
fortunately, the picture is not that clear. Some applications (such as
Internet-1) dramatically profit from the presence of any security ap-
plication (see Figure 2). Also as Table 2 shows, six of the eleven
security applications exclusively increase reliability when they do
affect other applications (positivity of 100%). However, not all se-
curity applications are beneficial to application reliability: Security-
7 is a security application whose presence correlates with almost uni-
versally reduced application reliability. It affects 36.5% of applica-
tions and for only 26.3% the influence was positive.
The category where security applications increase reliability the
most is security applications (strength 30.9%, positivity 85.3%).
Seven out of 11 security applications prevent other security applica-
tions from failing—an effect also visible in Figure 2. A possible ex-
planation is that they prevent malware that would affect the next ap-
plication in the command chain.
Security applications also increase the reliability of Internet (strength
11.8%, positivity 72.2%) and Games applications (strength 9.1%,
positivity 66.7%). Overall, the total strength is 12.8% and the posi-
tivity is 71.2%
In our study, security applications mostly increase the reliabil-
ity
of other applications.
Security applications may increase the reliability of other applica-
tions but they are negatively affected by almost every other applica-
tion (see the Security column in Figure 2). With a few exceptions,
the presence of other applications decreases reliability of security ap-
plications. This could be due to several reasons. Security applica-
tions could be too restrictive (e.g. prohibit read access to certain reg-
istry keys), and this could cause application failures.
We found the reliability of security applications to be affected
by most non-security applications.
4.3.4 Games Looking at Figure 2, one might assume that makers of security ap-
plications must hate gamers: For all three games, installation corre-
lates with increased chances of security applications failing (strength
15.2%, positivity 0%). This also holds for Internet, Files, and Office
applications, which becomes significantly less reliable (positivity in
all cases 0%). Such effects may be due to specific usage profiles,
such as a correlation between gaming and file sharing.
We found the three games in our set to be related to decreased
reliability of other applications.
4.4 Usage Frequency In our investigations thus far, we have not differentiated between
whether an application was frequently used or just installed. This dis-
tinction makes a difference on how an application impacts others:
Does this take place via some interference during installation? Or
does mere execution of an application impact others? Our hypoth-
esis is
H4. The more an application is used, the higher its impact on others.
To shed some light into this question, we built two additional regres-
sion models:
Installation only (no further usage). The first model considers
applications that were installed, but then hardly ever used. This
category contained applications that were executed four times or
less—typically, just the installation process, and 2—3 initial trial
launches.
Frequent usage. In the second model, we only looked at appli-
cations that were executed five times or more. (Again, the time
period considered was the first week after the initial OS launch.)
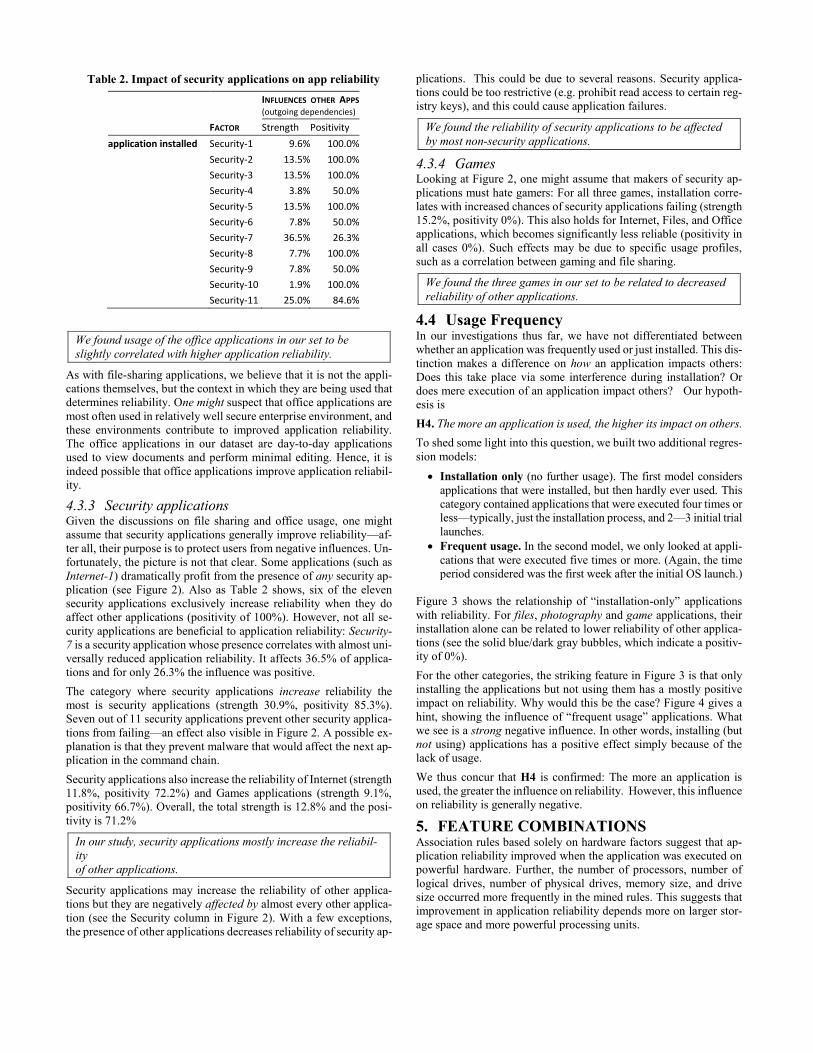
Figure 3 shows the relationship of “installation-only” applications
with reliability. For files, photography and game applications, their
installation alone can be related to lower reliability of other applica-
tions (see the solid blue/dark gray bubbles, which indicate a positiv-
ity of 0%).
For the other categories, the striking feature in Figure 3 is that only
installing the applications but not using them has a mostly positive
impact on reliability. Why would this be the case? Figure 4 gives a
hint, showing the influence of “frequent usage” applications. What
we see is a strong negative influence. In other words, installing (but
not using) applications has a positive effect simply because of the
lack of usage.
We thus concur that H4 is confirmed: The more an application is
used, the greater the influence on reliability. However, this influence
on reliability is generally negative.
5. FEATURE COMBINATIONS Association rules based solely on hardware factors suggest that ap-
plication reliability improved when the application was executed on
powerful hardware. Further, the number of processors, number of
logical drives, number of physical drives, memory size, and drive
size occurred more frequently in the mined rules. This suggests that
improvement in application reliability depends more on larger stor-
age space and more powerful processing units.
Table 2. Impact of security applications on app reliability
INFLUENCES OTHER APPS (outgoing dependencies)
FACTOR Strength Positivity
application installed Security-1 9.6% 100.0%
Security-2 13.5% 100.0%
Security-3 13.5% 100.0%
Security-4 3.8% 50.0%
Security-5 13.5% 100.0%
Security-6 7.8% 50.0%
Security-7 36.5% 26.3%
Security-8 7.7% 100.0%
Security-9 7.8% 50.0%
Security-10 1.9% 100.0%
Security-11 25.0% 84.6%

Of the 53 applications, we were able to generate rules for 25 appli-
cations based on application installation (I) and application usage (U)
features. The set of all association mining rules is too large to present
in this paper; we therefore present those rules that have the largest
effect or are most interesting.
{I-Internet-6, I-Files-5} DecreaseReliability-Media-4
{I-Security-8, I-Internet-9} IncreaseReliability-Media-4
{U-Media-1, U-Files-5} DecreaseReliability-Media-4
{U-Office-2, U-Security-8} IncreaseReliability-Media-4
By construction, many feature combinations (i.e., antecedents) iden-
tified by association rules contained features (e.g. I-Files-5, U-Secu-
rity-10) that already show a relationship with application reliability
based on results from logistic regression. Besides such trivial feature
combinations, association rules also identified feature combinations
involving features that individually do not show a correlation with
application reliability, e.g. {I-Office-2, I-Security-10} Increas-
eReliability-Files-2.
In addition, association rules identified the overall relationship of
feature combinations with application reliability; specifically, when
features involved in a combination had opposing relationships with
application reliability when considered in isolation (as identified by
logistic regression). For example, logistic regression suggested that
the reliability of Internet-14 increases with the installation of Office-
2 and decreases with the installation of Files-5. However, the rule {I-
Office-2, I-Files-5} DecreaseReliability-Internet-14 suggested
that the reliability of Internet-14 decreases when both Office-2 and
Files-5 were installed. Further, in the 277 rules with application in-
stallation and usage features, features corresponding to 21 applica-
tions (out of 53 apps) appeared as part of antecedents.
Collectively, these observations suggest that combinations of fea-
tures can affect application reliability even when features involved
in a combination do not affect application reliability in isolation.
In our study, application reliability also depends on combina-
tions
of features.
6. DISCUSSION
6.1 How can applications affect each other? The first and foremost question is: Why and how does an individual
application affect another application after all? Shouldn’t the operat-
ing system protect applications from influencing each other? In prin-
ciple, yes. However, an operating system should also enable appli-
cations to cooperate with each other. Consider sharing resources: If
two applications A and B share the same library C, and installing A
updates C to fix the latest security issues, such an update may well
trigger a bug in B that was previously masked. A similar situation
can occur with registry entries that are shared by multiple applica-
tions (this is by design in many cases, allowing applications to be-
come aware of each other and interact effectively). On Windows,
several applications come with their own drivers and kernel exten-
sions; security applications, as discussed above, hook in deep into
the system. A games application taking control of the video hardware
may change display resolution or prevent other applications from ac-
cessing the display—situations that other applications must be resil-
ient to.
In this study, we did not investigate individual interferences. First of
all, we suffer from a lack of more detailed usage profiles: We simply
do not know how specific applications are being used, except for
launches and failures—and this lack of knowledge is probably a
good thing. Likewise, we do not know how applications failed; we
have no logs, stack traces, or like diagnostic information, nor can we
debug third-party binaries.
In a well-designed and developed application, none of these issues
should matter. But as the number of applications on a system grows,
so do the possible negative influences.
6.2 Implications of this work What we see in this study is that the reliability of an application can
depend on factors that are not under control by application develop-
ers. This implies that assessing the reliability of an application in a
single, well-defined context may produce an incomplete and inaccu-
rate estimate of its real world reliability. This consequence affects the following fields:
Testing is the most frequently used method to assess reliability.
System testing is normally conducted in well-defined environ-
ments, such as an operating system installation out of the box.
Our results imply that testing should place a special focus on real
machines with different software configurations and usage pro-
files, in order to identify possible interferences from third-party
applications and shared resources such as the Windows registry.
Unfortunately, these additional demands on diversity further in-
crease the complexity of system testing.
Figure 3. Impact on application reliability
for installation only (no further usage)
Figure 4. Impact on application reliability
for installation and frequent usage

Application design must consider interdependences between
applications more thoroughly. At one end, the design could re-
duce interdependences by keeping resources private. At the other
end, the design could allow interdependences by sharing re-
sources under well specified and honored contracts. How to
specify such contracts at the system level is an open research is-
sue.
Operating system design will have to establish and enforce
even stricter rules concerning interoperability of applications.
This requires that such rules can be set and then checked for con-
formance; it may also mean that future applications be either
much more limited or else much more explicit in the ways they
integrate in the system.
Reliability estimation and modeling has been an active area of
research for many years [13], but to date has not included factors
related to additional software installed and used on the same sys-
tem in its models. Including such variables will likely lead to
improved estimates and better statistical models.
Further research is needed to explore ideas for better organized
ecosystems with clear, enforceable, rules such that applications
coexist better. How do we specify this? Who enforces the rules?
Who should be “in charge” of the computer, vendors or users?
All in all, there are plenty of challenges for systems and software
research.
6.3 Don’t we know all this? One common misinterpretation of empirical studies is that nothing
new is learned. However, such wisdom has rarely actually been
shown to be true and is often quoted without scientific evidence. This
paper provides such evidence: Most common wisdom is confirmed
(e.g., “Less powerful hardware can lead to lower reliability”) while
some may come as a surprise (e.g., “The reliability of security appli-
cations is affected by most non-security applications”).
Another frequent misconception is that empirical research within one
context (in this case, applications running on Windows) is not good
enough, provides little value for the academic community, and does
not contribute to scientific development. Historical evidence shows
otherwise. Flyvbjerg provides several examples of individual cases
that contributed to discovery in physics, economics, and social sci-
ence [14]. Beveridge observed for social sciences: “More discover-
ies have arisen from intense observation than from statistics applied
to large groups” (as quoted in Kuper and Kuper [15], page 95).
Please note that this should not be interpreted as a criticism of re-
search that focuses on large samples or entire populations. For the
development of an empirical body of knowledge as championed by
Basili [16], both types of research are essential.
6.4 Threats to Validity As with any empirical study, there are a number of threats to validity
that must be discussed so that consumers of the study are aware of
any caveats and are not misled.
Some applications are more frequently installed than others. As we
have shown, there clearly are many relationships between the instal-
lation or usage of one application and the reliability of another. The
more diverse the application profiles of the machines that an appli-
cation is installed on, the more accurate the picture is. For applica-
tions that are not installed on as many machines as others, we may
not identify relationships. Concretely, if application A is never in-
stalled on the same machine as application B, we will not be able to
determine if there are reliability effects between the two. The same
is true of hardware effects, if application C is only installed on ma-
chines with faster processors, then we are unable to determine the
effect of processor speed on the reliability of C. This threat is miti-
gated to some degree by the conjecture that if these factors never (or
rarely) occurred in our data set, then even if there are reliability ef-
fects between them, they would not affect many users, since few us-
ers actually have both on their systems.
The previous conjecture holds if our sample is representative of the
actual population of Windows users throughout the world. Our da-
taset consisted of close to 372,000 observations, the size of samples
specific to each application ranged from 1,500 to 200,000 with a me-
dian of 15,000. While this is a reasonable sample size, it is still only
a small slice of total usage and it may not be representative of the
actual population of Windows users. This threat could be mitigated
by repeating the experiment with different data sets from the same
population and averaging the results from these experiments.
Certain combinations of applications may more frequently occur on
machines that are already unstable. For example, one common prac-
tice of users who are considered “hard core gamers” is a technique
referred to as “overclocking” [17]. This entails increasing the pro-
cessor speed beyond its specifications and can cause the machine to
become unstable, leading to processor errors and application or sys-
tem crashes. Such practices would occur more frequently on ma-
chines with games (especially CPU intensive games) installed than
those without, which could lead to the conclusion that a particular
game affects reliability when in fact the usage of the game is a proxy
for user behavior that leads to decreased reliability.
Similarly, the presence of some applications may be indicative of
other applications that were not prevalent enough to be included in
our study. For instance, the use of file sharing apps may lead to in-
stallation of low quality software from less reputable sources. The
presence of the application may act as a proxy for some unobserved
factor; in this case, the presence of additional software that decreases
the reliability of other apps.
The data corresponding to less powerful hardware may stem from
older machines. Consequently, system age (both in terms of hard-
ware and software) could be a latent factor that affects application
reliability, e.g. low reliability of an old hard drive could be the cause
of low application reliability and not the small size of the hard drive.
We have not accounted for such latent factors as we do not have the
data for system age.
7. RELATED WORK Ours is by no means the first to examine software reliability; it has
been studied from various viewpoints and for various reasons for
decades [18] [19], and a vibrant research community has developed
around the topic [20]. Empirical approaches to measuring software
reliability hearken back to John Musa’s data collection work in the
1970s [21].
Traditional software reliability research has focused mostly on in-
trinsic factors of the software. For example, Fosdick and Osterweil
provide a survey of the ways that dataflow methods can be applied
to software reliability [22]. Littlewood built models of reliability
based on the modular structure of a piece of software and the transfer
of control between modules [23]. Chen et al. found that the method
of testing software – random test selection, structural test selection,
or coverage based test selection – has a dramatic effect on software
reliability estimates [24]. Goseva-Popstojanova et al. empirically
evaluated architecture based software reliability modeling on GCC,
an open source compiler, and found that such reliability modeling
can be quite accurate, provided that enough data has been collected
and the decomposition of the system into components can be deter-
mined [25]. These and similar software reliability approaches and
studies focus on the software itself as the source of the reliability

problem, while we examine an opposite, but complementary, view
that extrinsic factors are also critical and should not be ignored when
considering reliability.
Reliability has been empirically examined from a hardware perspec-
tive at scale. In a recent study of a million PCs, Nightingale et al.
presented the first large scale hardware failure rate analysis [26].
They were able to identify hardware factors that affected system re-
liability both positively (underclocking and laptop use) and nega-
tively (high CPU utilization and prior history of crashing). Our work
is complementary in that our study comprises a large data set of users
and identifies factors (both software and hardware) associated with
application reliability.
The CEIP data has also been used to study reliability previously. Li
et al. examined factors that led to system unreliability, quantified by
the total number of system crashes and application hangs and crashes
(irrespective of which application), between pre- and post-release of
Windows [27]. They found that factors strongly related to system
reliability included whether the OS was pre-installed by an OEM, 32
vs. 64 bit versions of Windows, and locale. Further, they found that
these usage characteristics were markedly different between the Beta
and Release of Windows 7. We study software reliability at a more
fine grained level by paying attention to individual applications. The
goal of our work is not to single out specific applications as reliabil-
ity factors, but rather to show that application reliability is affected
by the presence of other applications.
8. CONCLUSION On a real system, application reliability is affected by its environ-
ment, with hardware and usage of other applications being signifi-
cant factors. Despite our best efforts, the reliability of our applica-
tions will thus be determined by factors that are not under our con-
trol. To put it with Sartre: L’enfer, c’est les autres—hell is other peo-
ple.
The major consequence of this work is that assessing the reliability
of an application in a single, well-defined context may produce an
incomplete and inaccurate estimate of its reliability in the real world.
This consequence affects many fields such as testing and verifica-
tion, application design, operating system design, and reliability es-
timation and modeling.
In the real world, a society is the aggregate of people living together
in a more or less ordered community. The applications and services
on a computer form such a society as well, where the applications
subject themselves to the given order, and where the operating sys-
tem acts as the ordering force. As programmers, we would like to
keep our freedom to have our programs do as they (and we) please.
Future application societies, however, will have to enforce that one
application’s freedom ends where another begins—such that the in-
terferences shown in this paper will be a thing of the past.
Acknowledgements. We thank the Windows team for their support in ac-
quiring and interpreting the CEIP data. Brendan Murphy, Sriram Rajamani,
Vince Orgovan, Thomas Ball, Juan Pablo Galeotti, Eva May, and Wolfram
Schulte provided valuable feedback on earlier revisions of this paper. An-
dreas Zeller was a visiting researcher at Microsoft Research when this work was carried out. Venkatesh-Prasad Ranganath was a researcher at Microsoft
Research, India, when this work was carried out.
REFERENCES [1] Programs Which May Interfere with Steam. 2011.
https://support.steampowered.com/kb_article.php?ref=9828-SFLZ-9289.
[2] List of applications incompatible with Kaspersky Anti-Virus 2012. 2011. http://support.kaspersky.com/faq/?qid=20828435.
[3] Windows Customer Experience Improvement Program. 2011. http://technet.microsoft.com/en-us/library/ee126127(WS.10).aspx.
[4] Fleiss, J.L. Measuring nominal scale agreement among many raters. Psychological Bulletin, 76 (1971), 378.
[5] Landis, J.R. and Koch, G.G. The measurement of observer agreement
for categorical data. Biometrics (1977), 159--174.
[6] Dowdy, S., Wearden, S., and Chilko, D.M. Statistics for research.
Wiley New York, 1983.
[7] Benjamini, Y. and Hochberg, Y. Controlling the false discovery rate: a practical and powerful approach to multiple testing. Journal of the
Royal Statistical Society. Series B (Methodological), 57, 1 (1995), 289-
300.
[8] Heckerman, D., Chickering, D., Meek, C., Rounthwaite, R., and Kadie,
C. Dependency Networks for Collaborative Filtering and Data
Visualization. In Proceedings of the Sixteenth Conference Annual Conference on Uncertainty in Artificial Intelligence (UAI-00) (2000),
264-273.
[9] Neuhaus, S. and Zimmermann, T. The Beauty and the Beast: Vulnerabilities in Red Hat’s Packages. In Proceedings of the USENIX
Annual Technical Conference (2009).
[10] Bird, C., Gourley, A., Devanbu, P., Swaminathan, A., and Hsu, G. Open Borders? Immigration in Open Source Projects. In Proceedings
of the 4th International Workshop on Mining Software Repositories
(2007).
[11] Agrawal, R. and Srikant, R. Fast Algorithms for Mining Association
Rules in Large Databases. In VLDB '94: Proceedings of the 20th
International Conference on Very Large Data Bases (1994), 487-499.
[12] ARules. http://r-forge.r-project.org/projects/arules/.
[13] Farr, W. Software reliability modeling survey. In International
Symposium on Software Reliability Engineering (1996).
[14] Flyvbjerg, B. Five misunderstandings about case-study research.
Qualitative inquiry, 12, 2 (2006), 219-245.
[15] Kuper, A. and Kuper, J. The Social Science Encyclopedia. Routledge, 1985.
[16] Basili, V.R., Shull, F., and Lanubile, F. Building knowledge through
families of experiments. IEEE Trans. Software Eng., 25, 4 (1999).
[17] Wanniner, S. and Richmond, R. The Book of Overclocking. No Starch
Press, 2003.
[18] Gray, J. Why do computers stop and what can be done about it. In Symposium on reliability in distributed software and database systems
(1986).
[19] Musa, J. Software Reliability Engineering. Osborne/McGraw-Hill, 1998.
[20] Marathe, M. and Cukier, M. In Proceedings of the IEEE 21st
International Symposium on Software Reliability (2010).
[21] Musa, J.D. A Theory of Software Reliability and Its Application. IEEE
Transactions on Software Engineering, 1, 3 (1975), 312--327.
[22] Fosdick, L.D. and Osterweil, L.J. Data Flow Analysis in Software Reliability. ACM Computing Surveys, 8, 3 (1976), 305--330.
[23] Littlewood, B. Software Reliability Model for Modular Program
Structure. IEEE Transactions on Reliability, R-28, 3 (1979), 241--246.
[24] Chen, M.-H., Mathur, A.P., and Rego, V.J. Effect of testing techniques
on software reliability estimates obtained using a time-domain model. IEEE Transactions on Reliability, 44, 1 (1995), 97--103.
[25] Goseva-Popstojanova, K., Hamill, M., and Perugupalli, R. Large
Empirical Case Study of Architecture-Based Software Reliability. In Intl. Symposium on Software Reliability Engineering (2005), 43-52.
[26] Nightingale, E.B., Douceur, J.R., and Orgovan, V. Cycles, cells and
platters: an empirical analysisof hardware failures on a million consumer PCs. In EuroSys (2011).
[27] Li, P.L., Kivett, R., Zhan, Z., Jeon, S.-e., Nagappan, N., Murphy, B.,
and Ko, A.J. Characterizing the differences between pre and post release versions of software. In International Conference on Software
Engineering (2011).