extreme political views and determinants of popularity€¦ · · 2015-11-02extreme political...
TRANSCRIPT

47 Boya and Malizard, International Journal of Applied Economics, 12(2), September 2015, 47-70
Extreme Political Views and Determinants of Popularity
Christophe Boya and Julien Malizard*
University of Montpellier, France
Abstract: In this paper, we determine an econometric model to determine variables which
influence the popularity function. We focus our attention on extreme political views, this is
right populist and left communist in the French case. Europe is well known to show important
electoral results for extreme parts since the 1990’s. The goal of this paper is to introduce new
variables out of the political-economy space. So, we try to use subjective data and especially,
household confidence and security variables. Our cointegration model shows significant results
for these variables both for the long and short run.
Keywords: French Political System, Right Wing Populism, Left Wing Communism, Error
Correction Model, Popularity.
JEL Classification: C22, D72
1. Introduction
The analysis of the French electoral results of the past twenty years has shown the growth and
consolidation of movements such as right wing populism and left communism.
The first one is a far right1 current and cannot be dissociated from its xenophobic components
and its nationalistic discourse (Ivaldi, 2002). The second movement, referred to as the left
communism or radical left, and it is founded on an anti-capitalist or anti-liberal culture
(Raynaud, 2006).
The right wing populist is represented by the Front National (FN, National Front) and its
founder, Jean-Marie Lepen. In 1999, a clash occurring. It involved the creation of the
Mouvement National Republicain (MNR, National Republican Movement), which was led by
the former second in command of the Front National, Bruno Megret. However, this new party
never succeeded in having the same political influence as its counterpart.
The left communism appears to be more divided, with a multitude of parties that claim to
support, and gather around, variations on communist ideologies (Reynie, 2007). First, the Parti
Communiste Français (PCF, French Communist Party) is the oldest having been formed at the
end of World War II (national secretary: Marie Georges Buffet). The PCF draws its inspiration
from Stalinism (Reynie, 2007). Then, one can distinguish two Trotskyists currents, Lutte
Ouvriere (LO, Led by Arlette Laguiller2) and the Ligue Communiste Revolutionnaire (LCR,
Leader: Olivier Besancenot, Revolutionary Communist League3). One can notice, the Parti
Ouvrier Independent (POI, ex Parti des Travailleurs, Independant Worker Party4). These two
currents of thoughts, resting on opposite ends in the political arena have significant electoral
weight, as demonstrated by the results of the presidential elections between 1974 and 2007 (see

48 Boya and Malizard, International Journal of Applied Economics, 12(2), September 2015, 47-70
table 1). The analyses of the first ballot of the French presidential elections have shown the
consistent progression of support for the right wing populist.
The candidate of the Front National indeed pass from 0.7% in 1974 to around 15% in 1988 and
1995 to reach 16.86% in 2002. If one counts the candidature of Bruno Megret to the head of
the MNR in 2002, the far right actually gets a cumulated score of 19% of voter support.
The left communism has built itself around a double phenomenon: first, the steady decline of
voter support for the PCF in the major elections, and second the PCF has been experiencing a
shift from its historical communist roots to its current Trotskyist forms (Reynie, 2007). The
radical left obtains a score of 17.6% in 1981, largely dominated by the PCF5 (taking 15.3% of
the total), with the LO claiming 2%. In the 1988 election, the left communist gained 9% of
voter support, while the PCF represented only 6.7%, and the LO 2.3%. However, in the 1995
and 2002 elections, the cumulated results of all of the left communist parties totaled
approximately 14%. At this point, we see there was strong rise of the Trotskyist movements at
the expense of the PCF.
The good electoral results of the national populist are equally observed in several Western
European countries6, such as Denmark, Norway, the Netherlands, Austria, Italy, and Belgium.
In the municipal elections of 2000, the Vlaams Blok received 33% of the vote compared to
1994 in which they received 28%. In Danemark, the Dans Folkeparti received 12% during the
legislatives elections of 2001. In Norway, the elections of 2001 marks the rise of the far right
party (Fremskrittspartiet) as being the third most popular party after the center right and center
left. Finally, the FPO of Jorg Haider received 26.9% of the vote in the Austrian parliamentary
elections of 1999. An increasing presence of the left communist can be observed at this same
time. In 2003, the parliamentary elections of Scotland in 2003 revealed the growth of the
Scottish Socialist Party who received 7.68%, compared to their 1.01% in 19997. In Germany,
the parliamentary elections have also shown the amelioration of the Partei des Demokratischen
Sozialismus (PSD) from 4% in 2002, to 8.7% in 2005. In addition, the fusion of the PSD and
the Wahlalternative Arbeit und Soziale Gerechtigkeit (WASG) gave birth to the party Die Linke
(the left), a party that received 8.4% of the vote in one of Germany’s regional elections.
Our article examines the growing importance of electorate of the communists and the populist
movements, and the determinants for their increase in popularity, for the French case. Our study
is divided in six sections. Following this introduction, the second section provides a literature
review of the functions of popularity in economics and secondly, it offers literature to explain
the importance of this current study. The third section focuses on the political and theoretical
underpinnings of the popularity of these movements. The fourth section describes the data used
in our application and explains the method that we have used. Subsequently, in the fifth section,
we present our results and offer some interpretation. The last section concludes the article.
2. Literature Review
Many political-economic models have been developed since the 1970’s. The literature has
investigated the influence of economic data either on the vote8, or on the popularity of
politicians (Goodhart and Bhansali, 1970 and Mueller 1970). The conclusions show that these

49 Boya and Malizard, International Journal of Applied Economics, 12(2), September 2015, 47-70
agents are responsible for economic outcomes: it is the hypothesis of government responsibility.
The popularity has been studied extensively, in France and foreign countries. These studies aim
to combine political popularity (either a party or a politician, usually a member of the executive)
to economic variables (specifically, unemployment and inflation) to suggest that poor economic
performance are associated with a decline in popularity (Borooah and Borooah, 1990 for
Ireland; Neck and Karbuz, 1997, for Austria; Veiga and Veiga, 2004 for Portugal or Abrams
and Butkiewicz, 1995, and Swank, 1990 in the United States).
In France, the political system is a presidential system keeping the fundamental principles of a
parliamentary system. The President is elected by direct suffrage in a two ballot majority poll,
and take charge the Foreign Policy and the Defense. He appoints the Prime Minister which
presides the council of Ministers and decides on the policy of France. Traditionally, the
President and the Prime Minister are from the same political side. When the opposite occurs,
we speak about cohabitation (Auberger and Dubois, 2005, provide a large literature review
about the French Political System and cohabitation).
Lewis-Beck (1980) indicates that President Giscard d’Estaing was less popular than General de
Gaulle because of deteriorating economic conditions. This is supported by Lecaillon (1980).
Moreover, the Prime Minister is also held responsible, but he is considered to have been a
scapegoat and that he shielded the President of the Republic (Capron, 1987). According to
Vasilatos and Hibbs (1983), inflation has no significant influence on the popularity of
Presidents Pompidou and Giscard d’Estaing and conclude that the importance of the real
economy with respect to nominal conditions. Lafay (1989) uses as an independent variable, the
importance of the opposition and assumes that when the trust in the government decreases, trust
in the opposition increases. This explains the failure of the socialist government in 1986 and
the seizure of power of the right. Courbis (1995) and Lewis-Beck (1997) suggest that the Prime
Minister is in charge of economic policy, especially during periods of cohabitation. Dubois
(2005) provides an exhaustive literature review of the popularity of the prime minister; he
estimates a popularity function for which only unemployment appears robust. The literature has
also been interested in the right populist. These works focus on European countries where right
movements have become increasingly important. Kitschelt (1995) identifies the combination of
two factors: the economic policy of neo-liberalism on one hand, and socio-political and cultural
nationalistic authoritarianism on another hand. Kitschelt suggests that these two variables
explain the success of far right in Europe. Jackman and Volpert (1996) focus their analysis on
European countries between 1970 and 1990. They retain the explanatory variables such as
unemployment, electoral thresholds9 and the multiparty system using a Tobit approach. Their
results show that high unemployment combined with multi-party systems promotes far right
parties, and that their popularity is not due to high electoral thresholds. Betz (1994) notes, the
success are due to structural changes affecting the global economy. Esping-andersen (1999)
concludes that globalization, as a form of economic change, leads to modernization and is also
likely to lead to social tension. These studies underscore the importance of economic changes
in the far right vote.
50 Boya and Malizard, International Journal of Applied Economics, 12(2), September 2015, 47-70
In regards to France, Jerome and Jerome Speziari (2003) built a model of voting that reveals
that the FN has better results in regions most affected by the economic crisis. That is, when the
unemployment rate is higher in a region than the national average, scores of FN are better in
that region. They also show that the electorate of conservative tends to slide to the FN because
it wants to punish its policy of immigration and insecurity. Jerome and Jerome Speziari (2004)
construct a model to explain the vote in 2002 presidential elections, using several variables
including the change in regional unemployment rate, a dummy variable concerning regional
partisan membership, popularity of the majority leader, and the results of previous elections.
Nevertheless, the initial results of the authors were incorrect. The authors predicted the victory
of the candidate of the left in the second ballot of the presidential election leaving no room for
the candidate of the far right. Their error of prediction is partly due to the very high score of the
FN during the first ballot. Indeed, part of FN voters is former left party supporters. Fauvelle-
Aymar and Lewis-Beck (2005) find that the populist electorate is committed, partisan and so it
overlaps a portion of the conservative right. Thus, the program of the national populist is
characterized to be an extension of the radical ideas of the traditional right. Lewis-Beck and
Mitchell (1993) and Elgie (2004) notes that some very conservative members of the mainstream
right are closer to the ideology of the center right (UDF10).
The right populist has the power to harm the right traditional. Fauvelle-Aymar and Lewis-Beck
(2005) indicate that the strategies of coalitions led by the traditional left lead to a reduction in
the populist vote. However, this is not the case when the traditional right joins its strengths. The
authors also suggest that some voters from left parties are attracted by the rhetoric of the far
right on the defense of workers (leftist-Lepenism gaucho-lepenisme, Mayer, 2002). Dubois
(2007) points out that the far right poses a serious challenge to models explaining the vote for
the left or vote for the opposition, especially if they are used for forecasting (p . 253).
Auberger (2005) develops a model of voting in European elections using a combination
economic variables and political factors11. His approach is built according to the following
hypothesis: people vote more for the far right if they are dissatisfied with the economic situation
and vice versa. The author predictions are quite good as he anticipates 10.2% of the vote for the
far right, and FN wins 10% in metropolitan France. However, the application of this method to
the far left is more delicate and cannot give satisfactory results. Auberger (2008) uses the rate
of change of job seekers and the rate of participation in elections. The author demonstrates that
the growth in the number of jobseekers at the departmental level increases the vote for the FN,
unlike the participation rate. Other models also focus on changes and political problems that
have occurred in the last thirty years. The European process of integration is accused of
reducing the national power in favor of strong competition (Scharpf, 1999). This process results
in a wave of privatization, the abolition of public monopolies and lower tariff barriers. This
combination of factors has enabled industries to relocate and opened spaces previously
sheltered from international competition (Held, 1999). These major changes produce a
radicalization of the electorate that gave massive benefits to the national populist current. Della,
Porta and Meny (1997) note that several European countries12 have experienced corruption
scandals in the 90’s which led to a loss of credibility of the parties of power. Therefore, these
events benefit to currents such as the Front National in France (Kitschelt, 1995; Rydgren, 2005).

51 Boya and Malizard, International Journal of Applied Economics, 12(2), September 2015, 47-70
In this case, voting for radical parties is more a challenge vis-a-vis the traditional parties than
an actual acceptance of the ideas of these movements.
Finally, we must mention the role of immigration as a determinant of the populist vote. Knigge
(1998) analyzes the evolution of six European countries from 1984 to 199313. The author takes
into account the economic conditions (unemployment), social (migration) and political
(dissatisfaction caused by politics decisions). The results show that unemployment is not
directly associated with the radical vote, in contrast to the increase of immigration and
discontent concerning the politics. Thus, these movements everywhere in Europe are fed by
social and political difficulties (Brug, Fennema and Tillie, 2000). Ivaldi (2002) introduces in
his analysis a variable for overall criminality and brought back the variable of immigration.
Criminality is not sufficient by itself to explain the development of this movement unlike
immigration. Laurent (2004) notes that, the electorate of the national populist is higher in the
border departments where the immigrant population is larger. Bonnetain (2004) tests the
hypothesis that the electoral behavior reflects the socio-economic differences in the various
departments and French cities in 2002. Bonnetain’s research suggests that the radical vote is
the strongest in areas where there is a high unemployment rate. He also indicates the positive
impact of the increase of foreign population, and the insignificance of the crime rate. Bonnetain
interprets this result in two ways: either the rate does not reflect the degree of insecurity felt by
individuals or crime does not affect the electoral scores of populist parties.
3. Foundations
3.1. Political Foundations
French political life is not based on a bipartisan political system. France distinguishes the two
major political parties in power, from opposing currents: on the left, the Parti Socialiste (PS);
on the right (conservative part) Union pour un Mouvement Populaire (UMP), former
Rassemblement pour la Republique (RPR). Besides these main streams, there is the a centrist
party, represented by the Union des Democrates (UDF) which has often leaned towards the
right, as evidenced by the presence of centrist ministers in governments led by the RPR (1986,
1993). Les Verts and the PCF comprise part of the left wing of the political spectrum, to which
we add the PRG (Parti Radical de Gauche), who have a center left tendency. The latter have
agreed to participate in secondary government functions. This was the case in 1981 (PS and
PCF) and 1997 (Left plural: PS, PCF and les Verts). Finally, we find the national populist with
the FN and the left Trotskyist with the LO, LCR and the POI. These parties have never
participated in any governmental coalition.
Ivaldi (1999, 2002) explains that the reasons for the success of the far right are due to global
conditions and a combination of factors political, economic and social, where the issues relating
to criminality, delinquency and urban violence have acquired a prominent place in recent years.
According to Bonnetain (2004) the far right is identified by a program focusing on four primary
objectives: tax burden, unemployment, crime and immigration. The author indicates that this
program proposes to cut taxes, phase out the income tax and social taxes. On security14, the far
right suggests the restoration of capital punishment and zero tolerance on crime. Immigration

52 Boya and Malizard, International Journal of Applied Economics, 12(2), September 2015, 47-70
must be stopped by strengthening border controls. It also stresses that the national populist will
amend the constitution to give priority to employment, housing and healthcare for the French
native people. Finally, the author shows that the electorate consists of those most economically
vulnerable. They are attracted by this movement because it aims to protect the domestic market
from international competition, which is regarded as the main cause of unemployment and
lower wages.
For Evans and Ivaldi (2002), these movements base their economic program on liberal lines,
related to the defense of national social systems. Traditional political parties have been unable
to provide responses to embarrassing topics such as crime, immigration and insecurity. Thus,
their political credibility has declined in favor of the far right which uses populist speeches that
denounce the proposals of the center left and center right15, the demonization of which the FN
leader feels aggrieved, and the struggle of the small ones against the big ones (Birnbaum, 1995).
In France, the FN has never participated in any government, which inevitably defines it as a
current purely rebellious party. However, this is not the case in some European countries where
the national populist has held in power. This was the case in Austria with Haider’s FPO and in
Italy with the far right Lega Nord of Umberto Bossi and Alleanza Nazionale (ex-fascists) in the
government of Silvio Berlusconi.
The electoral success of the left communist is also linked to economic, social and political
conditions. This movement is nourished by the difficulties of the labor market and declining
moral of French people in order to attack and weaken the government’s position. It rejects
modern capitalist economic structures, as well as their values and practices. It also offers a
vision of an international network of workers. These different streams share a distrust of
institutions coupled with an ideology that rejects capitalism and advocates for a socialist
democracy. Heartfield (2003) indicates that anti-capitalism leads to anti-globalization and an
international anti-imperialism. These movements base their campaign on a populist element as
do their counterparts of the right, which is to denounce the exploitation of weak workers who
are dominated by the capitalists (Lazar, 1997). In the communist tradition, they finally call for
a better redistribution of resources and the membership to economic and social collective rights
(March and Mudde, 2005). For this, they propose the reduction of working time in order to
reduce unemployment and heavily tax the profits of large firms. In France, the PCF stands out
from other communist currents by its alignment with the center left. Its presence in government
has undoubtedly undermined its radicalism. This is surely a reason for its loss of credit in favor
of revolutionary currents. It nevertheless remains the historical party.
3.2. Theoretical Foundations
The theoretical models of the popularity of political parties are generally based on optimizing
the behavior of voters on the assumption that they are rational actors (Downs, 1957, Kramer
1971 and Nordhaus, 1975). The popularity of political parties is explained by all the variables
that best reflect the concerns of citizens. Each agent j (j = 1, ..., n) tries to maximize its utility
function or minimize its disutility function in an area determined by the political and economic
variables. Each voter has an optimal position in this space 𝑧𝑗∗ is formalized such as : 𝑧𝑗
∗ =
arg max 𝑈𝑗(𝑥) (Neck et Karbuz, 1997).

53 Boya and Malizard, International Journal of Applied Economics, 12(2), September 2015, 47-70
In order to take into account previous results of the literature and also study programs and
ideology of the movements studied, we extend the analysis by introducing new variables that
seem particularly crucial to the popularity of these movements. In this, lies the originality of
this article. To support our argument, we first use economic and political variables
(unemployment and popularity, respectively) that have been widely adopted in literature. In
line with past studies, we assume that the deteriorating economic conditions favor the popularity
of radical currents.
Following this, we introduce security and socio-economic data. The security data is similar to
the analytical framework of Ivaldi (2002), but we do not use the same criminality variable
(crimes and violent offenses) because people may confuse it with organized crime and thus not
feeling directly concerned. We prefer to use a more concrete variable in its conception by
individuals represented by petty crime by referring to attacks on property16. We want to
examine the significance of this information in response to the results of Bonnetain (2004). We
are inclined to think that insecurity is a crucial factor in the popularity of the national populist.
Finally, under the socio-economic theme, we do not use any data of immigration (Knigge, 1998)
because it is diffcult to obtain monthly data over a long period. Far right and Radical left exploit
to their advantage the increasing social discontent. We selected a subjective variable
constructed from surveys of French people moral taking into account the opinion about the
standard of living, financial condition and consumption. Dubois (2007) indicates in his review
of literature that the use of subjective variables are relevant in the politico-economic models.
The space 𝑧 determines the optimal position of an agent according to political and economic
variables, but also of socio-economic and security variables. The utility obtained by party
𝑖(𝑖 = 1, … , 𝑘) is :
𝑈𝑗𝑖 = 𝑓𝑗(𝑧𝑒,𝑡) (1)
Where 𝑓𝑗(𝑧𝑒,𝑡)is the perception function of the agent at time 𝑡, this function depends on all
variables 𝑧 with 𝑒 = 1, … , 𝑚 designating the others variables of space 𝑧. At 𝑡, the choice of the
agent for another party is made by the comparison of the utility of each camp. The agent will
choose the party for whom its utility is maximized. For example, for the party 𝑖, we get:
𝑈𝑗𝑖 > 𝑈𝑗
𝑜𝑡ℎ𝑒𝑟 𝑝𝑎𝑟𝑡𝑦 (2)
In our model, the function of popularity is based on utility functions. In this way, the popularity
for the studied movement is obtained by aggregating:
𝑝𝑜𝑝𝑢𝑙𝑎𝑟𝑖𝑡𝑦 𝑡𝑖 = ∑ 𝑈𝑗
𝑖𝑛𝑗=1 (3)
The decision to choose the agents for a party is not made only on the variables at a time 𝑡.
They often take into account the past in their present decisions (retrospective behavior). The
extension of the model is made in the dynamic framework with a continuous over a period
defined in an interval∀𝑡 ∈ [0; 𝑇]. In addition, the memory effect is introduced with a

54 Boya and Malizard, International Journal of Applied Economics, 12(2), September 2015, 47-70
depreciation rate of the past, 𝑒𝑥𝑝𝜇𝑡 (Nordhaus, 1975). In this case, the popularity of party 𝑖 for
the agent 𝑗 becomes:
𝑝𝑜𝑝𝑢𝑙𝑎𝑟𝑖𝑡𝑦 𝑗,𝑇𝑖 = ∫ 𝐻𝑗(𝑧𝑡, 𝑡)𝑒𝑥𝑝𝜇𝑡𝑑𝑡
𝑇
0 (4)
Where 𝐻 denotes the evaluation function of the agent 𝑗 at time 𝑡. We limit ourselves to this
simple theoretical analysis.
The linear specification of the theoretical model provides an empirical model with the function
of popularity of the party 𝑖 at time 𝑡:
𝑝𝑜𝑝𝑢𝑙𝑎𝑟𝑖𝑡𝑦 𝑖,𝑡 = 𝜆. 𝑝𝑜𝑝𝑢𝑙𝑎𝑟𝑖𝑡𝑦 𝑖,𝑡−1 + (1 − 𝜆)[𝛽𝑖,0 + ∑ 𝛽𝑖,𝑒𝑍𝑒,𝑡𝑚𝑒=1 ] + 𝑢𝑖,𝑡 (5)
Where 𝑖 = 1, … , 𝑘 the number of parties equals 𝑘; 𝜆 the weight of the memory effect, with 0 <
𝜆 < 1 and 𝑒 = 1, … , 𝑚 a set of explanatory variables. Under the condition that the combined
parts of the parties’ popularity are 100%, three restrictions on the parameters and residuals are
deducted:
∑ 𝛽𝑖,0 = 100𝑘𝑖=1 (6)
∑ 𝛽𝑖,𝑒 = 0𝑘𝑖=1 (7)
∑ 𝑢𝑖,𝑡 = 0𝑘𝑖=1 (8)
The demonstration is easy as soon as we make the hypothesis that the value of 𝜆 is the same for
all parties. This simple theoretical framework can be extended by introducing several lags for
different variables, which will be the case in our application.
4. Empirical Application
4.1. Data
The analysis period of our article begins in December 1998 and ends in April 2008. This period
cannot be extended because we do not have security data before that date. Moreover, the French
database for unemployment is different since 2009. Consequently, it could involve wrong
results if we mix the two different bases. The frequency is monthly, which provides us with 113
observations. Let us note, however, that the number of observations is large enough that the
econometric results are not distorted.
For the political variable, we consider the brute data of popularity rates17 of the FN and PCF
parties (see Figure 1). These rates are provided by opinion surveys of the TNS-Sofres. Data on
other left communist parties such as the LCR and LO do not exist18.
The selected economic variables in the first models in the literature are macroeconomic data
such as unemployment, prices, and incomes. However, these variables are abandoned due to
multi-collinearity. Subsequently, the choice is oriented on unemployment (Jerome and Jerome
Speziari, 2004; Auberger and Dubois, 2003 or 2005).
55 Boya and Malizard, International Journal of Applied Economics, 12(2), September 2015, 47-70
Among the data set used in the literature, we choose the monthly unemployment rate from the
databases of the OECD19. The unemployment rate is a variable whose interpretation is clear to
agents, since they agree on the fact that it is better to have less unemployment than more20.
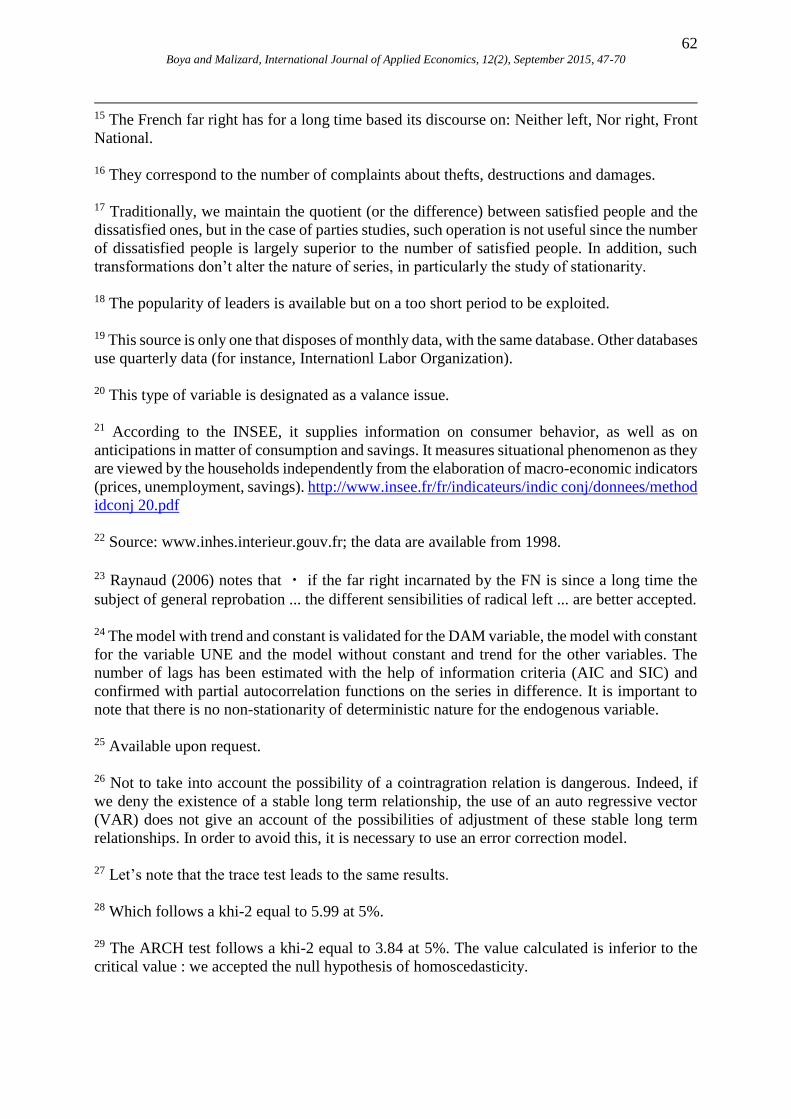
For the socio-economic variable, we introduce the Household confidence calculated by the
INSEE21 over a monthly period. Nevertheless, we predict that this variable reflects not only an
economic reality but also social realities since living standards and consumption are indicators
of the social scale and status. It is a subjective variable that provides a measure of the moral of
French households; it is calculated as the difference between agents who are con dent in the
broad sense (in the past, present and future) and those who are not. Thus, the presence of
negative values is possible as suggested in Figure (2). We note a general downward trend. It is
interesting to note the sharp decline from the second half of 2007 after a rebound during the
presidential elections.
For the security variable, we obtain data from the Ministry of Interior on different offenses22.
There are statistics on damage to property, damage to people and financial scams. Our choice
is made on damage to property which is the number of complaints due to thefts, destruction or
damage because it is the variable the least correlated with other variables as shown in Table (2)
mean harm to individuals (PHYS) are strongly correlated with the indicator of trust and
financial fraud (FIN) with unemployment. We believe that this variable has a greater impact on
the perception of crime by officers. Indeed, it designates the petty crime, likely to hit all
individuals. In the following analysis, DAM means damage property, UNEM the
unemployment rate, CONF the indicator of household confidence, ESC scams and PHYS
physical damages to individuals.
Table (3) presents the descriptive statistics of our variables. Let’s note that for variable DAM,
these data are in millions. FN relates the popularity of the Front National, PCF the one of the
communist party. The popularity of the FN is largely below that of the PCF. This is explained
by the fact that agents have on average more difficulties to declare themselves ideologically
close to the national populism than from the left communism23.
It seems also interesting to note that if the PCF has a popularity of nearly 27%, this does not
reflect the results of elections (national, at least).
The Dickey-Fuller test24, in level and first differences, shows the non-stationarity of the series.
They are first order integrated. There may still be a doubt about the unemployment variable;
therefore, we also used the tests of Phillips-Perron and KPSS (which tests the null hypothesis
of stationarity of the series). The results25 confirm in all cases those of the ADF test.
4.2. Empirical Model
The series have a unit root, and are therefore potentially cointegrated26. We check the existence
of cointegrating relationship among our variables by applying the test of the maximum
eigenvalue, proposed by Johansen. The test results are compiled in Table (4).

56 Boya and Malizard, International Journal of Applied Economics, 12(2), September 2015, 47-70
The null hypothesis tested is r = q against the alternative hypothesis r = q + 1 in which r is the
number of cointegrating relationship.
The first row of the table tests the hypothesis that there is at most zero cointegrating relationship
against the alternative hypothesis that there exists at least one of them. The null hypothesis is
rejected; there is at least one relationship. The second row tests the null hypothesis that there is
at most one cointegrating relationship against the alternative hypothesis that there are two. We
accept the null hypothesis, there are at least and at most one cointegrating relationship27.
We then estimate an Error Correction Model (noted ECM) of the following form:
∆𝐹𝑁𝑡 = 𝑐1 + ∑ 𝛽1∆𝐹𝑁𝑡−𝑖𝑘𝑖=1 + ∑ 𝛽2∆𝑃𝐶𝐹𝑡−𝑖
𝑘𝑖=1 + ∑ 𝛽3∆𝐷𝐴𝑀𝑡−𝑖
𝑘𝑖=1 + ∑ 𝛽4∆𝑈𝑁𝐸𝑡−𝑖
𝑘𝑖=1 +
∑ 𝛽5∆𝐶𝑂𝑁𝐹𝑡−𝑖𝑘𝑖=1 + 𝜌1�̃�𝑡−1 + 𝜀1𝑡 (9)
∆𝑃𝐶𝐹𝑡 = 𝑐1 + ∑ 𝜑1∆𝐹𝑁𝑡−𝑖𝑘𝑖=1 + ∑ 𝜑2∆𝑃𝐶𝐹𝑡−𝑖
𝑘𝑖=1 + ∑ 𝜑3∆𝐷𝐴𝑀𝑡−𝑖
𝑘𝑖=1 + ∑ 𝜑4∆𝑈𝑁𝐸𝑡−𝑖
𝑘𝑖=1 +
∑ 𝜑5∆𝐶𝑂𝑁𝐹𝑡−𝑖𝑘𝑖=1 + 𝜌2�̃�𝑡−1 + 𝜀2𝑡 (10)
Where 𝜌1�̃�𝑡−1 and 𝜌2�̃�𝑡−1 designate the terms of error correction (the one lagged residual) and
𝜀1𝑡 and 𝜀2𝑡 the errors, assumed to be uncorrelated between them.
In our model, we introduce the popularity of the PCF as predictor of FN (and vice versa) in
order to study the conjunct dynamic. Indeed, election results showed a radicalization of the
electorate that tends to project itself into the FN or the communist current. We want to examine
if this radicalization is without (or with) ideological current distinction.
We introduce damages to the property variable in the public popularity of the PCF. This choice
is justified because PCF has participated to different governments. It had had to take positions
on security measures inherent in any policy. Moreover, the left communism discourse is
radically opposed to the national populism on security issues, as it advocates prevention rather
than the reactive actions of the far right. The PCF program is known (prevention): Is its speech
relevant to the agents? Through the introduction of the indicator of insecurity, we want to
answer this question.
We use the information criteria of Akaike (AIC) and Schwarz (SIC) to determine the optimal
number of delays in the VAR. This is two since it is one that minimizes the information criteria
(see Table 5). We can turn now to the results and interpretations.
5. Results and Interpretations
Our approach describes the long-term relationship that exists between variables since we have
shown that they are linked by a cointegration relationship. The model also describes the
57 Boya and Malizard, International Journal of Applied Economics, 12(2), September 2015, 47-70
adjustment made to short-term relationship in order to obtain the long term relationship. This
is the subject of the sub-sections below.
We begin by specifying the expected signs in our results. Thus, we have the following system:
F N = +/ - P C F + DAM + U N E – CONF
P C F = +/ - F N + DAM + U N E - CONF
Regarding the dynamics of the parties, the expected signs are di cult to predict. Those on the
other variables are suggested by earlier works on unemployment and the political foundations
described above for damages to property and trust (confidence).
5.1. The long-Run Relationship
5.1.1. Results
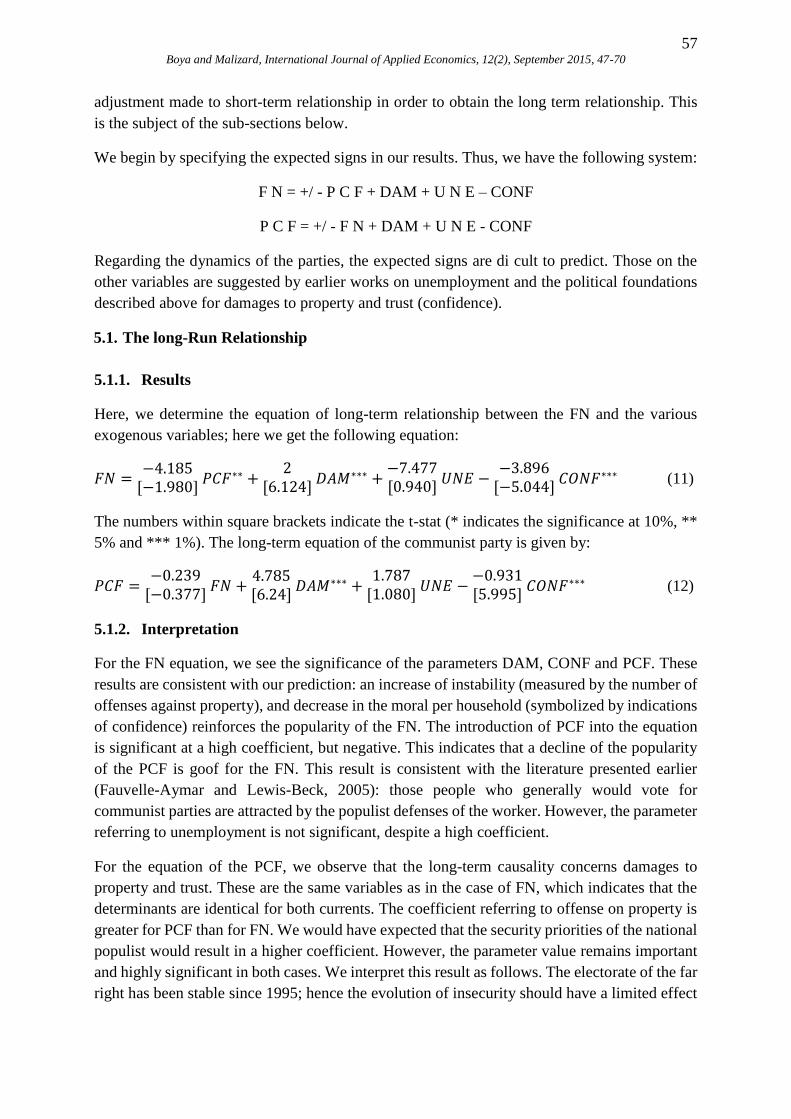
Here, we determine the equation of long-term relationship between the FN and the various
exogenous variables; here we get the following equation:
𝐹𝑁 =−4.185
[−1.980] 𝑃𝐶𝐹∗∗ +
2[6.124]
𝐷𝐴𝑀∗∗∗ +−7.477[0.940]
𝑈𝑁𝐸 −−3.896
[−5.044] 𝐶𝑂𝑁𝐹∗∗∗ (11)
The numbers within square brackets indicate the t-stat (* indicates the significance at 10%, **
5% and *** 1%). The long-term equation of the communist party is given by:
𝑃𝐶𝐹 =−0.239
[−0.377] 𝐹𝑁 +
4.785[6.24]
𝐷𝐴𝑀∗∗∗ +1.787
[1.080] 𝑈𝑁𝐸 −
−0.931[5.995]
𝐶𝑂𝑁𝐹∗∗∗ (12)
5.1.2. Interpretation
For the FN equation, we see the significance of the parameters DAM, CONF and PCF. These
results are consistent with our prediction: an increase of instability (measured by the number of
offenses against property), and decrease in the moral per household (symbolized by indications
of confidence) reinforces the popularity of the FN. The introduction of PCF into the equation
is significant at a high coefficient, but negative. This indicates that a decline of the popularity
of the PCF is goof for the FN. This result is consistent with the literature presented earlier
(Fauvelle-Aymar and Lewis-Beck, 2005): those people who generally would vote for
communist parties are attracted by the populist defenses of the worker. However, the parameter
referring to unemployment is not significant, despite a high coefficient.
For the equation of the PCF, we observe that the long-term causality concerns damages to
property and trust. These are the same variables as in the case of FN, which indicates that the
determinants are identical for both currents. The coefficient referring to offense on property is
greater for PCF than for FN. We would have expected that the security priorities of the national
populist would result in a higher coefficient. However, the parameter value remains important
and highly significant in both cases. We interpret this result as follows. The electorate of the far
right has been stable since 1995; hence the evolution of insecurity should have a limited effect

58 Boya and Malizard, International Journal of Applied Economics, 12(2), September 2015, 47-70
on the popularity of FN, which confirms the partisan nature of the electorate in the line of the
works of Fauvel-Aymar and Lewis-Beck (2005).
Regarding the CONF parameter, we show that the low trust of individuals has a positive and
significant impact on the popularity of the two parties studied. This supports the common belief
that the current of national populism and radical left feed and take advantage of social
difficulties. However, the coefficient is higher for the FN than for the PCF.
We note that in the long-term, the unemployment variable is not significant for the FN and the
PCF. The suggestion, usually accepted in the literature, is that deteriorating economic
conditions bene t the analyzed movements. Indeed, these parties use these degradations to
castigate the entire ruling political class. This result is somewhat counter-intuitive.
Except for unemployment, the results for the long-term model are consistent with commonly
accepted thought. The insecurity has a positive influence on the popularity of the parties studied.
Similarly, deteriorating social conditions are in favor of these currents.
5.2. The Short Run Relationship
The results of the short-term relationship are analyzed within the error correction model. We
present the results of the latter in table (6). We complement these results with tests on residuals.
From Table (6), Durbin-Watson statistics (DW rated) indicate that there is no autocorrelation.
We check it with the test of Ljung-Box autocorrelation since the Durbin-Watson test measures
only the autocorrelation of order 1. We set the value of this test as for lags greater than the
number of delays retained in the model of error correction (two delays). The results of this test
are given in Table (7) and indicate that there is no problem of autocorrelation for delays larger
than two. The test of Jarque-Bera28 (J B in the table (6)) examines the assumption of normality
of residuals. In our case, we accept this hypothesis. Furthermore, the heteroskedasticity test29
(ARCH with one lag) shows unambiguously that the residues have good statistical properties.
We also note the significance of the term of error correction. Moreover, it takes a negative value
which reflects the adjusting process towards the long term.
For the FN, we note the significance of the autoregressive process of order 2 for the endogenous
variable; it validates the idea that there is a memory effect. Indeed, the variation of the
popularity in t is negatively associated with the same variation in t-1 and t-2. We observe that
a positive change for property damages causes a change in the same way of the popularity of
the far right; however, the first lag is more significant. These results are consistent with intuition
and can validate it statistically. Moreover, the household confidence variable is not significant
in the analysis. Supporters of the far right grant a higher preference to insecurity than the
deteriorating socio-economic in the short term. This result is explained by the period of
assimilation of such damage.
The agents are victims of social illusion in the short term. However, in long term, this variable
is significant, once taken into account with all social transformations. Changes in the popularity
and those of unemployment are negatively related (the coefficient is nevertheless significant at

59 Boya and Malizard, International Journal of Applied Economics, 12(2), September 2015, 47-70
10%), which is counter-intuitive because of poor economic performance should have a positive
influence on the FN.
The variation of PCF with two delays has a positive and significant impact on the variation of
FN, the popularity may increase in the short-term for both parties. However, in the case of the
equation of PCF, we also note the presence of the variation of FN is both significant and
negative. We interpret these results as follows: individuals who are ideologically close to the
far right are not likely to align with the left communism. There is an inertia expressed by a
relatively constant percentage of votes for the FN leader, Jean-Marie Le Pen at presidential
elections while communist supporters may turn to the other side in logic of challenge
traditionally strong to these agents (Leftist-Lepenism).
The other exogenous variables also appear significant. This is applied to property damages by
introducing two delays. One must note the high value of the coefficients associated with the
change in unemployment for the two delays: the cumulative effect is very strong. Thus, a small
change in unemployment implies a high variation of the popularity of the PCF. However, the
coefficient is negative, while, as in case of FN we predicted a positive coefficient. Similarly,
the coefficient associated with trust is positive on the popularity of the PCF, which is again
surprising. While the analysis of long-term is rather consistent with our premonitions, those of
the short term are less, at least at first sight. Indeed, we are in the presence of several counter-
intuitive results whose interpretation seems complex.
5.3. Variance Decomposition
Finally, we employ variance decomposition to complete the results obtained with the ECM.
Here, the goal is to compute each variable’s contribution to the variance of the forecast error
for a given horizon. This may give some indication about the relative weight of each variable
in the explanation of the variance. This is done in tables (8) and (9). Each table indicates the
percent of variance of popularity due to its own innovations and those of explanatory variables.
The variance of forecast error for both dependent variables is mainly due to their own
innovation (69% for the FN’s error and 84% for the PCF’s error after 20 periods). This implies
that the relative weight of explanatory variables is weak and in particular for the PCF’s
popularity. We can range the variables following the impact.
For the FN, the main variable is DAM (25% after 20 months), whereas the others have low
impact. We can note the influence of PCF for the third period but it decreases quickly. This is
also the case for the UNE variable. Finally, the confidence variable shows us a light impact
which increases over time. These results suggest that security has as important element in
determine the FN’s popularity and to a lesser extent, the confidence variable. It confirms the
previous results of the ECM. For the PCF, we observe that only one variable, has an immediate
effect: this is the FN, but for the FN’s decomposition, anyone variable has a direct impact. For
the main important variable for the PCF’s decomposition is the unemployment. It increases
quickly over time, reaches a peak after 12 months and keeps constant after 20 months. The other
variables are less important. Indeed, the FN represents near 5% after 3 periods but decreases
over time. We can note the low impact of confidence of PCF’s decomposition.

60 Boya and Malizard, International Journal of Applied Economics, 12(2), September 2015, 47-70
Finally, we remark that both decompositions are consistent with our expectations. Indeed,
security is the main determiner for FN’s popularity and unemployment for the PCF’s popularity.
6. Conclusion: Counter-Intuitive Results or Not
In this article, we develop a model for analyzing the determinants of the function of popularity
in France of the national populism on one hand and the left communist on the other hand. The
French case is particularly appropriate, in view of the weight of these parties in past presidential
elections. We rely on econometric modeling using the method of time series. The originality of
our paper is the addition of new variables (household confidence and measure of insecurity with
damage on property), appearing important in the analysis and the use of an error correcting
model.
The econometric tests show that our specification is correct. The results indicate that the newly
introduced variables in our model are significant in the popularity of movements studied, both
in short and long term.
The long-term analysis highlights several interesting results. We confirm statistically that the
rise of insecurity and the deterioration of trust are conducive to the far right and the radical left.
Nevertheless, it appears that unemployment is not significant on these currents. This result is
surprising but understandable. Indeed, agents do not have a sufficient trust in these parties to
offer effective solutions to fight unemployment. Agents consider these movements as extreme
in their economic analysis and that they propose unfeasible solutions.
Regarding the short-term analysis, we are confronted with several surprising results that can be
interpreted. Firstly, when we observe a negative change in unemployment, variations of the
popularity of the parties studied increase. Agents give more support to populist and communist
movements when economic conditions are good because these parties are not consistent in the
direction of their economic policy. Individuals do not count on these currents to solve the
unemployment problem. Secondly, we note that the higher the household confidence, stronger
the popularity of the PCF. This result can be explained by the fact that the vote for these
movements can be considered as an electoral shift at the expense of parties of power. Indeed,
agents know that the parties analyzed in this study will weigh less while the social situation is
good. Thus, we are in presence of a pleasure vote or risky vote. People are happy (or scared) of
voting for an extremist party while the risk of its access to power is more limited, especially
when the economic and social conditions are favorable. However, during the 2002 election,
many people did not vote for potential candidates of power and are transferred their voices to
alternative voting left and right. Consequently, the candidate of FN was found in the second
ballot of the presidential elections and the left communist parties have obtained 14% of the
vote. Our results support the view that populist and communist movements are defined mainly
as a protest movement. Thus, they owe their popularity to the shift of a portion (part) of the
electorate.
One of the possible extensions is to consider the perception of agents in terms of trust in the
parties of power. It seems that the political variable is not sufficiently understood in models of

61 Boya and Malizard, International Journal of Applied Economics, 12(2), September 2015, 47-70
popularity but also of votes. This would be a good indicator of the rejection of traditional parties
by the voters of the extreme movements.
Endnotes
* Christophe Boya, [email protected], Laboratoire TRIS, University of Montpellier,
Faculty of economics, Montpellier, 34960 cedex 2.
Julien Malizard, [email protected], chercheur post doctoral, Chaire économie de
defense, IRSEM, IHEDN, Paris, 75700.
1 In this article, we consider the terms ‘right wing populist’, ‘national populism’ and ‘far right’
as synonyms.
2 Since 2008, the party is now represented by Nathalie Arthaud.
3 In 2008, the LCR refounded itself as a news party called Nouveau Parti Anticapitaliste (NPA),
New Anticapitalist Party.
4 The national secretaries are Daniel Glusckstein, Claude Janet, Jean Markun and Gerard
Schivardi.
5 The weight of the PCF is way inferior to the one of the elections of 1969 during which is
obtained 21.2% of the votes.
6 Evans and Ivaldi (2002) realize a detailed review of the electoral successes of the national
populism in Europe.
7 March and Mudde (2005).
8 Dubois (2007) realizes a synthesis of models of french political economic vote results.
9 The electoral threshold corresponds to a minimum of voices under which the party is not
represented.
10 Lets’ note that UDF is now split in two with the Nouveau Centre, which claims to be of a
right center and got closer to UMP in 2007, and the MODEM founded by F. Bayrou after the
past presidential election, purely centrist current.
11 Especially, the popularity of the party’s leader.
12 Italy, Belgium, Germany, United-Kingdown.
13 Belgium, France, Germany, Denmark, Italy and the Netherlands.
14 Important theme of the campaign of 2002.
62 Boya and Malizard, International Journal of Applied Economics, 12(2), September 2015, 47-70
15 The French far right has for a long time based its discourse on: Neither left, Nor right, Front
National.
16 They correspond to the number of complaints about thefts, destructions and damages.
17 Traditionally, we maintain the quotient (or the difference) between satisfied people and the
dissatisfied ones, but in the case of parties studies, such operation is not useful since the number
of dissatisfied people is largely superior to the number of satisfied people. In addition, such
transformations don’t alter the nature of series, in particularly the study of stationarity.
18 The popularity of leaders is available but on a too short period to be exploited.
19 This source is only one that disposes of monthly data, with the same database. Other databases
use quarterly data (for instance, Internationl Labor Organization).
20 This type of variable is designated as a valance issue.
21 According to the INSEE, it supplies information on consumer behavior, as well as on
anticipations in matter of consumption and savings. It measures situational phenomenon as they
are viewed by the households independently from the elaboration of macro-economic indicators
(prices, unemployment, savings). http://www.insee.fr/fr/indicateurs/indic conj/donnees/method
idconj 20.pdf
22 Source: www.inhes.interieur.gouv.fr; the data are available from 1998.
23 Raynaud (2006) notes that ・ if the far right incarnated by the FN is since a long time the
subject of general reprobation ... the different sensibilities of radical left ... are better accepted.
24 The model with trend and constant is validated for the DAM variable, the model with constant
for the variable UNE and the model without constant and trend for the other variables. The
number of lags has been estimated with the help of information criteria (AIC and SIC) and
confirmed with partial autocorrelation functions on the series in difference. It is important to
note that there is no non-stationarity of deterministic nature for the endogenous variable.
25 Available upon request.
26 Not to take into account the possibility of a cointragration relation is dangerous. Indeed, if
we deny the existence of a stable long term relationship, the use of an auto regressive vector
(VAR) does not give an account of the possibilities of adjustment of these stable long term
relationships. In order to avoid this, it is necessary to use an error correction model.
27 Let’s note that the trace test leads to the same results.
28 Which follows a khi-2 equal to 5.99 at 5%.
29 The ARCH test follows a khi-2 equal to 3.84 at 5%. The value calculated is inferior to the
critical value : we accepted the null hypothesis of homoscedasticity.

63 Boya and Malizard, International Journal of Applied Economics, 12(2), September 2015, 47-70
References
Abrams B.A. & J.L. Butkiewicz. 1995. “The Influence of State-Level Economic Conditions
on the 1992 US Presidential Election”, Public Choice, 85, 1-10.
Auberger A. 2005. “Forecasts of the 2004 French European Election”, Swiss Political Science
Review, 11, 61-78.
Auberger A. 2008. “The National Front Vote and Turnout in the French Presidential
Elections”, French Politics, 6, 94-100.
Auberger A. & E. Dubois. 2003. “Situation politico economique et resultats des elections
legislatives francaises”, Revue Economique, 54, 551-560.
Auberger A. & E. Dubois. 2005. “The Influence of Local and National Conditions on French
Legislative Elections”, Public Choice, 125, 363-383.
Betz H.G. 1994. Radical Right-Wing Populism in Western Europe, Houndmills, Macmillian :
London.
Birnbaum P. 1995. Le peuple et les gros, Pluriel, Paris.
Bonnetain P. 2004. “Behind the Pooling-Booth Curtain and Beyond Simple Speculations:
Toward a Causal Model Far-Right Voting Behaviour– Some Evidence from French Presidential
Elections of 2002”, Canadian Journal of Political Science, 37, 419-429.
Borooah V.K. & V. Borooah. 1990. “Economic Performance and Political Popularity in the
Republic of Ireland”, Public Choice, 67, 65-79.
Brug W., M. Fennema & J. Tillie. 2000. “Anti-Immigrant Parties in Europe: Ideological or
Protest Vote?”, European Journal of Political Research, 37, 77-102.
Capron H. 1987. “Coherence et estimation des fonctions de popularite: une application au cas
francais”, Revue Economique, 38, 1029-1042.
Courbis R. 1995. “La conjoncture economique, la popularite politique et les perspectives
electorales dans la France d’aujourd’hui”, Journal de la societe de statistique de Paris, 136, 47-
70.
Della Porta D. & Y. Meny. 1997. Democracy and corruption in Europe, Pinter : New York.
Dubois E. 2005. Economie politique et prevision conjoncturelle : construction d’un modele
macroeconometrique avec prise en compte des facteurs politiques, these, Universite de Paris 1.
Dubois E. 2007. “Les determinants economiques du vote 1976-2006: trente ans de fonctions
de vote en France”, Revue d’Economie Politique, 117, 243-270.
Downs A. 1957. An Economic Theory of Democracy, Harper & Row: New York.

64 Boya and Malizard, International Journal of Applied Economics, 12(2), September 2015, 47-70
Elgie R. 2004. Institutions and Voters: Structuring Electoral Choice, The French Voter before
and after the 2002 Elections, New-York: Palgrave MacMillan, M.S. Lewis-Beck (ed.), 110-
125.
Esping-Andersen G. 1999. Politics Without Class: Postindustrial Cleavages in Europe and
America, in Kitschelt H., P. Lange, G.Marks and J. D. Stephens eds, Continuity and Change in
Contemporary Capitalism, Cambridge University Press : Cambridge, 293-316.
Evans J.A. & G. Ivaldi 2002. “Les dynamiques エelectorales de l’extreme droite europeenne”,
Revue politique et parlementaire, 1019, 67-83.
Fauvelle-Aymar C. & M.S. Lewis-Beck 2005. “Coalition Strategies and National Front Vote
in French Legislative Contests”, French Politics, 3, 164-177.
Goodhart, C.A.E. & R.J. Bhansali. 1970. “Political Economy”, Political Studies, 18, 43-106.
Heartfield J. 2003. “Capitalism and Anti-Capitalism”, Interventions, 5, 271-289.
Held D. 1999. Global Transformation: Politics, Economics and Culture, Stanford University
Press : Stanford, California.
Hibbs D.A. Jr & N. Vasilatos. 1983. “Performance economique et fonction de popularite des
Presidents Pompidou et Giscard d’Estaing”, Revue d’Economie Politique, 93, 44-61.
Ivaldi G. 1999. “L’extreme droite ou la crise des systemes de partis”, Revue Internationale de
Politique Comparee, 6, 201-246.
Ivaldi G. 2002. Enjeux securitaires et droites populistes en France, dans Sociologie de
l’insecurite, S. Roche (ed), 199-210, Paris, Armand Colin.
Jackman R.W. & K. Volpert. 1996. “Conditions Favouring Parties of the Extreme Right in
Western Europe”, British Journal of Political Science, 26, 501-521.
Jerome B. & V. Jerome-Speziari. 2003. “A Le Pen Vote Function for the 2002 Presidential
Election: A Way to Reduce Uncertainty”, French Politics, 1, 247-251.
Jerome B. & V. Jerome-Speziari. 2004. Forecasting the 2002 Elections: Lessons from a
Political Economy Model, The French Voter before and after the 2002 Elections, Palgrave
MacMillan : New-York, M.S. Lewis-Beck (ed.), 178-204.
Kitschelt H. & A. McGann. 1995. The Radical Right in Western Europe: a Comparative
Analysis, Ann Arbor: The University of Michigan Press, Chapitre un, 1-24.
Knigge P. 1998. “The Ecological Correlates of Right-Wing Extremism in Western Union”,
European Journal of Political Research, 34, 249-279.
Lafay J.D. 1989. L’opposition dans le systeme politico-economique: analyse theorique et etude
empirique du cas francais, Journal des Economistes et des Etudes Humaines, 1, 43-59.

65 Boya and Malizard, International Journal of Applied Economics, 12(2), September 2015, 47-70
Laurent A. 2004. France’s 2002 Presidential Elections: Early and Later Territorial Fractures,
The French Voter before and after the 2002 Elections, New-York: Palgrave MacMillan, M.S.
Lewis-Beck (ed.), 12-32.
Lazar M. 1997. “Du populisme à gauche: le cas francais et italien”, Revue d’histoire, 56, 121-
131.
Lecaillon J. 1980. La crise et l’alternance, Cujas, Paris.
Lewis Beck M.S. 1980. “Economic Condition and Executive Popularity: the French
Experience”, American Journal of Political Science, 8, 265-288.
Lewis-Beck M.S. 1997. “Who’s the Chef? Economic Voting Under a Dual Executive”,
European Journal of Political Research, 31, 315-325.
Lewis-Beck M.S. & P. Bellucci. 1982. “Economic influences on Legislative Elections in
Multiparty systems: France and Italy”, Political Behaviour, 4, 93-107.
Lewis-Beck M.S. & G. Mitchell II. 1993. “French Electoral Theory: the National Front Test”,
Electoral Studies, 12, 112-127.
March L. & C. Mudde. 2005. “What’s left of the Radical Left? The European Radical Left
After 1989: Decline and Mutation”, Comparative European Politics, 3, 23-49.
Mayer N. 2002. Ces francais qui votent le Pen, Flammarion, Paris.
Mueller J.E. 1970. “Presidential Popularity from Truman to Johnson”, American Political
Science Review, 64, 18-35.
Neck R. & S. Karbuz. 1997. “Econometric Estimations of Popularity Functions: a Case Study
for Austria”, Public Choice, 91, 57-88.
Nordhaus W. 1975. “The Political Business Cycle”, Review of Economic Studies, 42, 451-471
Raynaud P. 2006. L’extreme gauche plurielle: entre democratie radicale et revolution,
Autrement, Paris.
Reynie D. 2007. L’extreme gauche, moribonde ou renaissante?, PUF.
Rydgren J. 2005. “Is Extreme Right-wing Populism Contagious? Explaining the Emergence
of a New Party Family”, European Journal of Political Research, 44, 1-25.
Scharpf F. 1999. Governing in Europe: Effective and Democratic, Oxford University Press.
Swank O.H. 1990. “Presidential Popularity and Reputation”, De Economist, 138, 168-179.
Veiga F.J. & L.G. Veiga. 2004. “Popularity Functions, Partisan Effects and Support in
Parliament”, Economics and Politics, 16, 101-115.

66 Boya and Malizard, International Journal of Applied Economics, 12(2), September 2015, 47-70
Table 1: first ballot of the presidential elections results
Elections Right populism Left communist Global
1974 0.75% 2.7% 3.45%
1981 - 17.65% 17.65%
1988 14.38% 11.24% 25.62%
1955 15% 14.22% 29.22%
2002 19.20% 13.84% 33.04%
2007 10.5% 9% 19.5%
Table 2: Linear correlations between exogenous variables
DAM UNE CONF FN PHYS
DAM 1 0.0332 0.4305 0.3995 -0.3949
UNE - 1 0.1696 -0.8556 -0.5507
CONF - - 1 -0.1007 -0.8282
FN - - - 1 0.4144
PHYS - - - - 1
Table 3: Descriptive Statistics
FN PCF DAM UNE CONF
Mean 10.03 26.96 2.76 9.02 -14.76
Median 10 26 2.76 9 -20
Std. Dev. 2.28 4.38 2.06 0.68 12.43
Max 16 36 3.13 10.9 10
Min 6 18 2.32 7.8 -38
Skewness 0.53 0.45 -0.06 0.75 0.32
Kurtosis 2.72 2.17 2.33 3.74 1.95
ADF in level -0.673 -0.974 -0.907 -2.979 0.385
ADF in first difference -13.651 -16.255 -1.953 -1.995 -5.849
Table 4: Maximum eigenvalue test’s results
Hypothesis Eigenvalue Max
eigenvalue
Critical value Prob.
r = 0 0.352 46.813 46.231 0.043
r = 1 0.264 33.061 40.078 0.248
r = 2 0.229 28.089 33.877 0.209

67 Boya and Malizard, International Journal of Applied Economics, 12(2), September 2015, 47-70
Table 5: Determination of lags in VECM
FN PCF
Lag AIC SIC AIC SIC
L = 5 3.66 4.34 4.56 5.24
L = 4 3.73 4.29 4.51 5.06
L = 3 3.69 4.11 4.46 4.88
L = 2 3.61* 3.75* 4.44* 4.73*
L = 1 3.68 3.85 4.59 4.76
Table 6: Results of the ECM
Variable ΔFN ΔPCF
�̃�𝒕−𝟏 -0.007
[-1.80]
-0.021
[-3.34]
Δ FN (-1) -0.311
[-3.17]
-0.273
[-1.85]
Δ FN (-2) -0.312
[-3.25]
-0.534
[-3.59]
Δ PCF (-1) 0.051
[0.826]
-0.465
[-4.94]
Δ PCF (-2) 0.171
[2.763]
-0.092
[-0.992]
ΔDAM (-1) 2.09
[1.95]
-0.031
[0.052]
Δ DAM (-2) 1.16
[1.11]
2.97
[1.884]
Δ UNE (-1) 1.059
[0.487]
-8.809
[-2.68]
Δ UNE (-2) -3.78
[-1.65]
-8.12
[-2.354]
Δ CONF (-1) -0.042
[-0.663]
-0.114
[-1.176]
Δ CONF (-2) 0.074
[1.14]
0.201
[2.059]
C 0.059
[0.37]
-0.480
[-1.96]
Adjusted R² 0.30 0.40
JB 4.78 0.78
DW 2.01 1.85
ARCH 1.65 2.237

68 Boya and Malizard, International Journal of Applied Economics, 12(2), September 2015, 47-70
Table 7: Ljung-Box test
FN PCF
Lag Stat Q Prob Stat Q Prob
8 12.82 0.12 6.31 0.612
12 16.41 0.17 10.55 0.567
16 18.76 0.271 12.91 0.679
20 20.28 0.44 15.41 0.752
Table 8: Variance decomposition of FN
Period SE %FN %PCF %DAM %UNE %CONF
1 1.400790 100.0000 0.000000 0.000000 0.000000 0.000000
2 1.729918 96.29269 0.058474 2.539863 0.167082 0.941889
3 1.948993 90.16369 3.119353 5.514335 0.441667 0.760954
4 2.166943 88.48171 2.601066 7.586680 0.524667 0.805882
5 2.388932 86.41616 2.238398 10.14382 0.441052 0.760569
6 2.607380 84.55433 2.146977 12.01569 0.393896 0.889108
7 2.812700 82.56685 1.999930 14.01076 0.339304 1.083161
8 3.002905 80.66890 1.929400 15.84131 0.303474 1.256923
9 3.190352 79.11728 1.813453 17.32643 0.283085 1.459758
10 3.372110 77.67646 1.721418 18.66959 0.274745 1.657780
15 4.187659 72.44936 1.445971 23.30237 0.290586 2.511712
20 4.886875 69.41111 1.290953 25.88847 0.327586 3.081888

69 Boya and Malizard, International Journal of Applied Economics, 12(2), September 2015, 47-70
Table 9: Variance decomposition of PCF
Period S.E. %FN %PCF %DAM %CHOM %CONF
1 2.117369 2.977366 97.02263 0.000000 0.000000 0.000000
2 2.425297 3.002036 90.58520 0.067637 5.105168 1.239955
3 2.870993 4.728380 84.42965 0.130232 9.146549 1.565189
4 3.081228 4.116419 84.85994 0.495254 9.167943 1.360445
5 3.278925 3.650076 84.77609 0.464386 9.902801 1.206646
6 3.534073 3.404800 85.26058 0.469441 9.821467 1.043708
7 3.728961 3.209975 84.92667 0.494809 10.42907 0.939477
8 3.913604 3.094407 84.85038 0.497161 10.70445 0.853607
9 4.084776 2.949315 84.94032 0.522391 10.79128 0.796691
10 4.246306 2.846871 84.94826 0.526564 10.91244 0.765868
11 4.403414 2.783542 84.97155 0.527930 10.96414 0.752847
12 4.549306 2.727166 84.96765 0.528309 11.00884 0.768026
13 4.688775 2.683878 84.97392 0.523698 11.01415 0.804357
14 4.822766 2.648619 84.97924 0.517322 10.99004 0.864777
15 4.951371 2.622972 84.96602 0.508140 10.95532 0.947544
16 5.075488 2.605083 84.94380 0.497323 10.90356 1.050235
17 5.195172 2.591506 84.90956 0.485462 10.84003 1.173439
18 5.311146 2.582500 84.86380 0.472644 10.76594 1.315124
19 5.423796 2.577239 84.80596 0.459337 10.68322 1.474245
20 5.533352 2.575102 84.73527 0.445775 10.59434 1.649513

70 Boya and Malizard, International Journal of Applied Economics, 12(2), September 2015, 47-70
Figure 1: Popularity rates’ evolution of FN and PCF
Figure 2: Household confidence