extreme faint flux imaging with an emccd - nüvü … faint flux imaging with an emccd ... the ccd...
TRANSCRIPT

Extreme Faint Flux Imaging with an EMCCD
OLIVIER DAIGLE,1,2,3 CLAUDE CARIGNAN,1,4 JEAN-LUC GACH,2 CHRISTIAN GUILLAUME,5 SIMON LESSARD,3
CHARLES-ANTHONY FORTIN,3 AND SÉBASTIEN BLAIS-OUELLETTE3
Received 2009 February 9; accepted 2009 June 17; published 2009 August 3
ABSTRACT. An EMCCD camera, designed from the ground up for extreme faint flux imaging, is presented.CCCP, the CCD Controller for Counting Photons, has been integrated with a CCD97 EMCCD from e2v technol-ogies into a scientific camera at the Laboratoire d’Astrophysique Expérimentale (LAE), Université de Montréal.This new camera achieves subelectron readout noise and very low clock-induced charge (CIC) levels, which aremandatory for extreme faint flux imaging. It has been characterized in laboratory and used on the Observatoire duMont Mégantic 1.6 m telescope. The performance of the camera is discussed and experimental data with the firstscientific data are presented.
1. INTRODUCTION
The advent of electron-multiplying charge-coupled devices(EMCCD) allows subelectron readout noise to be achieved.However, the multiplication process involved in rendering thislow noise level is stochastic. The statistical behavior of the gainthat is generated by the electron multiplying register adds anexcess noise factor (ENF) that reaches a value of 21=2 at highgains (Stanford & Hadwen 2002). The effect on the signal-to-noise ratio (SNR) of the system is the same as if the quantumefficiency (QE) of the EMCCD were halved. In this regime, theEMCCD is said to be in analog mode (AM) operation.
Some authors proposed offline data processing to lower theimpact of the ENF (Lantz et al. 2008; Basden et al. 2003) in AMoperation. However, one can overcome the ENF completely,without making any assumption on the signal’s stability acrossmultiple images, only by considering the pixel binary and byapplying a single threshold to the pixel value. The pixel willbe considered as having detected a single photon if its valueis higher than the threshold and none if it is lower. In thisway, the SNR will not be affected by the ENF and the fullQE of the EMCCD can be recovered. In this regime, wherethe EMCCD is said to be in photon-counting (PC) operation,the highest observable flux rate will be dictated by the rate at
which the images are read out; a frame rate that is too low willinduce losses by coincidence.
However, at a high frame rate, the clock-induced charges(CIC) become dominant over the other sources of noise affect-ing the EMCCD (mainly dark noise). CIC levels in the range of0.01–0.1 were typically measured (Tulloch 2008; Wen et al.2006; e2v Technologies 2004) on a 512 ! 512 CCD97 frametransfer EMCCD from e2v Technologies. Even at a low readoutspeed of 1 frame s!1, these CIC levels are at least an order ofmagnitude higher than the dark noise. Thus, one wanting to dofaint flux imaging with an EMCCD is stuck with two conflictingproblems: a low frame rate is needed to lower the impact of theCIC while a high frame rate is needed if a reasonable dynamicrange is to be achieved.
In order to make faint flux imaging efficient with anEMCCD, the CIC must be reduced to a minimum. Some tech-niques have been proposed to reduce the CIC (Tulloch 2006;Daigle et al. 2004; Mackay et al. 2004; Gach et al. 2004;e2v Technologies 2004; Janesick 2001) but until now, no com-mercially available CCD controller nor commercial cameraswere able to implement all of them and get satisfying results.CCCP, the CCD Controller for Counting Photons, has been de-signed with the aim of reducing the CIC generated when anEMCCD is read out. It is optimized for driving EMCCDs athigh speed (!10 MHz ), but may be used also for driving con-ventional CCDs (or the conventional output of an EMCCD) athigh, moderate, or low speed. This new controller provides anarbitrary clock generator, yielding a timing resolution of "20 psand a voltage resolution of "2 mV of the overlap of the clocksused to drive the EMCCD. The frequency components of theclocks can be precisely controlled, and the interclock capaci-tance effect of the CCD can be nulled to avoid overshootand undershoots. Using this controller, CIC levels as low as0.001–0.002 event pixel!1 per frame were measured on the512 ! 512 CCD97 operating in inverted mode. A CCD97
1 Laboratoire d’Astrophysique Expérimentale, Département de Physique,Université de Montréal, C.P. 6128, succ. centre-ville, Montréal, QC, Canada,H3T 2B1; [email protected].
2 Aix-Marseille Université—CNRS—Laboratoire d’Astrophysique de Mar-seille, Observatoire Astronomique de Marseille-Provence, Technopôle deChâteau-Gombert, 38, rue Frédéric Joliot-Curie, 13388 Marseille, France.
3Photon etc., 5155 Decelles Avenue, Pavillon J.A Bombardier, Montréal, QC,Canada, H3T 2B1.
4 Observatoire d’Astrophysique de l’Université de Ouagadougou, BP 7021,Ouagadougou 03, Burkina Faso.
5 CNRS—Observatoire Astronomique de Marseille-Provence—Observatoirede Haute-Provence, 04870 St-Michel l’Observatoire, France.
866
PUBLICATIONS OF THE ASTRONOMICAL SOCIETY OF THE PACIFIC, 121:866–884, 2009 August© 2009. The Astronomical Society of the Pacific. All rights reserved. Printed in U.S.A.

driven by CCCP was placed at the focus of the FaNTOmMinstrument (Gach et al. 2002; Hernandez et al. 2003) to replaceits GaAs photocathode-based Image Photon Counting System(IPCS). In this article, the important aspects of PC and AMoperations with an EMCCD under low fluxes are outlined in§ 2. In § 3, CCCP performance regarding these aspects is pre-sented. Finally, in § 4, scientific results obtained at the telescopeare presented.
2. FAINT FLUX IMAGING WITH AN EMCCD
2.1. The Cost of Subelectron Readout Noise
The multiplication process that allows an EMCCD to reachsubelectron readout noise is unfortunately stochastic. Only themean gain is known and it is not possible to know the exact gainthat was applied to a pixel’s charge. This uncertainty on the gainand thus on the determination of the quantity of electrons thatwere accumulated in the pixel causes errors on the photometricmeasurements. This uncertainty can be translated in a SNRequation as an ENF, F , as follows
SNR " S!!!!!!!!!!!!!!!!!!!!!!!F 2S # !2
real
G2
r : (1)
Here, S is the quantity of electrons that were acquired and Gthe mean gain achieved by the multiplication register. At high
gain, F 2 reaches a value of 2 and its effect on the SNR is thesame as if the QE of the EMCCD was halved (Stanford &Hadwen 2002).
The effect of the ENF on the output probability of the EMstage of the EMCCD is outlined by Figure 1, left panel. Theoverlapping output probabilities of different input electrons isthe result of the ENF. Its impact on the SNR is shown in theright panel. The plateau at 0.707 of relative SNR is the effectof an ENF of value
!!!2
p. This figure also compares the relative
SNR of a conventional CCD (G " 1) operated at 2 and 10 elec-trons of readout noise.
Thus, for fluxes lower than "5 photons pixel!1 per image,the EMCCD in AM operation outperforms the low-noise (! " 2electrons) conventional CCD. This does not take into accountthe duty cycle loss induced by the low speed readout of the low-noise CCD. Since most of the EMCCDs actually available are offrame transfer type, virtually no integration time is lost due tothe readout process and this advantage would be even greater forthe EMCCD compared to the conventional CCD. In AM opera-tion, the maximum observable flux per image is a function ofthe EM gain of the EMCCD and the integration time should bechosen to avoid saturation.
This ENF affects the SNR only when one wants to measuremore than 1 photon pixel!1. If one assumes that no more thanone photon is to be accumulated, it can consider the pixel asbeing empty if the output value is lower than a given threshold,or filled by one photon if the output value is higher than the
FIG. 1.—(Left) Output probability of the amplification register of an EMCCD, for a mean gain of 3000 plotted for various amount of input electrons, n. The over-lapping regions are the result of the ENF induced by the multiplication process. (Right) Relative SNR as a function of the photon flux per image, the readout noise of theEMCCD and its operating gain. A saturation level of 200,000 electrons is assumed, the readout noise is 50 electrons unless noted, the dark noise and CIC are neglected.
EXTREME FAINT FLUX IMAGING WITH AN EMCCD 867
2009 PASP, 121:866–884
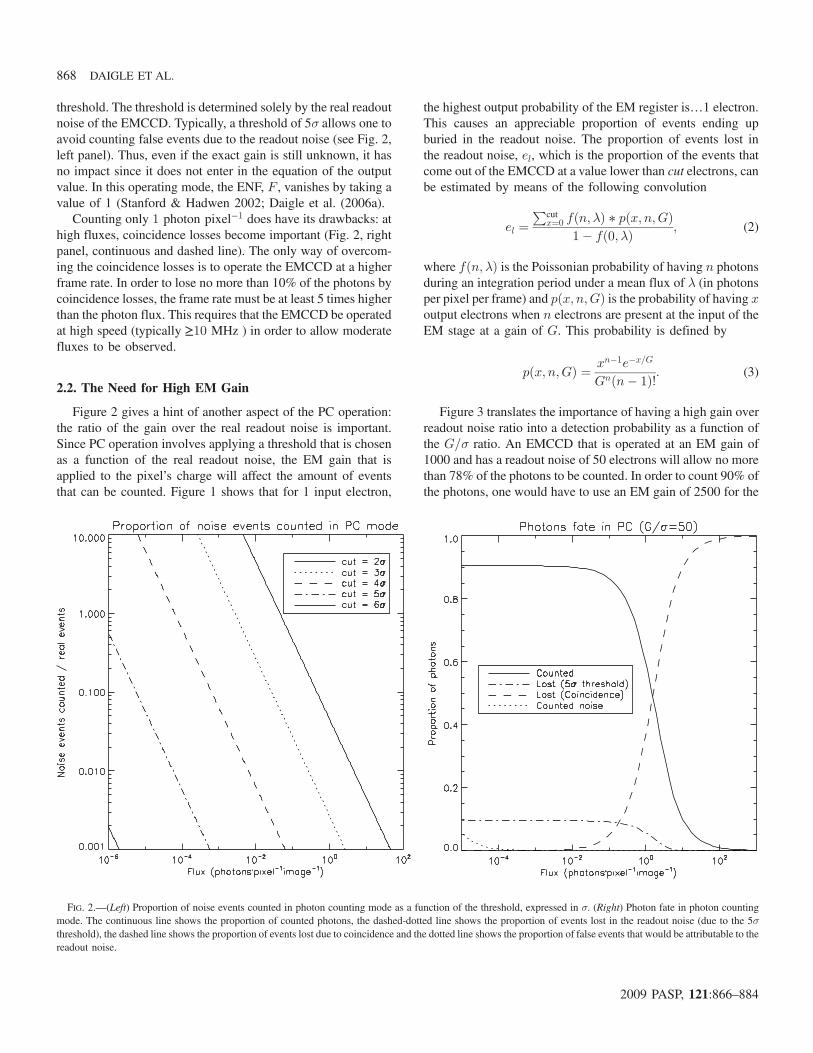
threshold. The threshold is determined solely by the real readoutnoise of the EMCCD. Typically, a threshold of 5! allows one toavoid counting false events due to the readout noise (see Fig. 2,left panel). Thus, even if the exact gain is still unknown, it hasno impact since it does not enter in the equation of the outputvalue. In this operating mode, the ENF, F , vanishes by taking avalue of 1 (Stanford & Hadwen 2002; Daigle et al. (2006a).
Counting only 1 photon pixel!1 does have its drawbacks: athigh fluxes, coincidence losses become important (Fig. 2, rightpanel, continuous and dashed line). The only way of overcom-ing the coincidence losses is to operate the EMCCD at a higherframe rate. In order to lose no more than 10% of the photons bycoincidence losses, the frame rate must be at least 5 times higherthan the photon flux. This requires that the EMCCD be operatedat high speed (typically !10 MHz ) in order to allow moderatefluxes to be observed.
2.2. The Need for High EM Gain
Figure 2 gives a hint of another aspect of the PC operation:the ratio of the gain over the real readout noise is important.Since PC operation involves applying a threshold that is chosenas a function of the real readout noise, the EM gain that isapplied to the pixel’s charge will affect the amount of eventsthat can be counted. Figure 1 shows that for 1 input electron,
the highest output probability of the EM register is…1 electron.This causes an appreciable proportion of events ending upburied in the readout noise. The proportion of events lost inthe readout noise, el, which is the proportion of the events thatcome out of the EMCCD at a value lower than cut electrons, canbe estimated by means of the following convolution
el "Pcut
x"0 f$n; "% # p$x; n;G%1! f$0;"%
; (2)
where f$n; "% is the Poissonian probability of having n photonsduring an integration period under a mean flux of " (in photonsper pixel per frame) and p$x; n;G% is the probability of having xoutput electrons when n electrons are present at the input of theEM stage at a gain of G. This probability is defined by
p$x; n;G% " xn!1e!x=G
Gn$n! 1%!: (3)
Figure 3 translates the importance of having a high gain overreadout noise ratio into a detection probability as a function ofthe G=! ratio. An EMCCD that is operated at an EM gain of1000 and has a readout noise of 50 electrons will allow no morethan 78% of the photons to be counted. In order to count 90% ofthe photons, one would have to use an EM gain of 2500 for the
FIG. 2.—(Left) Proportion of noise events counted in photon counting mode as a function of the threshold, expressed in !. (Right) Photon fate in photon countingmode. The continuous line shows the proportion of counted photons, the dashed-dotted line shows the proportion of events lost in the readout noise (due to the 5!threshold), the dashed line shows the proportion of events lost due to coincidence and the dotted line shows the proportion of false events that would be attributable to thereadout noise.
868 DAIGLE ET AL.
2009 PASP, 121:866–884
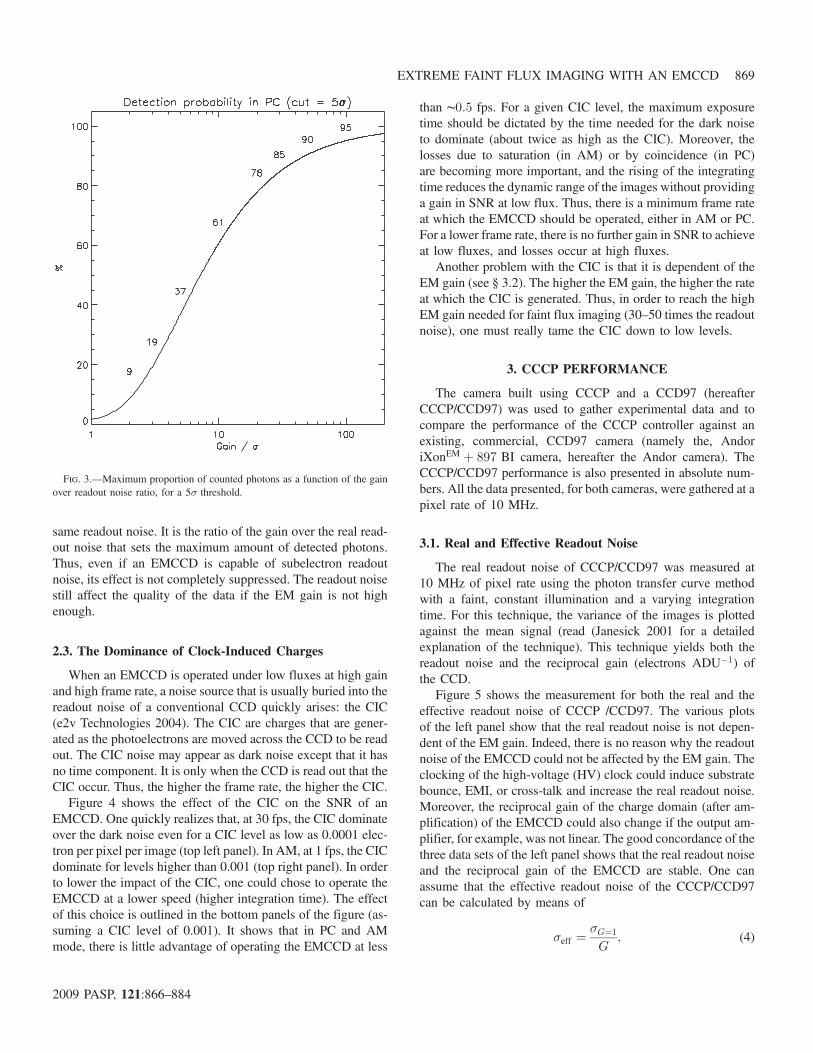
same readout noise. It is the ratio of the gain over the real read-out noise that sets the maximum amount of detected photons.Thus, even if an EMCCD is capable of subelectron readoutnoise, its effect is not completely suppressed. The readout noisestill affect the quality of the data if the EM gain is not highenough.
2.3. The Dominance of Clock-Induced Charges
When an EMCCD is operated under low fluxes at high gainand high frame rate, a noise source that is usually buried into thereadout noise of a conventional CCD quickly arises: the CIC(e2v Technologies 2004). The CIC are charges that are gener-ated as the photoelectrons are moved across the CCD to be readout. The CIC noise may appear as dark noise except that it hasno time component. It is only when the CCD is read out that theCIC occur. Thus, the higher the frame rate, the higher the CIC.
Figure 4 shows the effect of the CIC on the SNR of anEMCCD. One quickly realizes that, at 30 fps, the CIC dominateover the dark noise even for a CIC level as low as 0.0001 elec-tron per pixel per image (top left panel). In AM, at 1 fps, the CICdominate for levels higher than 0.001 (top right panel). In orderto lower the impact of the CIC, one could chose to operate theEMCCD at a lower speed (higher integration time). The effectof this choice is outlined in the bottom panels of the figure (as-suming a CIC level of 0.001). It shows that in PC and AMmode, there is little advantage of operating the EMCCD at less
than "0:5 fps. For a given CIC level, the maximum exposuretime should be dictated by the time needed for the dark noiseto dominate (about twice as high as the CIC). Moreover, thelosses due to saturation (in AM) or by coincidence (in PC)are becoming more important, and the rising of the integratingtime reduces the dynamic range of the images without providinga gain in SNR at low flux. Thus, there is a minimum frame rateat which the EMCCD should be operated, either in AM or PC.For a lower frame rate, there is no further gain in SNR to achieveat low fluxes, and losses occur at high fluxes.
Another problem with the CIC is that it is dependent of theEM gain (see § 3.2). The higher the EM gain, the higher the rateat which the CIC is generated. Thus, in order to reach the highEM gain needed for faint flux imaging (30–50 times the readoutnoise), one must really tame the CIC down to low levels.
3. CCCP PERFORMANCE
The camera built using CCCP and a CCD97 (hereafterCCCP/CCD97) was used to gather experimental data and tocompare the performance of the CCCP controller against anexisting, commercial, CCD97 camera (namely the, AndoriXonEM # 897 BI camera, hereafter the Andor camera). TheCCCP/CCD97 performance is also presented in absolute num-bers. All the data presented, for both cameras, were gathered at apixel rate of 10 MHz.
3.1. Real and Effective Readout Noise
The real readout noise of CCCP/CCD97 was measured at10 MHz of pixel rate using the photon transfer curve methodwith a faint, constant illumination and a varying integrationtime. For this technique, the variance of the images is plottedagainst the mean signal (read (Janesick 2001 for a detailedexplanation of the technique). This technique yields both thereadout noise and the reciprocal gain (electrons ADU!1) ofthe CCD.
Figure 5 shows the measurement for both the real and theeffective readout noise of CCCP /CCD97. The various plotsof the left panel show that the real readout noise is not depen-dent of the EM gain. Indeed, there is no reason why the readoutnoise of the EMCCD could not be affected by the EM gain. Theclocking of the high-voltage (HV) clock could induce substratebounce, EMI, or cross-talk and increase the real readout noise.Moreover, the reciprocal gain of the charge domain (after am-plification) of the EMCCD could also change if the output am-plifier, for example, was not linear. The good concordance of thethree data sets of the left panel shows that the real readout noiseand the reciprocal gain of the EMCCD are stable. One canassume that the effective readout noise of the CCCP/CCD97can be calculated by means of
!eff "!G"1
G; (4)
FIG. 3.—Maximum proportion of counted photons as a function of the gainover readout noise ratio, for a 5! threshold.
EXTREME FAINT FLUX IMAGING WITH AN EMCCD 869
2009 PASP, 121:866–884

FIG. 4.—Effect of various CIC levels (in electron per pixel per image) on the SNR. SNR is plotted against the one of a perfect photon counting device that would beaffected only by shot noise. CIC rates are in electron per pixel per image, the dark noise is 0.001 electron pixel!1 per second, the EMCCDs are operated at aG=! ratio of50 and a saturation level of 200,000 electrons is assumed. (Top left) EMCCD in PC operated at 30 frames s!1with a threshold of 5!. (Top right) EMCCD in AM at 1frame s!1. (Bottom left) EMCCD in PC, CIC is 0.001 event pixel!1 per frame and integration time is varying. (Bottom right) EMCCD in AM, CIC is 0.001 event pixel!1
per frame and integration time is varying.
870 DAIGLE ET AL.
2009 PASP, 121:866–884
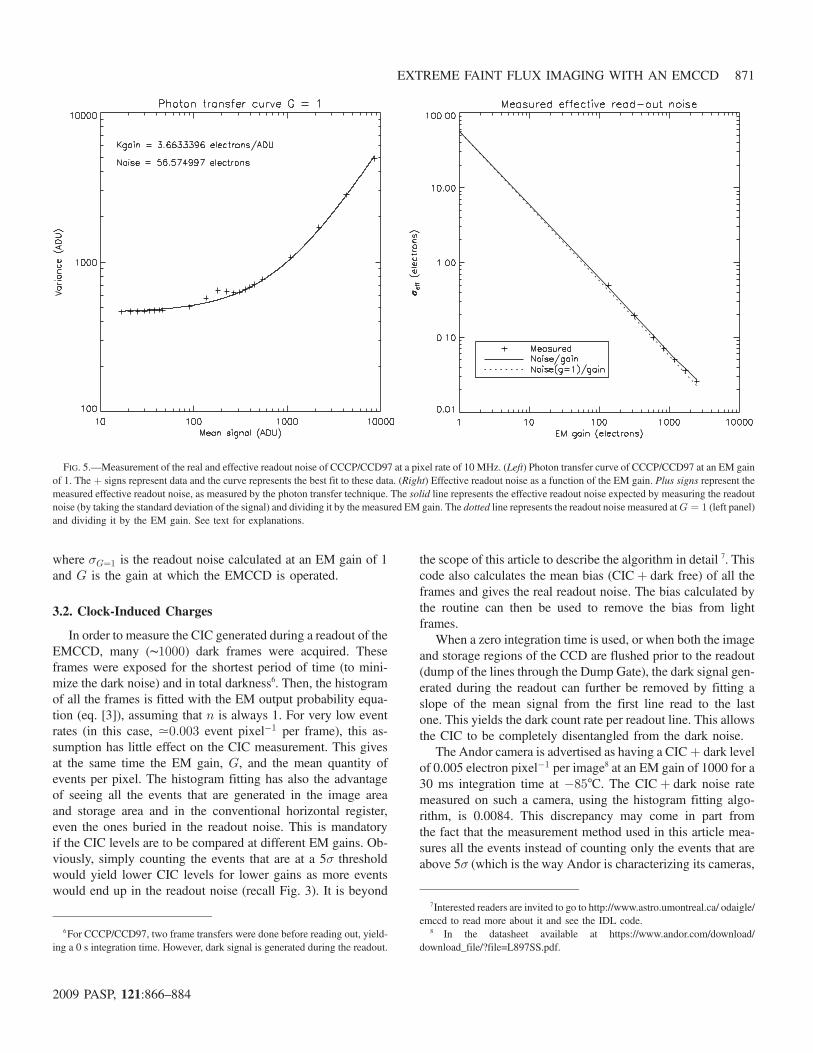
where !G"1 is the readout noise calculated at an EM gain of 1and G is the gain at which the EMCCD is operated.
3.2. Clock-Induced Charges
In order to measure the CIC generated during a readout of theEMCCD, many ("1000) dark frames were acquired. Theseframes were exposed for the shortest period of time (to mini-mize the dark noise) and in total darkness6. Then, the histogramof all the frames is fitted with the EM output probability equa-tion (eq. [3]), assuming that n is always 1. For very low eventrates (in this case, $0:003 event pixel!1 per frame), this as-sumption has little effect on the CIC measurement. This givesat the same time the EM gain, G, and the mean quantity ofevents per pixel. The histogram fitting has also the advantageof seeing all the events that are generated in the image areaand storage area and in the conventional horizontal register,even the ones buried in the readout noise. This is mandatoryif the CIC levels are to be compared at different EM gains. Ob-viously, simply counting the events that are at a 5! thresholdwould yield lower CIC levels for lower gains as more eventswould end up in the readout noise (recall Fig. 3). It is beyond
the scope of this article to describe the algorithm in detail 7. Thiscode also calculates the mean bias (CIC# dark free) of all theframes and gives the real readout noise. The bias calculated bythe routine can then be used to remove the bias from lightframes.
When a zero integration time is used, or when both the imageand storage regions of the CCD are flushed prior to the readout(dump of the lines through the Dump Gate), the dark signal gen-erated during the readout can further be removed by fitting aslope of the mean signal from the first line read to the lastone. This yields the dark count rate per readout line. This allowsthe CIC to be completely disentangled from the dark noise.
The Andor camera is advertised as having a CIC# dark levelof 0.005 electron pixel!1 per image8 at an EM gain of 1000 for a30 ms integration time at !85°C. The CIC# dark noise ratemeasured on such a camera, using the histogram fitting algo-rithm, is 0.0084. This discrepancy may come in part fromthe fact that the measurement method used in this article mea-sures all the events instead of counting only the events that areabove 5! (which is the way Andor is characterizing its cameras,
FIG. 5.—Measurement of the real and effective readout noise of CCCP/CCD97 at a pixel rate of 10 MHz. (Left) Photon transfer curve of CCCP/CCD97 at an EM gainof 1. The # signs represent data and the curve represents the best fit to these data. (Right) Effective readout noise as a function of the EM gain. Plus signs represent themeasured effective readout noise, as measured by the photon transfer technique. The solid line represents the effective readout noise expected by measuring the readoutnoise (by taking the standard deviation of the signal) and dividing it by the measured EM gain. The dotted line represents the readout noise measured atG " 1 (left panel)and dividing it by the EM gain. See text for explanations.
6For CCCP/CCD97, two frame transfers were done before reading out, yield-ing a 0 s integration time. However, dark signal is generated during the readout.
7Interested readers are invited to go to http://www.astro.umontreal.ca/ odaigle/emccd to read more about it and see the IDL code.
8 In the datasheet available at https://www.andor.com/download/download_file/?file=L897SS.pdf.
EXTREME FAINT FLUX IMAGING WITH AN EMCCD 871
2009 PASP, 121:866–884
as stated in their datasheets). This camera is not capable ofhigher EM gains and it is thus not possible to measure the CICat higher gains. Obtaining a higher EM gain is just a matter ofproducing an HV clock that has a higher amplitude. The Andorcamera could probably be used at higher EM gain but it islimited by software at 1000. However, as it will be shown in§ 3.4, the higher the EM gain, the higher the sensitivity of theEM gain to the amplitude of the HV clock. Thus, greater gainmust come with greater stability of the HV clock. Moreover, ahigher EM gain means a higher CIC level.
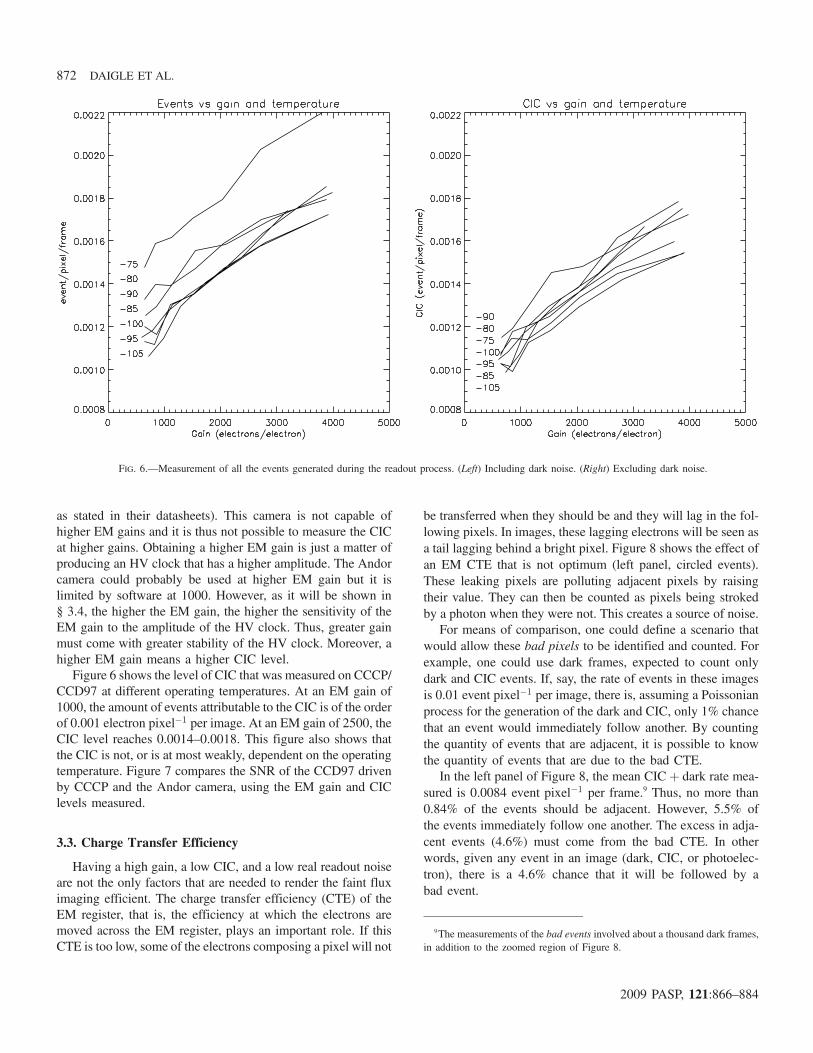
Figure 6 shows the level of CIC that was measured on CCCP/CCD97 at different operating temperatures. At an EM gain of1000, the amount of events attributable to the CIC is of the orderof 0.001 electron pixel!1 per image. At an EM gain of 2500, theCIC level reaches 0.0014–0.0018. This figure also shows thatthe CIC is not, or is at most weakly, dependent on the operatingtemperature. Figure 7 compares the SNR of the CCD97 drivenby CCCP and the Andor camera, using the EM gain and CIClevels measured.
3.3. Charge Transfer Efficiency
Having a high gain, a low CIC, and a low real readout noiseare not the only factors that are needed to render the faint fluximaging efficient. The charge transfer efficiency (CTE) of theEM register, that is, the efficiency at which the electrons aremoved across the EM register, plays an important role. If thisCTE is too low, some of the electrons composing a pixel will not
be transferred when they should be and they will lag in the fol-lowing pixels. In images, these lagging electrons will be seen asa tail lagging behind a bright pixel. Figure 8 shows the effect ofan EM CTE that is not optimum (left panel, circled events).These leaking pixels are polluting adjacent pixels by raisingtheir value. They can then be counted as pixels being strokedby a photon when they were not. This creates a source of noise.
For means of comparison, one could define a scenario thatwould allow these bad pixels to be identified and counted. Forexample, one could use dark frames, expected to count onlydark and CIC events. If, say, the rate of events in these imagesis 0.01 event pixel!1 per image, there is, assuming a Poissonianprocess for the generation of the dark and CIC, only 1% chancethat an event would immediately follow another. By countingthe quantity of events that are adjacent, it is possible to knowthe quantity of events that are due to the bad CTE.
In the left panel of Figure 8, the mean CIC# dark rate mea-sured is 0.0084 event pixel!1 per frame.9 Thus, no more than0.84% of the events should be adjacent. However, 5.5% ofthe events immediately follow one another. The excess in adja-cent events (4.6%) must come from the bad CTE. In otherwords, given any event in an image (dark, CIC, or photoelec-tron), there is a 4.6% chance that it will be followed by abad event.
FIG. 6.—Measurement of all the events generated during the readout process. (Left) Including dark noise. (Right) Excluding dark noise.
9The measurements of the bad events involved about a thousand dark frames,in addition to the zoomed region of Figure 8.
872 DAIGLE ET AL.
2009 PASP, 121:866–884

FIG. 7.—Comparison of the SNR of a CCCP/CCD97 and the Andor camera. Comparisons are normalized with a perfect photon-counting device. Both cameras have aQE of 80%, a dark noise of 0.001 electron pixel!1 per second and a saturation level of 200,000 electrons. For CCCP, the gain over readout noise ratio is 30 and the CICrate is 0.0023. For the commercial camera, the gain over readout noise ratio is 16 and the CIC rate is 0.0084. In both cases, the effect of bad events is ignored. (Top left)Cameras operated in PC. Both cameras are running at 30 frames s!1. (Top right) Cameras operated in AM. Both cameras are running at 1 frame s!1. (Bottom) Efficiencycomparison, showing the ratio of the time needed to reach a given SNR at a given flux, between CCCP/CCD97 and the Andor Camera.
EXTREME FAINT FLUX IMAGING WITH AN EMCCD 873
2009 PASP, 121:866–884

In the left panel of Figure 8, the bad event rate is measured tobe 0.46%, where the expected rate is 0.18%. Thus, one can tellthat at !85°C and at a gain over readout noise ratio of 22, thereare only "0:3% bad events with the CCCP/CCD97 camera.Thus, even if CCCP’s EM gain is higher than that of the Andorcamera, the first has a much lower bad event rate, which meansthat the CTE figure of the EMCCD can be better handledwith CCCP.
The deterioration of the CTE increases with both the EMgain and the low temperature of the CCD (Fig. 9). Adjustmentsto the clocking (clock overlap voltages, clock frequency com-ponents, clock high and low levels, etc.) were performed afterthese measurements were made and better CTE figures are nowaccomplished, as can be seen in Figure 8. However, the behaviorof the CTE as a function of the temperature and gain is main-tained: the bad event rate rises with the EM gain and with lowertemperatures.
3.4. Gain Stability
The stability of the gain of an EMCCD is important as it willaffect the photometric measurements. The gain of the EM reg-ister is very sensitive to the variations of the HV clock. Thehigher the gain, the higher the sensitivity to the HV clock am-plitude (Fig. 10, bottom panel). At a high gain, a variation of 1 Vin the amplitude of the HV clock represents more than a twofoldvariation of the EM gain. This means that in order to achieve again stability of the order of a percent, the HV clock must bestable within "5 mV. The EM register is also sensitive to thetemperature (Fig. 10, top panel). In the EM gain regime shown,the temperature must be controlled within &0:1°C in order toachieve a gain stability of &1%.
3.4.1. Gain Stability over Time
The stability of the EM gain of CCCP/CCD97 has been mea-sured by taking dark images continuously at high gain(G=!$ 30), moderate frame rate (10 fps), and at a temperature
FIG. 9.—Fraction of bad events as a function of the EM gain and temperature(in °C), as measured with CCCP/CCD97. The bad event rate shown in this figureis not compensated from the natural rate at which two adjacent events can occur.
FIG. 8.—Effect of a bad CTE on EMCCD images taken with a commercial camera and with CCCP/CCD97. Dark images are taken at high gain and were zoomed andfalse-colored to enhance details. Both cameras were operated at !85°C. (Left) Andor camera. We clearly see some pixels that are leaking in the horizontal direction(circled). The event rate (dark# CIC) measured on this camera is 0.0084 electron pixel!1 per image. The gain over readout noise ratio is 22. The bad event rate measuredis 4.6% (see text for a definition of bad event rate). (Right) CCCP. Pixel leaks are far less apparent. One could note that there are also fewer events since the CIC level islower in CCCP’s images. The event rate (dark# CIC) measured is 0.0018. The gain over readout noise ratio is 22. The bad event rate is 0.3%.
874 DAIGLE ET AL.
2009 PASP, 121:866–884

of !85°C. In total, 30,000 images were acquired. Then, the EMgain of these images was determined using the usual algorithm.The algorithm used a window of 400 frames out of the 30,000and slid 400 frames every iteration. Thus, 75 data points wereproduced, each representing about 40 s. The results are shown inFigure 11, left panel. The error bars in this figure are calculatedusing
e " G
!!!2
n
r; (5)
whereG is the EM gain measured and n is the quantity of eventsthat were used to obtainG. The constant 2 is used to account forthe ENF of the EMCCD.
The gain variation over time is thought to be due to the var-iation of the temperature, rather than the variation of the HVclock amplitude. The temperature controller used to gather thesedata has an accuracy slightly worse than &0:1°C.
3.4.2. Gain Stability over Frame
The EM gain must also be stable through an image or, atleast, its variation must be well characterized. EM gain variationmay come from the HV clock amplitude which can take sometime to stabilize at the beginning of the frame, given that the HVclock is turned off during the integration time. Even if the HVclock is kept running during the integration time, the capacitivecoupling between it and the conventional horizontal clocks can
induce a variation of the HV amplitude when they are activatedand, consequently, a variation in the gain.
The 30,000 frames used in § 3.4.1 were used once again tomeasure the gain over the image. The EM gain was determinedon a per-line basis rather than on an image basis. Then, lineswere binned by 8 to increase the SNR (given eq. [5]). Thisyields the right panel of figure 11.
One can see that the HV clock takes about 32 lines to sta-bilize within the&1% gain variation. The HV clock was stoppedduring the exposure time of these frames. This gain variation isstable, which can be taken into account while processing the rawdata to yield accurate photometric measurements.
3.5. Experimental SNR
Experimental SNR curves were obtained in the lab. In orderto do so, a scene spanning about 3 orders of magnitude in con-trast has been observed (figure 12, bottom panels). Two acqui-sitions were performed: PC and AM, where the exposure timewas set to 0.05 s and 0.5 s, respectively.
Even though care has been taken to put the lab in total dark-ness, the background of the scene was still very faintly lit (about0:02 photon pixel!1s!1), which explains the background sig-nal. In total, 86,000 images with an exposure time of 0.05 sand 8600 images with an exposure time of 0.5 s were acquired.The same amount of dark frames having the same exposure timewere also acquired to remove the CIC# dark component. Thedark frames were used to calculate the effective EM gain, byhistogram fitting (see § 3.2). The mean bias has been extractedfrom the dark frames and has been used to subtract the bias of allthe light frames.
As for any CCCP data acquisition, the raw data coming outof CCCP during this experiment were stored in fits files duringthe acquisition and these files are then processed off-line. Theresulting SNR curves are presented in Figure 12. The frameswhere a cosmic ray was detected were simply removed. Thisaccounted for about 0.15% of the frames in PC and for about1.5% in AM.
3.5.1. PC Processing
The PC frames were processed with a threshold of 5!. How-ever, the sum of the PC frames, minus the dark frames, givesonly the amount of counted photons, cp, whereas one wantsto know the sum of incident photons, f . There are two possiblesources of losses:
1. The threshold, which is responsible for the loss of theevents not amplified enough and ending up in the readout noise;
2. The events that are lost due to coincidence.
The proportion of the events lost due to the threshold, el, isgiven by equation (2) if one uses cp as ". The values of G andcut were, in this case, 30! and 5!, respectively. Thus, the
FIG. 10.—(Top) Sensitivity of the EM gain to the temperature of the EMCCD.(Bottom) Sensitivity of the EM gain to the maximum level of the HV clock.
EXTREME FAINT FLUX IMAGING WITH AN EMCCD 875
2009 PASP, 121:866–884

correction can be made simply by dividing the cp by 1! el. Thisgives the amount of detected photons, dp.
The coincidence losses can be modeled by simple Poissonianstatistics. If the amount of incident photons, f , is unknown, theprobability of having zero photon is known. This is simply1! dp. Thus, 1! dp represents the probability of havingzero photons under a flux of f , and f can be recovered bymeans of
f " ! ln$1! dp%: (6)
This correction, however, induces an excess noise that scales as
Fc "1
e!f: (7)
At low flux, Fc approaches the value of 1. It is only under mod-erate fluxes, where coincidence losses become important, thatFc prevails.
Now, one can calculate the effective SNR of the image forevery pixel. The SNR is given by
SNRPC " f!!!!!!!!!!F 2
cNp ; (8)
where N is the variance of the pixel over all the 86,000 frames.This SNR curve can then be compared to the curve of a perfect
PC system whose noise would be only the shot noise, which isSNR "
!!!f
p. This gives the experimental points shown in Fig-
ure 12, left panel. The theoretical curve is given by
SNRPCt" S!!!!!!!!!!!!!!!!!!!
$S #D%gp ; (9)
where S is the incident flux, andD is the mean CIC# dark rate(the mean of all the dark frames). The term g is the excess noiseinduced by the coincidence loss and its correction that are im-plied by the PC processing
g " S #D
e!$S#D%: (10)
In this case, D is 0:0023 event pixel!1 per image. Of course,all of these corrections do not take into account the photonslost due to the QE. However, there is nothing CCCP cando about it and the plots are made according to a perfectphoton counting system that would have the same QE as theCCD97.
The agreement between the theoretical and the experimentalcurves for the PC processing is nearly perfect (Fig. 12, top leftpanel). The image resulting from the averaging of all 86,000frames is shown in the bottom left panel of the figure.
FIG. 11.—Stability of the EM gain. The plain line shows the median of the data set while the dashed lines shows a #=! 1% variation. (Left) Stability over time.(Right) Stability over frame.
876 DAIGLE ET AL.
2009 PASP, 121:866–884

3.5.2. AM Processing
The case of the AM processing is simpler. The flux in a pixelis given by dividing its value by the EM gain at which the imagewas acquired. The mean flux of a pixel, f , is simply given by themean value of the same pixel across all the images minus thedark signal measured for that pixel. The SNR of a pixel is sim-ply given by
SNRAM " f!!!!!N
p ; (11)
where N is the variance of that pixel through all of the AMframes. When this SNR curve is normalized by that of a perfectphoton-counting system, this gives the experimental curveshown in Figure 12, right panel.
The theoretical curve of that figure is obtained by taking intoaccount the ENF, F , that plagues the EMCCD. Thus, the SNRequation is given by
SNRAMt" f!!!!!!!!!!!!!!!!!!!!!!!!!!!!!!!!!!!!!!!
$f2 # d2%F 2 # !2eff
q ; (12)
FIG. 12.—(Top) Experimental SNR curves. Curves were obtained by acquiring 80,000 images with CCCP/CCD97 of a very low lit scene. The exposure time was0.05 s and 0.5 s for the PC and AM acquisitions, respectively. Both acquisition were made at aG=! ratio of 30. The theoretical plots are those of an EMCCD having thesame G=! ratio and a CIC# dark rate of 0.0023 and 0.0025 for PC and AM, respectively. A pixel value distribution is superimposed on the plots. (Left) SNR after PCprocessing. (Right) SNR after AM processing. (Bottom) Mean of all the images acquired to produce the plots of the top panels, dark# CIC subtracted. The images arerotated by 90°. The horizontal shifting direction is from top to bottom and the vertical shifting direction is from right to left. (Left) Image of the PC acquisition, after PCprocessing. (Right) Image of the AM acquisition, after AM processing.
EXTREME FAINT FLUX IMAGING WITH AN EMCCD 877
2009 PASP, 121:866–884

where !eff is the effective readout noise. Since the EM gain ishigh (30!), F 2 takes the value of 2. The CIC# dark, d, is0.0025 in that plot.
In order to reach very faint fluxes with the AM processing,the bias needs to have an extremely high SNR. There must be asmany frames used to build the bias as there are light frames toprocess. If not, since the same bias is used for all the lightframes, the noise of the bias will become the dominant sourceof noise in the final images. The PC processing is not as sensi-tive as the AM processing to the SNR of the bias. In PC, thebias’s noise will be removed by the threshold applied to the data.
The plots also shows that the EM gain is accurately deter-mined, which is critical for AM processing. The experimentalAM plot would shift up or down if the EM gain were under-estimated or overestimated, respectively.
3.5.3. Comments
A result of this experiment that might have struck an attentivereader is the higher than expected CIC# dark rate in PC. Onmeasurements made with histogram fittings (as in Fig. 6),the CIC# dark rate was about 0.0018 for a G=! ratio of"30. The fitting of the SNR curves needed a CIC# dark levelof 0.0023 in order to agree with the experimental data. This isalso the mean event rate measured in the dark frames of the PCacquisition. This behavior is explained through CIC and darkelectrons generated into the EM register. This is in agreementwith the fact that the mean source of CIC in CCCP/CCD97comes from the CIC that is generated into the horizontal register(Daigle et al. 2008). Given that the EM register sole existence isdriven by the fact that it generates electrons, it is understandablethat it generates CIC too. Dark electrons can also be generatedin the EM register. The mean amplification of these CIC anddark electrons varies according to the elements into whichthe charge is created. The exact amount of CIC that is generatedinto the EM register is hard to compare at different G=! ratios.At low G=!, mostly all of these CIC events will end up in the
readout noise, making it impossible to count them. So, it hasbeen decided not to count them when comparing CIC levels.However, they must be accounted for in the SNR plots.
The effect of these lightly multiplied events will be strongerin the PC data than in the AM data. The PC-processed data seean event as an event, regardless of its multiplication factor. TheAM-processed data, however, will see, on average, these eventsas having less than one input electron. Thus, the CIC# darklevel computed in PC will differ from the one computed inAM. As an example, the CIC# dark level of the PC dark frames(0.05 s exposure time) of figure 12 is 0.0023. If these darkframes are processed in AM, the mean signal level measuredis 0.0015 event/pixel/image, which is closer to the values pre-sented in figure 6. Given these facts, the threshold used for thePC processing could be raised (6!, 7!) to avoid counting someof theses events. Of course, the proportion of counted photonswould diminish. An optimum threshold, yielding the best SNR,could be calculated.
The image of the low light scene (Fig. 12, bottom panel)shows trailing electrons behind the most luminous pixels.The trail is about 2 orders of magnitude fainter than the mostlylit pixel on its line. This could be caused either by the low hor-izontal CTE in the EM register or the heating of the multiplica-tion register when many electrons are generated into it. It isunlikely that this trailing happens in the conventional horizontalregister as there is very rarely more than one electron per ele-ment in the PC image (the highest mean flux being about 0:5photon pixel!1 image). Surprisingly, this effect is less visible inthe AM image, where more electrons/pixel are gathered, giventhe tenfold increase in exposure time. This relation holds foreven longer exposure times, as shown in Figure 13, where ex-posure times of 5 and 15 s frame!1 were used, at the same EMgain (AM processing). These frames also show that these trail-ing electrons are not the result of an overflow of the horizontalregister since it would worsen as the exposure time increasesand more electrons are gathered. This phenomenon, however,
FIG. 13.—(Left) Same as the AM image in Fig. 12, but with an exposure time of 5 s frame!1. (Right) Same as the left panel, but with an exposure time of 15 s frame!1.
878 DAIGLE ET AL.
2009 PASP, 121:866–884
did not compromise the quality of the scientific data, as dis-cussed in § 4.
4. SCIENTIFIC RESULTS
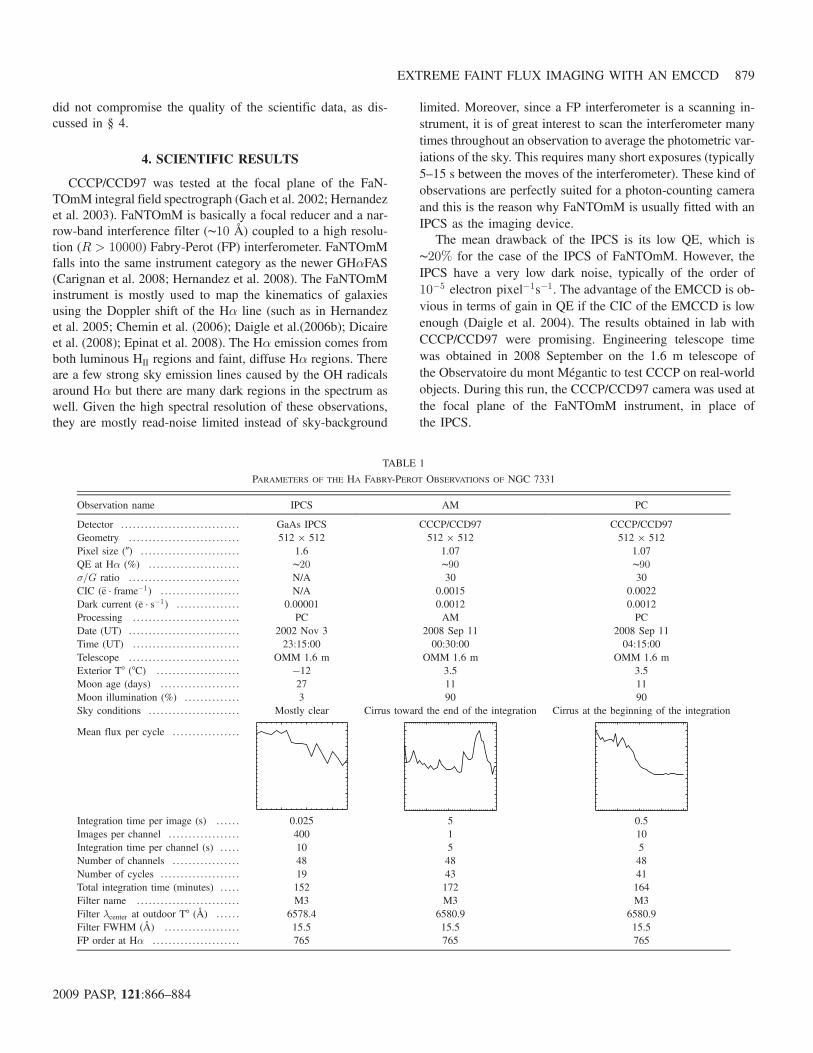
CCCP/CCD97 was tested at the focal plane of the FaN-TOmM integral field spectrograph (Gach et al. 2002; Hernandezet al. 2003). FaNTOmM is basically a focal reducer and a nar-row-band interference filter ("10 Å) coupled to a high resolu-tion (R > 10000) Fabry-Perot (FP) interferometer. FaNTOmMfalls into the same instrument category as the newer GH#FAS(Carignan et al. 2008; Hernandez et al. 2008). The FaNTOmMinstrument is mostly used to map the kinematics of galaxiesusing the Doppler shift of the H# line (such as in Hernandezet al. 2005; Chemin et al. (2006); Daigle et al.(2006b); Dicaireet al. (2008); Epinat et al. 2008). The H# emission comes fromboth luminous HII regions and faint, diffuse H# regions. Thereare a few strong sky emission lines caused by the OH radicalsaround H# but there are many dark regions in the spectrum aswell. Given the high spectral resolution of these observations,they are mostly read-noise limited instead of sky-background
limited. Moreover, since a FP interferometer is a scanning in-strument, it is of great interest to scan the interferometer manytimes throughout an observation to average the photometric var-iations of the sky. This requires many short exposures (typically5–15 s between the moves of the interferometer). These kind ofobservations are perfectly suited for a photon-counting cameraand this is the reason why FaNTOmM is usually fitted with anIPCS as the imaging device.
The mean drawback of the IPCS is its low QE, which is"20% for the case of the IPCS of FaNTOmM. However, theIPCS have a very low dark noise, typically of the order of10!5 electron pixel!1s!1. The advantage of the EMCCD is ob-vious in terms of gain in QE if the CIC of the EMCCD is lowenough (Daigle et al. 2004). The results obtained in lab withCCCP/CCD97 were promising. Engineering telescope timewas obtained in 2008 September on the 1.6 m telescope ofthe Observatoire du mont Mégantic to test CCCP on real-worldobjects. During this run, the CCCP/CCD97 camera was used atthe focal plane of the FaNTOmM instrument, in place ofthe IPCS.
TABLE 1
PARAMETERS OF THE H$ FABRY-PEROT OBSERVATIONS OF NGC 7331
Observation name IPCS AM PC
Detector . . . . . . . . . . . . . . . . . . . . . . . . . . . . . . GaAs IPCS CCCP/CCD97 CCCP/CCD97Geometry . . . . . . . . . . . . . . . . . . . . . . . . . . . . 512 ! 512 512 ! 512 512 ! 512Pixel size (!) . . . . . . . . . . . . . . . . . . . . . . . . . 1.6 1.07 1.07QE at H# (%) . . . . . . . . . . . . . . . . . . . . . . . "20 "90 "90!=G ratio . . . . . . . . . . . . . . . . . . . . . . . . . . . . N/A 30 30CIC (!e · frame!1) . . . . . . . . . . . . . . . . . . . . N/A 0.0015 0.0022Dark current (!e · s!1) . . . . . . . . . . . . . . . . 0.00001 0.0012 0.0012Processing . . . . . . . . . . . . . . . . . . . . . . . . . . . PC AM PCDate (UT) . . . . . . . . . . . . . . . . . . . . . . . . . . . . 2002 Nov 3 2008 Sep 11 2008 Sep 11Time (UT) . . . . . . . . . . . . . . . . . . . . . . . . . . . 23:15:00 00:30:00 04:15:00Telescope . . . . . . . . . . . . . . . . . . . . . . . . . . . . OMM 1.6 m OMM 1.6 m OMM 1.6 mExterior T° (°C) . . . . . . . . . . . . . . . . . . . . . %12 3.5 3.5Moon age (days) . . . . . . . . . . . . . . . . . . . . 27 11 11Moon illumination (%) . . . . . . . . . . . . . . 3 90 90Sky conditions . . . . . . . . . . . . . . . . . . . . . . . Mostly clear Cirrus toward the end of the integration Cirrus at the beginning of the integration
Mean flux per cycle . . . . . . . . . . . . . . . . .
Integration time per image (s) . . . . . . 0.025 5 0.5Images per channel . . . . . . . . . . . . . . . . . . 400 1 10Integration time per channel (s) . . . . . 10 5 5Number of channels . . . . . . . . . . . . . . . . . 48 48 48Number of cycles . . . . . . . . . . . . . . . . . . . . 19 43 41Total integration time (minutes) . . . . . 152 172 164Filter name . . . . . . . . . . . . . . . . . . . . . . . . . . M3 M3 M3Filter "center at outdoor T° (Å) . . . . . . 6578.4 6580.9 6580.9Filter FWHM (Å) . . . . . . . . . . . . . . . . . . . 15.5 15.5 15.5FP order at H# . . . . . . . . . . . . . . . . . . . . . . 765 765 765
EXTREME FAINT FLUX IMAGING WITH AN EMCCD 879
2009 PASP, 121:866–884

4.1. Observations
The galaxy NGC 7731 was observed during this run. Thisgalaxy has already been observed with FaNTOmM/IPCSthrough the SINGS H# survey (Daigle et al. 2006b). This ob-servation will allow the comparison of the sensitivity of CCCP/CCD97 with FaNTOmM/IPCS.
The parameters of the observations are presented in Table 1.All the data cubes were processed with the data reduction tech-niques presented in Daigle et al.(2006c). The sky emission was
subtracted by a sky-cube fitting. No spatial smoothing was ap-plied. The radial velocity (RV) maps were extracted and thencleaned by an automatic routine that correlates a pixel to thecontinuum and monochromatic flux-weighted value of theneighboring ones to determine its validity, based on a maximumdeviation. Then, a manual cleanup removes the pixels whoseRV has been incorrectly determined. This is usually due to somesky residuals that are polluting the pixel.
In Table 1, the plot of the mean flux per cycle is shown. This,coupled to the moon and sky conditions, gives a rough idea of
FIG. 14.—Monochromatic intensity maps, after the sky emission removal. (Top left) IPCS. (Top right) CCCP/CCD97, 5 s exposure time per image, AM processing.(Bottom left) CCCP/CCD97, 0.5 s exposure time per image, PC processing. (Bottom right) CCCP/CCD97, 0.5 s exposure time per image, AM processing.
880 DAIGLE ET AL.
2009 PASP, 121:866–884

the quality of the data. The moon was absent when the observa-tion with the IPCS was made and the sky was mostly clear.Thus, the slight drop in the flux toward the end of the observa-tion can be explained by absorption. On the other hand, themoon was mostly full (hence the engineering time) duringthe CCCP/CCD97 observations and there were a few cirrus.The cirrus were lit by the moon and this caused the flux to risetoward the end of the AM and at the beginning of the PC
observation. Moreover, the moon’s light excites the OH radicalsin the upper atmosphere and makes them glow brighter. Thiscauses the sky-emission lines around H# to be stronger, which,once subtracted, leaves a noisier background due to shot noise.The same thing happens once the brighter foreground causedby the clouds lit by the moon is subtracted. It thus takes morephotons from the galaxy to reach a given SNR in the CCCP/CCD97 observations.
FIG. 15.—RV maps. (Top left) IPCS. (Top right) CCCP/CCD97, 5 s exposure time per image, AM processing. (Bottom left) CCCP/CCD97, 0.5 s exposure time perimage, PC processing. (Bottom right) CCCP/CCD97, 0.5 s exposure time per image, AM processing.
EXTREME FAINT FLUX IMAGING WITH AN EMCCD 881
2009 PASP, 121:866–884

On the other hand, the interference filter’s transmission alsochanges from the IPCS to the CCCP/CCD97 observation be-cause of the exterior temperature. Given its systemic velocityof 816 km s!1, NGC 7331’s rest H# wavelength is at 6580 Å.
Its H# emission was better centered in the CCCP/CCD97observation. On the IPCS observation, this should benefit theapproaching side of the galaxy while weakening the reced-ing side.
FIG. 16.—Pixel flux distributions of the observation of NGC 7331. The dotted line shows the pixel flux distribution and the solid line shows the relative SNR expectedfor this flux. The SNR curve includes the QE, CIC, dark, and exposure time parameters of table 1. (Top left) PC observation, 0.5 s image!1. The flux has been correctedfor the coincidence losses, which explains the possibility to have more than one photon per image. (Top right) AM observation, 5 s image!1. (Bottom) IPCS observation.Given the high frame rate of the IPCS, there is no need to correct the coincidence losses.
882 DAIGLE ET AL.
2009 PASP, 121:866–884

4.2. IPCS and CCCP/CCD97 Comparisons
On the whole, it is a delicate matter to compare observationsmade under different environmental and photometric condi-tions. Nevertheless, the observations should give a first-orderestimate of how the CCCP/CCD97 compares to the IPCS.The monochromatic intensity (MI) maps and the RV maps ofall the observations are provided in Figures 14 and 15. Onestriking observation is that, even though the integration timeis comparable between the IPCS and the CCCP/CCD97 obser-vations, the galaxy’s approaching side is barely visible on theMI map of the IPCS. This is reflected in the RV map, whichshows only a few sparse pixels from this side of the galaxy.By comparing with the CCCP/CCD97 observations, it is ques-tionable whether these pixels are giving an accurate reading ofthe rotation velocity of this side of the galaxy. Even though theobservation’s conditions were different, it is hardly conceivablethat the IPCS observation could have gone deeper than theCCCP/CCD97 observation even in perfect conditions. More-over, the colder temperature at which the IPCS data were ac-quired should benefit the approaching (red) side as comparedto the CCCP/CCD97 observation.
4.3. Efficiency
The efficiency at which the data were gathered is outlined byFigure 16. This figure shows the pixel’s mean intensity distri-bution in the data cubes superimposed on the expected SNRcurve for that flux regime. It shows that all the observationswere made in roughly the best conditions for the detectorsand their modes of operation. The IPCS mean pixel flux is verylow: the IPCS is operated at 40 frames s!1 but does not sufferfrom CIC. Thus, there is no loss at operating that fast.
4.4. PC versus AM Processing
The observing conditions prevailing when the PC and AMdata cubes were gathered were not stable enough to provide aconvincing comparison. One could see that the background ofthe MI map of the PC observation is smoother (Fig. 14). The RVmap of the AM observation looks “skinny” as compared to thePC one. On this side, it is better to rely on experimental datataken in lab in order to compare both operating modes with theirrespective integration time (§ 3.5).
One comparison that is absolute, however, is the comparisonof the PC and AM processing on the data acquired at 0.5 s frame!1 on CCCP/CCD97 (the PC observation). Since there are veryfew pixels having "1 photon image!1 (Fig. 16), the effectiveSNR of the data cube processed in PC should be higher thanthe one processed in AM. But how does this obvious fact in-fluence the quality of the reduced data of NGC 7331?
The bottom panels of Figures 14 and 15 shows, respectively,the monochromatic intensity and the RV maps of both the PCand AM processing of the PC observation. First, the monochro-matic map of the PC processing shows a smoother and darker
background, which means that the sky emission has been betterremoved. This is very important as it will allow the resolving ofthe radial velocity of fainter regions of the galaxy. Next, the RVmap of the PC processing shows a more extended coverage ofthe signal. This extended coverage is seen as more pixels nearthe edge of HII regions and more sparse pixels in diffuse H#regions. Figure 17 enhances these differences by drawing inblack the pixels that are exclusive to the PC or AM RV map.There are far more pixels exclusive to the PC RV map than thereare for the PC AM map. Thus, as expected, the PC processingyields a better, richer RV map than the AM processing.
5. SUMMARY AND CONCLUSIONS
A new camera built using CCCP, a CCD Controller forCounting Photons, and a scientific grade EMCCD CCD97 frome2v technologies was presented. This camera combines the highQE of the CCD with the subelectron readout noise of theEMCCD, allowing extreme faint flux imaging at an efficiencythat is comparable to a perfect photon-counting device. Labora-tory experiments showed that the camera behaved exactly aspredicted by theory, in terms of relative SNR as a functionof the flux, down to flux as low as 0:001 photon pixel!1
per image.It has been shown that the CCCP/CCD97 camera yields very
low CIC# dark levels at high EM gain, which represents a sig-nificant advance in the sensitivity that an EMCCD cameraequipped with a CCD97 can achieve. Moreover, it has beendemonstrated that the CTE figure of the EMCCD can be betterhandled with CCCP. It is beyond the scope of this article to de-scribe in detail the clocking that is applied to the CCD97 to yieldthe lower CIC and higher CTE. Interested readers are invited toread Daigle et al. (in preparation).
Both PC and AM processing were compared and it has beendemonstrated that the PC processing effectively allowed the
FIG. 17.—Differences between the PC and AM processing of the same ob-servation. The gray pixels represents pixels that are present in the RV maps ofboth processings. (Left) Black pixels represents the pixels that are unique to thePC-processed RV map. (Right) Black pixels represents the pixels that are uniqueto the AM-processed RV map.
EXTREME FAINT FLUX IMAGING WITH AN EMCCD 883
2009 PASP, 121:866–884

achievement of a better SNR, for the same data set. Evidencethat the PC processing yields a better SNR than the AM proces-sing, even at 10 times the frame rate, for the same total integra-tion time, was presented. Given that the theory behind the SNRof an EMCCD seems well understood, one could argue thatthe PC processing should yield a better SNR at low and 1mod-erate fluxes, even at a higher frame rate, as compared to AMprocessing.
The performance of CCCP/CCD97 was compared to that ofa GaAs photocathode-based IPCS on an extragalactic target in ashot noise-dominated regime. The achieved SNR of the CCCP/CCD97 observations is superior to the one achieved with theIPCS. Though it is delicate to compare two independent obser-vations taken at different photometric conditions, the resultspresented could hardly be due solely to the photometric condi-
tions. The CCCP/CCD97 camera must be, at some level, moresensitive than the IPCS, for the flux regime at which the datawere acquired.
A new camera that will use the second version of the CCCPcontroller is under construction at the LAE in Montréal. It willuse a larger 1600 ! 1600, non–frame-transfer EMCCD frome2v Technologies. This camera will be used as the high-resolu-tion camera at the focal plane of the 3D-NTT instrument(Marcelin et al. 2008) that is expected to see first light at theend of 2009.
O. Daigle is grateful to the NSERC for funding this studythough its Ph.D. thesis. We would like to thank the staff at theObservatoire du mont Mégantic for their helpful support, andthe anonymous referee for valuable comments.
REFERENCES
Basden, A. G., Haniff, C. A., & Mackay, C. D. 2003, MNRAS,345, 985
Carignan, C., Hernandez, O., Beckman, J. E., & Fathi, K. 2008,Pathways Through an Eclectic Universe, ASP Conf. Ser. 390, ed.J. Knapen, T. Mahoney, A. Vazdekis, 168
Chemin, L., et al. 2006, MNRAS, 366, 812Daigle, O., Gach, J.-L., Guillaume, C., Carignan, C., Balard, P., &Boisin, O. 2004, Proc. SPIE, 5499, 219
Daigle, O., Carignan, C., & Blais-Ouellette, S. 2006a, Proc. SPIE,6276, 62761F
Daigle, O., Carignan, C., Amram, P., Hernandez, O., Chemin, L.,Balkowski, C., & Kennicutt, R. 2006, MNRAS, 367b, 469
Daigle, O., Carignan, C., Hernandez, O., Chemin, L., & Amram, P.2006c, MNRAS, 368, 1016
Daigle, O., Gach, J.-L., Guillaume, C., Lessard, S., Carignan, C., &Blais-Ouellette, S. 2008, Proc. SPIE, 7014, 70146
Dicaire, I., et al. 2008, MNRAS, 385, 553e2v Technologies 2004, Technical Note 4Epinat, B., et al. 2008, MNRAS, 388, 500Gach, J.-L., et al. 2002, PASP, 114, 1043
Gach, J.-L., Guillaume, C., Boissin, O., & Cavadore, C. 2004, Scien-tific Detectors for Astronomy, 611
Hernandez, O., Gach, J.-L., Carignan, C., & Boulesteix, J. 2003, Proc.SPIE, 4841, 1472
Hernandez, O., Carignan, C., Amram, P., Chemin, L., & Daigle, O.2005, MNRAS, 360, 1201
Hernandez, O., et al. 2008, PASP, 120, 665Janesick, J. R. 2001, Scientific Charge-coupled Devices (monogr.
PM83; Bellingham, WA: SPIE Optical Engineering Press) 906Lantz, E., Blanchet, J.-L., Furfaro, L., & Devaux, F. 2008, MNRAS,
386, 2262Mackay, C., Basden, A., & Bridgeland, M. 2004, Proc. SPIE,
5499, 203Marcelin, M., et al. 2008, Proc. SPIE, 7014, 701455Robbins, M. S., & Hadwen, B. J. 2002, IEEE Trans. Electron Devices,
50, 1488RTulloch, S.et al. 2006, Scientific Detectors for Astronomy, 2005, 303Tulloch, S. 2008, High Time Resolution Astrophysics: The Universe at
Sub-Second Timescales, 984, 148Wen, Y., et al. 2006, Proc. SPIE, 6276, 62761H
884 DAIGLE ET AL.
2009 PASP, 121:866–884