extreme corals 2010 cruise report for noaa ship ronald...
TRANSCRIPT

EXTREME CORALS 2010
Cruise Report for NOAA ship Ronald H. Brown, 9-23 November 2010
Steve W. Ross, Chief Scientist Univ. NC-Wilmington, Center for Marine Science
5600 Marvin Moss Ln. Wilmington, NC 28409
Phone: 910-962-2346, email: [email protected]
and
Sandra D. Brooke, co-Chief Scientist Marine Conservation Biology Institute
2122 112th Ave NE, Suite B-300 Bellevue, WA 98004
Phone: 425-274-1180, email: [email protected]
20 January 2011

BACKGROUND To our knowledge the southeastern US (SEUS) and Gulf of Mexico (GOM) have the most extensive areas of Lophelia pertusa dominated habitats in US waters; however, until recently these regions were poorly explored. Deep coral habitats are difficult to study because of their great depths, rugged bottom topography, and extreme currents (i.e., Gulf Stream, Loop Current). In general, to study deep-sea coral banks requires expensive sampling techniques (e.g., manned submersibles, ROVs), which hampers the scope of research projects. In addition, the lack of substantial commercial fisheries in these depths made them low priority for research funding. Over the past decade, however, there has been considerable investment by federal agencies in deep coral research in the US. Although this has considerably expanded our knowledge of these complex ecosystems, research cruises continue to yield new data, and much of these regions still remains to be explored. Research cruises off the SEUS and in the GOM have focused on the scleractinian coral Lophelia pertusa because it is abundant, widely distributed, and creates complex structure that provides habitat for diverse communities of invertebrates and fishes. The research objectives and methods applied to Lophelia habitats are also applicable to other hard substrata ecosystems, including mixed corals and sponges, as well as artificial substrata such as shipwrecks and oil platforms. The research conducted during the 2010 cruise builds upon previous work by the cruise participants, who plan to expand ongoing research topics to increase understanding of these ecosystems and address major research gaps. As an integrated regional exploration of deep-reef physical structure and ecology, this interconnected, multidisciplinary approach will advance our understanding of important deep-sea habitats. Using standardized methods in all study regions facilitates comparisons among complex habitats over great depth and latitudinal ranges, and increases our understanding of how these ecosystems function and the degree to which they are interconnected. NOAA’s Coral Reef Conservation Program, through its Deep Sea Coral Research and Technology Program (DSCRTP) sponsored this research expedition, which is year two of a three-year research effort in the SEUS region. This expedition maintains continuity with the DSCRTP 2009 cruise (see http://fl.biology.usgs.gov/DISCOVRE/cruise_plan_2009.html). Like the 2009 expedition, the 2010 cruise was a partnership between NOAA, the University of NC at Wilmington, USGS, and a variety of collaborators. The multi-disciplinary team of investigators (see below) addressed: 1) program needs of the NOAA DSCRTP, 2) management needs of the South Atlantic Fishery Management Council (SAFMC), and 3) ongoing participant research priorities. Scientists from NOAA’s Cooperative Institute for Ocean Exploration Research and Technology (CIOERT) participated in the mission and collaborated with multiple science objectives. The research cruise utilized the NOAA ship Ronald H. Brown and the Jason II ROV (Woods Hole Oceanographic Institute). The research objectives emphasized the use of the ROV, but allowed for other sampling activities to generate data for complementary objectives. This expedition occurred immediately after a similar deep coral cruise (Lophelia II project funded by BOEMRE) in the GOM using the same ship and ROV. While impacts from the recent Deepwater Horizon oil spill seemed unlikely in this part of the Atlantic, cruise participants were aware of potential impacts and recorded any apparent oil related phenomena. The cruise mobilized in Pensacola, FL (08-09 Nov 2010) and demobilized in Cape Canaveral, FL (23 Nov). The ROV Jason II was used to conduct video transects and other photographic documentation, deploy equipment and make collections to meet the cruise objectives. When weather permitted, a single ROV dive was completed per day, and generally one to two days were spent at each site. In addition to ROV operations, several multibeam sonar surveys, CTD/Niskin

2
rosette casts, and otter trawls were conducted. Several small colonies of Lophelia were collected and maintained alive in a chilled re-circulating system on the ship, and we conducted some experiments on board ship with these samples. Although weather was marginal for much of the cruise, the cruise was generally considered successful. The expedition covered a large area and completed nine (of 12 scheduled) ROV dives, with additional sampling gear deployed whenever logistics and conditions allowed. This cruise title was ‘Extreme Corals 2010’ and two internet sites (http://deepcoral.wordpress. com and http://cioert.org/xcorals) documented cruise progress and facilitated public awareness of deep coral ecosystems and cruise objectives. These sites were linked to and supplemented by other sites which also had information about past missions (http://naturalsciences.org/microsites/ education/deepsea/index.html) or about deep-sea corals in general (www.lophelia.org). This report describes the field work accomplished during this cruise. Data analyses will follow and be detailed in future reports. CRUISE OBJECTIVES The Extreme Corals cruise directly followed a research cruise on deep corals in the GOM (funded by BOEMRE), which had similar objectives. Where possible, we collected samples for the BOEMRE-funded scientists, as they had done for scientists on the Extreme Corals cruise. The Extreme Corals cruise had several target deep coral sites in the eastern GOM and off the East coast of Florida (see Figs. 1-3). Considering the recent Deepwater Horizon oil spill (MC 252 Macondo well), special attention was paid to the status of habitats and communities encountered. If oil contamination was observed, it was entered onto station data sheets as appropriate. Cruise objectives were: 1) Document coral and sponge habitats, 2) Describe habitat associations, community structure, and map distributions of coral habitats, 3) Examine growth, reproduction, feeding and energetics of major structure forming corals, 4) Determine trophodynamics of communities associated with reef and off-reef habitats, 5) Collect samples for paleoecology (coral age, growth and historical temperature and productivity), 6) Describe reef physical environment 7) Collect water samples for aragonite saturation analysis from near corals and water column, 8) Collect live corals for multiple analyses and experiments, 9) Collect sponge samples for taxonomy, genetics and habitat characterization, 10) Collect samples for population genetics to assess connectivity between deep coral ecosystems, 11) Conduct education/outreach activities (teacher at sea, web sites, daily updates, blogs, etc.). Each PI provided data that allowed prioritization of dive locations, numbers of samples and target species. Each ROV dive always had multiple objectives, with tasks given priority for specific dives. METHODS Study Areas All target study sites for this project were on the continental slope (> 200 m) off the East coast of Florida, except for one station on the West Florida slope that was visited during transit to the Atlantic (Figs. 1-3). Multibeam sonar data from past surveys (as well as new data collected during the cruise) were used to help identify dive and sampling sites as well as to improve ROV navigation. Target sites were prioritized according to several criteria: 1) areas that were poorly explored and had a high probability of having well developed coral ecosystems, 2) areas that were high priority for the South Atlantic Fishery Management Council, 3) areas that represented data gaps in long term studies, 4) new areas that had not been explored previously. Similar methodologies were applied at all sites to facilitate large area comparisons.

3
Science Personnel The science crew came from Wilmington, NC, Bellevue, WA, College Station, TX, St. Petersburg, FL, Leetown, WV, Ft. Pierce, FL, Raleigh, NC, Lafayette, LA and Washington, DC. The science crew arrived at the ship on 7-8 November in Pensacola. The ROV crew was already on the ship, having participated in the previous GOM cruise. We conducted 24 hour operations with the scientific crew divided into two watches: 12 hrs on-12 hrs off. The night watch was on duty from 2000 to 0800 hr, while the day watch operated from 0800 to 2000 hr. The main night responsibilities were multi-beam sonar survey, bottom sampling with otter trawls, CTD casts, water sampling and specimen or data processing. Day watch responsibilities centered around ROV operations, but also included CTD casts and water sampling, multibeam sonar surveys, specimen processing and maintaining live coral tanks. Personnel (assignments, * = watch chief) Steve W. Ross* (UNCW, Chief Scientist, co-Lead PI) - Overall organization and cruise logistics,
ROV ops, fish communities Sandra Brooke (MCBI, co-Chief Scientist, co-Lead PI) – Assist with cruise logistics, coral biology,
live corals, aragonite samples, ROV ops Martha S. Nizinski (NMFS Systematics Lab, day) - ROV ops, wet lab organization, invertebrate data (all collections) Andy David (NOAA Fisheries, day) – assist all day ops., ROV ops John Tomczuk (NOAA, day) - Data Manager for NOAA Brendan Roark (TAMU, day) – coral samples for paleoecology, ROV ops John Reed (HBOI, FAU, day) – sponge data, help with site selection, ROV ops Mike Dunn (NCMNS, day) – Educator & outreach activities, web maintenance Art Howard (ArtWork, Inc., day) – Videographer, support education & outreach Beverly Owens (NCMNS, day) – teacher at sea provided by NCMNS Peyton Hale (NCMNS, day) – Photographer, assist education & outreach Katherine Coykendall (USGS, day) – Scleractinian genetics samples, coral samples, ROV ops Jana Thoma (Univ. of Louisiana, day) – Octocoral genetics samples, coral samples, ROV ops Mike Rhode* (UNCW, night watch chief) – CTD casts, bottom nets, gear management, GIS support, multibeam sonar Tara Casazza (UNCW, night) – CTD casts, bottom nets, gear management Jenny McClain (UNCW, night) - Data management, CTD casts, isotope sample processing, video
copying Steve Matthews (NOAA Fisheries, night) – CTD, assist all night ops Ten ROV crew were provided by WHOI to operate the Jason II ROV. Field Methods The Ronald H. Brown departed Pensacola, FL on 9 Nov 2010 (about 0900 hr) and steamed for coral banks located on the west Florida slope (about 270 nmi distance), arriving on station in the morning of 10 November. Because the Jason II’s new navigation system required calibration, the first activity in this study area was to deploy an elevator at ~600 m depth and conduct calibration transects. This required six to seven hours; however, the elevator acoustic release failed and Jason II was launched to recover it. This delayed operations considerably and the dive in this area was shortened (just over five hr bottom time) and occurred at night. All other dives were mostly during daylight. After recovery of the vehicle, the vessel steamed to the Miami Terrace (about 360 nmi

4
distance), arriving on 12 November. Sea conditions were too rough to dive in this area, so we steamed south to the Pourtales Terrace, where we conducted a short ROV dive followed by multibeam sonar surveys. We continued to work in this area through 13 November, waiting for weather to improve further north. Adverse weather caused the ROV dive to be cancelled on 14 November; therefore, we conducted multibeam sonar surveys and then steamed north to the Jacksonville lithoherm study area where we conducted ROV and surface operations from 15-18 November. Since adverse weather prevented the ROV dive on 16 November, multibeam sonar surveys, CTD casts and transects were conducted in this region. After the dive on 18 November, the ship moved south to the study areas off Cape Canaveral. We again lost the ROV dive on 19 November due to inclement weather. We worked in the Cape Canaveral region from 19-22 November, conducting ROV dives, CTD casts, bottom trawls and multibeam sonar surveys. After the last ROV dive the Ronald H Brown moved inshore and waited all night until coming into Port Canaveral fueling dock on 23 November (about 0930). Science crews unloaded the vessel and departed that day. Jason II ROV (Figs. 4, 5) Each ROV dive was scheduled for about 12 hours, 0800-2000 hr (deck to deck). While flexibility was allowed to respond to unforeseen events, most ROV dives followed a similar pattern, emphasizing bottom transecting, sample collecting and photographing specimens and habitats on or near the bottom. In general, a lead scientist managed the ROV dive assisted by two other people (an event logger and a video data manager) from the science crew. There were also three to four ROV crew in the control van. The lead scientist (this position rotated through the senior science personnel) controlled the dive activities and guided the ROV operators. Guidelines for dive objectives and video operations were provided in the cruise plan, and were re-iterated during the cruise as needed. Scientists in the control van used the WHOI computerized system to create event logs of launch and recovery, transect start and finish, collections, habitat observations, equipment deployments, etc., and also generated hard copy back-up datasheets to record the same information. The ROV was usually launched south of the target site to compensate for the northerly Gulf Stream current. The descent through the water column to the seafloor took longer than expected on every dive, either due to strong currents or navigational problems. During descent, observations were made on distributions/behaviors of fauna or any indications of oil/dispersant contamination. Position fixes (GPS coordinates and depth) were taken when the ROV landed on bottom, at the start and end of each transect, at each collection, at noteworthy observations, and when the ROV left bottom. Specimen collecting began soon after landing on the bottom, unless target animal abundance was low. The relative proportion of time spent collecting samples, taking video transects or completing other objectives varied by dive and current conditions. For video transects, the high definition (HD) video camera (NDSF HDTV Hybrid Motion and Still Imaging System) was positioned to record directly in front of the ROV, set on wide angle (or near wide angle), and the ROV ran video transects at slow speeds with the ROV as near to bottom as possible as per past mission methods (see Ross and Quattrini 2007). This was modified as needed in areas of rugged topography or in heavy currents. Multiple transects were conducted on every dive and across all habitat types (including coral and non-coral areas). Two parallel red lasers mounted 10 cm apart were used for scale reference at all times, unless footage was being taken for outreach or website purposes. The HD video camera recorded continuously throughout the dive, and digital still images (digital camera, Insite Pacific Scorpio and HD video frame grabs) were taken frequently to augment the video footage. Sample collections were documented with video and digital photography. Specimens were collected during each dive as target fauna were encountered to meet multiple research objectives (trophodynamics, genetics, taxonomy, reproductive biology, and other

5
objectives). Large samples and those that were subsequently maintained alive were placed in the port and starboard insulated, polypropylene bioboxes. Other samples were placed in various other containers on the ROV tray or were suctioned into one of six acrylic sample buckets (Figs. 4, 5). Small samples were placed into PVC quivers that could accommodate up to three samples each, using rubber stoppers as dividers (Fig. 4); this greatly expanded sampling capacity. Additional sampling spaces were available on the bow extendable tray. Sampling of most mobile organisms (e.g., fishes and invertebrates) was limited since they move to quickly for the ROV manipulators. Bottom water samples were collected near coral colonies using two 5 L Niskin bottles, one attached to the top starboard frame and one to the bottom rear of the ROV (Fig. 5). Bottom Trawl Bottom trawling, using the 16’ (3.5 m) otter trawl for 30 min tows, was accomplished at several locations off the Cape Canaveral area (Fig. 3). A 3:1 wire to depth scope was used for these tows. Once the appropriate amount of wire was determined, this gear was used with consistent success. CTD and Water Samples Because of limitations with the ROV’s data logger the UNCW SeaBird CTD (SBE 19+) was attached to the ROV (Fig. 6) and recorded data throughout each ROV dive, providing environmental information in the water column as well as near bottom. Sensors on the instrument measured turbidity (Seapoint), fluorescence (Chelsea Instruments), dissolved oxygen, depth, conductivity, temperature, salinity, and pH at a frequency of once per second. At selected sites during the cruise, the ship’s CTD array with water sampling rosette was used to record water column environmental data (see Fig. 7 for example profiles). The ship’s CTD unit had limited sensor capabilities; therefore, the UNCW SeaBird SBE 911+ was attached to the CTD frame and used for these profiles. Water samples were collected during the upcast by triggering 5L Niskin bottles at selected stations from specific depths in the water column. Water samples collected during CTD casts and during ROV dives were processed according to standard protocols for later analysis of aragonite saturation and nutrients. General Specimen and Data Treatment Samples from all collections were processed at sea according to various scientific objectives. Taxonomy and genetic samples were preserved in 70% and 95% ethanol, respectively, and samples for reproductive analysis were fixed in 10% formalin-seawater solution. After arriving on deck, sub-samples were quickly taken from most specimens for stable isotope analyses (trophodynamic studies); tissue samples for isotope analyses were removed, dried, and saved separately from the rest of the specimens. Samples of Lophelia pertusa that were collected in the insulated bioboxes were sub-sampled for genetics, reproduction, and isotopic analysis, then transferred to the chilled tanks. These samples were ultimately shipped to tank systems at the Oregon Institute of Marine Biology and UNCW for future biological experiments. Selected species were set aside for on-board photography and were photographed on a light table under daylight balanced strobes or daylight balanced fluorescent lights. After being photographed, specimens were preserved for scientific objectives. Ship and ROV Operations In general, the Jason ROV and its equipment performed very well and were reliable. The exception was that the HD video imagery was not of acceptable quality. The lighting was poor and the camera was difficult to focus. For this reason most of our frame grabs from this camera were out of focus. Color balance for this camera was also out of balance for the first dive, but the science

6
team’s videographer corrected this. The digital still camera was out of date and generally performed poorly. Collection capability was sufficient for our needs and the ROV team was flexible in accommodating different configurations. Overall the ROV crew exhibited a great deal of skill and dedication in trying to meet the needs of this mission; however, a greater degree of experience and confidence with Gulf Stream conditions would probably improved operational efficiency. Inclement weather was a significant factor affecting ROV operations, as were the high currents of the Gulf Stream. The ship worked well with the ROV team to maintain stations and facilitate the ROV dives under challenging conditions. Several areas ship operations need improvement, and these were detailed in the post-cruise evaluation. These issues impacted amount of work accomplished. Some of these issues included slow responses to requests by science crew, rigid chain of command, very poor email/internet access, lack of knowledge about some operations, lack of 24 hr ops for survey crew, poor attitudes of some crew, and inadequate CTD instrument. FIELD RESULTS Sample summary Overall, the cruise was a success, and we accomplished most of our objectives. Twenty-nine non-ROV stations were sampled or surveyed during this cruise, and nine ROV dives were successfully accomplished (Table 1, Figs. 1-3). Most of the scheduled ROV dives were accomplished, although many were of shorter duration than planned due to weather or equipment issues. While ROV dives were assigned one station number, all dives accomplished multiple objectives, which in many cases could be considered additional stations. The non-ROV stations included 22 CTD casts and 7 otter trawl tows (Table 1, Figs. 1-3). Examples of bottom habitats and fauna in each study area are provided in Figures 9-11. A variety of samples were collected for many research topics (Table 2). For stable isotope analyses, 98 individual samples were collected from 10 taxa (Table 2). Most of these samples were dried on the ship and will later be processed for analysis of δ13C and δ15N as part of a larger study on the trophodynamics of deep reef ecosystems. A large number (unknown at present) of taxa were photographed at sea and were representative of the samples collected for research objectives. Many of the specimens that were photographed have not been identified, and some are likely to be new species or range extensions. At least 38 taxa were subsampled for genetic studies, producing 245 tissue samples. These represent a valuable addition to our studies of connectivity among deep reef ecosystems. We added samples from several sites for which previous sample sizes were small. C.L. Morrison, A. Quattrini, J. Thoma, K. Coykendall will be analyzing these samples for various taxa over the next few years. Eight coral taxa (67 samples) and two other invertebrate taxa (6 samples) were subsampled for analysis of reproductive condition. Most of these coral samples were L. pertusa, but also included other structure forming species such as Enallopsammia profunda, Madrepora oculata, Keratoisis sp. and Leiopathes sp. These samples were preserved at sea in 10% fully buffered formalin solution and will be transferred to OIMB for future analysis by S. Brooke. Thirteen small colonies of L. pertusa were retained alive from several different sites (SEUS and West Florida slope site) and were held in an insulated tank cooled to 7-8° C using a portable chiller (Fig. 8). These colonies were successfully transferred to the UNCW and OIMB after the cruise where they are being held in laboratory chiller systems for future research. Coral spawning was not observed in the field. Fourteen water samples were taken from either surface, mid-water and or near bottom, with the majority of the samples taken close to coral communities. These samples will be analyzed for aragonite saturation state (Pacific Marine Environmental Laboratory, WA) and nutrient levels

7
(University of Washington) in 2011. When inclement weather prevented other sampling, we mapped selected study sites using the ship’s multibeam sonar system (Kongsburg EM 122). The survey areas were selected to support ROV dives during the cruise, and to expand existing multibeam data for the region. About 69 km2 was mapped at the Pourtales terrace site, 412 km2 off Cape Canaveral, and 834 km2 off the Jacksonville area for an overall total of 1,315 km2 mapped. All general station data sheets were electronically entered into the Access database, checked, and archived on board ship and at the UNCW lab and are being edited as needed. All fish samples have been sorted and transferred to alcohol storage. Most macro-invertebrate samples were transported to the Smithsonian Institution for indentification and archiving by M. Nizinski. Observations related to the DWH oil spill We were particularly vigilant for signs of oil spill related damage. We were pleased to see the surface, water column, and benthic communities appeared to be healthy. At the general overview, macroscopic level, these communities and their habitats appeared to be in similar conditions as observed in pre-oil spill cruises. There were no overt signs of hydrocarbon of any kind observed at any stations during this cruise. Education, Outreach and Media The North Carolina Museum of Natural Sciences (NCMNS) provided outreach and education before, during and after the 14 day Extreme Corals Expedition. Museum educator Mike Dunn (Senior Manager of Outreach) and living collections specialist Peyton Hale were joined by Cleveland County 8th grade science teacher Beverly Owens and Emmy-award winning photographer Art Howard to share the mission with students, teachers and the general public. They did so through a variety of venues. During the mission the NCMNS set up a website which included a daily blog, biographies of the research team, and links to partners and related sites. It also included links to the websites for previous missions. The blog provided information about the daily activities on the ship and interviews with the science team and ship and ROV crew. Over the course of the cruise there were 41 posts and 62 comments. The blog page has received 4,160 views to date. See http://deepcoral. wordpress.com. In addition to the Museum’s site, the Cleveland County School System posted daily pictures from Ms. Owens, keeping the entire county linked to the mission. The Cooperative Institute for Ocean Extension, Research and Technology also hosted a site which covered press releases, an expedition overview, and an explanation of NOAA’s DSCRTP program objectives. This website was linked directly to the Museum site so that visitors to either location could read the daily updates and see the images. See also http://cioert.org/xcorals. Twenty-five still images were provided for the press kit, and a DVD with 5 minutes of edited underwater footage was prepared for press distribution. On 26 Nov 2010 NOAA and partners distributed a press release to the media describing this cruise (see Appendix I). Articles appeared in several publications, including: The Daytona Beach news journal (http://www.news-journalonline. com/ news/local/east-volusia/2010/11/27/aquatic-showcase-nearby.html), TCPalm (http://www. tcpalm.com/news/2010/nov/24/noaa-news-expedition-explores-previously-uncharted/), The Shelby Star, Cleveland County Schools site (http://www.clevelandcountyschools.org/index.php/news/41-district-news/396-follow-cms-science-teacher-on-15-day-deep-sea-coral-expedition). Also, the local Cleveland County cable TV station interviewed Beverly Owens about the cruise.

8
FUTURE WORK Identification of specimens and analysis of data from this and the 2009 cruise are high priorities. However, these tasks are time consuming and require additional funding to move forward. The first task for all samples is to identify the animals collected. The first priority is to identify samples used for isotope analysis, followed by photo specimens, and then the remainder of the collections. In general, ROV samples have the highest priority for sample treatment. Analysis of samples for stable isotopes of carbon and nitrogen will proceed along with the identification process, and these samples will be sent to a contract lab for standard treatment. Analysis of fish diets will proceed after identifications and isotope analyses are complete, depending on funding. Other data treatments will proceed in various stages in the labs of the scientists who participated in these cruises. We expect data from the cruises to result in several peer reviewed publications in the future. Future education/outreach activities include expected articles in the Wake Weekly and the Museum’s Naturalist magazine. Beverly Owens has been contacted by a reporter from the Charlotte Observer for an interview in February. Art Howard is providing an additional 50-70 images to NOAA for use on their website and elsewhere. Peyton Hale’s personal image gallery is linked to the CIOERT site and has had 875 views. Peyton is also providing a DVD of images to the participating scientists and will be giving a presentation to Carolinas Nature Photography Association Triangle chapter this summer detailing the trip and focusing on the photography that was done for the expedition. Liz Baird plans a presentation on the cruise and deep-sea corals at NC Science Teachers Association later this year. The NCMNS is continuing to incorporate deep-sea coral research into its displays and is designing a large gallery in the new building related to this, all of which relies heavily on these cruises. ACKNOWLEDGMENTS The majority of the support for this cruise was provided by the NOAA Deep Sea Coral Science and Technology Program. Various levels of support were also provided by U.S. Geological Survey, Marine Conservation Biology Institute, NC Museum of Natural Sciences (NCMNS), and ArtWork, Inc. We thank Andy David, Andy Shepard, and John Tomczuk for help with a variety of issues before, during and after this cruise. We thank Liz Baird for assisting with organizing the education and outreach efforts. Dave Naar assisted with multibeam sonar data. Aaron Alexander (UNCW) and Karen Swain (NCMNS) managed the onshore web sites. We thank all cruise personnel (listed above) for their hard work and dedication while at sea and in dealing with logistics and data before and after the cruise. We thank the ship and shore based personnel who operated the Ronald H. Brown, especially the Operations Officer James Brinkley and the Bosun Bruce Cowden, for their assistance during the cruise. Finally, we thank the Jason II ROV personnel for their service and dedication during the mission.

Table 1. Stations sampled in the eastern Gulf of Mexico and western Atlantic off Florida (9-22 November 2010) using NOAA ship Ronald H. Brown (RB). D=Day (0800 to 2000 hr EST), N=Night (2000 to 0800 hr EST), S=surface. CTD=Seabird SBE 19+, OT=3.5 m otter trawl, ROV=Jason II. ROV total time and depth range data are only for the period when the ROV was on the bottom.
Station # Gear Date Time
Total Time (min)
Start Latitude
(°N)
Start Longitude
(°W)
End Latitude
(°N)
End Longitude
(°W)
Depth Range
(m) ROV-2010-RB-542 ROV 10-Nov-10 N 323 26° 12.228 84° 45.295 26° 12.312 84° 43.712 495-734 ROV-2010-RB-543 ROV 12-Nov-10 D 103 24° 45.028 80° 27.196 24° 44.948 80° 27.298 169-212 ROV-2010-RB-544 ROV 13-Nov-10 D 311 24° 25.989 80° 45.281 24° 25.697 80° 45.044 162-367 ROV-2010-RB-545 ROV 15-Nov-10 D 598 30° 41.850 79° 40.677 30° 43.826 79° 39.679 471-633 ROV-2010-RB-546 ROV 17-Nov-10 D 610 30° 07.009 79° 56.260 30° 05.029 79° 57.404 455-518 ROV-2010-RB-547 ROV 18-Nov-10 D 477 30° 02.173 80° 11.780 30° 01.508 80° 11.788 210-249 ROV-2010-RB-548 ROV 20-Nov-10 D 155 27° 53.245 79° 36.933 27° 53.935 79° 36.982 634-731 ROV-2010-RB-549 ROV 21-Nov-10 D 410 27° 53.735 79° 37.050 27° 54.097 79° 36.899 633-687 ROV-2010-RB-550 ROV 22-Nov-10 D 613 28° 19.177 79° 44.988 28° 19.232 79° 45.562 399-480
RB-2010-001 CTD 16-Nov-10 N 15 30° 08.031 79° 50.056 30° 08.338 79° 49.976 S-608 RB-2010-002 CTD 16-Nov-10 N 9 30° 02.023 80° 11.467 30° 02.298 80° 11.243 S-201 RB-2010-003 CTD 16-Nov-10 N 11 30° 01.766 80° 08.615 30° 02.147 80° 08.310 S-300 RB-2010-004 CTD 16-Nov-10 N 9 30° 02.197 80° 04.532 30° 02.567 80° 04.319 S-374 RB-2010-005 CTD 17-Nov-10 N 10 30° 02.731 80° 00.050 30° 02.993 79° 59.890 S-465 RB-2010-006 CTD 17-Nov-10 N 11 30° 01.820 79° 56.934 30° 02.272 79° 56.650 S-546 RB-2010-007 CTD 17-Nov-10 N 11 30° 01.883 79° 53.165 30° 02.224 79° 52.938 S-556 RB-2010-008 CTD 17-Nov-10 N 14 30° 01.895 79° 49.534 30° 02.316 79° 49.217 S-652 RB-2010-009 CTD 17-Nov-10 N 15 30° 03.221 79° 46.645 30° 03.445 79° 46.560 S-765 RB-2010-010 CTD 17-Nov-10 N 12 30° 03.197 79° 50.964 30° 03.502 79° 50.892 S-610 RB-2010-011 CTD 17-Nov-10 N 11 30° 03.124 79° 55.368 30° 03.388 79° 55.300 S-565 RB-2010-012 CTD 18-Nov-10 N 11 30° 03.130 79° 59.697 30° 03.616 79° 59.622 S-453 RB-2010-013 CTD 18-Nov-10 N 9 30° 03.173 80° 04.012 30° 03.635 80° 03.996 S-370 RB-2010-014 CTD 18-Nov-10 N 7 30° 03.074 80° 08.555 30° 03.438 80° 08.550 S-299 RB-2010-015 CTD 18-Nov-10 N 5 30° 03.178 80° 12.030 30° 03.356 80° 12.037 S-209 RB-2010-016 CTD 18-Nov-10 N 3 30° 02.981 80° 15.755 30° 03.054 80° 15.754 S-608 RB-2010-017 CTD 18-Nov-10 N 3 30° 03.050 80° 19.954 30° 03.072 80° 19.958 S-31 RB-2010-018 OT 19-Nov-10 N 30 28° 25.918 79° 45.021 28° 24.923 79° 45.022 469-474 RB-2010-019 OT 20-Nov-10 N 30 28° 20.662 79° 44.885 28° 19.739 79° 44.459 455-462 RB-2010-020 OT 20-Nov-10 N 15 28° 14.824 79° 43.950 28° 14.367 79° 43.962 456-462

10
Station # Gear Date Time
Total Time (min)
Start Latitude
(°N)
Start Longitude
(°W)
End Latitude
(°N)
End Longitude
(°W)
Depth Range
(m) RB-2010-021 OT 20-Nov-10 N 30 28° 12.251 79° 44.474 28° 11.230 79° 44.473 437-439 RB-2010-022 OT 21-Nov-10 N 30 28° 07.395 79° 44.472 28° 06.190 79° 44.473 428-430 RB-2010-023 OT 21-Nov-10 N 30 28° 01.827 79° 44.472 28° 00.738 79° 44.473 421-422 RB-2010-024 OT 21-Nov-10 N 30 27° 56.786 79° 44.474 27° 55.785 79° 44.475 416-417 RB-2010-025 CTD 22-Nov-10 N 21 28° 20.266 79° 37.003 28° 21.233 79° 37.324 S-750 RB-2010-026 CTD 22-Nov-10 N 12 28° 20.065 79° 41.072 28° 20.730 79° 41.252 S-541 RB-2010-027 CTD 22-Nov-10 N 9 28° 19.856 79° 45.198 28° 20.316 79° 45.358 S-431 RB-2010-028 CTD 22-Nov-10 N 11 28° 20.243 79° 49.511 28° 20.875 79° 49.698 S-322 RB-2010-029 CTD 22-Nov-10 N 5 28° 20.264 79° 53.908 28° 20.472 79° 53.928 S-215

11
Table 2. Summary of the types of subsamples collected for various study topics on the eastern and western Florida slopes during 9-22 November 2010 Ronald H. Brown cruise. The number of taxa is based on tentative identifications conducted in the field and is subject to change as data are analyzed. A more detailed and complete break down of this summary table has been provided to NOAA.
Sample Type Custodian# No. Taxa No. Samples Isotope (Trophic study) SWR 10 98 Genetic JNT/AMQ/ABT 38 245 Photo AH/SWR n/a n/a Water Samples SWR/SDB 14 ROV macrofauna collection* MSN 62 248 Paleoecology - Corals EBR 5 14 Reproduction & Biology – Corals SDB 8 67 Reproduction - Other Invertebrates^ SDB 2 6 Taxonomy – Crinoids & Forams CGM 2 7 Biomedical & Taxonomy - Sponges JKR 14 25
*Collections made with suction, or in quivers, milkcrate or bioboxes ^Other invertebrates=Echinus spp. and glass sponge #EBR=Brendan Roark, SDB=Sandra Brooke, JKR=John Reed, JNT=Jana Thoma, DKC=Katherine Coykendall, MSN=Martha Nizinski, SWR=Steve Ross, CGM=Chuck Messing, ABT=Amy Baco-Taylor, AMQ=Andrea Quattrini, AH=Art Howard
12
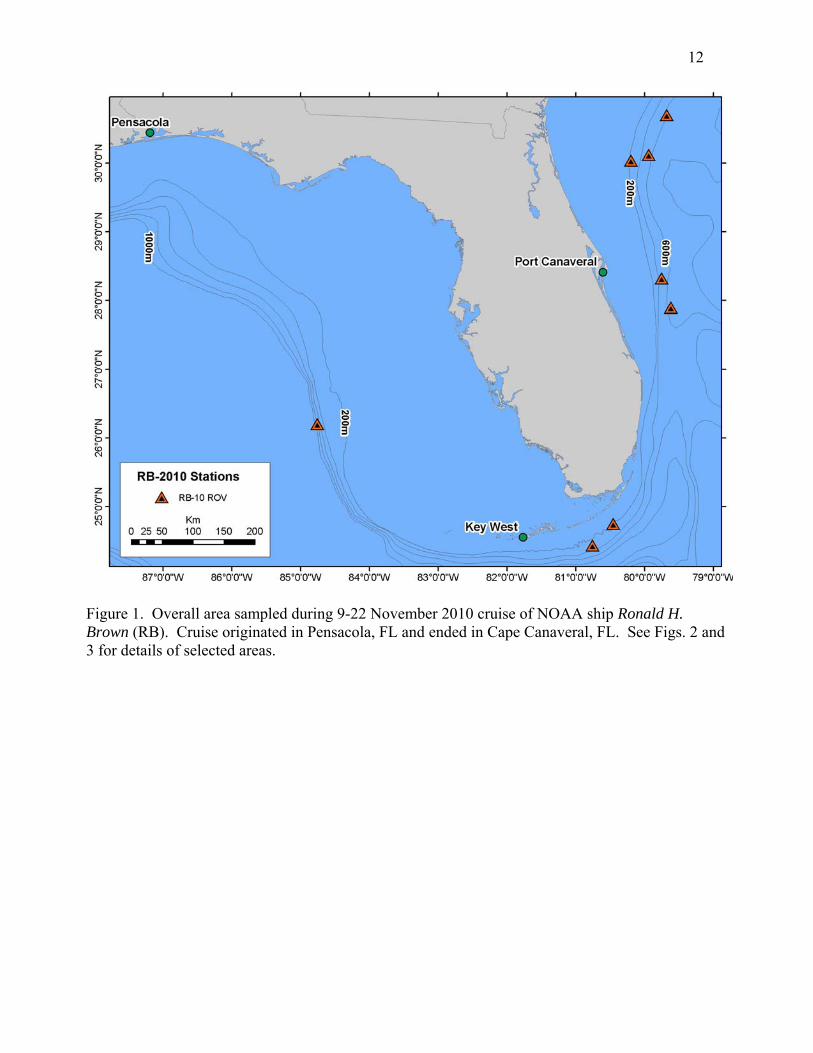
Figure 1. Overall area sampled during 9-22 November 2010 cruise of NOAA ship Ronald H. Brown (RB). Cruise originated in Pensacola, FL and ended in Cape Canaveral, FL. See Figs. 2 and 3 for details of selected areas.

13
Figure 2. R/V Ronald H. Brown (RB) and Jason II ROV stations in the Jacksonville lithoherm area, sampled 15-18 November 2010. Black circles = CTD stations (Seabird SBE 911+); red triangles=ROV dives (only bottom start locations plotted). Underlying color-shaded multibeam data courtesy of D. Naar. Two stations labeled are CTD casts that generated data in Fig. 7.

14
Figure 3. R/V Ronald H. Brown (RB) and Jason II ROV stations sampled off the Cape Canaveral area, 19-22 November 2010. Black circles = CTD stations (Seabird SBE 911+); red triangles=ROV dives (only bottom start locations plotted); blue arrows are bottom otter trawl stations. Underlying color-shaded multibeam data are from previous NOAA ship Nancy Foster cruises. The station labeled is CTD cast that generated data in Fig. 7.

15
Figure 4. Front views of Jason II ROV illustrating extended front work tray with 12 PVC quivers used for most dives. After this rack was lost, it was replaced by the quiver arrangement in right panel. Round biobox with T-handle can be seen in both photos as can other milk crates and a rectangular sample box (right). HD video science camera with adjacent mounted still camera is visible to port side of vehicle, uncovered (left) and covered (right).
Figure 5. The two gray Niskin bottles used for water samples are shown open, one mounted to the middle frame on the starboard side (left) and the other mounted to the port side of the bottom skid. Starboard biobox can be seen underneath front end of Niskin bottle in left photo. Carousel containing the rotating suction sampler buckets is shown on right side of right photo.
16
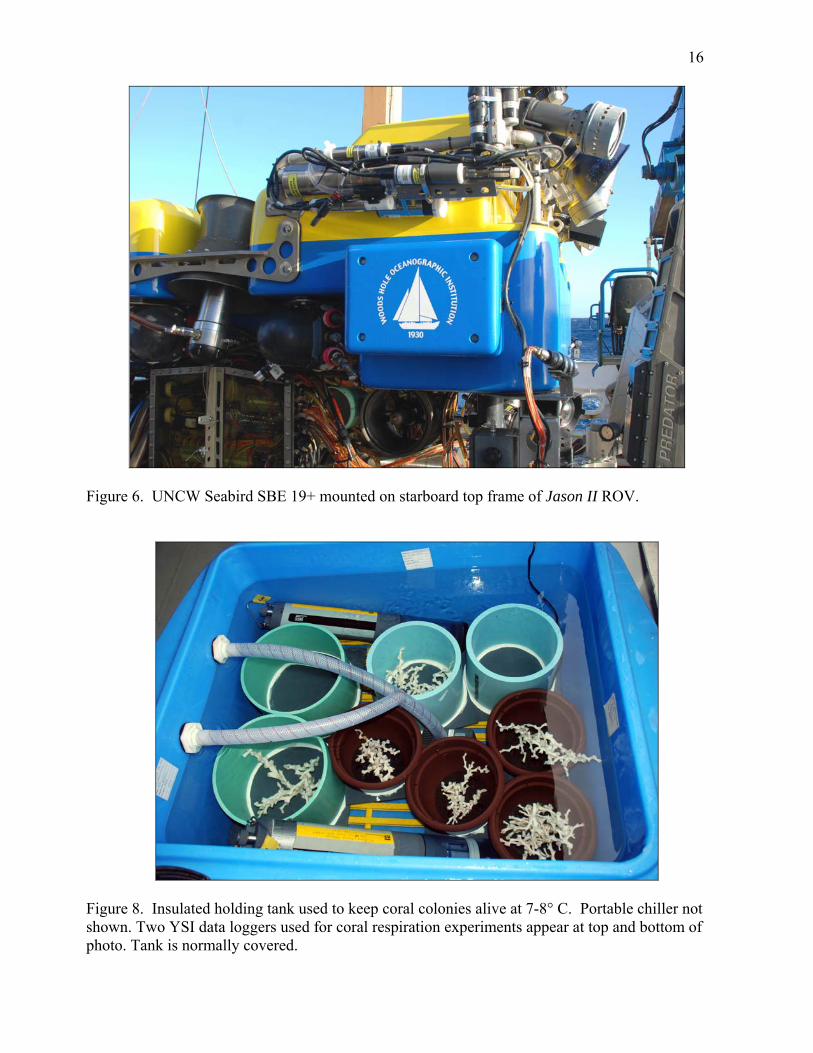
Figure 6. UNCW Seabird SBE 19+ mounted on starboard top frame of Jason II ROV.
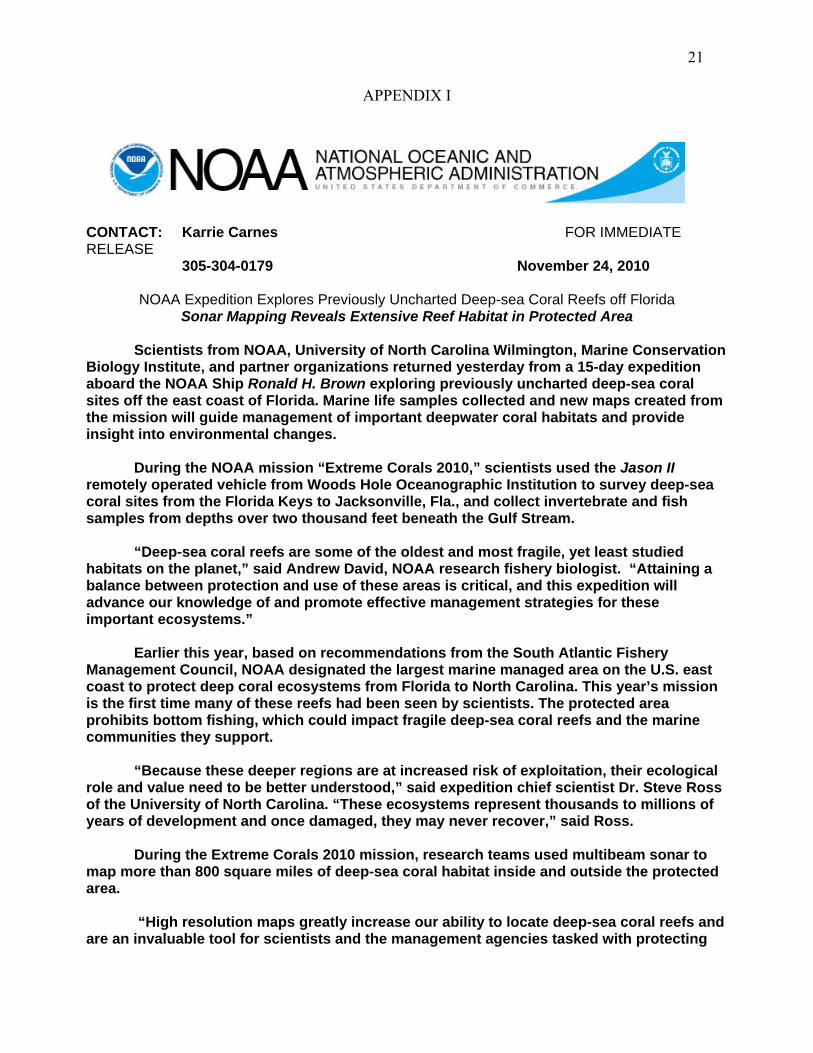
Figure 8. Insulated holding tank used to keep coral colonies alive at 7-8° C. Portable chiller not shown. Two YSI data loggers used for coral respiration experiments appear at top and bottom of photo. Tank is normally covered.

17
0
100
200
300
400
500
600
5 15 25 350
100
200
300
400
500
600
34 35 36 370
100
200
300
400
500
600
3.0 5.0 7.0
0
100
200
300
400
500
600
5 15 25 350
100
200
300
400
500
600
34 35 36 37
0
100
200
300
400
500
600
3.0 5.0 7.0
0
50
100
150
200
250
300
350
400
5 15 25 350
50
100
150
200
250
300
350
400
34 35 36 370
50
100
150
200
250
300
350
400
3.0 5.0 7.0
Temperature (°C) Salinity Dissolved oxygen
RB-2010-007
RB-2010-026
RB-2010-004
Dep
th (
m)
Figure 7. CTD (SeaBird SBE19 +) casts at three stations (RB-2010-007, RB-2010-026, RB-2010-004) off the Florida east coast, illustrating water temperature, salinity and dissolved oxygen profiles. See Figs. 2 and 3 for locations of these stations.

18
Figure 9. Selected photographs of habitat and fauna from ROV dives on deep-sea coral study sites on the Pourtales Terrace, 12-13 November 2010.

19
Figure 10. Selected photographs of habitat and fauna from ROV dives on deep-sea coral study sites off the Cape Canaveral area, 20-22 November 2010.

20
Figure 11. Selected photographs of habitat and fauna from ROV dives on deep-sea coral study sites off Jacksonville, FL, 15-18 November 2010.
21
APPENDIX I
CONTACT: Karrie Carnes FOR IMMEDIATE RELEASE
305-304-0179 November 24, 2010
NOAA Expedition Explores Previously Uncharted Deep-sea Coral Reefs off Florida Sonar Mapping Reveals Extensive Reef Habitat in Protected Area
Scientists from NOAA, University of North Carolina Wilmington, Marine Conservation
Biology Institute, and partner organizations returned yesterday from a 15-day expedition aboard the NOAA Ship Ronald H. Brown exploring previously uncharted deep-sea coral sites off the east coast of Florida. Marine life samples collected and new maps created from the mission will guide management of important deepwater coral habitats and provide insight into environmental changes.
During the NOAA mission “Extreme Corals 2010,” scientists used the Jason II
remotely operated vehicle from Woods Hole Oceanographic Institution to survey deep-sea coral sites from the Florida Keys to Jacksonville, Fla., and collect invertebrate and fish samples from depths over two thousand feet beneath the Gulf Stream.
“Deep-sea coral reefs are some of the oldest and most fragile, yet least studied habitats on the planet,” said Andrew David, NOAA research fishery biologist. “Attaining a balance between protection and use of these areas is critical, and this expedition will advance our knowledge of and promote effective management strategies for these important ecosystems.”
Earlier this year, based on recommendations from the South Atlantic Fishery Management Council, NOAA designated the largest marine managed area on the U.S. east coast to protect deep coral ecosystems from Florida to North Carolina. This year’s mission is the first time many of these reefs had been seen by scientists. The protected area prohibits bottom fishing, which could impact fragile deep-sea coral reefs and the marine communities they support.
“Because these deeper regions are at increased risk of exploitation, their ecological role and value need to be better understood,” said expedition chief scientist Dr. Steve Ross of the University of North Carolina. “These ecosystems represent thousands to millions of years of development and once damaged, they may never recover,” said Ross.
During the Extreme Corals 2010 mission, research teams used multibeam sonar to
map more than 800 square miles of deep-sea coral habitat inside and outside the protected area.
“High resolution maps greatly increase our ability to locate deep-sea coral reefs and
are an invaluable tool for scientists and the management agencies tasked with protecting

22
these ecosystems,” said expedition co-chief scientist Dr. Sandra Brooke of the Marine Conservation Biology Institute.
Deep-sea coral reefs can reach several hundred feet above the seafloor, and are constructed by delicate branching deep-sea corals that provide habitat for an abundant and diverse community of marine life. Some deep-sea corals grow only millimeters per year, and deep-sea coral reefs can take thousands of years to form. The skeletons of deep-sea corals can be analyzed like tree rings on land to look at past environmental conditions, providing a record of thousands of years of ecological changes.
NOAA’s Coral Reef Conservation Program, through its Deep Sea Coral Research and Technology Program, sponsored the expedition, now in year two of a three-year project in the southeast U.S.
Expedition partners include: NOAA, University of North Carolina Wilmington, Marine Conservation Biology Institute, North Carolina Museum of Natural Sciences, Harbor Branch Oceanographic Institution/Florida Atlantic University, University of Louisiana-Lafayette, Texas A&M University, and U.S. Geological Survey.
NOAA’s mission is to understand and predict changes in the Earth's environment,
from the depths of the ocean to the edge of space, and to conserve and manage our coastal and marine resources.
###
On the Web NOAA Deep-sea Corals: http://coralreef.noaa.gov/deepseacorals/ NOAA Ship Ronald H. Brown: http://www.moc.noaa.gov/rb/ Extreme Corals 2010 Mission Blog: http://cioert.org/xcorals/