extreme contagion in equity markets · 2004-08-05 · simultaneously across different financial...
TRANSCRIPT
386
IMF Staff PapersVol. 51, No. 2© 2004 International Monetary Fund
Extreme Contagion in Equity Markets
JORGE A. CHAN-LAU, DONALD J. MATHIESON, and JAMES Y. YAO*
Contagion can be defined as the probability of observing large return realizationssimultaneously across different financial markets (co-exceedances) rather than asincreases in correlations. We introduce global extreme contagion measures con-structed from bivariate extremal dependence measures. The measures are usedto quantify both negative and positive equity returns contagion at the inter- andintraregional level for a number of mature and emerging equity markets during thepast decade. Our results suggest that (a) contagion patterns differ significantlywithin regions and across regions, with Latin America showing a secular increasein contagion not matched by other regions or countries; (b) contagion is higher fornegative returns than for positive returns; (c) only the 1998 Russian and Braziliancrises led to a global increase in contagion; and (d) extremal dependence measuresof contagion and simple correlation measures are not highly correlated, with theexception of Latin America, suggesting that the use of correlations as a proxy forcontagion may be misleading. [JEL F30, G10, G15, C10]
It has been widely documented that the comovement of prices in financial mar-kets increases significantly during periods of stress, such as the Exchange Rate
Mechanism crisis in 1992–93, the Mexican crisis in 1994, and the more recent
*Jorge Chan-Lau is an Economist and Donald Mathieson is a Division Chief in the IMF's InternationalCapital Markets Department. James Yao is an Economist in the African Department of the IMF. This paperwon the Best Paper in International Finance Award at the 2002 Southern Finance Association Meetings inKey West, Florida. The authors thank Janet Heffernan for making her programs available and clarifyingthe methodology used in this paper and Leroy Brooks and an anonymous referee for thorough commentsand suggestions. We also acknowledge useful comments from Charalambos Christophides, GiovanniDell'Arriccia, Gaston Gelos, Brenda Gonzales-Hermosillo, Paolo Mauro, Amine Mati, Shang-Jin Wei, andseminar participants at IMF and Southern Finance Association meetings.

EXTREME CONTAGION IN EQUITY MARKETS
387
financial crises in East Asia in 1997 and in Russia and Brazil in 1998.1 Both pol-icymakers and academics have interpreted upward changes in price comovementsor correlations as evidence of a breakdown of current transmission mechanismsacross financial markets, or contagion. Sudden correlation changes, however, arenot necessary or sufficient to identify contagion or crisis periods, as they do notnecessarily imply a structural change in the data generating process. For example,Boyer, Gibson, and Loretan (1997) and Forbes and Rigobon (2002) show that evenif data are generated from a bivariate normal distribution with a constant correla-tion coefficient, the conditional correlation of the top 50 percent of the largestreturns is different from the conditional correlation of the bottom 50 percent of thesmallest returns. Furthermore, correlation analysis is unable to uncover nonlinearrelationships.
Extreme Value Theory and Contagion
An alternative statistical approach to analyzing contagion in financial markets is extreme value theory (EVT). Multivariate EVT techniques quantify the jointbehavior of extremal realizations (or co-exceedances) of financial prices or returnsacross different markets. Extremal realizations or exceedances are defined as thoseexceeding a large threshold value. The EVT approach to contagion, which hasgained acceptance in recent years, captures well the belief of most observers in theprivate and policymaking communities that large shocks are transmitted acrossfinancial markets differently than small shocks.2
In EVT, there is contagion between two series, X and Y, with distribution func-tions FX and FY, respectively, if
(1)
is statistically significant and different from zero, where F−1 is the inverse of thedistribution function and u is the threshold value. Equation (1) states that as thethreshold value approaches 1 from below, X exceeds the threshold value with pos-itive probability, provided that Y has already exceeded the threshold. Anotherinterpretation of equation (1) is that X and Y exhibit contagion if the probability ofobserving a large realization of X is higher after observing a large realization of Y;that is, the difference between the conditional and unconditional probability Pr(X> F−1
X (u)) is positive. The latter interpretation follows the definition of contagiongiven by Costinot, Roncalli, and Teiletche (2000). These authors suggest that thereis contagion between X and Y if
(2)Pr Pr .X F u Y F u X F uX Y X> ( ) > ( )( ) ≥ > ( )( )− − −11
12
11
lim Pru
X YX F u Y F u→
− −> ( ) > ( )( )1
1 1
1Increased price synchronicity is also experienced during bull markets, though to a lesser extent. SeeChan-Lau and Ivaschenko (2001) for a recent analysis of the 1990s’ tech bubble.
2Bae, Karolyi, and Stulz (2003); Costinot, Roncalli, and Teiletche (2000); Hartmann, Straetmans, and deVries (2001); Longin and Solnik (2001); Poon, Rockinger, and Tawn (2001); Quintos (2001); and Starica(1999), among others, are examples of recent empirical work that emphasizes this definition of contagion.

Jorge A. Chan-Lau, Donald J. Mathieson, and James Y. Yao
388
Equations (1) and (2) are equivalent in the asymptotic case of u1 = u2 = u → 1, since
Equation (1) suggests that evaluating contagion between two series is reducedto estimating the conditional probability of large realizations of one series condi-tional on large realizations of the other series. In the limit, as explained in moredetail in Section II, the conditional probability can be approximated by the extremaldependence measure χ, defined as:
where the copula C represents the joint distribution of both series. It follows nat-urally that an increase (decline) in the value of χ implies an increase (decline) incontagion.
Coles, Heffernan, and Tawn (1999) note that the use of the χ measure is appro-priate only when the series analyzed are asymptotically dependent; that is, in thelimit, when the threshold u → 1, extreme realizations of both series occur simulta-neously. Estimates of χ overestimate the degree of dependence between two seriesif they are asymptotically independent; that is, in the limit, extreme realizations sel-dom occur simultaneously. For the case of asymptotically independent variables,Coles, Heffernan, and Tawn suggest using the extremal dependence measure χ–:
(3)
where C–
(u, u) = Pr(X > F −1X (u), Y > F −1
Y (u)) is the joint survival probability. Themeasure χ– can be loosely interpreted as the correlation coefficient between bothrandom variables.
Measuring contagion requires determining the asymptotic dependence class ofthe series analyzed and then using the appropriate extremal dependence measureχ or χ–. It follows naturally to define extreme contagion as first proposed by Poon,Rockinger, and Tawn (2001): Given two random variables X and Y, with distribu-tion functions FX and FY, there is extreme contagion if (a) χ is statistically signif-icant and different from zero, and X and Y are asymptotically dependent; or (b) χ–is statistically significant and different from zero, and X and Y are asymptoticallyindependent. Therefore, for two random variables X and Y, it is possible to definethe bivariate extreme contagion measure as
Changes in contagion can be linked to changes in the asymptotic dependenceclass and changes in the extreme contagion measure. Contagion increases if two
Extreme Contagion Measuresif and are asymptotically independent
if and are asymptotically dependent=
χ
χ
X Y
X Y.
χ = −( )( )
−→
limlog
log ,,
u
u
C u u1
2 11
χ = −( )
→2
1lim
log ,
log,
u
C u u
u
lim Pr Pr
lim Pr .
uX Y X
uX Y
X F u Y F u X F u
X F u Y F u
→
− − −
→
− −
> ( ) > ( )( ) − > ( )( )[ ]= > ( ) > ( )( )
1
1 1 1
1
1 1
EXTREME CONTAGION IN EQUITY MARKETS
389
series, previously asymptotically independent, become asymptotically dependent.Absent changes in the dependent class, contagion increases if the appropriateextreme contagion measure (χ for asymptotically dependent series, or χ– other-wise) increases.
The extreme contagion measures described above are useful to study extremecontagion for a reduced number of markets. As the number of markets analyzedincreases, though, uncovering contagion patterns may become untractable on apairwise basis. For example, there are 136 different pairwise combinations for the17 equity markets analyzed here. Unfortunately, extending the bivariate analysisto the multivariate case is rather difficult. We propose, hence, two simple aggre-gate global extreme contagion measures to evaluate contagion at the intraregionaland interregional levels. The first global extreme contagion measure is the relativeshare of asymptotic dependent bivariate combinations. This measure captureschanges in contagion arising from changes in the number of markets exhibitingasymptotical dependence. The second global extreme contagion measure is therelative share of pairwise market combinations that are statistically significant.This measure complements the first one, as it indicates how many markets exhibitpairwise contagion regardless of their asymptotic dependence properties. For sim-plicity, when the bivariate and global extreme contagion measures are applied tothe analysis of extreme negative (positive) returns, they will be referred to as bear(bull) market contagion.
One shortcoming of these two contagion measures is that they may fail to cap-ture changes in contagion when pairwise country contagion is changing if the ratioof asymptotic dependent cases to total cases or the ratio of statistically significantextreme contagion cases remains constant. While it is tempting to use the arith-metic mean of statistically significant cases, the mean will include cases with dif-ferent asymptotic dependence properties. Hence, we refrain from introducing thisthird global extreme contagion measure into our analysis.
Main Findings
Bear and bull market contagion is analyzed using the global extreme contagion mea-sures discussed above during the period December 31, 1987, to October 25, 2001.The main findings are the following:
1. Bear market contagion during the second half of the past decade is strongerthan bull market contagion within market classes, across markets, and withinregions. This finding, which is consistent with those of earlier empirical studies,highlights the asymmetric nature of the financial transmission mechanism acrossstock markets.
2. The successive crises experienced during the second half of 1998—the debacleof Long Term Capital Management (LTCM), the Russian debt crisis, and theBrazilian currency crisis—constituted major shocks with a lasting impact on theglobal financial system, as they prompted sustained increases in bear market con-tagion. In contrast, the 1994 Mexican crisis appeared not to have a major impacton contagion, while the 1997 East Asian crisis had only a regional impact.

Jorge A. Chan-Lau, Donald J. Mathieson, and James Y. Yao
390
3. Under the assumption that increased financial integration increases a stockmarket’s vulnerability to contagion, Latin American stock markets are morevulnerable to contagion from mature stock markets than are East Asian mar-kets. At the regional level, Latin American stock markets have become moreintegrated during the past decade, as measured by the upward trend in bothbear and bull market contagion. In contrast, the financial integration of EastAsian stock markets has remained roughly the same.
4. Emerging stock markets are mostly affected by contagion with the UnitedStates and the United Kingdom. In particular, contagion with the UnitedStates is particularly strong in the Latin American region. Contagion betweenJapan and emerging stock markets is mostly negligible.
5. Latin America is the only region where the number of asymptotically depen-dent country-pairs has increased during periods of bear market contagion. Thisevidence suggests a stronger shift in the downside transmission mechanism inthe region, as stronger contagion is reflected not only in higher values of theextremal dependence measures but also by changes in the asymptotic tail prop-erties. There is nonetheless a decline in bear market contagion betweenArgentina and the rest of Latin America toward the end of the sample period.
6. Contagion measures and five-year rolling window equity market returns corre-lation are not highly correlated, with Latin American stock markets being theonly exception. Hence, reliance on simple correlations as a measure of conta-gion could be misleading. The findings above point toward an overall averageincrease in contagion worldwide between 1987 and 2001, especially acrossmature markets, between mature and Latin American stock markets, and withinLatin America. Furthermore, the results are similar regardless of whether stockreturns are denominated in local currency or U.S. dollars and whether rawreturns or filtered returns are used. The rest of this paper describes the resultscorresponding to U.S. dollar-denominated raw returns, but the complete set ofresults is available from the authors upon request.
Though this paper does not explore possible explanations for these results indepth, a number of potential hypotheses could explain the results. One hypothesisis that increased globalization has strengthened financial and trade linkages con-siderably. Therefore, changes to economic fundamental factors are transmittedmore rapidly than in the past, leading to increased price comovements and conta-gion. In particular, increased use of complex financial instruments such assovereign default swaps and arbitrage strategies by hedge funds may haveincreased the exposure and vulnerability of financial institutions in mature mar-kets to emerging markets. One notable example was the systemic risk posed byLTCM, whose demise was linked to adverse price movements in emerging mar-kets. Another possible hypothesis is that in the absence of changes in fundamen-tal economic factors, herding behavior among investors may lead to bouts ofirrational exuberance and unjustified panics, increasing the synchronization offinancial prices. Anecdotal evidence may support the herd-behavior explanation,as the importance of dedicated investors relative to crossover investors in emerg-ing markets has been declining in the last years of the study period. Therefore, the
EXTREME CONTAGION IN EQUITY MARKETS
391
proportion of informed investors in emerging markets may have been shrinkingsteadily, increasing vulnerability to shifts in market sentiment.
I. Related Literature
The reliance on extreme value theory rather than correlation analysis is motivated bythe limitations of the latter approach.3 In fact, simple correlation analysis can bedeceptive when studying financial market dependence, as shown by Boyer, Gibson,and Loretan (1997) and Embrechts, McNeil, and Straumann (1999).4 Boyer, Gibson,and Loretan showed analytically and numerically that data with stationary distribu-tions could generate spurious correlation breakdowns. Their results invalidate thecommon practice of splitting a sample according to the realized values of the data toidentify different correlation regimes. Embrechts, McNeil, and Straumann showedthat even in the static case, when the multivariate distribution characterizing financialtime series does not change in time, the use of correlations as dependence measuresis justified only for multivariate normal distributions. Otherwise, correlations fail toreveal the multivariate dependence structure: zero correlation does not indicate inde-pendence, and perfectly dependent variables do not exhibit absolute unity correlation.Moreover, correlations are not invariant under monotonic data transformations.
Extreme value theory has been increasingly used to study the tail behavior ofunivariate financial time series.5 However, the application of multivariate extremevalue theory to study the joint probability or dependence of extreme realizations(extremal dependence) in financial markets has been more limited. Starica (1999)proposed a spectral measure method to estimate the probabilities of joint extremereturns in series generated by models with constant conditional correlation models,a family that encompasses GARCH models. Applying this method to high-frequencydata on European Union currencies uncovered a high level of dependence amongextreme returns. Longin and Solnik (2001), using monthly data for the periodJanuary 1959 to December 1996, found that the pairwise correlation of extremereturns between the United States and France, Germany, Japan, and the UnitedKingdom (Group of Five, or G-5) increases in bear markets but not in bull markets.
Hartmann, Straetmans, and de Vries (2001) studied asset return linkages dur-ing periods of stress across stock markets, bond markets, and stock-bond contagionin the G-5 countries. These authors suggested that contagion was better understoodfrom the perspective of the probability of joint crashes. They found that marketcrashes were rare occurrences, but once one market crashed, the conditional prob-ability of a crash in a different market was about one in five. Similarly, Bae,Karolyi, and Stulz (2003) suggested that contagion is better measured by the jointprobability of co-exceedances in more than one market. These authors used a multi-nomial logistic regression, an approach commonly used in epidemiology studies, toestimate contagion across countries within a region and across regions rather thanextreme value theory. They found that contagion could be explained by interest
3Hilliard (1979), Eun and Shim (1989), Roll (1988, 1989), Bertero and Mayer (1990), and Baig andGoldfjan (1999) among others, are examples of the correlation analysis approach.
4See also Forbes and Rigobon (2002).5See Jansen and de Vries (1991), Longin (1996), Jondeau and Rockinger (1999), Phoa (1999), and
Tsay (1999), among many others.

Jorge A. Chan-Lau, Donald J. Mathieson, and James Y. Yao
392
rates, changes in exchange rates, and conditional stock return volatility. Quintos(2001) constructed a measure of extremal correlation that does not depend on thespecification of a dependence (copula) function and used it to analyze contagion,defined as significant extremal correlation changes in exchange rates, betweenThailand and a number of Asian countries.
Costinot, Roncalli, and Teiletche (2000) suggested that dependence amongfinancial markets was better modeled using copulas rather than correlation analy-sis, even if the latter is corrected using techniques such as those proposed by Forbesand Rigobon (2002). In the case of extreme returns, they found that the probabilityof joint exceedance for the Dow Jones and the French CAC40 stock market indexesincreased dramatically when copulas were used rather than the bivariate normaldistribution. They also analyzed the dependence between exchange rates and stockmarket returns during the 1997 Asian crisis. Their results provide stronger evidenceof contagion than those obtained using correlation analysis.
Finally, Poon, Rockinger, and Tawn (2001) noted that the studies described aboveassumed asymptotic dependence. Intuitively, two series exhibit asymptotic depen-dence (independence) when in the limit, tail realizations of both series always (never)occur together. If the series analyzed are asymptotically independent, the use of con-ventional extreme value theory methods would overestimate the degree of extremaldependence. Poon, Rockinger, and Tawn described simple methods, first developedby Coles, Heffernan, and Tawn (1999), to test whether two series are asymptoticallyindependent and to estimate their extremal dependence. The methods are applied todaily stock market returns in France, Germany, Japan, the United Kingdom, and theUnited States, with the sample divided into three different periods so that extremaldependence in bear and bull markets can be analyzed. They found that asymptoticindependence characterized most of the pairwise combinations of stock returns, andthat extremal dependence was much stronger in bear markets than in bull markets.
This paper, which also follows the methodology proposed by Coles, Heffernan,and Tawn, is closely related to the work of Poon, Rockinger, and Tawn referred toabove. The main differences are as follows. First, a wider set of equity markets isconsidered in this study, and special attention is paid to the transmission of shocksacross different market classes, for example, mature and emerging. Second, theuse of five-year rolling window estimates of contagion permits tracking their his-torical evolution without assuming a priori that structural breaks took place in cer-tain periods. Finally, the behavior of contagion measures is evaluated vis-à-vis thebehavior of simple equity returns correlation, a measure widely favored in the pol-icymaking community, to assess whether they convey the same amount of infor-mation. The next section describes the theory and empirical methodology used inthis study.
II. Theory and Empirical Methodology
Although the rapidly expanding statistical literature on bivariate extreme valuetheory offers a number of alternative EVT measures, as described in Malevergne andSornette (2002), the preferred measure of extremal contagion adopted in this paperis the one first proposed by Coles, Heffernan, and Tawn (1999), since it accounts forthe asymptotic properties of the tail distributions. Coles, Heffernan, and Tawn

EXTREME CONTAGION IN EQUITY MARKETS
393
suggest a two-step approach to estimate extremal dependence. The first step isto determine whether two series are asymptotically independent; in other words,the type of asymptotic joint tail distribution that governs the behavior of theseries in the limit. Intuitively, two series are asymptotically independent (depen-dent) when infinitely large realizations of each series never (always) occur simul-taneously. Notice, though, that asymptotically independence does not precludethe simultaneous realization of large but finite realizations. After the asymptoticproperties are determined, Coles, Heffernan, and Tawn propose two differentdependent measures, χ– and χ, for the case of asymptotically independent anddependent series, respectively.
This methodological framework implies that equity return contagion betweentwo countries can be measured along two dimensions. The first dimension of con-tagion is linked to changes in the asymptotic properties of the joint tail distributionof equity returns. In fact, contagion is stronger between two countries if the equityreturn series are asymptotically dependent, since it implies that very large equityreturn realizations in both countries occur simultaneously. In contrast, asymptoticindependence implies that very large equity return realizations never occur together.Hence, for two countries with a previously asymptotically independent joint taildistribution, contagion increases if the joint tail distribution becomes asymptot-ically dependent. Moreover, an increase in the number of country-pair returnsexhibiting asymptotically dependence suggests increased contagion worldwide, asstructural changes in the transmission mechanism lead to changes in the asymp-totic properties of the joint tail distribution. The second dimension is associatedwith changes in the dependent measure when the type of asymptotic tail propertyremains unchanged. In this case, an increase in contagion between two countriesis reflected in an increase in the dependence measure rather than changes in thejoint tail distribution. Keeping these observations in mind, we explain the method-ological framework below.
Given two positive random variables, X and Y, it is natural to relate theirextremal dependence to either their conditional probability limit
(4)
which measures the probability of an extreme realization of X conditional onthe realization of an extreme realization of Y, or the joint survivor functiondefined as
(5)
which measures the joint probability of large realizations of X and Y. In mostempirical applications, the joint probability distribution function, F(x, y) = Pr(X < x,Y < y), which is required to estimate the probabilities above, is not known.However, it is possible to estimate their joint probability distribution if their uni-variate margin distributions are known using a copula.
The copula C is the unique function that relates the univariate marginal distri-butions of two random variables X and Y to their joint distribution (Nelsen, 1999):
lim Pr , ,,x y
X x Y y→∞
> >( )
lim Pr ,,x y
X x Y y→∞
> >( )

Jorge A. Chan-Lau, Donald J. Mathieson, and James Y. Yao
394
(6)
where FX(x) = F(x, ∞) and FY(y) = F(∞, y) are the cumulative distributions of Xand Y, respectively. Therefore, knowledge of the copula function C and the uni-variate distributions of X and Y is sufficient to have complete information on thejoint distribution of X and Y. In addition, copulas are invariant to nondecreasingtransformations of the variables, so it is common practice to transform (X,Y ) touniform margins (W,Z ) = (FX(X), FY(Y )).6 The copula function C, or joint distri-bution function, can be estimated from the sample by counting the number ofoccurrences belonging to a given event; that is, the number of realizations of X andY that exceeded the threshold level u. Alternatively, a parametric functional formcan be specified and estimation methods such as maximum likelihood can be usedto obtain the parameters.
The information about the extremal dependence of two random variables inthe copula C can be summarized by two dependence measures, χ and χ–. Thedependence measure χ is defined as
(7)
where (U,V) = (FX(X), FY(Y )), and C is the copula that describes the joint proba-bility of U and V. For independent variables, χ(u) = 0; for perfect dependence,χ(u) = 1. Notice that in the limit Pr(W > u Z > u) = Pr(Z > u W > u), so thatextremal dependence between two random variables is symmetric. One of theshortcomings of using χ as the only dependence measure is that for large but finitevalues of u, estimates of χ(u) may be constant and positive even if the variablesare independent in the limit; that is, χ(u) → 0.
When variables are asymptotically independent, the dependence measure χ isequal to zero by definition, so it does not contain information about the relativestrength of dependence for large but finite realizations of the variables. Coles,Heffernan, and Tawn (1999) suggest using the dependence measure χ– defined as
(8)
where the function χ–(u) is defined as
(9)χ uu
C u u( ) = −( )
( )−2 1
1log
log ,,
χ χ= ( )→
lim ,u
u1
limu→1
χ
χ
= > >( )
≈ −( )
= ( )
→
→
→
lim Pr
limlog ,
log
lim ,
u
u
u
W u Z u
C u u
u
u
1
1
1
2
F x y C F x F yX Y, , ,( ) = ( ) ( ){ }
6In recent work, Hu (2002) uses copulas to estimate dependent patterns in major financial markets. Incontrast to the work presented here, as well as in the related literature section, Hu models the completejoint distribution of realizations rather than the tail realizations only.
with C–
(u,v) = 1 − u − v + C(u,v), and χ– ∈ [−1,1]. Note that C–
(u,v) is simply thejoint probability Pr(U > u, V > v). Therefore, if the random variables are asymp-totically independent, it is possible to determine whether the extremal dependenceis either positive or negative.
Estimating χ and χ– requires estimating C(u,u) = Pr(W < u, Z < u) and C–
(u,u) =Pr(W > u, Z > u) and replacing their values in equations (7) and (9). This can beaccomplished using the following nonparametric procedure.7 First, select the thresh-old value that determines the tail region. In this paper, the threshold value is 0.95,which means that only returns in the bottom (top) 5 percent quantile are consideredin the analysis. It should be noted, though, that there are other ways to selectthe threshold value, as suggested in Danielsson and de Vries (1997); Embrechts,Kluppelberg, and Mikosch (1997); and Longin and Solnik (2001). Second, estimateempirically C(u, u) and C
–(u, u) from the data and calculate χ and χ–. For example,
estimate C(u, u) for u = 0.95 by counting the joint realizations of W and Z below0.95, and divide by the number of total observations. Third, if the null hypothesis χ– = 1 can be rejected, then contagion is measured by χ–. Otherwise, contagion ismeasured by χ.
Once the bivariate contagion measures have been estimated, constructing theglobal extreme contagion measures is straightforward, as they consist of simpleratios of the total number of asymptotically dependent cases and statistically sig-nificant bivariate contagion cases to total cases analyzed.
III. Results
The methodology described in the previous section is used to analyze weekly stockmarket returns in mature and emerging stock markets. Mature markets analyzed inthis study include those of France, Germany, Japan, the United Kingdom, andthe United States. Emerging markets include those of Argentina, Brazil, Chile,and Mexico in Latin America, and Hong Kong SAR, Indonesia, Malaysia, thePhilippines, the Republic of South Korea, Singapore, Taiwan Province of China, andThailand. For each country, weekly stock market returns are calculated from thecorresponding U.S. dollar-denominated and local currency-denominated MorganStanley Capital Index for the period December 31, 1987, to October 25, 2001. Thesample encompasses the Mexican crisis in 1994, the East Asia crisis in 1997, theRussian crisis and the collapse of LTCM in the second half of 1998, the Braziliancrisis in early 1999, and the early stages of the Argentinian debt crisis in 2001.8
EXTREME CONTAGION IN EQUITY MARKETS
395
7See Poon, Rockinger, and Tawn (2001) for an alternative parametric approach.8The assumption of a fixed rolling window implies that the financial transmission mechanism, and
hence contagion, changes over time and supposedly renders the results obtained here vulnerable to the crit-icism put forward by Forbes and Rigobon (2002); namely, using a fixed rolling window is equivalent tosorting out the data by the level of volatility. We offer two answers to this critique. First, on a practicallevel, the results presented here did not change substantially when the dependence measures were esti-mated recursively by increasing the sample size one observation at a time. Second, on an intuitive level,studies such as Chakrabarti and Roll (2000) suggest that crises are mainly characterized by dramaticdeclines in asset values rather than increased volatility, and, hence, adjustments for volatility should not beapplied.
Jorge A. Chan-Lau, Donald J. Mathieson, and James Y. Yao
396
Global extreme contagion measures for the bottom 5 percent negative returns,bear market contagion, and the top 5 percent positive returns, bull market conta-gion, were estimated using a fixed five-year rolling window. The contagion mea-sures were estimated both for raw equity returns and filtered equity returnsobtained after fitting a TARCH (1,1).9 The use of filtered equity returns is justifiedby the fact that stock returns exhibit serial dependence, while bivariate extremevalue methods assume that the data are i.i.d. Diebold, Schuermann, and Stroughair(1998) pointed out that in some cases, not correcting for serial dependence couldresult in poor tail estimators. They suggest first modeling the conditional meanand variance of the returns and analyzing the properties of the standardized resid-uals, an approach followed by other authors, including McNeil and Frey (2000);Poon, Rockinger, and Tawn (2001); Patton (2001); and Hu (2002). The results byPoon, Rockinger, and Tawn suggest that extremal dependence measures obtainedusing raw stock return series would in general be higher than those obtained usingfiltered series, especially for those associated with positive extreme realizations.
Overall, our results indicate that discriminating between local currency or U.S.dollar-denominated indices and filtering the data do not change the results signifi-cantly. Hence, this section describes only the results obtained using raw U.S. dollar-denominated equity returns. The evolution of contagion is assessed using the twoglobal extreme contagion measures proposed here by (a) describing changes in theasymptotic properties of the tail distribution as measured by changes in the numberof country-pairs displaying asymptotic dependence and (b) analyzing changes in thenumber of significant contagion cases; that is, those statistically different than zerofor a 95 percent confidence level. Finally, the section concludes with a detailedexamination of extreme contagion within and across markets.10
Asymptotic Properties of the Tail Distribution
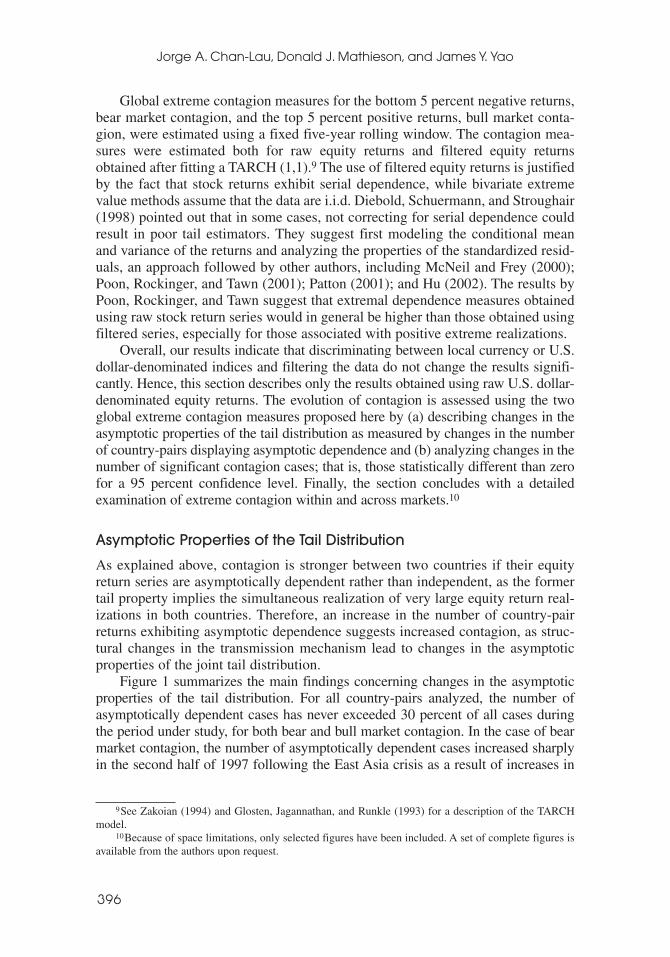
As explained above, contagion is stronger between two countries if their equityreturn series are asymptotically dependent rather than independent, as the formertail property implies the simultaneous realization of very large equity return real-izations in both countries. Therefore, an increase in the number of country-pairreturns exhibiting asymptotic dependence suggests increased contagion, as struc-tural changes in the transmission mechanism lead to changes in the asymptoticproperties of the joint tail distribution.
Figure 1 summarizes the main findings concerning changes in the asymptoticproperties of the tail distribution. For all country-pairs analyzed, the number ofasymptotically dependent cases has never exceeded 30 percent of all cases duringthe period under study, for both bear and bull market contagion. In the case of bearmarket contagion, the number of asymptotically dependent cases increased sharplyin the second half of 1997 following the East Asia crisis as a result of increases in
9See Zakoian (1994) and Glosten, Jagannathan, and Runkle (1993) for a description of the TARCHmodel.
10Because of space limitations, only selected figures have been included. A set of complete figures isavailable from the authors upon request.
EXTREME CONTAGION IN EQUITY MARKETS
397
the number of asymptotically dependent cases between Latin America and bothmature markets and East Asia. However, by end-1998, the number of asymptoticallydependent cases was almost negligible. It should be noted, though, that for LatinAmerica, and to a lesser extent in mature markets, the number of asymptoticallydependent cases has been increasing since end-1998 (Figure 2).
In the case of bull market contagion, the most salient feature is the increase inthe number of asymptotically dependent cases in early 1996 because of increaseddependence between mature markets and emerging markets and within emergingmarkets, with dependence measured by the greater number of cases classified asasymptotically dependent. However, soon after the 1996 peak, the number ofasymptotically dependent cases began declining steadily and now stands at thesame level as in the case of bear market contagion. Interestingly, for any givenperiod except during the East Asia crisis, asymptotic dependence is more preva-lent during bull market contagion than during bear market contagion.11
11Results showing how dependence has changed for each individual country-pair during the pastdecade, for example, whether the countries' stock return series are asymptotically dependent or indepen-dent, were also obtained. However, no clear pattern worth reporting emerged.
Figure 1. Number of Asymptotically Dependent Cases—Mature Markets(In percent)

Jorge A. Chan-Lau, Donald J. Mathieson, and James Y. Yao
398
Is Contagion Significant?
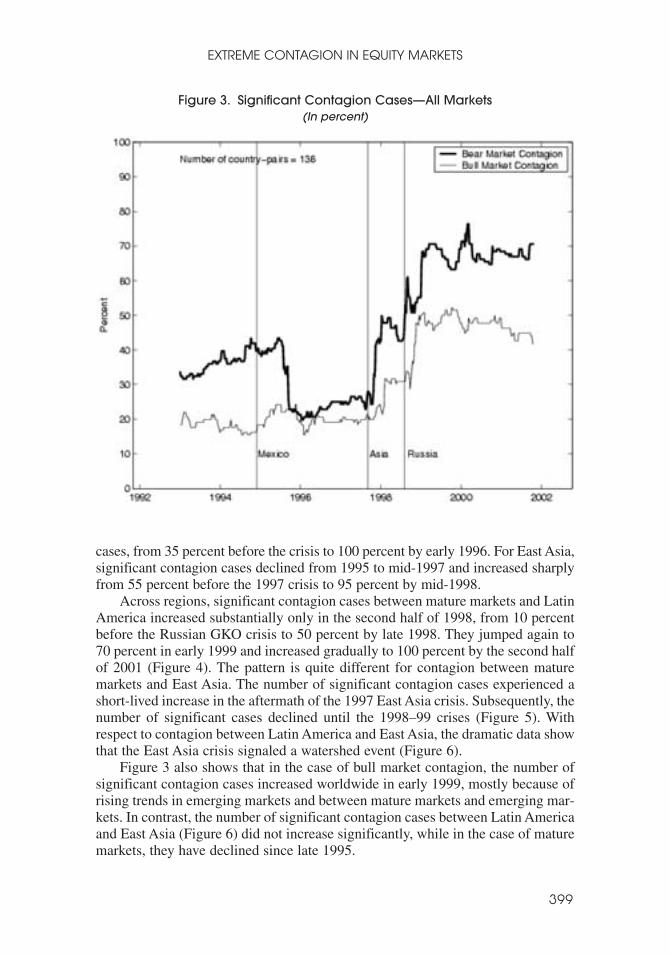
A second way to assess contagion trends is to evaluate changes in the number ofcontagion cases that are statistically different than zero. Figure 3 shows the num-ber of significant contagion cases as the percentage of all country-pairs analyzed.
In the case of bear market contagion, the data show a sharp decline in the ratioof significant contagion cases to total cases from 40 percent in late 1995 to roughly20 percent by mid-1997. The decline was reversed dramatically in the wake of theEast Asia crisis, as significant contagion cases jumped from 30 percent before thecrisis to 50 percent by end-1998. The Russian default on rouble-denominated debtin August 1998 and the LTCM debacle in October 1998 coincided with anotherincrease of significant contagion cases from 10 percent to 60 percent. Finally, bythe time of the Brazilian devaluation in early 1999, significant contagion casesreached 70 percent. This evidence suggests that, overall, bear market contagionincreased following the late 1990s crises.
However, the empirical evidence varies widely within regions and acrossregions. For mature markets, only the 1998–99 crises led to an increasing numberof significant contagion cases. For Latin America, the Mexican crisis appears to bethe event that marked the beginning of a gradual increase in significant contagion
Figure 2. Number of Asymptotically Dependent Cases—Latin America(In percent)
EXTREME CONTAGION IN EQUITY MARKETS
399
cases, from 35 percent before the crisis to 100 percent by early 1996. For East Asia,significant contagion cases declined from 1995 to mid-1997 and increased sharplyfrom 55 percent before the 1997 crisis to 95 percent by mid-1998.
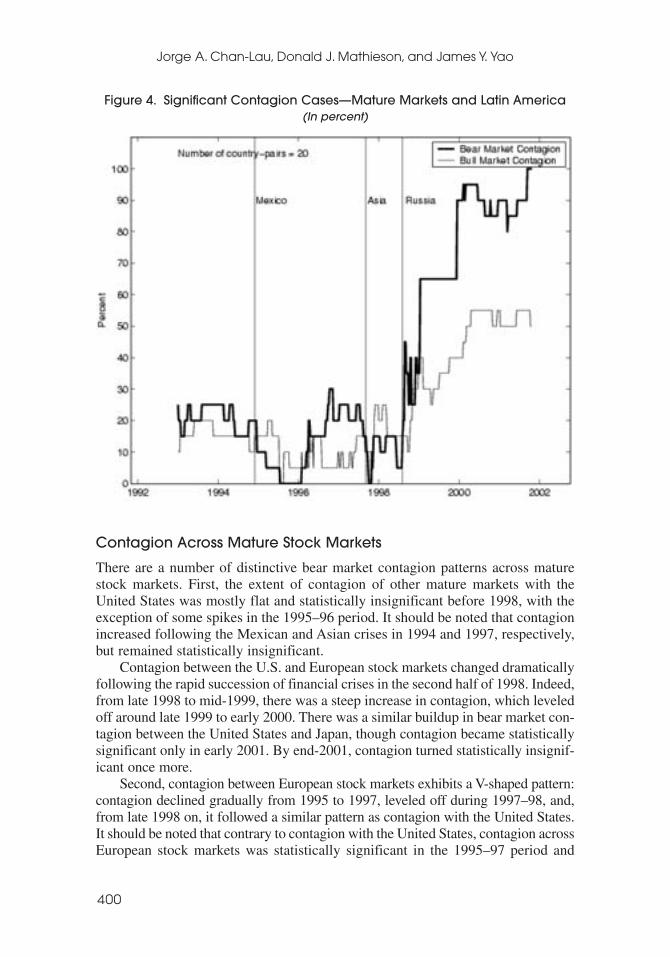
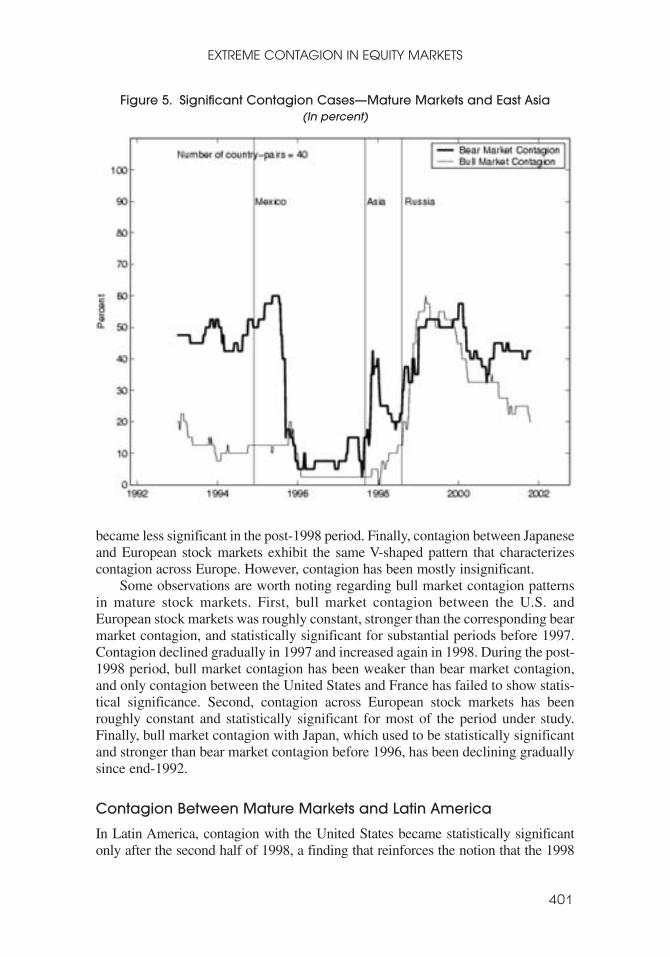
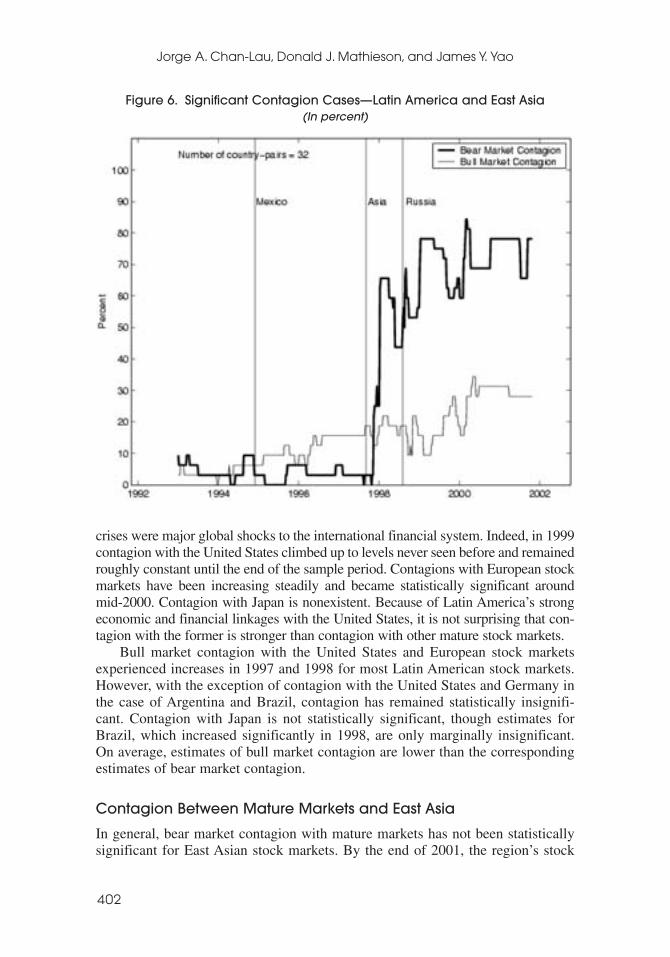
Across regions, significant contagion cases between mature markets and LatinAmerica increased substantially only in the second half of 1998, from 10 percentbefore the Russian GKO crisis to 50 percent by late 1998. They jumped again to70 percent in early 1999 and increased gradually to 100 percent by the second halfof 2001 (Figure 4). The pattern is quite different for contagion between maturemarkets and East Asia. The number of significant contagion cases experienced ashort-lived increase in the aftermath of the 1997 East Asia crisis. Subsequently, thenumber of significant cases declined until the 1998–99 crises (Figure 5). Withrespect to contagion between Latin America and East Asia, the dramatic data showthat the East Asia crisis signaled a watershed event (Figure 6).
Figure 3 also shows that in the case of bull market contagion, the number ofsignificant contagion cases increased worldwide in early 1999, mostly because ofrising trends in emerging markets and between mature markets and emerging mar-kets. In contrast, the number of significant contagion cases between Latin Americaand East Asia (Figure 6) did not increase significantly, while in the case of maturemarkets, they have declined since late 1995.
Figure 3. Significant Contagion Cases—All Markets(In percent)
Jorge A. Chan-Lau, Donald J. Mathieson, and James Y. Yao
400
Contagion Across Mature Stock Markets
There are a number of distinctive bear market contagion patterns across maturestock markets. First, the extent of contagion of other mature markets with theUnited States was mostly flat and statistically insignificant before 1998, with theexception of some spikes in the 1995–96 period. It should be noted that contagionincreased following the Mexican and Asian crises in 1994 and 1997, respectively,but remained statistically insignificant.
Contagion between the U.S. and European stock markets changed dramaticallyfollowing the rapid succession of financial crises in the second half of 1998. Indeed,from late 1998 to mid-1999, there was a steep increase in contagion, which leveledoff around late 1999 to early 2000. There was a similar buildup in bear market con-tagion between the United States and Japan, though contagion became statisticallysignificant only in early 2001. By end-2001, contagion turned statistically insignif-icant once more.
Second, contagion between European stock markets exhibits a V-shaped pattern:contagion declined gradually from 1995 to 1997, leveled off during 1997–98, and,from late 1998 on, it followed a similar pattern as contagion with the United States.It should be noted that contrary to contagion with the United States, contagion acrossEuropean stock markets was statistically significant in the 1995–97 period and
Figure 4. Significant Contagion Cases—Mature Markets and Latin America(In percent)
EXTREME CONTAGION IN EQUITY MARKETS
401
became less significant in the post-1998 period. Finally, contagion between Japaneseand European stock markets exhibit the same V-shaped pattern that characterizescontagion across Europe. However, contagion has been mostly insignificant.
Some observations are worth noting regarding bull market contagion patternsin mature stock markets. First, bull market contagion between the U.S. andEuropean stock markets was roughly constant, stronger than the corresponding bearmarket contagion, and statistically significant for substantial periods before 1997.Contagion declined gradually in 1997 and increased again in 1998. During the post-1998 period, bull market contagion has been weaker than bear market contagion,and only contagion between the United States and France has failed to show statis-tical significance. Second, contagion across European stock markets has beenroughly constant and statistically significant for most of the period under study.Finally, bull market contagion with Japan, which used to be statistically significantand stronger than bear market contagion before 1996, has been declining graduallysince end-1992.
Contagion Between Mature Markets and Latin America
In Latin America, contagion with the United States became statistically significantonly after the second half of 1998, a finding that reinforces the notion that the 1998
Figure 5. Significant Contagion Cases—Mature Markets and East Asia(In percent)
Jorge A. Chan-Lau, Donald J. Mathieson, and James Y. Yao
402
crises were major global shocks to the international financial system. Indeed, in 1999contagion with the United States climbed up to levels never seen before and remainedroughly constant until the end of the sample period. Contagions with European stockmarkets have been increasing steadily and became statistically significant aroundmid-2000. Contagion with Japan is nonexistent. Because of Latin America’s strongeconomic and financial linkages with the United States, it is not surprising that con-tagion with the former is stronger than contagion with other mature stock markets.
Bull market contagion with the United States and European stock marketsexperienced increases in 1997 and 1998 for most Latin American stock markets.However, with the exception of contagion with the United States and Germany inthe case of Argentina and Brazil, contagion has remained statistically insignifi-cant. Contagion with Japan is not statistically significant, though estimates forBrazil, which increased significantly in 1998, are only marginally insignificant.On average, estimates of bull market contagion are lower than the correspondingestimates of bear market contagion.
Contagion Between Mature Markets and East Asia
In general, bear market contagion with mature markets has not been statisticallysignificant for East Asian stock markets. By the end of 2001, the region’s stock
Figure 6. Significant Contagion Cases—Latin America and East Asia(In percent)
EXTREME CONTAGION IN EQUITY MARKETS
403
markets appeared to be linked most closely to the United States and the UnitedKingdom. Overall, though, stock market linkages between East Asia and the devel-oped world are weaker than those corresponding to Latin America, suggesting thatfinancially the latter region is better integrated to the rest of the world.
Similarly, bull market contagion with mature markets has not been statisticallysignificant during most of the period under study. By end-2001, there was signif-icant contagion only between the United Kingdom and Hong Kong SAR. As in thecase of Latin America, estimates of bull market contagion are lower than the cor-responding estimates of bear market contagion. Interestingly, financial linkagesbetween East Asia and Japan are not as strong as those between Latin America andthe United States, as bear and bull market contagion is statistically insignificant.
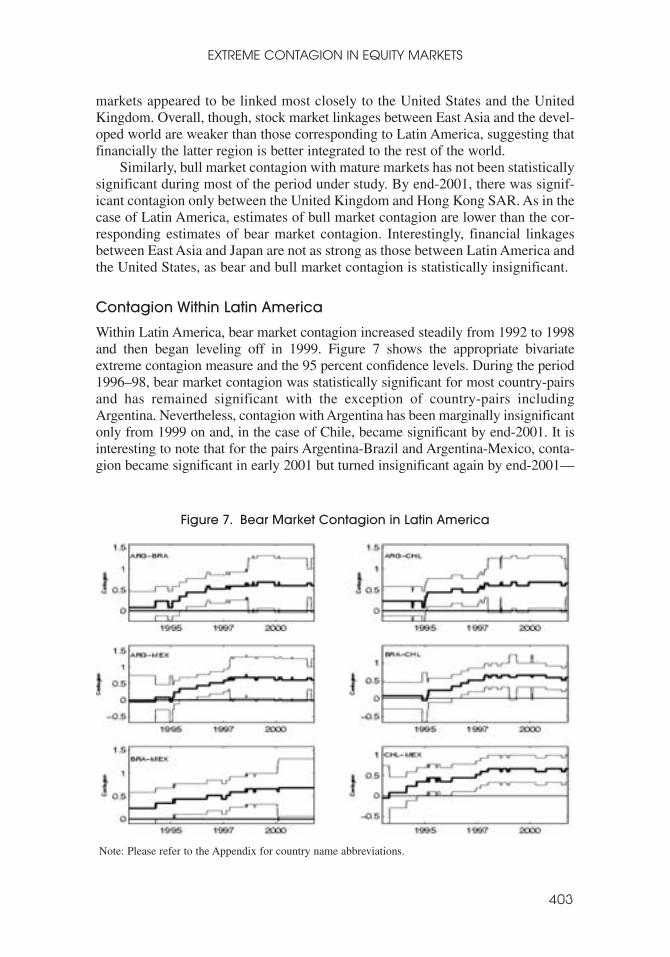
Contagion Within Latin America
Within Latin America, bear market contagion increased steadily from 1992 to 1998and then began leveling off in 1999. Figure 7 shows the appropriate bivariateextreme contagion measure and the 95 percent confidence levels. During the period1996–98, bear market contagion was statistically significant for most country-pairsand has remained significant with the exception of country-pairs includingArgentina. Nevertheless, contagion with Argentina has been marginally insignificantonly from 1999 on and, in the case of Chile, became significant by end-2001. It isinteresting to note that for the pairs Argentina-Brazil and Argentina-Mexico, conta-gion became significant in early 2001 but turned insignificant again by end-2001—
Figure 7. Bear Market Contagion in Latin America
Note: Please refer to the Appendix for country name abbreviations.
Jorge A. Chan-Lau, Donald J. Mathieson, and James Y. Yao
404
Tab
le 1
.C
orr
ela
tion
Be
twe
en
Ext
rem
al D
ep
en
de
nc
e M
ea
sure
s o
f Co
nta
gio
n a
nd
C
on
diti
on
al C
orr
ela
tion
s fo
r Eq
uity
Ma
rke
ts
USA
GB
RFR
AD
EU
JPN
AR
GB
RA
CH
LM
EX
SGP
HK
SAR
IDN
KO
RM
YS
PHL
TPC
TH
A
USA
0.91
0.85
0.83
0.64
0.75
0.93
0.91
0.82
0.36
0.11
0.02
0.94
0.60
0.60
0.80
0.40
GB
R0.
510.
500.
640.
200.
810.
760.
920.
940.
140.
76−0
.05
0.77
0.22
0.90
0.13
0.66
FRA
0.03
0.57
0.89
0.53
0.78
0.59
0.74
0.79
0.89
0.00
−0.6
10.
920.
700.
870.
600.
66D
EU
0.71
−0.1
60.
280.
500.
910.
750.
900.
940.
770.
38−0
.17
0.83
0.63
0.63
0.27
0.62
JPN
0.93
0.93
0.39
0.79
0.64
0.67
0.53
0.86
0.82
0.86
−0.5
3−0
.22
0.87
0.56
0.15
0.61
AR
G0.
900.
620.
510.
950.
520.
930.
940.
960.
600.
800.
910.
970.
940.
890.
930.
91B
RA
0.88
0.44
0.28
0.83
0.87
0.97
0.96
0.98
0.58
0.14
0.57
0.96
0.62
0.79
0.52
0.84
CH
L0.
670.
21−0
.12
0.89
−0.2
60.
500.
980.
940.
850.
470.
840.
830.
800.
790.
860.
62M
EX
0.72
0.81
−0.1
00.
680.
580.
950.
930.
850.
220.
380.
690.
73−0
.11
0.74
0.13
0.83
SGP
0.82
0.63
0.28
−0.0
70.
630.
960.
910.
140.
630.
150.
450.
560.
700.
720.
170.
29H
KSA
R0.
230.
850.
200.
450.
800.
320.
92−0
.22
0.42
0.53
0.48
0.35
0.61
0.22
0.62
0.59
IDN
0.46
0.78
0.65
0.50
0.97
0.72
0.62
−0.0
20.
630.
890.
810.
810.
240.
700.
410.
58K
OR
0.86
0.58
0.58
0.80
−0.2
70.
930.
290.
800.
60−0
.11
−0.1
90.
970.
450.
640.
550.
83M
YS
0.67
−0.0
80.
770.
170.
460.
750.
09−0
.50
0.60
0.77
−0.4
20.
640.
260.
720.
760.
59PH
L0.
240.
820.
780.
140.
750.
170.
860.
34−0
.20
0.73
0.81
0.88
0.90
0.52
0.76
0.82
TPC
0.56
−0.0
50.
290.
550.
630.
420.
290.
240.
250.
580.
870.
860.
320.
430.
460.
43T
HA
0.42
0.85
0.71
0.04
0.85
0.84
−0.4
6−0
.08
−0.3
70.
25−0
.08
0.91
0.17
0.17
0.37
0.59
Upp
er tr
iang
ular
mat
rix:
Cor
rela
tion
betw
een
extr
emal
dep
ende
nce
mea
sure
s of
con
tagi
on fo
r lar
ge n
egat
ive
retu
rns
and
cond
ition
al s
tock
mar
ket r
etur
n co
rrel
atio
ns.
Low
er tr
iang
ular
mat
rix:
Cor
rela
tion
betw
een
extr
emal
dep
ende
nce
mea
sure
s of
con
tagi
on fo
r lar
ge p
ositi
ve re
turn
s an
d co
nditi
onal
sto
ck m
arke
t ret
urn
corr
elat
ions
.N
ote:
Plea
se r
efer
to th
e A
ppen
dix
for
coun
try
nam
e ab
brev
iatio
ns.
EXTREME CONTAGION IN EQUITY MARKETS
405
clear evidence of decoupling. Bull market contagion across Latin American stockmarkets has been also trending upward since 1998, with the only exception being thepair Argentina-Chile. Moreover, since 1998, contagion for almost all country-pairshas been statistically significant. In contrast to bear market contagion, there is nodecoupling from Argentina for large positive market returns. As in the previous casesanalyzed, bull market contagion is weaker than bear market contagion.
Contagion Within East Asia
Contagion has been roughly constant and significant for most country-pairs inEast Asia during the entire period under study. The 1997 East Asia crisis promptedan increase in contagion for a number of country-pairs for which contagion wasnot significant before the crisis, such as Hong Kong SAR-Korea, Hong KongSAR-Taiwan Province of China, and Korea-Malaysia. Contagion with Singaporeand Hong Kong SAR, the two most important regional financial centers, has beensignificant for most country-pairs since end-1992 and for all country-pairs since end-1997. In contrast with Latin America, there is no secular increasing trend in EastAsia. Bull market contagion patterns are similar to those of bear market contagion,although bull market contagion is weaker. This evidence suggests that financial trans-mission mechanisms across East Asian stock markets may have remained unchangedduring the past decade.
Contagion Between Latin America and East Asia
Contagion between Latin America and East Asia was statistically insignificantbefore 1998. However, by late 1998 estimates of contagion increased sharply, andfor some country-pairs including Argentina-Korea, Argentina-Taiwan Province ofChina, Chile-Hong Kong SAR, Chile-Thailand, and Mexico-Thailand, contagionbecame statistically significant. Contagion with Brazil, the major economy inLatin America, was significant for Malaysia and Taiwan Province of China only in1999 and 2000, respectively. It is of interest to consider the degree of contagionbetween Argentina and Hong Kong SAR since both countries had currency boardarrangements. In early 2000, contagion was significant, but by mid-2001, decou-pling took place and contagion turned insignificant. With few exceptions, bullmarket contagion across Latin American and East Asian stock markets has beenstatistically insignificant for the past decade. The exceptions are Argentina andSingapore, and Brazil and Hong Kong SAR, with contagion significant since 1998and 2000, respectively.
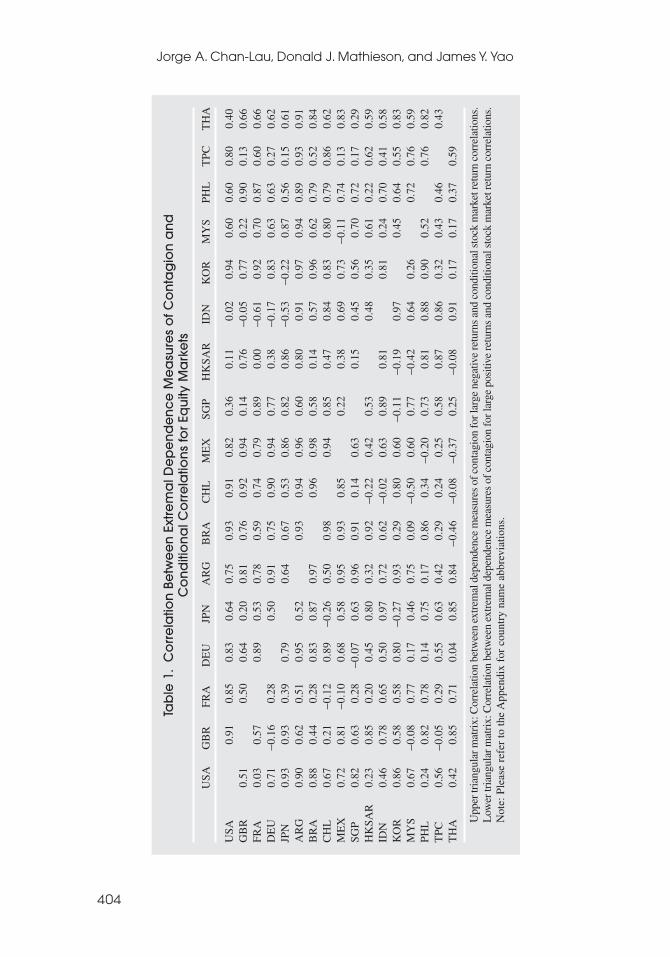
Differences Between Contagion Measures and Correlation Measures
Correlations between the contagion measures used in this paper and five-year rollingwindow equity market returns conditional correlations suggest at times quite differ-ent patterns of contagion (Table 1). For example, the correlation between bear con-tagion measures and conditional correlations among mature markets range from0.20 (for Japan and the United Kingdom) to 0.91 (for the United States and the

Jorge A. Chan-Lau, Donald J. Mathieson, and James Y. Yao
406
United Kingdom). Therefore, reliance on conditional correlations could lead to falsealarms, by overstating contagion risk not reflected in increases in extremal depen-dence measures, or create a false sense of security. The only exception is LatinAmerica, where the correlation of contagion measures and simple correlationsexceeds 0.93 for every pairwise combination of countries. However, even in LatinAmerica the use of simple correlations is not always validated since contagion mea-sures and correlations sometimes move in different directions during short periods.
IV. Conclusions
This paper has studied how contagion across equity markets has evolved duringthe past decade. The authors used dependence measures based on the joint behav-ior of co-exceedances of equity returns for pairwise combinations of equity mar-ket returns. These measures, which are based on extreme value theory, avoid theproblems associated with the use of simple Pearson correlations.
The results indicate that (a) contagion patterns differ significantly within andacross regions, with Latin America showing a secular increase in contagion notmatched by other regions or countries; (b) contagion is higher for negative returnsthan for positive returns; (c) only the 1998 Russian and Brazilian crises led to aglobal increase in contagion; and (d) extremal dependence measures of contagionand simple correlation measures are not highly correlated, with the exception ofLatin America, suggesting that the use of correlations as a proxy for contagion canat times be misleading.
APPENDIX
Country Abbreviations Used in This Paper
Mature markets
FRA = FranceDEU = GermanyJPN = JapanGBR = United KingdomUSA = United States
Latin America
ARG = ArgentinaBRA = BrazilCHL = ChileMEX = Mexico
East Asia
HKSAR = Hong Kong SARIDN = IndonesiaKOR = Republic of Korea
EXTREME CONTAGION IN EQUITY MARKETS
407
MYS = MalaysiaPHL = PhilippinesSGP = SingaporeTPC = Taiwan Province of ChinaTHA = Thailand
REFERENCES
Bae, Kee-Hong, G. Andrew Karolyi, and René M. Stulz, 2003, “A New Approach to MeasuringFinancial Contagion,” Review of Financial Studies, Vol. 16, No. 3, pp. 717–63.
Baig, Tamur, and Ilan Goldfajn, 1999, “Financial Market Contagion in the Asian Crisis,” IMFStaff Papers, Vol. 46, pp. 167–95.
Bertero, Enrique, and Colin Mayer, 1990, “Structure and Performance: Global Interdependenceof Stock Markets Around the Crash of October 1987,” European Economic Review, Vol. 34,pp. 1155–80.
Boyer, Brian H., Michael S. Gibson, and Mico Loretan, 1997, “Pitfalls in Tests for Changes inCorrelations,” International Finance Discussion Paper No. 597 (Washington: Board ofGovernors of the Federal Reserve System).
Chakrabarti, Rajesh, and Richard Roll, 2000, “East Asia and Europe During the 1997 AsianCollapse: A Clinical Study of a Financial Crisis,” Working Paper No. 25-00 (Los Angeles:University of California).
Chan-Lau, Jorge A., and Iryna V. Ivaschenko, 2001, “Asian Flu or Wall Street Virus? Price andVolatility Spillovers in the Tech and Non-Tech Sectors,” Journal of Multinational FinancialManagement, Vol. 13, pp. 302–22.
Coles, Stuart, Janet Heffernan, and Jonathan Tawn, 1999, “Dependence Measures for ExtremeValue Analysis,” Extremes, Vol. 2, pp. 339–65.
Costinot, Arnaud, Thierry Roncalli, and Jerome Teiletche, 2000, “Revisiting the DependenceBetween Financial Markets with Copulas,” Working Paper (Paris: Credit Lyonnais).
Danielsson, Jon, and Casper G. de Vries, 1997, “Value-At-Risk and Extreme Returns,” LSEFinancial Markets Group Discussion Paper No. 273 (September), pp. 1–33 (London: LondonSchool of Economics).
Diebold, Francis X., Til Schuermann, and John D. Stroughair, 1998, “Pitfalls and Opportunitiesin the Use of Extreme Value Theory in Risk Management,” in Advances in ComputationalFinance, ed. by A.P.N. Refenes, J.D. Moody, and A.N. Burgess (Amsterdam: KluwerAcademic Publishers), pp. 3–12.
Embrechts, Paul, Claudia Kluppelberg, and Thomas Mikosch, 1997, Modelling ExtremalEvents for Insurance and Finance (Berlin: Springer Verlag).
Embrechts, Paul, Alexander McNeil, and Daniel Straumann, 1999, “Correlation: Pitfalls andAlternatives,” Risk, Vol. 12 (May), pp. 69–71.
Eun, Cheol, and Sangdal Shim, 1989 “International Transmission of Stock MarketMovements,” Journal of Financial and Quantitative Analysis, Vol. 24, pp. 241–56.
Forbes, Kristin, and Roberto Rigobon, 2002, “No Contagion, Only Interdependence: MeasuringStock Market Comovements,” Journal of Finance, Vol. 57 (October), pp. 2223–61.
Glosten, Lawrence R., Ravi Jagannathan, and David E. Runkle, 1993, “On the Relationbetween the Expected Value and the Volatility of the Normal Excess Return on Stocks,”Journal of Finance, Vol. 48 (December), pp. 1779–1801.
Jorge A. Chan-Lau, Donald J. Mathieson, and James Y. Yao
408
Hartmann, Philipp, Stefan Straetmans, and Caspar G. de Vries, 2001, “Asset Market Linkagesin Crisis Periods,” CEPR Discussion Paper No. 2916 (London: Centre for Economic PolicyResearch).
Hilliard, Jimmy, 1979, “The Relationship Between Equity Indices on World Exchanges,” Journalof Finance, Vol. 34, pp. 103–14.
Hu, Ling, 2002, “Dependence Patterns Across Financial Markets: Methods and Evidence”(unpublished; Columbus, Ohio: Ohio State University).
International Monetary Fund, 2000, World Economic Outlook, May, World Economic andFinancial Surveys (Washington).
Jansen, Dennis W., and Caspar G. de Vries, 1991, “On the Frequency of Large Stock Returns:Putting Booms and Busts into Perspective,” The Review of Economics and Statistics,Vol. 73 (February), pp. 18–24.
Jondeau, Eric, and Michael Rockinger, 1999, “The Tail Behavior of Stock Returns: Emerging ver-sus Mature Markets,” Series Les cahiers de Recherche, No. 668 (Paris: Banque de France).
Longin, Francois, 1996, “The Asymptotic Distribution of Extreme Stock Market Returns,”Journal of Business, Vol. 69 (July), pp. 383–408.
—–—, and Bruno Solnik, 2001, “Extreme Correlation of International Equity Markets,” Journalof Finance, Vol. 56 (April), pp. 649–76.
Malevergne, Yannick, and Didier Sornette, 2002, “Investigating Extreme Dependences: Conceptsand Tools,” Risk, Vol. 15 (November), pp. 129–33.
McNeil, Alexander J., and Rüdiger Frey, 2000, “Estimation of Tail-Related Risk Measures forHeteroscedastic Financial Time Series: An Extreme Value Approach,” Journal of EmpiricalFinance, Vol. 7, pp. 271–300.
Nelsen, R.B., 1999, “An Introduction to Copulas,” in Lecture Notes in Statistics, Vol. 139 (NewYork: Springer Verlag).
Patton, Andrew J., 2001, “Modelling Time-Varying Exchange Rate Dependence Using theConditional Copula,” Working Paper No. 01-09 (San Diego: University of California, SanDiego, Department of Economics).
Phoa, Wesley, 1999, “Estimating Credit Spread Risk Using Extreme Value Theory,” Journal ofPortfolio Management, Vol. 25 (Spring), pp. 69–73.
Poon, Ser-Huang, Michael Rockinger, and Jonathan Tawn, 2001, “New Extreme-ValueDependence Measures and Finance Applications,” CEPR Discussion Paper No. 2762(London: Centre for Economic Policy Research).
Quintos, C., 2001, “Estimating Tail Dependence and Testing for Contagion Using Tail Indices”(unpublished; New York: Lehman Brothers).
Roll, Richard, 1988, “The International Crash of October 1987,” Financial Analysts Journal,September/October, pp. 19–35.
———, 1989, “Price Volatility, International Market Links, and Their Implications forRegulatory Policies,” Journal of Financial Services Research, Vol. 3, pp. 211–46.
Starica, Catalin, 1999, “Multivariate Extremes for Models with Constant ConditionalCorrelations,” Journal of Empirical Finance, Vol. 6, No. 5, pp. 515–53.
Tsay, Rvey S., 1999, “Extreme Value Analysis of Financial Data” (unpublished; Chicago:University of Chicago, Graduate School of Business).
Zakoian, Jean-Michael, 1994, “Threshold Heteroskedastic Models,” Journal of EconomicDynamics and Control, Vol. 18 (September), pp. 931–55.