extraction of anthocyanins and polyphenolics from … of anthocyanins and polyphenolics from...
TRANSCRIPT

C564 JOURNAL OF FOOD SCIENCE—Vol. 69, Nr. 7, 2004Published on Web 8/30/2004
© 2004 Institute of Food TechnologistsFurther reproduction without permission is prohibited
C: Food Chemistry & Toxicology
JFS C: Food Chemistry and Toxicology
Extraction of Anthocyanins and Polyphenolicsfrom Blueberry Processing WasteJ. LEE AND R.E. WROLSTAD
ABSTRACT: The effectiveness of temperature, SO2, citric acid, and industrial juice-processing enzymes (n = 9) forproducing extracts of blueberries (Vaccinium corymbosum, cv. Rubel) and blueberry skins that are rich in anthocya-nins and polyphenolics were evaluated individually and/or in combination. Enzyme treatment had little effect ontotal monomeric anthocyanins and on total phenolics recovery. Various combinations of heat, SO
2, and citric acidyielded extracts with higher concentrations of ACY and TP than the control. The distribution of anthocyanins andpolyphenolics in ‘Rubel’ was also investigated. Anthocyanins existed almost exclusively in the skins, and polyphenolicswere mostly in the skins with lesser amounts in flesh and seeds. Skins were also highest in antioxidant activity. Allportions contained the same individual anthocyanins but in varying amounts. Cinnamic acid derivatives andflavonol-glycosides were found in the skins and seeds, whereas the flesh contained only cinnamic acids.
Keywords: anthocyanins, polyphenolics, blueberry, skins, flesh, seeds
Introduction
The health benefits of blueberries (Vaccinium sp.) became widely accepted after Prior (1998) reported that blueberries had the
highest antioxidant activity of 42 fruits and vegetables evaluated.This finding sparked numerous investigations into the health ben-efits of blueberries. Several studies have confirmed that blueber-ries contain high antioxidant activity compared with other fruits(Cao and others 1996; Wang and others 1996; Prior and others 1998;Vinson and others 2001). Epidemiological studies have demonstrat-ed that a diet rich in fruits and vegetables reduces the risk of cer-tain types of cancer, cardiovascular disease, and other chronic dis-eases (Steinmetz and Potter 1991; Hertog and others 1993, 1994,1995; Criqui and Ringel 1994; AICR 1997; Ness and Powles 1997).
The Pacific Northwest is a major producer of berries, fruit juices,and fruit juice concentrates. In 2002, Oregon produced 27500000pounds of blueberries. Of these, 40% were marketed as fresh fruit,whereas the remaining 60% were processed in some form (Coba andGoodwin 2003). A substantial amount of blueberry fruit is pro-cessed into juice and juice concentrate, which is subsequentlyused in beverages, syrups, and other food products. Juice process-ing unavoidably generates waste by-products, consisting of seeds,stems, and skins that will be found in the presscake residue. Be-cause blueberry presscake has high amounts of anthocyanins andpolyphenolics (Lee and others 2002), it is a potential source fornatural colorants and nutraceuticals.
The objective of this study was to evaluate juice-processing en-zymes and a number of processing parameters, for producing aque-ous blueberry extract that was rich in anthocyanins and polyphe-nolics. The intent was to develop a process that would be suitablefor manufacturing extracts from blueberry juice–processing wastesfor natural colorant and nutraceutical usage. Another approach formaking an anthocyanin/polyphenolic-rich extract would be to useonly the skins for the starting material. For that reason, the antho-
cyanin and phenolic contents of the separate portions of blueberryfruit (skin, flesh, and seeds) were also determined.
Materials and Methods
Plant materialFrozen blueberries (V. corymbosum cv. Rubel; Grade 1) were pro-
vided by the Oregon Blueberry Commission. Blueberry skins forthe extraction experiments were obtained by removing skins frompartially thawed berries with the aid of a razor blade. The skins wereimmediately frozen in liquid nitrogen and stored at –70 °C. For theanalysis of blueberry fractions, skins were removed as describedpreviously, and seeds were manually separated from thawed flesh.Samples were frozen in liquid nitrogen and stored at –70 °C untilanalysis. Industrial blueberry processing waste was supplied bythe J. M. Smucker Co. (Woodburn, Oreg., U.S.A.) in the forms of fro-zen puree waste and frozen berries described as puree stock. Thesematerials were stored at –23 °C.
Reagents, standards, and enzymesAll solvents used in this investigation were high-performance
liquid chromatography (HPLC) grade. Potassium metabisulfite,citric acid, gallic acid, catechin, epicatechin, protocatechuic acid,ellagic acid, caffeic acid, ferulic acid, m-coumaric acid, o-coumaricacid, p-coumaric acid, chlorogenic acid, vanillic acid, syringic acid,2,3-dihydroxybenzoic acid, quercetin, myricetin, hydrocinnamicacid, and P-hydroxybenzoic acid were obtained from Sigma Chem-ical Co. (St. Louis, Mo., U.S.A.). Trolox (6-hydroxy-2,5,7,8-tetrame-thylchroman-2-carboxylic acid) and TPTZ (tripyridyltriazine) werepurchased from Fluka (Buchs, Switzerland). AAPH [2,2�-azobis(2-amidinopropane) dihydrochloride] was purchased from Wako(Richmond, Va., U.S.A.).
Commercial juice-processing enzymes were provided by ABEnzymes (Columbus, Ohio, U.S.A.), DSM Food Specialties USA,Inc. (Charlotte, N.C., U.S.A.), Novozymes North America Inc.(Franklinton, N.C., U.S.A.), and Valley Research, Inc. (South Bend,Ind., U.S.A.). Substrate activities as described for the enzymes arelisted in Table 1. Firms supplying the enzymes were assured that
MS 20040056 Submitted 1/29/04, Revised 2/23/04, Accepted 5/3/04. Authorsare with the Dept. of Food Science and Technology, Oregon State Univ.,Corvallis, OR 97331. Direct inquiries to author Wrolstad (E-mail:[email protected]).

Vol. 69, Nr. 7, 2004—JOURNAL OF FOOD SCIENCE C565URLs and E-mail addresses are active links at www.ift.org
C: Fo
od Ch
emist
ry &
Toxico
logy
Blueberry processing . . .
the identity of the individual enzymes would be kept confiden-tial.
Enzyme evaluationCommercial enzyme companies supplied juice-processing en-
zyme preparations (n = 9) for assessment. Frozen whole blueberriesor frozen skins (250 g each) were pureed with distilled water (1:2,berries or skins:distilled water) using a Waring blender (WaringsLaboratory Science, Torrington, Conn., U.S.A.) and aliquoted to Er-lenmeyer flasks. The mixture was placed in a 50 °C Orbit shaker wa-ter bath (Lab-Line Instruments Inc., Melrose Park, Ill., U.S.A.) for 10min, and then 1 mL of diluted enzyme solution (enzymes were di-luted based on manufacturer recommendations) was added to theberry/skin puree-water mixture and incubated for 1 h at 50 °C. Af-ter the incubation period, samples were then placed in a boilingwater bath (Precision 180 Series, Precision Scientific Inc., Chicago,Ill., U.S.A.) for 10 min to inactivate enzymes, and then immediatelycooled in an ice bath. Samples were then centrifuged using an In-ternational clinical centrifuge (Intl. Equipment Co., Boston, Mass.,U.S.A.) for 30 min. The supernatants were collected and kept frozenat –70 °C until analysis.
Extraction experimentsBoth whole blueberries and skins were used for extraction ma-
terial. Experimental conditions evaluated included temperature(50 °C and 80 °C), citric acid addition (none and 1% citric acid), andSO2 addition (0, 50, and 100 ppm free SO2). These processing pa-rameters were applied individually and in combination, represent-ing a 2 � 3 � 2 randomized complete block design (RCBD). Detailsof the different parameters are summarized in Table 2. Blueberrieswere homogenized using a Polytron PT10-35 and PT-K Laboratoryhomogenizer (Kinematica, Luzern, Switzerland), setting 3 for 30 s,in the presence of solutions containing the appropriate concentra-tion of acid and/or sulfur dioxide in distilled water (1:2, berries orskins:solution). Samples were then held at a constant temperature(either 50 °C or 80 °C, depending on the parameter) for 1 h in anOrbit shaker water bath (Lab-Line Instruments, Inc.). Samples werecooled in an ice bath after incubation and then centrifuged. The
supernatants were collected, frozen, and stored at –70 °C untilanalysis. All trials were duplicated.
Sample preparationSample materials were extracted following the procedure de-
scribed by Rodriguez-Saona and Wrolstad (2001). Blueberries,blueberry fractions (skin, flesh, and seeds), and processing wasteswere liquid nitrogen-powdered using a mortar and pestle. Fivegrams of powdered sample was sonicated with 10 mL of 100% ace-tone and re-extracted with 70% (70:30 acetone:water, v/v) aqueousacetone until the solution became colorless. It was then partitionedwith chloroform (1:2 acetone:chloroform, v/v) to obtain the aque-ous fraction. The aqueous portion was collected, and residual ace-tone was evaporated by a Büchi rotovapor (Westbury, N.Y., U.S.A.)at 40 °C. The aqueous extract was dissolved to a final volume of 25mL with distilled water. Samples were then stored at –70 °C untilanalysis.
Determination of total anthocyanins, polymeric colorpercentage, and total phenolics
The pH differential method (spectrophotometric method), asdescribed by Giusti and Wrolstad (2001), was used in determiningtotal monomeric anthocyanins (ACY), and expressed as cyanidin-3-glucoside (molar extinction coefficient of 26900 Lcm-1mol-1 andmolecular weight of 449.2 gmol-1). Absorbance measurements wereconducted at 520 and 700 nm. The unit for ACY was mg of cyani-din-3-glucoside/100 g. The percent polymeric color of samples wasdetermined by resistance to bisulfite bleaching, as described byGiusti and Wrolstad (2001). The Folin-Ciocalteu (FC) method wasused for measuring total phenolics (TP) (Waterhouse 2002) andexpressed as mg of gallic acid/100 g. Absorbance measurementswere conducted at 765 nm. A Shimadzu 300 UV-visible spectropho-tometer (Shimadzu Inc., Kyoto, Japan) and 1-cm pathlength cellswere used for both measurements. Measurements of ACY, polymer-ic color percentage, and TP of sample extracts were replicated 2times. ACY and TP were determined on whole berries, berry frac-tions (skin, flesh, and seeds), industrial processing waste, and sam-ple extracts from the enzyme and extraction experiments. ACY andTP were expressed as mg/100 g of berries, skin, flesh, or seeds.
Purification of anthocyanins and polyphenolicsAnthocyanin pigments and polyphenolics were isolated by solid-
phase extraction as described by Rodriguez-Saona and Wrolstad(2001). The aqueous extract was applied to a C-18 Sep-Pak mini-column (Waters Associates, Milford, Mass., U.S.A.), rinsed with 10mL water, and the water eluant discarded. After drying with a nitro-gen stream, polyphenolics were eluted with 10 mL ethyl acetate.Ethyl acetate was removed from this fraction using a Büchi ro-
Table 1—Characteristics of industrial juice-processing en-zymes
ProductionEnzymes microorganism Activity
E1 Information not provided No information providedby the manufacturer,experimental stages
E2 Aspergillus niger Pectinase, hemicellulase
E3 Trichoderma reesei Cellulase
E4 Aspergillus aculeatus/ Pectinase,cellulase,Trichoderma longibrachiatum/ cellobiaseAspergillus niger
E5 Aspergillus aculeatus Pectinase
E6 Information not provided/ Experimental pectinase,Trichoderma longibrachiatum/ cellulase, cellobiaseAspergillus niger
E7 Fungal cultures Pectinase, cellulase(did not specify)
E8 Aspergillus species Pectinase, hemicellulase
E9 Aspergillus niger Pectinase
Table 2—Experimental design for heat, SO2, and citric acidcombinations for extraction experiments (12 differentcombinations)a
0 ppm of SO2 50 ppm of SO2 100 ppm of S02
50 °C 0% citric acid-control 0% citric acid 0% citric acid(H50S0C0) (H50S50C0) (H50S100C0)
1% citric acid 1% citric acid 1% citric acid(H50S0C1) (H50S50C1) (H50S100C1)
80 °C 0% citric acid 0% citric acid 0% citric acid(H80S0C0) (H80S50C0) (H80S100C0)
1% citric acid 1% citric acid 1% citric acid(H80S0C1) (H80S50C1) (H80S100C1)
aCodes in parentheses are abbreviations for the individual treatments.
C566 JOURNAL OF FOOD SCIENCE—Vol. 69, Nr. 7, 2004 URLs and E-mail addresses are active links at www.ift.org
C: Food Chemistry & Toxicology
Blueberry processing . . .
tovapor at 40 °C, then the residue was redissolved in 2 mL acidifiedwater. Anthocyanins were eluted with 10 mL of acidified (0.01%HCl) methanol, and the methanol was subsequently evaporatedusing a Büchi rotovapor at 40 °C. The pigments were redissolved in2 mL acidified (0.01% HCl) water. Samples were filtered through a0.45-�m Millipore filter (type HA; Millipore Corp., Bedford, Mass.,U.S.A.) before analysis by electrospray ionization mass spectrom-etry (ES-MS) and liquid chromatography equipped with a photo-diode array detector and mass spectrometer (LC-DAD-MS).
Determination of antioxidant activityAntioxidant activities of extracts were determined by ferric re-
ducing antioxidant potential (FRAP) and oxygen radical absorbingcapacity (ORAC) assays. FRAP assays were performed as describedby Benzie and Strain (1996), using a 96-well ThermoMax microplatespectrophotometer (Molecular Devices, Foster City, Calif., U.S.A.)to measure the formation of ferrous-TPTZ complex (�max = 595 nm).FRAP measures the extract ability to reduce ferric ion (Fe3+) to fer-rous ion (Fe2+) in a solution of TPTZ prepared in sodium acetate atpH 3.6. Absorbance was measured at 595 nm. ORAC assays fol-lowed the method described by Cao and others (1993), with thealteration of using a 96-well cytofluor 4000 microplate fluorometer(PerSeptive Biosystems, Framingham, Mass., U.S.A.), which record-ed rate and duration of fluorescence. �-Phycoerythrin acted as tar-get for the peroxyl radicals generated by AAPH (a peroxyl radicalgenerator that destroys the fluorescence). Samples were monitoredat 2-min intervals, for 2 h, at 485 nm (excitation wavelength) and585 nm (emission wavelength). FRAP and ORAC values were ex-pressed as �mol of Trolox (a water-soluble tocopherol analogue)equivalents/g of sample.
Anthocyanin and polyphenolic determinations byHPLC-DAD
Analytical HPLC system. Anthocyanins were separated by re-versed-phase HPLC using a Hewlett-Packard 1090 (Agilent Tech-nologies Inc, Wilmington, Del., U.S.A.) equipped with a photodiodearray detector (DAD). Absorbance spectra were recorded for allpeaks. Flow rate was 1 mL/min.
Anthocyanins. A Prodigy 5 �m ODS (3) 100 Å (250 � 4.6 mm) col-umn, fitted with 4.0 � 3.0-mm inner dia guard column, from Phe-nomenex (Torrance, Calif., U.S.A.) was used. Solvent A was 100%acetonitrile. Solvent B was 10% (v/v) acetic acid and 1% (v/v) phos-phoric acid in water. The program used a linear gradient from 2% to20% solvent A in 25 min; then a linear gradient of solvent A from 20%to 40% in 5 min, with simultaneous detection at 280, 320, and 520nm (Durst and Wrolstad 2001). Injection volume was 20 �L. Columntemperature was maintained at 40 °C. Samples were filtered beforeHPLC injection.
Polyphenolics. A Synergi 4 �m Hydro-RP 80 Å (250 � 4.6 mm)column, fitted with a 4.0 � 3.0-mm inner dia guard column, fromPhenomenex was used. Solvent A was 100% acetonitrile. Solvent Bwas 1% (v/v) formic acid in water. All solvents used were HPLCgrade. The program used a linear gradient from 5% to 25% solventA in 50 min, then a linear gradient of solvent A from 25% to 50% in5 min, then held for 5 min, with simultaneous detection at 260, 280,320, and 520 nm. Injection volume was 100 �L.
Electrospray mass spectroscopy of anthocyaninsAnalysis was performed using a Perkin-Elmer SCIEX API III +
mass spectrometer (Toronto, Canada), equipped with an Ion Spraysource and loop injection. Purified and filtered blueberry anthocy-anins (5 �L), in acidified water, were injected directly into the sys-tem.
LC-DAD-MS of anthocyaninsA Hewlett-Packard 1090 HPLC (Agilent Technologies Inc.),
equipped with a photodiode array detector (DAD) and mass spec-trometer (MS) was used to confirm the identification of the blue-berry anthocyanins. A Synergi 4 �m Hydro-RP 80 Å (250 � 2 mm)column, fitted with 4.0 � 3.0-mm inner dia guard column from Phe-nomenex was used. Absorbance spectra were collected for allpeaks. Flow rate was 0.2 mL/min and injection volume was 20 �L.Solvent A was 5% formic acid and 80% acetonitrile (v/v), and solventB was 5% formic acid. All solvents were HPLC grade. The initial sol-vent composition was 10% solvent A and 90% solvent B; then a lin-ear gradient of 10% to 30% solvent A, and 90% to 70% solvent B in30 min. Detection occurred simultaneously at 280, 320, and 520nm. MS analysis was performed using a Perkin-Elmer SCIEX API IIIPlus triple-quadrupole mass spectrometer equipped with an ionspray source (ISV = 5500, orifice voltage = 50) and positive ionmode. LC-DAD-MS-MS was conducted on some of the peaks ob-served. Multiple reaction monitoring mode was used. The mass ofthe molecular ions (anthocyanins) of interest was scanned in 1stquadrupole (Q1) and the daughter ions (also known as fragmentedions, anthocyanidins) were monitored in 3rd quadrupole (Q3). Ar-gon was used as the collision gas. The nebulizer gas and orificecurtain gas were nitrogen. Mass spectra data were collected withTune 2.5 software, while Mac Spec 3.3 software was used for dataprocessing, both provided by SCIEX (Toronto, Canada).
Statistical analysesSPSS (Chicago, Ill., U.S.A.) version 11.0 was used for the statisti-
cal analyses. Differences among enzyme treatment means weretested using 1-way analysis of variances (ANOVA) and the TukeyHonest Significant Difference (HSD) at � = 0.05 level. ANOVA wasconducted on the results for the extraction treatments and TukeyHSD was also conducted.
Results and Discussion
Anthocyanins, phenolics, and antioxidant propertiesof blueberries and their subfractions
The distribution of ACY, TP, FRAP, and ORAC of whole berries andin their skins, flesh, and seeds are shown in Table 3. The skins per-centage by weight (19.0%) would be expected to be higher for‘Rubel’ blueberries than for other commercially grown highbushcultivars because it has a smaller berry size (Ehlenfeldt and Prior2001; Moyer and others 2002). Blueberry seeds are small and rep-resent a relatively small portion of the berry (1.5%). In determiningthe weight percentage of the 3 fractions, there was a 5.1% loss fromconducting the manual separating operations. The high antioxi-dant capacity of whole blueberries has been highly correlated totheir anthocyanin and total phenolic contents (Kalt and Dufour1997; Prior and others 1998; Kalt and others 2000). The anthocya-nins exist almost exclusively in the skin, whereas phenolics andantioxidant properties are mostly in the skins. By extracting onlyfrom the skins, there is the potential for producing extracts withvery high anthocyanin and polyphenolic concentrations.
Results are expressed on a per 100 g or per gram basis and alsoarithmetically converted to show the amounts in skin, seeds, andflesh for a 100-g berry sample. For example, the skins contained 994mg ACY/100 g skin, which represents 188 mg in a 100-g berry sam-ple (994 �19%). This permits comparison with whole berries andestimation of losses. There was a 16% loss in ACY and a 43% loss inTP when comparing with values for whole berries. We suspect thatthe high loss of phenolics was because of enzymatic oxidation occur-ring during the manual separating and weighing operations. There

Vol. 69, Nr. 7, 2004—JOURNAL OF FOOD SCIENCE C567URLs and E-mail addresses are active links at www.ift.org
C: Fo
od Ch
emist
ry &
Toxico
logy
Blueberry processing . . .
were no reports in the literature on the composition of blueberryseeds, but the antioxidant properties were substantially lowerthan what has been reported for grape seeds (Pastrana-Bonilla andothers 2003).
Evaluation of juice-processing enzymesWith the intent of using juice-processing enzymes to increase
recovery of anthocyanins and polyphenolics from juice-processingwastes, we developed a screening assay using either whole berriesor skins as substrate. Requests were made to enzyme suppliers and9 enzyme preparations were provided for evaluation. Two of thesamples were experimental samples, but the others are availablecommercially. The characteristics of the enzymes regarding pecti-nase, cellulase, cellobiase, and hemicellulase activity are shown inTable 1. The ACY, TP, and polymeric color percentage results for theenzyme-treated samples are summarized in Table 4.
The amount of anthocyanin and phenolics extracted from thewhole berries by enzymes ranged from 20.5 to 28.1 mg ACY, and82.9 to 101.0 mg TP per 100 g extract (Table 4). The control (no en-zyme addition) actually gave the highest yield of anthocyanin andphenolics. Enzyme 8 (pectinase and hemicellulase activities) per-formed as well as the control for extracting ACY. Enzyme 6 (pecti-nase, cellulase, and cellobiase) extracted the least ACY and TP fromthe berries. Although the control yielded the highest amount of TP,enzymes 3, 4, 7, and 8 (all containing cellulase or hemicellulaseactivity) were equivalent in the extraction of TP. The percent poly-meric color, which is an index for anthocyanin degradation, washighly variable and ranged from 40.9% (enzyme 1) to 73.4% (con-trol). Surprisingly, the control, which had the highest anthocyaninrecovery, also yielded the highest polymeric color percentage. En-zyme 1 produced the least amount of polymeric color percentage,and all enzymes, except enzyme 3 (only cellulase activity) yieldedsignificantly less polymeric color percentage compared with thecontrol. Depectinization with pectolytic enzymes remains an essen-tial unit operation for producing blueberry juice and juice concen-trates. So juice-processing enzymes are required even if they do notgive increased recovery of anthocyanins and polyphenolics.
ACY and TP for the different enzyme treatments to skins rangedfrom 100.4 to 137.9 mg of ACY, and 232.2 to 278.5 mg of TP per 100g extract. There were also differences between berries and skinswhen making comparisons to the control. Enzyme 7 (pectinase andcellulase activities) had the highest ACY, TP, and polymeric colorpercentage values. Enzymes 1, 6, 9, and control were equivalent toenzyme 7 in their ability to extract ACY. Enzymes 1, 2, 4, 6, 9, andcontrol were equivalent to enzyme 7 in extracting TP from skins.The percent polymeric color yield ranged from 28.5% to 36.3%,
which was not as variable as polymeric percentage values obtainedfrom whole berries. Enzyme 1 (unknown experimental enzyme)produced the least amount of polymeric color percentage. Loweramounts of polymeric color percentage from skins processed withextracts might be explained by the absence of blueberry pulp(source of endogenous enzymes and chlorogenic acid). Skrede andothers (2000) demonstrated that adding unblanched blueberrypulp to pasteurized juice increased anthocyanin degradation sig-nificantly. Blueberry anthocyanins have been found to degraderapidly in the presence of chlorogenic acid and polyphenoloxidase(PPO) but not by PPO alone (Kader and others 1997, 1998).
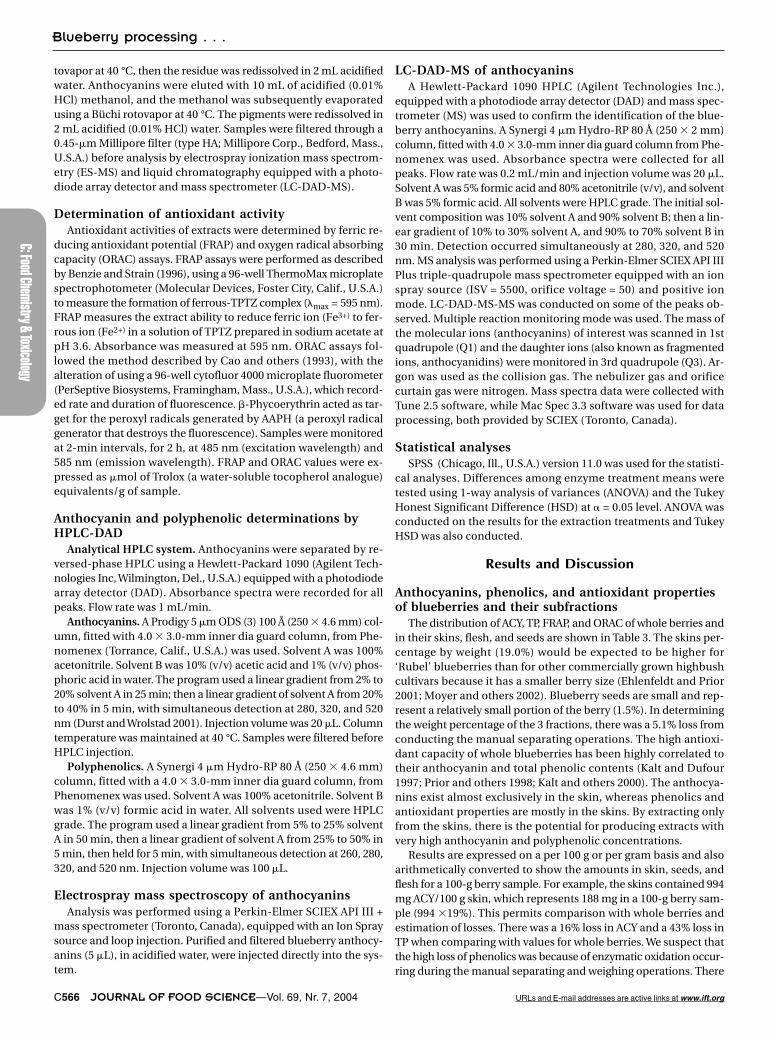
Delphinidin-glycosides (based on its structure, delphinidin isthe most labile) were degraded the most, and malvidin-glycosidesappear to have degraded the least by processing enzyme treat-ments (Figure 1c), especially when the starting material was wholeberries, which implied that the native enzymes present in the blue-berry destroyed anthocyanin (Skrede and others 2000).
Landbo and Meyers (2001) tested 5 different processing en-zymes (the enzymes had pectinase, macerase, or protease activity)with varying degrees of extraction efficiency from black currantpresscake residue. Enzyme-assisted extractions yielded morepolyphenolics, but were not found to increase anthocyanins whencompared with a control (no addition of enzyme). Particle size hasshown to influence the amount of phytochemicals extractable fromblack currant pomace, where a reduction in particle size increased
Table 3—Percent weight distribution, total monomeric anthocyanin (ACY), total phenolics (TP), ferric reducing antioxi-dant power (FRAP), and oxygen radical absorbing capacity (ORAC) of whole ‘Rubel’ berries and their fractions
Weightdistribution Berry basis Fraction basis
(% weight) ACYa TPb FRAPc ORACd ACYa TPb FRAPc ORACd
Whole berry 100.0 230.0 737.5 39.9 30.7 — — — —Skins 19.0 188.5 300.4 28.7 18.0 993.8 1583.8 151.3 94.9Flesh 74.4 5.8 119.3 7.0 6.3 7.9 160.4 9.5 8.5Seeds 1.5 0.1 4.3 0.3 0.1 7.8 285.6 20.5 9.8Total - 194.5 424.1 36.1 24.5 — — — —% loss 5.1 15.5 42.5 9.7 20.4 — — — —aACY was expressed as cyanidin-3-glucoside equivalents (mg/100 g of berries, 100 g of skins, 100 g of flesh, or 100 g of seeds).bTP was expressed as gallic acid equivalents (mg/100 g of berries, 100 g of skins, 100 g of flesh, or 100 g of seeds).cFRAP was expressed as Trolox equivalents (�mol/1 g of berries, 1 g of skins, 1 g of flesh, or 1 g of seeds).dORAC was expressed as Trolox equivalents (�mol/1 g of berries, 1 g of skins, 1 g of flesh, or 1 g of seeds).
Table 4—Results from the industry-recommended enzymes(n = 9) in extracting total anthocyanins (ACY), total pheno-lics (TP), and polymeric color percentage (%PC) from wholeberries and skins (100 g of extract)a
Whole berries Skins
Enzymes ACYb TPc %PC ACYb TPc %PC
E1 27.1ab 88.7abc 40.9a 128.2bc 264.8abc 28.5aE2 24.9ab 87.6ab 41.8ab 109.0ab 251.9abc 32.2abE3 27.2ab 101.0cd 67.6cd 101.4a 235.6ab 35.8abE4 23.7ab 90.4abcd 45.0ab 109.9ab 242.9abc 33.7abE5 23.5ab 87.9ab 45.5ab 100.4a 232.2a 32.5abE6 20.5a 82.9a 49.9b 127.1bc 268.3abc 31.6abE7 26.7ab 91.7abcd 43.9ab 137.9c 278.5c 36.3bE8 28.1b 98.3bcd 61.6c 106.5ab 234.5a 35.2abE9 23.2ab 85.9ab 44.9ab 136.7c 276.1bc 35.7abControl 28.3b 103.3d 73.4d 113.3abc 248.6abc 32.3abaValues in each column sharing the same superscript are not significantlydifferent from each other (Tukey’s HSD, P � 0.05).bTotal anthocyanin was expressed as cyanidin-3-glucoside equivalents.cTotal phenolics was expressed as gallic acid equivalents.
C568 JOURNAL OF FOOD SCIENCE—Vol. 69, Nr. 7, 2004 URLs and E-mail addresses are active links at www.ift.org
C: Food Chemistry & Toxicology
Blueberry processing . . .
the amount extracted. Also, Stanley and Miller (2001) showed finemilling was more influential than the use of commercial enzymes orheating in extraction of phytochemicals from blueberry juice–pro-cessing waste. Meyer and others (1998) tested pectinase and cellu-lase in phenolic extraction of grape pomace and found that pecti-nase had positive effects, but that cellulase had a negative effectin the extraction of polyphenolics. The benefit of pectinase wascorrelated with plant cell wall breakdown from the enzymes (Meyerand others 1998). Some commercial juice-processing enzymes haveshown negative effects on the anthocyanin content (color loss) ofcranberry juice because of �-galactosidase activity (Wrolstad andothers 1994; Wightman and Wrolstad 1995). In this study, the en-zymes used did not exhibit side activities, such as �-galactosidaseactivity and/or �-glucosidase activity, because the enzyme sideactivities are specific (Wrolstad and others 1994). There was noclear evidence of decrease in �-galactosides and �-glucosides fromthe proportions of individual anthocyanin profiles (Figure 1).
Extraction experimentsIn the United States, the legal definitions of fruit juices and fruit
juice concentrates require that juice be extracted by physical meth-ods and/or aqueous extraction (Title 21, U.S. Code of Federal Reg-ulations 73). Thus, anthocyanin-based colorants under the classi-fication of fruit and vegetable juices cannot be extracted withorganic solvents. For this reason, the use of ethanol (or other organ-ic solvents) was not included in this investigation. Previously, weshowed that high-temperature-short-time treatment and SO2 couldincrease anthocyanin recovery when blueberries were processedinto juice and concentrate (Lee and others 2002). Also, anthocya-nins were more stable in acidic conditions (Wrolstad 2000), and Kaltand others (2000) showed that blueberry juice contained more an-thocyanins, phenolics, and antioxidant activity at lower pH, so ad-dition of citric acid might increase pigment recovery. In this exper-iment, the addition of 50 and 100 ppm SO2, the addition of 1% citricacid, and extraction temperatures of 50 °C and 80 °C were testedindividually and in combination (Table 5). ACY and TP concentra-tions for the different treatments are shown in Table 5, and statis-tical results are shown in Table 6 and 7. Abbreviations of the treat-ments are provided (Table 1).
ACY extracted from whole berries ranged from 27.5 mg/100 g to102.2 mg/100 g and TP from 55.9 mg/100 g to 684.3 mg/100 g extract(Table 5). The pH of the extracts ranged from 2.8 to 3.9. Addition of
citric acid lowered the pH of the extract by 0.5 to 1.1 units. The ad-dition of SO2 did not alter the pH of the extracts significantly. Extrac-tion of both ACY and TP contents of samples cannot be explainedby main effects alone, namely, heat (H), SO2 (S), or citric acid levels(C). There was no significant evidence for H � S � C effect (3-wayinteraction), or C � H effect (2-way interaction) for ACY content(Table 6). The effect of heat changed with a change in SO2 level.Higher levels of both heat and SO2 increased the extraction of ACYfrom whole berries. As an increase in extraction temperature in-creases the rate of diffusion (Cacace and Mazza 2002), in this caseit increased the extraction of anthocyanins. Elevated extractiontemperature also aids in the breakdown of blueberry tissue, open-ing up cells, further increasing the yield of anthocyanin within theextract. Cacace and Mazza (2002) speculated that one explanationfor increased anthocyanin extraction by the addition of SO2 is thatthe added SO2 reduced the dielectric constant of water and in-creased the solubility of phenolics, but the extact mechanism isunknown. Native enzymes present in the blueberry, which degradephenolics, are inhibited by increased extraction temperature (Skre-de and others 2000) and SO2 addition (Sapers 1993). Also, the effectof SO2 addition changes with the level of citric acid. Addition of cit-ric acid aided in extracting ACY with 0 and 50 ppm SO2 but de-creased the extraction at 100 ppm SO2. The highest ACY extractswere with treatments H50S50, H80S50, and H80S100, also from
Table 5—Total anthocyanin content, total phenolic content, and pH of the extracts obtained from whole berries andskins from the individual and combination of the heat, SO2, and citric acid treatmentsa
Treatment combinations
Heat levels SO2 levels Citric acid Whole berriesb Skinsb
Trt nrc (°C) (ppm) levels (%) ACY TP pH ACY TP pH
1 50 0 0 27.5 55.9 3.9 102.7 146.9 3.62 50 0 1 42.6 62.6 2.8 156.8 186.2 2.73 80 0 0 50.2 71.4 3.9 151.7 260.4 3.74 80 0 1 62.4 88.8 2.8 220.2 312.2 2.75 50 50 0 92.2 307.3 3.9 462.9 745.2 3.76 50 50 1 96.5 316.4 3.3 469.9 748.5 3.07 80 50 0 97.5 420.6 3.9 401.0 701.9 3.58 80 50 1 102.2 413.8 3.2 373.0 659.3 2.89 50 100 0 90.6 386.0 3.9 494.5 906.9 3.510 50 100 1 82.2 337.5 3.4 504.5 924.1 3.211 80 100 0 92.1 641.0 3.8 409.8 938.8 3.212 80 100 1 91.4 684.3 3.3 446.1 978.3 2.9aTotal anthocyanin content (ACY) expressed as cyanidin-3-glucoside equivalents), total phenolic content (TP) expressed as gallic acid equivalentsb100 g of extract basis.cTrt nr = treatment number.
Table 6—The results from ANOVA tables for the extractionexperimentsa
Whole berries Skins
Effects d.f.b ACY TP ACY TP
Blocks 1 0.001 0.005 0.001 0.001Heat levels (H) 1 0.001 0.001 0.001 0.006SO2 levels (S) 2 0.001 0.001 0.001 0.001Citrate levels (C) 1 0.001 0.515 0.001 0.109H × S 2 0.001 0.001 0.001 0.001S × C 2 0.001 0.530 0.001 0.056C × H 1 0.443 0.012 0.889 0.869H × S × C 2 0.145 0.001 0.154 0.402aTotal anthocyanin content (ACY), expressed as cyanidin-3-glucosideequivalents) and total phenolic content (TP), expressed as gallic acidequivalents)bd.f. = degrees of freedom
Vol. 69, Nr. 7, 2004—JOURNAL OF FOOD SCIENCE C569URLs and E-mail addresses are active links at www.ift.org
C: Fo
od Ch
emist
ry &
Toxico
logy
Blueberry processing . . .
S50C0, S50C1, and S100C0. For TP, there was a significant 3-wayinteraction among the factors. In general, an increase in SO2 addi-tion, and heat levels, yielded higher amounts of TP. A temperatureof 80 °C and 100 ppm of free SO2 (H50S100C0 and H50S100C1)extracted the most TP. The addition of 1% citric acid aided in theextraction of TP at low temperature and when SO2 was not added.The control had the lowest amount of ACY and TP (Table 7).
ACY extracted from the skins ranged from 102.7 mg/100 g to 504.5mg/100 g, and TP from 146.9 mg/100 g to 978.3 mg/100 g extract(Table 5). The pH of the extracts ranged from 2.7 to 3.7. Addition ofcitric acid lowered the extract pH values in all cases. Again, the ex-traction of ACY and TP from skins cannot be explained by the maineffects alone (Table 6) because there were interactions that weresignificantly different. There were no significantly different 3-wayinteractions and C � H effect for ACY content. From the H � S ef-fect, combination of heat and addition of SO2 assisted in the extrac-tion of ACY from the skins when compared with low heat and no SO2
addition. Low heat (50 °C) and addition of 50 ppm or 100 ppm ofSO2 (H50S50C0, H50S50C1, H50S100C0, and H50S100C1) yieldedthe highest amount of ACY. Use of high heat aided in extracting TP,when no SO2 and citric acid was used. From the S � C effect, the useof SO2 increased the extraction of ACY when used in combinationwith citric acid addition. Using 100 ppm of SO2 and 1% citric acidyielded the highest ACY content from the skins. From the TP re-sults, there was a significant interaction between heat and SO2. TPvalues of the skins treated with the 2 different levels of citric acidwere not significantly different. Higher heat aided the extraction ofTP at 0 ppm of SO2, but not when 50 ppm or 100 ppm of SO2 wasadded. High heat (80 °C) and addition of citric acid (H80S0C1) waseffective in extracting ACY when no SO2 was added to the skins.High-sulfured water (H50S100 and H80S100) extracted the highest
amount of TP from the skins. Control had the lowest amount of ACYand TP.
Although whole berries and blueberry skins were used in theseexperiments, the extraction conditions should also apply to juice-processing waste products such as presscake residue. Processingwaste obtained by a local processor was analyzed for ACY and TPcontent. Puree waste was high in ACY (96.9 mg/100 g) and TP(540.7 mg/100 g). Puree stock contained 47.2 mg of ACY/100 g ofstock, and 223.1 mg of TP/100 g. Puree waste appeared to be a goodsource for further extraction.
During the early 1960s, a combination of heat treatment (62 °C)and pectinase before pressing had been reported to be effective inblueberry juice processing for improving yield, color, and solublesolids (Fuleki and Hope 1964). Whole berries and skins were extract-ed a single time in this study. Because the residual appears to stillretain pigment, multiple extractions of the residual might increasethe final ACY and TP yield. Bakker and others (1998) reported anincrease in anthocyanin extraction with the increase in total SO2
addition (0, 75, and 150 ppm) to must. They also reported no no-ticeable effect on the aroma and taste of the final wine produced.Bocevska and Stevcevska (1997) have demonstrated boosting SO2
Table 7—The results of the effect of heat, SO2, and citricacid from 2-way or 3-way Tukey HDSa
Whole berries Skins
Levels ACY TP ACY TP
H � S H50S0 35.0a — 129.8a 166.6a effect H80S0 56.3b — 185.9a 286.3b
H50S50 93.3cd — 466.4cd 746.9cH80S50 99.9d — 387.0b 680.6cH50S100 86.4c — 499.5d 915.6dH80S100 91.7cd — 428.0bc 958.6d
S � C S0C0 38.9a — 127.2a * effect S0C1 52.5b — 188.5a *
S50C0 94.8cd — 432.0b *S50C1 99.4d — 421.4b *S100C0 94.8cd — 452.1b *S100C1 86.8c — 475.3b *
H � S � C H50S0C0 * 55.9a * * effect H50S0C1 * 62.6a * *
H80S0C0 * 71.4a * *H80S0C1 * 88.8a * *H50S50C0 * 307.3b * *H50S50C1 * 316.4b * *H80S50C0 * 420.6c * *H80S50C1 * 413.8c * *H50S100C0 * 386.0c * *H50S100C1 * 337.5b * *H80S100C0 * 641.0d * *H80S100C1 * 684.3d * *
aValues in each column sharing the same letter are not significantly differentfrom each other (Tukey’s HSD, P < 0.05). * = not significantly different; —= not applicable. ACY = total anthocyanin content; TP = total phenoliccontent.
Figure 1—Liquid chromatography equipped with a photo-diode array detector (LC-DAD) profiles of anthocyanin:whole berry (a), whole berry processed as control (b), wholeberry processed with enzyme 6 (c), skin (d), skin processedwith control (e), and skin processed with enzyme 6 (f). Cor-responding anthocyanin peak assignments and peak areapercentages (values in parentheses) for chromatogram (d).Corresponding anthocyanin peak assignments are as fol-lows: 1 = delphinidin-3-galactoside (12.8), 2 = delphinidin-3-glucoside (4.4), 3 = delphinidin-3-arabinoside (8.4),4 = cyanidin-3-galactoside (2.0), 5 = cyanidin-3-glucoside(0.9), 6 = petunidin-3-galactoside (5.3), 7 = cyanidin-3-ara-binoside (1.1), 8 = petunidin-3-glucoside (4.8), 9 = petunidin-3-arabinoside (4.6), 10 = peonidin-3-galactoside (1.0),11 = malvidin-3-galactoside (27.8), 12 = malvidin-3-gluco-side (13.9), and 13 = malvidin-3-arabinoside (13.0).
C570 JOURNAL OF FOOD SCIENCE—Vol. 69, Nr. 7, 2004 URLs and E-mail addresses are active links at www.ift.org
C: Food Chemistry & Toxicology
Blueberry processing . . .
addition (500 to 5000 ppm of total SO2) increased the extract purityobtained from wine grape pomace. Cacace and Mazza (2002, 2003)have conducted an intensive study of extracting phytochemicals,such as anthocyanins and polyphenolics, from black currants usingsulfured water (28 to 1372 ppm of SO2), aqueous ethanol (39% to95% ethanol in water), and heat (6 °C to 74 °C). They recommendedthat 19 L of ethanol per kg milled frozen berries, 1000 to 1200 ppmof SO2 (they did not indicate whether these values were total or freeSO2), and an extraction temperature of 30 °C to 35 °C. Sixty percentaqueous ethanol yielded the most total phenolics but had littleeffect on the anthocyanin content of the extract.
Free SO2 concentrations of 0, 50, and100 ppm were selected forthis study because previous work (Lee and others 2002) showedthat after pasteurization, the amount of total SO2 left in the prod-uct was less than 10 ppm. The minimum level of total SO2 for label-ing is 10 ppm (Title 21, U.S. Code of Federal Regulations 101.100).Recently, researchers have demonstrated that steam-blanchingblueberries for 3 min increased the recovery of anthocyanins andcinnamic acids (Rossi and others 2003). From this study, a combina-tion of heating and SO2 will increase the yield of phytochemicalsfrom whole blueberry fruit and from their process by-products.
Anthocyanin profile of ‘Rubel’ skins and seedsThe anthocyanin pigment profile of ‘Rubel’ blueberry skins
obtained from the LC-DAD is shown in Figure 1d. Thirteen peakswere identified. They contained the glycosides of malvidin (54.7%),delphinidin (25.7%), petunidin (14.7%), cyanidin (3.9%), and pe-onidin (1.0%), based on peak area percentage. The major anthocy-anin present in ‘Rubel’ was malvidin-galactoside (27.8%).
Peak assignments were based on their spectra and retentiontime. Peaks that were present in low quantities were difficult toidentify based on their spectra alone. Using tools such as ES-MS and
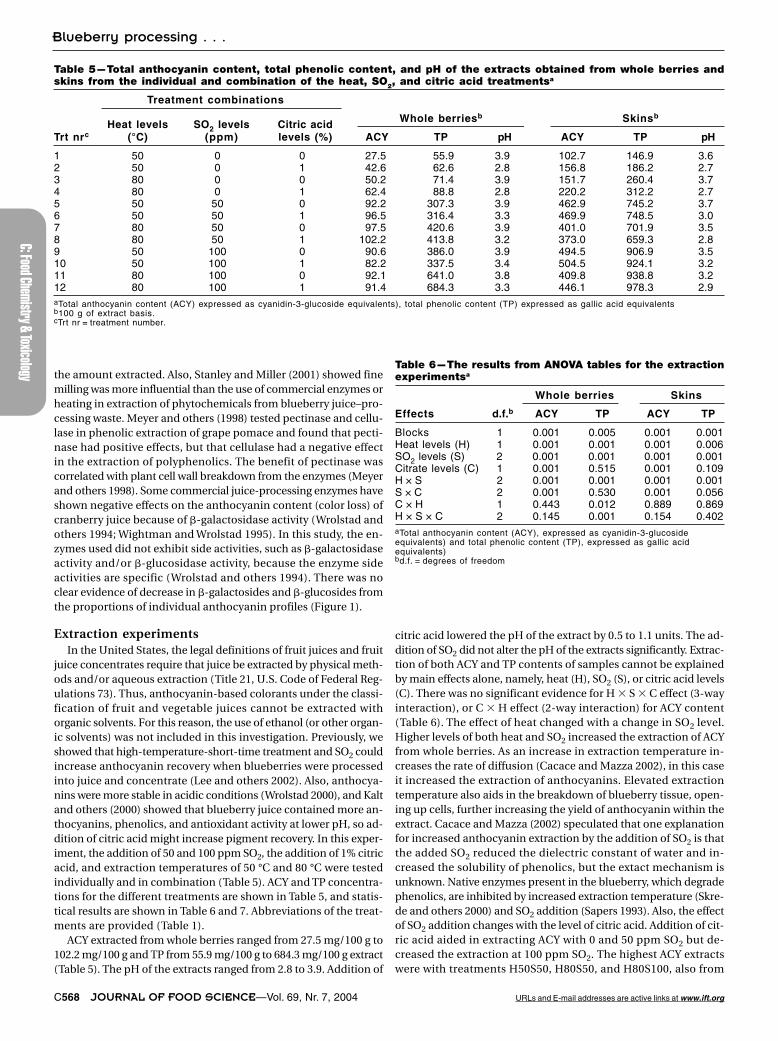
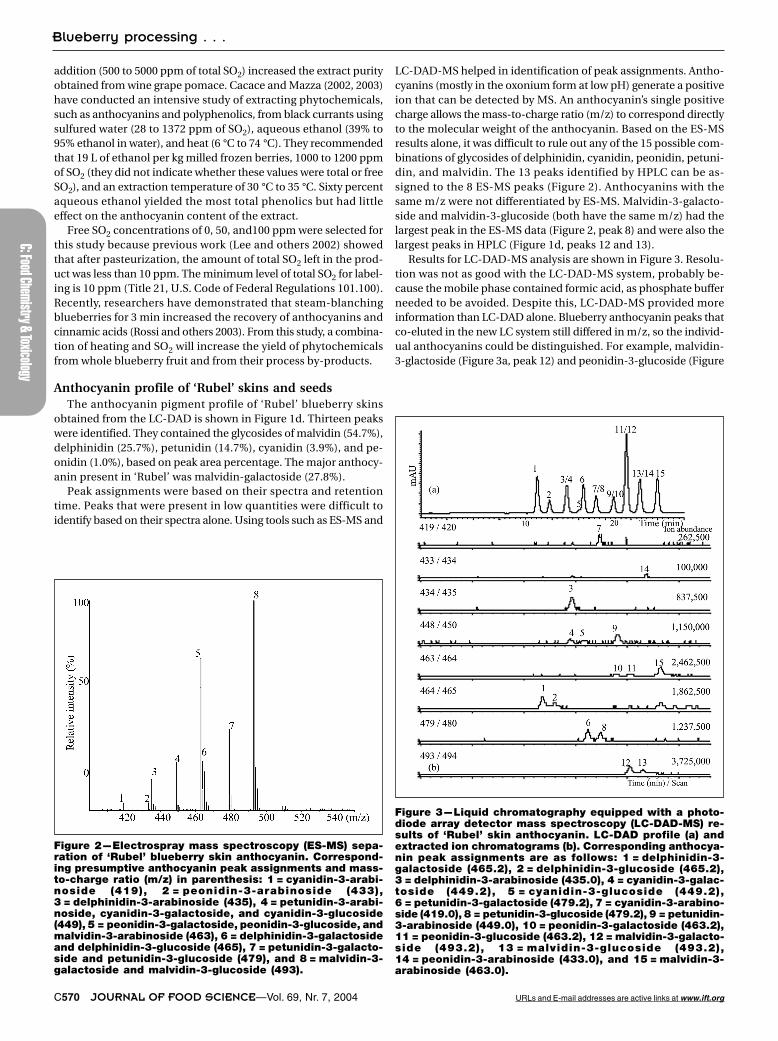
LC-DAD-MS helped in identification of peak assignments. Antho-cyanins (mostly in the oxonium form at low pH) generate a positiveion that can be detected by MS. An anthocyanin’s single positivecharge allows the mass-to-charge ratio (m/z) to correspond directlyto the molecular weight of the anthocyanin. Based on the ES-MSresults alone, it was difficult to rule out any of the 15 possible com-binations of glycosides of delphinidin, cyanidin, peonidin, petuni-din, and malvidin. The 13 peaks identified by HPLC can be as-signed to the 8 ES-MS peaks (Figure 2). Anthocyanins with thesame m/z were not differentiated by ES-MS. Malvidin-3-galacto-side and malvidin-3-glucoside (both have the same m/z) had thelargest peak in the ES-MS data (Figure 2, peak 8) and were also thelargest peaks in HPLC (Figure 1d, peaks 12 and 13).
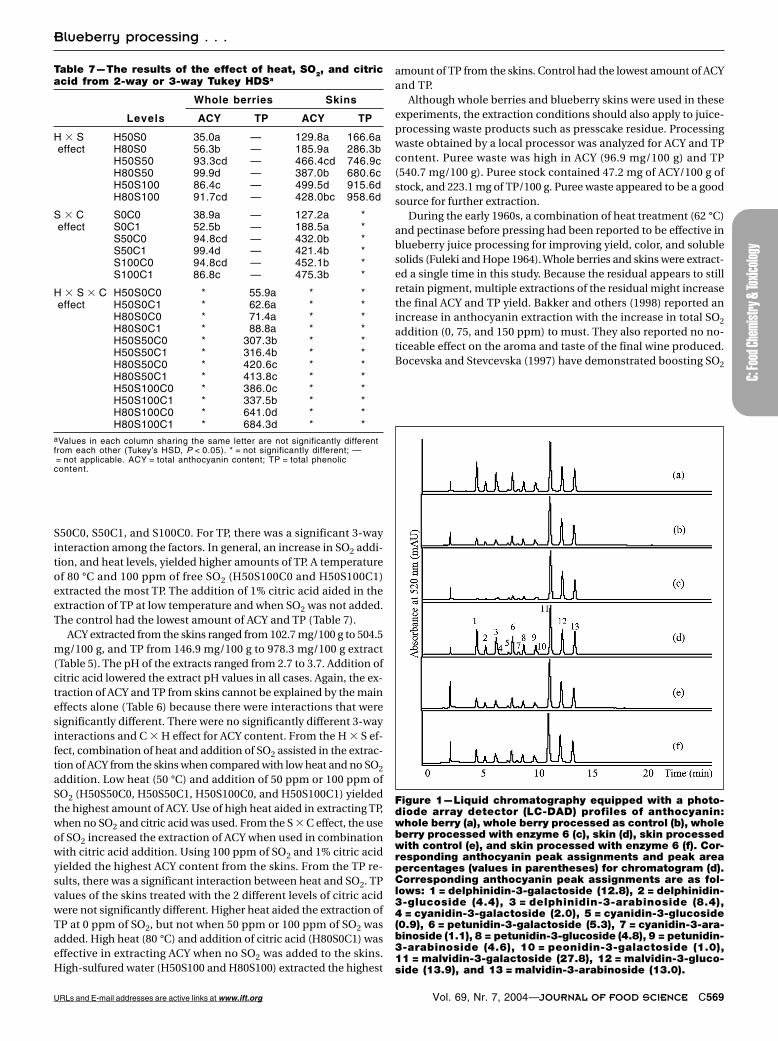
Results for LC-DAD-MS analysis are shown in Figure 3. Resolu-tion was not as good with the LC-DAD-MS system, probably be-cause the mobile phase contained formic acid, as phosphate bufferneeded to be avoided. Despite this, LC-DAD-MS provided moreinformation than LC-DAD alone. Blueberry anthocyanin peaks thatco-eluted in the new LC system still differed in m/z, so the individ-ual anthocyanins could be distinguished. For example, malvidin-3-glactoside (Figure 3a, peak 12) and peonidin-3-glucoside (Figure
Figure 2—Electrospray mass spectroscopy (ES-MS) sepa-ration of ‘Rubel’ blueberry skin anthocyanin. Correspond-ing presumptive anthocyanin peak assignments and mass-to-charge ratio (m/z) in parenthesis: 1 = cyanidin-3-arabi-noside (419), 2 = peonidin-3-arabinoside (433),3 = delphinidin-3-arabinoside (435), 4 = petunidin-3-arabi-noside, cyanidin-3-galactoside, and cyanidin-3-glucoside(449), 5 = peonidin-3-galactoside, peonidin-3-glucoside, andmalvidin-3-arabinoside (463), 6 = delphinidin-3-galactosideand delphinidin-3-glucoside (465), 7 = petunidin-3-galacto-side and petunidin-3-glucoside (479), and 8 = malvidin-3-galactoside and malvidin-3-glucoside (493).
Figure 3—Liquid chromatography equipped with a photo-diode array detector mass spectroscopy (LC-DAD-MS) re-sults of ‘Rubel’ skin anthocyanin. LC-DAD profile (a) andextracted ion chromatograms (b). Corresponding anthocya-nin peak assignments are as follows: 1 = delphinidin-3-galactoside (465.2), 2 = delphinidin-3-glucoside (465.2),3 = delphinidin-3-arabinoside (435.0), 4 = cyanidin-3-galac-toside (449.2), 5 = cyanidin-3-glucoside (449.2),6 = petunidin-3-galactoside (479.2), 7 = cyanidin-3-arabino-side (419.0), 8 = petunidin-3-glucoside (479.2), 9 = petunidin-3-arabinoside (449.0), 10 = peonidin-3-galactoside (463.2),11 = peonidin-3-glucoside (463.2), 12 = malvidin-3-galacto-side (493.2), 13 = malvidin-3-glucoside (493.2),14 = peonidin-3-arabinoside (433.0), and 15 = malvidin-3-arabinoside (463.0).
Vol. 69, Nr. 7, 2004—JOURNAL OF FOOD SCIENCE C571URLs and E-mail addresses are active links at www.ift.org
C: Fo
od Ch
emist
ry &
Toxico
logy
Blueberry processing . . .
3a, peak 11) co-eluted. The 2 compounds could be detected, how-ever, with MS. From the LC-DAD-MS results there were a total of 15peaks in ‘Rubel’ skins. There was a low concentration of peonidin-3-arabinoside in ‘Rubel’ skins, which made identification based onretention time and spectra difficult. LC-DAD-MS permitted posi-tive identification of ‘Rubel’ skin anthocyanins. By using a combi-nation of retention time, peak spectra, and m/z, identification ofanthocyanins was simplified. LC-DAD-MS-MS was also performedon some peaks that co-eluted and were present in low concentra-tions on the LC-DAD-MS system (peaks 3/4 and 11/12 in Figure 3).The m/z of the corresponding molecular ion � fragmented ion were435.0 � 303.0 (delphinidin-arabinoside, peak 3 in Figure 3), 449.2� 287.0 (cyanidin-galactoside, peak 4 in Figure 3), 463.2 � 301.0(peonidin-glucoside, peak 11 in Figure 3), and 493.2 � 331.0 (mal-vidin-galactoside, peak 12 in Figure 3).
The anthocyanin profile for whole berries was the same for skinalone (Figure 1a and 1d), which was expected because the antho-cyanins exist almost exclusively in the skins. The extracts of fleshand seeds were slightly different, having proportionately less del-phinidin-glycosides. We believe this difference can be attributed todifferences in seed anthocyanins because pigments in the fleshprobably diffused from the skin.
Blueberry puree–waste extracts had a similar anthocyanin HPLCprofile as the stock, but the anthocyanin profiles for the industrialjuice–processing wastes differed slightly in that the proportions ofdelphinidin, petunidin, and malvidin glucosides decreased when
compared with the stock, which might be because of processingenzyme side activity (such as glucosidase activity).
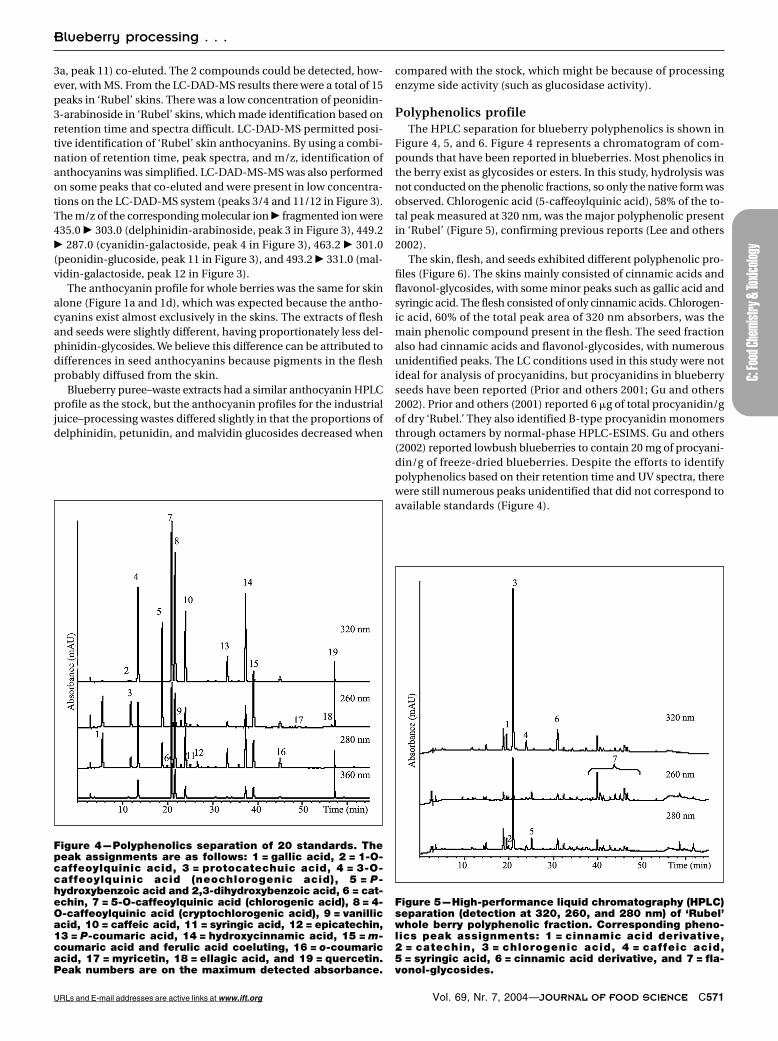
Polyphenolics profileThe HPLC separation for blueberry polyphenolics is shown in
Figure 4, 5, and 6. Figure 4 represents a chromatogram of com-pounds that have been reported in blueberries. Most phenolics inthe berry exist as glycosides or esters. In this study, hydrolysis wasnot conducted on the phenolic fractions, so only the native form wasobserved. Chlorogenic acid (5-caffeoylquinic acid), 58% of the to-tal peak measured at 320 nm, was the major polyphenolic presentin ‘Rubel’ (Figure 5), confirming previous reports (Lee and others2002).
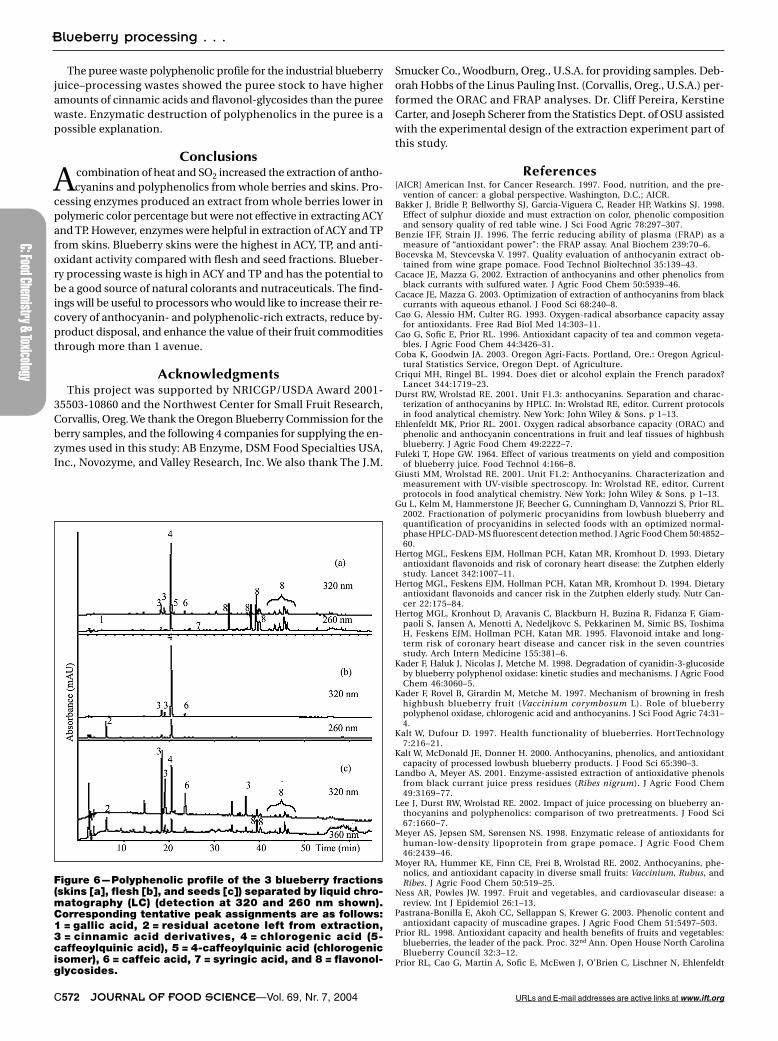
The skin, flesh, and seeds exhibited different polyphenolic pro-files (Figure 6). The skins mainly consisted of cinnamic acids andflavonol-glycosides, with some minor peaks such as gallic acid andsyringic acid. The flesh consisted of only cinnamic acids. Chlorogen-ic acid, 60% of the total peak area of 320 nm absorbers, was themain phenolic compound present in the flesh. The seed fractionalso had cinnamic acids and flavonol-glycosides, with numerousunidentified peaks. The LC conditions used in this study were notideal for analysis of procyanidins, but procyanidins in blueberryseeds have been reported (Prior and others 2001; Gu and others2002). Prior and others (2001) reported 6 �g of total procyanidin/gof dry ‘Rubel.’ They also identified B-type procyanidin monomersthrough octamers by normal-phase HPLC-ESIMS. Gu and others(2002) reported lowbush blueberries to contain 20 mg of procyani-din/g of freeze-dried blueberries. Despite the efforts to identifypolyphenolics based on their retention time and UV spectra, therewere still numerous peaks unidentified that did not correspond toavailable standards (Figure 4).
Figure 4—Polyphenolics separation of 20 standards. Thepeak assignments are as follows: 1 = gallic acid, 2 = 1-O-caffeoylquinic acid, 3 = protocatechuic acid, 4 = 3-O-caffeoylquinic acid (neochlorogenic acid), 5 = P-hydroxybenzoic acid and 2,3-dihydroxybenzoic acid, 6 = cat-echin, 7 = 5-O-caffeoylquinic acid (chlorogenic acid), 8 = 4-O-caffeoylquinic acid (cryptochlorogenic acid), 9 = vanillicacid, 10 = caffeic acid, 11 = syringic acid, 12 = epicatechin,13 = P-coumaric acid, 14 = hydroxycinnamic acid, 15 = m-coumaric acid and ferulic acid coeluting, 16 = o-coumaricacid, 17 = myricetin, 18 = ellagic acid, and 19 = quercetin.Peak numbers are on the maximum detected absorbance.
Figure 5—High-performance liquid chromatography (HPLC)separation (detection at 320, 260, and 280 nm) of ‘Rubel’whole berry polyphenolic fraction. Corresponding pheno-lics peak assignments: 1 = cinnamic acid derivative,2 = catechin, 3 = chlorogenic acid, 4 = caffeic acid,5 = syringic acid, 6 = cinnamic acid derivative, and 7 = fla-vonol-glycosides.
C572 JOURNAL OF FOOD SCIENCE—Vol. 69, Nr. 7, 2004 URLs and E-mail addresses are active links at www.ift.org
C: Food Chemistry & Toxicology
Blueberry processing . . .
The puree waste polyphenolic profile for the industrial blueberryjuice–processing wastes showed the puree stock to have higheramounts of cinnamic acids and flavonol-glycosides than the pureewaste. Enzymatic destruction of polyphenolics in the puree is apossible explanation.
Conclusions
A combination of heat and SO2 increased the extraction of antho-cyanins and polyphenolics from whole berries and skins. Pro-
cessing enzymes produced an extract from whole berries lower inpolymeric color percentage but were not effective in extracting ACYand TP. However, enzymes were helpful in extraction of ACY and TPfrom skins. Blueberry skins were the highest in ACY, TP, and anti-oxidant activity compared with flesh and seed fractions. Blueber-ry processing waste is high in ACY and TP and has the potential tobe a good source of natural colorants and nutraceuticals. The find-ings will be useful to processors who would like to increase their re-covery of anthocyanin- and polyphenolic-rich extracts, reduce by-product disposal, and enhance the value of their fruit commoditiesthrough more than 1 avenue.
AcknowledgmentsThis project was supported by NRICGP/USDA Award 2001-
35503-10860 and the Northwest Center for Small Fruit Research,Corvallis, Oreg. We thank the Oregon Blueberry Commission for theberry samples, and the following 4 companies for supplying the en-zymes used in this study: AB Enzyme, DSM Food Specialties USA,Inc., Novozyme, and Valley Research, Inc. We also thank The J.M.
Figure 6—Polyphenolic profile of the 3 blueberry fractions(skins [a], flesh [b], and seeds [c]) separated by liquid chro-matography (LC) (detection at 320 and 260 nm shown).Corresponding tentative peak assignments are as follows:1 = gallic acid, 2 = residual acetone left from extraction,3 = cinnamic acid derivatives, 4 = chlorogenic acid (5-caffeoylquinic acid), 5 = 4-caffeoylquinic acid (chlorogenicisomer), 6 = caffeic acid, 7 = syringic acid, and 8 = flavonol-glycosides.
Smucker Co., Woodburn, Oreg., U.S.A. for providing samples. Deb-orah Hobbs of the Linus Pauling Inst. (Corvallis, Oreg., U.S.A.) per-formed the ORAC and FRAP analyses. Dr. Cliff Pereira, KerstineCarter, and Joseph Scherer from the Statistics Dept. of OSU assistedwith the experimental design of the extraction experiment part ofthis study.
References[AICR] American Inst. for Cancer Research. 1997. Food, nutrition, and the pre-
vention of cancer: a global perspective. Washington, D.C.; AICR.Bakker J, Bridle P, Bellworthy SJ, Garcia-Viguera C, Reader HP, Watkins SJ. 1998.
Effect of sulphur dioxide and must extraction on color, phenolic compositionand sensory quality of red table wine. J Sci Food Agric 78:297–307.
Benzie IFF, Strain JJ. 1996. The ferric reducing ability of plasma (FRAP) as ameasure of “antioxidant power”: the FRAP assay. Anal Biochem 239:70–6.
Bocevska M, Stevcevska V. 1997. Quality evaluation of anthocyanin extract ob-tained from wine grape pomace. Food Technol Bioltechnol 35:139–43.
Cacace JE, Mazza G. 2002. Extraction of anthocyanins and other phenolics fromblack currants with sulfured water. J Agric Food Chem 50:5939–46.
Cacace JE, Mazza G. 2003. Optimization of extraction of anthocyanins from blackcurrants with aqueous ethanol. J Food Sci 68:240–8.
Cao G, Alessio HM, Culter RG. 1993. Oxygen-radical absorbance capacity assayfor antioxidants. Free Rad Biol Med 14:303–11.
Cao G, Sofic E, Prior RL. 1996. Antioxidant capacity of tea and common vegeta-bles. J Agric Food Chem 44:3426–31.
Coba K, Goodwin JA. 2003. Oregon Agri-Facts. Portland, Ore.: Oregon Agricul-tural Statistics Service, Oregon Dept. of Agriculture.
Criqui MH, Ringel BL. 1994. Does diet or alcohol explain the French paradox?Lancet 344:1719–23.
Durst RW, Wrolstad RE. 2001. Unit F1.3: anthocyanins. Separation and charac-terization of anthocyanins by HPLC. In: Wrolstad RE, editor. Current protocolsin food analytical chemistry. New York: John Wiley & Sons. p 1–13.
Ehlenfeldt MK, Prior RL. 2001. Oxygen radical absorbance capacity (ORAC) andphenolic and anthocyanin concentrations in fruit and leaf tissues of highbushblueberry. J Agric Food Chem 49:2222–7.
Fuleki T, Hope GW. 1964. Effect of various treatments on yield and compositionof blueberry juice. Food Technol 4:166–8.
Giusti MM, Wrolstad RE. 2001. Unit F1.2: Anthocyanins. Characterization andmeasurement with UV-visible spectroscopy. In: Wrolstad RE, editor. Currentprotocols in food analytical chemistry. New York: John Wiley & Sons. p 1–13.
Gu L, Kelm M, Hammerstone JF, Beecher G, Cunningham D, Vannozzi S, Prior RL.2002. Fractionation of polymeric procyanidins from lowbush blueberry andquantification of procyanidins in selected foods with an optimized normal-phase HPLC-DAD-MS fluorescent detection method. J Agric Food Chem 50:4852–60.
Hertog MGL, Feskens EJM, Hollman PCH, Katan MR, Kromhout D. 1993. Dietaryantioxidant flavonoids and risk of coronary heart disease: the Zutphen elderlystudy. Lancet 342:1007–11.
Hertog MGL, Feskens EJM, Hollman PCH, Katan MR, Kromhout D. 1994. Dietaryantioxidant flavonoids and cancer risk in the Zutphen elderly study. Nutr Can-cer 22:175–84.
Hertog MGL, Kronhout D, Aravanis C, Blackburn H, Buzina R, Fidanza F, Giam-paoli S, Jansen A, Menotti A, Nedeljkovc S, Pekkarinen M, Simic BS, ToshimaH, Feskens EJM, Hollman PCH, Katan MR. 1995. Flavonoid intake and long-term risk of coronary heart disease and cancer risk in the seven countriesstudy. Arch Intern Medicine 155:381–6.
Kader F, Haluk J, Nicolas J, Metche M. 1998. Degradation of cyanidin-3-glucosideby blueberry polyphenol oxidase: kinetic studies and mechanisms. J Agric FoodChem 46:3060–5.
Kader F, Rovel B, Girardin M, Metche M. 1997. Mechanism of browning in freshhighbush blueberry fruit (Vaccinium corymbosum L). Role of blueberrypolyphenol oxidase, chlorogenic acid and anthocyanins. J Sci Food Agric 74:31–4.
Kalt W, Dufour D. 1997. Health functionality of blueberries. HortTechnology7:216–21.
Kalt W, McDonald JE, Donner H. 2000. Anthocyanins, phenolics, and antioxidantcapacity of processed lowbush blueberry products. J Food Sci 65:390–3.
Landbo A, Meyer AS. 2001. Enzyme-assisted extraction of antioxidative phenolsfrom black currant juice press residues (Ribes nigrum). J Agric Food Chem49:3169–77.
Lee J, Durst RW, Wrolstad RE. 2002. Impact of juice processing on blueberry an-thocyanins and polyphenolics: comparison of two pretreatments. J Food Sci67:1660–7.
Meyer AS, Jepsen SM, Sørensen NS. 1998. Enzymatic release of antioxidants forhuman-low-density lipoprotein from grape pomace. J Agric Food Chem46:2439–46.
Moyer RA, Hummer KE, Finn CE, Frei B, Wrolstad RE. 2002. Anthocyanins, phe-nolics, and antioxidant capacity in diverse small fruits: Vaccinium, Rubus, andRibes. J Agric Food Chem 50:519–25.
Ness AR, Powles JW. 1997. Fruit and vegetables, and cardiovascular disease: areview. Int J Epidemiol 26:1–13.
Pastrana-Bonilla E, Akoh CC, Sellappan S, Krewer G. 2003. Phenolic content andantioxidant capacity of muscadine grapes. J Agric Food Chem 51:5497–503.
Prior RL. 1998. Antioxidant capacity and health benefits of fruits and vegetables:blueberries, the leader of the pack. Proc. 32nd Ann. Open House North CarolinaBlueberry Council 32:3–12.
Prior RL, Cao G, Martin A, Sofic E, McEwen J, O’Brien C, Lischner N, Ehlenfeldt
Vol. 69, Nr. 7, 2004—JOURNAL OF FOOD SCIENCE C573URLs and E-mail addresses are active links at www.ift.org
C: Fo
od Ch
emist
ry &
Toxico
logy
Blueberry processing . . .
M, Kalt W, Krewer G, Mainland CM. 1998. Antioxidant capacity as influencedby total phenolic and anthocyanin content, maturity, and variety of Vacciniumspecies. J Agric Food Chem 46:2686–93.
Prior RL, Lazarus SA, Cao G, Muccitelli H, Hammerstone JF. 2001. Identificationof procyanidins and anthocyanins in blueberries and cranberries (Vaccini-um spp.) using high-performance liquid chromatography/mass spectrometry.J Agric Food Chem 49:1270–76.
Rodriguez-Saona LE, Wrolstad RE. 2001. Unit F1.1: Anthocyanins. Extraction,isolation and purification of anthocyanins. In: Wrolstad RE, editor. Currentprotocols in food analytical chemistry. New York: John Wiley & Sons. p 1–11.
Rossi M, Giussani E, Morelli R, Lo Scalzo R, Nani RC, Torreggiani D. 2003. Effectof fruit blanching on phenolics and radical scavenging activity of highbushblueberry. Food Res Int 36:999–1005.
Sapers GM. 1993. Browning of foods: control by sulfites, antioxidants, and othermeans. Food Technol 47(10):75–84.
Skrede G, Wrolstad RE, Durst RW. 2000. Changes in anthocyanins and polyphe-nolics during juice processing of highbush blueberries (Vaccinium corymbo-sum L.). J Food Sci 65:357–64.
Stanley R, Miller S. 2001. Enzymatic processing for the release of phenolic an-tioxidants from fruit waste. Biol Act Phyto Food 269:552–6.
Steinmetz KA, Potter JD. 1991. Vegetables, fruit, and cancer. I. Epidemiology.Cancer Causes Contr 2:325–57.
Vinson JA, Su X, Zubik L, Bose P. 2001. Phenol antioxidant quantity and quality infoods: fruits. J Agric Food Chem 49:5315–21.
Wang H, Cao G, Prior RL. 1996. Total antioxidant capacity of fruits. J Agric FoodChem 44:701–5.
Waterhouse AL. 2002. Unit I1.1: Polyphenolics: Determination of total phenolics,In: Wrolstad RE, editor. Current protocols in food analytical chemistry. NewYork: John Wiley & Sons. p 1–4.
Wightman JD, Wrolstad RE. 1995. Anthocyanin analysis as a measure of glycosi-dase activity in enzymes for juice processing. J Food Sci 60:862–7.
Wrolstad RE. 2000. Anthocyanins. In: Lauro GJ, Francis FJ, editors. Natural foodcolorants. Science and technology. New York: Marcel Dekker. p 237–52.
Wrolstad RE, Wightman JD, Durst RW. 1994. Glycosidase activity of enzyme prep-arations used in fruit juice processing. Food Technol 48(11):90–8.