external verification performance based financing in ... · pdf fileexternal verification...
TRANSCRIPT
EXTERNAL VERIFICATION PERFORMANCE BASED FINANCING IN HEALTHCARE IN SIERRA LEONE
CORDAID NAAM BU » REPORT EXTERNAL VERIFICATION JUNI 2014
VOLUME 1 MAIN REPORT

EXTERNAL VERIFICATION PERFORMANCE BASED FINANCING SIERRA LEONE 1
VOLUME 1 MAIN REPORT
TABLE OF CONTENTS
Table of Contents .................................................................................................................................. 1
List of Tables ......................................................................................................................................... 3
List of Figures ........................................................................................................................................ 3
Acronyms ............................................................................................................................................... 5
Acknowledgement ................................................................................................................................. 7
Executive Summary .............................................................................................................................. 9
1 Introduction ................................................................................................................................... 13 1.1 Terms of Reference of the External Verification ...................................................................... 13 1.2 The External Verification team ................................................................................................. 13 1.3 Set up of the report ................................................................................................................... 13
2 Background ................................................................................................................................... 15 2.1 Health Sector in Sierra Leone .................................................................................................. 15
2.1.1 Health Status ..................................................................................................................... 15 2.1.2 Health system ................................................................................................................... 15
2.2 Free Health Care Initiative ....................................................................................................... 16 2.3 PBF in the Sierra Leone context .............................................................................................. 17 2.4 Trends in service delivery ........................................................................................................ 17
3 Methodology of the external verification .................................................................................... 19 3.1 Introduction ............................................................................................................................... 19 3.2 Organisation ............................................................................................................................. 19
3.2.1 Project team and verification teams .................................................................................. 19 3.2.2 Standard working procedure ............................................................................................. 19 3.2.3 Learning approach ............................................................................................................ 21
3.3 Timeframe ................................................................................................................................ 21 3.4 Sources of information ............................................................................................................. 22
3.4.1 Quantitative data ............................................................................................................... 22 3.4.2 Cross cutting issues .......................................................................................................... 24 3.4.3 Qualitative data ................................................................................................................. 24
3.5 Sampling .................................................................................................................................. 25 3.5.1 Facility sampling................................................................................................................ 25 3.5.2 Sampling for Patient Tracing and Patient Satisfaction survey .......................................... 27
3.6 Quality assurance ..................................................................................................................... 28 3.6.1 Prior to data collection ...................................................................................................... 28 3.6.2 During the verification ....................................................................................................... 29 3.6.3 After data collection .......................................................................................................... 29
3.7 Reliability and significance ....................................................................................................... 29 3.7.1 Reliability of data ............................................................................................................... 29 3.7.2 Equal distribution of facilities ............................................................................................. 29 3.7.3 Significance of PHU data .................................................................................................. 31 3.7.4 Significance of patient satisfaction data ............................................................................ 31 3.7.5 Completeness of data ....................................................................................................... 31
3.8 Data analysis ............................................................................................................................ 32 3.8.1 Systems used .................................................................................................................... 32 3.8.2 Primary Facility Output Data ............................................................................................. 33 3.8.3 Data from Patient and key informant interviews ............................................................... 33
3.9 External verification in the hospitals ......................................................................................... 33
4 External Verification Findings ..................................................................................................... 35 4.1 Introduction ............................................................................................................................... 35
4.1.1 Indicators ........................................................................................................................... 35 4.1.2 Hospital PBF ..................................................................................................................... 35
4.2 Output indicators in PHUs ........................................................................................................ 36
EXTERNAL VERIFICATION PERFORMANCE BASED FINANCING SIERRA LEONE 2
VOLUME 1 MAIN REPORT
4.2.1 Variation between sources of information ......................................................................... 36 4.2.2 Influence of missing data on calculations ......................................................................... 38 4.2.3 Differences in data in facilities .......................................................................................... 39 4.2.4 Differences per level of facility .......................................................................................... 40 4.2.5 Differences per geographical area .................................................................................... 41 4.2.6 Satisfactory and unsatisfactory entries ............................................................................. 42
4.3 Crosscutting Issues .................................................................................................................. 45 4.3.1 General ............................................................................................................................. 45 4.3.2 Specific indicators ............................................................................................................. 47
4.4 Hospital external verification .................................................................................................... 48 4.4.1 Ola During Children Hospital ............................................................................................ 48 4.4.2 Princess Christian Maternity Hospital ............................................................................... 49 4.4.3 Non-PBF hospital .............................................................................................................. 50
5 Patient Tracing and Satisfaction Survey .................................................................................... 53 5.1 Patient tracing .......................................................................................................................... 53 5.2 Patient satisfaction ................................................................................................................... 54
5.2.1 Satisfaction scores ............................................................................................................ 54 5.2.2 Satisfaction scores per level of facility .............................................................................. 55 5.2.3 Payment for services ........................................................................................................ 56
5.3 Patient tracing by Councils and DHMTs .................................................................................. 57
6 Systems Assessment ................................................................................................................... 59 6.1 Introduction ............................................................................................................................... 59 6.2 Accessibility and equity ............................................................................................................ 59 6.3 Autonomy and accountability PHUs ......................................................................................... 60
6.3.1 Capacities ......................................................................................................................... 60 6.3.2 Planning and management of small projects .................................................................... 60 6.3.3 Financial management in practice .................................................................................... 61 6.3.4 Delays in payment ............................................................................................................ 62
6.4 Community involvement ........................................................................................................... 63 6.5 Separation of functions in the PBF programme ....................................................................... 63
6.5.1 Councils ............................................................................................................................ 64 6.5.2 DHMTs .............................................................................................................................. 64 6.5.3 MOHS ............................................................................................................................... 65 6.5.4 MOFED ............................................................................................................................. 65
6.6 Definition of indicators .............................................................................................................. 66 6.7 Contracts .................................................................................................................................. 66 6.8 Hospital PBF ............................................................................................................................ 66
6.8.1 Contracts ........................................................................................................................... 66 6.8.2 Implementation.................................................................................................................. 66 6.8.3 Indicators ........................................................................................................................... 66 6.8.4 Expenditure ....................................................................................................................... 67 6.8.5 Non-PBF hospitals ............................................................................................................ 67
7 Discussion ..................................................................................................................................... 69 7.1 Quality ...................................................................................................................................... 69 7.2 Data quality .............................................................................................................................. 69
7.2.1 Missing data ...................................................................................................................... 70 7.2.2 Data consistency ............................................................................................................... 70 7.2.3 Case definitions................................................................................................................. 71 7.2.4 Triangulation ..................................................................................................................... 71
7.3 PBF light ................................................................................................................................... 71 7.4 Financial management ............................................................................................................. 72
8 Conclusions and Recommendations .......................................................................................... 73 8.1 Conclusions .............................................................................................................................. 73
8.1.1 The general and specific objectives of the PBF programme ............................................ 73 8.1.2 The Terms of Reference .................................................................................................. 73
8.2 Recommendations ................................................................................................................... 74 8.2.1 Validation workshop .......................................................................................................... 74 8.2.2 Short-term recommendations ........................................................................................... 74 8.2.3 Clarification of the operational manual ............................................................................. 77
EXTERNAL VERIFICATION PERFORMANCE BASED FINANCING SIERRA LEONE 3
VOLUME 1 MAIN REPORT
8.2.4 Longer-term recommendations ......................................................................................... 77 8.2.5 Future developments of PBF ............................................................................................ 77 8.2.6 Hospital PBF ..................................................................................................................... 78
LIST OF TABLES Table 1 Summary of activities and outputs ...................................................................................... 21 Table 2 Sources of information and tools used to capture this information ................................ 23 Table 3 Methods used for assessment of cross cutting issues ..................................................... 24 Table 4 Data sources and tools for qualitative information ............................................................ 25 Table 5 Number of PHUs in the PBF project in 2012 per district ................................................... 26 Table 6 Number of PHUs selected per Council (urban areas) ........................................................ 26 Table 7 Geographical areas selected in each rural Council ........................................................... 27 Table 8 Distribution of PHU type per district .................................................................................... 30 Table 9 Domains for assessment of hospital performance ............................................................ 36 Table 10 Totals per output indicator sampling 4 months 2012 ...................................................... 36 Table 11 Extrapolation of all service attendance based on missing data ..................................... 39 Table 12 Differences between data sources above 25% in PHUs .................................................. 40 Table 13 Differences between data sources FP per level PHU ....................................................... 41 Table 14 Percentage satisfactory entries per Council per indicator .............................................. 42 Table 15 Differences between average satisfactory scores (IV and EV) per district ................... 44 Table 16 Percentage satisfactory records per level health facility ................................................ 45 Table 17 Percentage of persons who could not be traced in EV ................................................... 53 Table 18 Reasons for not interviewing persons in EV .................................................................... 54 Table 19 Patient satisfaction scores and contributing factors ....................................................... 54 Table 20 Patient satisfaction per level of facility ............................................................................. 55 Table 21 Persons interviewed who were asked to pay for services .............................................. 56 Table 22 Average, minimum and maximum amounts paid ............................................................. 56 Table 23 Involvement in action panning of PHUs ............................................................................ 60 Table 24 PBF payments to PHUs requested by MOHS to MOFED ................................................. 61 Table 25 Percentage of quarterly payments, traced in PHUs during the EV ................................. 62 Table 26 Roles of HMC according to chairs HMC ............................................................................ 63 Table 27 Registers reported out of stock by PHUs .......................................................................... 70
LIST OF FIGURES Figure 1 Family planning 2011 - 2013 ................................................................................................ 17 Figure 2 ANC 4 2011 2014 .................................................................................................................. 18 Figure 3 PHU deliveries 2011 - 2013 .................................................................................................. 18 Figure 4 Children fully immunised 2011 - 2013 ................................................................................ 18 Figure 5 Selection process for patient sampling ............................................................................. 28 Figure 6 Number of PHU selected per district .................................................................................. 30 Figure 7 Formula for calculating sample size .................................................................................. 31 Figure 8 Percentage completeness of family planning records per districts ............................... 32 Figure 9 Reasons for unavailability of records per information source ........................................ 32 Figure 10 Comparison Output indicators per source of information ............................................ 37 Figure 11 Comparison sources of information per indicator ......................................................... 37 Figure 12 Extrapolation of service utilisation FP based on missing data ..................................... 38 Figure 13 Extrapolation of ANC service utilisation figures based on missing data..................... 38 Figure 14 Distribution of facilities by differences ............................................................................ 39 Figure 15 Geographical spread of facilities with differences data sources .................................. 41 Figure 16 Distribution of Absolute Differences between IV and EV .............................................. 43 Figure 17 Plot box differences satisfactory entries ......................................................................... 44 Figure 18 Crosscutting issues IV and EV ......................................................................................... 46 Figure 19 Distribution crosscutting issues scores in EV ................................................................ 46 Figure 20 Distribution of crosscutting scores in IV ......................................................................... 46 Figure 21 Kono District Comparing Crosscutting Indicators IV and EV ....................................... 47
EXTERNAL VERIFICATION PERFORMANCE BASED FINANCING SIERRA LEONE 4
VOLUME 1 MAIN REPORT
Figure 22 Comparing crosscutting indicator Administration IV and EV ....................................... 47 Figure 23 Comparison crosscutting indicator Stock Outs IV and EV ............................................ 48 Figure 24 Ola During Children Hospital IV and EV .......................................................................... 49 Figure 25 Trend in IV scores in Ola During Children Hospital ........................................................ 49 Figure 26 Princess Christian Maternity Hospital IV and EV ............................................................ 50 Figure 27 Trend analysis Princess Cristian Maternity Hospital ..................................................... 50 Figure 28 Comparison PBF and non-PBF hospitals in EV .............................................................. 51 Figure 29: Building blocks of RBF ..................................................................................................... 59 Figure 30 Word cloud investments in PHUs ..................................................................................... 61 Figure 31 Roles in PBF in Sierra Leone ............................................................................................ 64 Figure 32 Relations in the quality system ......................................................................................... 69 Figure 33 PHU-F1 form box totals ..................................................................................................... 70 Figure 34 Step by step introduction of sampling IV ........................................................................ 76

EXTERNAL VERIFICATION PERFORMANCE BASED FINANCING SIERRA LEONE 5
VOLUME 1 MAIN REPORT
ACRONYMS
AIDS Acquired Immunodeficiency Syndrome
ANC Antenatal Care
CHC Community Health Centre
CHP Community Health Post
CSOs Civil Society Organisations
DHIS District Health Information System
DHMT District Health Management Team
DHS Demographic and Health Survey
DMO District Medical Officer
DPPI Directorate of Policy, Planning and Information
EmONC Emergency Obstetric and Neonatal Care
EPI Expanded Programme on Immunisation
EV External Verification
FHC Free Health Care
GDP Gross Domestic Product
HMC Health Management Committee
HIV Human Immunodeficiency Virus
HMIS Health Management Information System
IMNCI Integrated Management of Neonatal and Child Illnesses
IV Internal Verification
IVT Internal Verification Team
LC Local Council
LGFD Local Government Finance Department
M&E Monitoring and Evaluation
MCH Maternal and Child Health
MCHP Maternal and Child Health Post
MDGs Millennium Development Goals
MOFED Ministry of Finance and Economic Development
MOHS Ministry of Health and Sanitation
NGO Non-Governmental Organisation
NHA National Health Account
OM Operational Manual
PAD Project Appraisal Document
PBF Performance-Based Financing
PHU Peripheral Health Unit
PMTCT Prevention of Mother to Child Transmission
PRSP Poverty Reduction Strategy Paper
RCH Reproductive and Child Health
RCHP Reproductive and Child Health Project
SDHSP Strengthening District Health Service Project
SDPS Service Delivery Perception Survey
SLDHS Sierra Leone Demographic and Health Survey
TBA Traditional Birth Attendant
TOT Training of Trainers
UN United Nation
UNICEF United Nations Children Fund
WB World Bank
WHO World Health Organisation

EXTERNAL VERIFICATION PERFORMANCE BASED FINANCING SIERRA LEONE 6
VOLUME 1 MAIN REPORT
EXTERNAL VERIFICATION PERFORMANCE BASED FINANCING SIERRA LEONE 7
VOLUME 1 MAIN REPORT
ACKNOWLEDGEMENT
To a great extent, this verification consisted of qualitative studies and included inputs from health care
staff and the population in service areas of the Peripheral Health Units (PHU). Only part of the data
was collected in a quantitative way, by looking at registers in health facilities and by using the existing
health information systems. The success of any External Verification exercise relies heavily on the
collaboration and openness of key people working in health facilities, policy makers and people
seeking health care. Having targeted 235 PHUs, their HMCs and 8 clients per PHU for structured
interviews, almost 2000 people were interviewed at local levels. Without exception, we received full
collaboration and dedication from all participants, not in the last place from people ‘on the road’ who
guided us to hard- to-reach areas in order to trace patients. Thanks to all these people it was possible
to collect a tremendous amount of valuable information for our analysis and recommendations. This
information will probably also be used for future comparison and trend analysis.
The Councils and District Health Management Teams (DHMTs) play a crucial role in steering,
management, monitoring and capacity building in relation to the performance based financing (PBF)
programme. For the External Verification we relied on them for planning and facilitation of the
fieldwork and as resource for data collection and interviews. All 13 DHMT’s and 18 Councils were
interviewed and shared valuable information. A special word of thanks goes to all the Monitoring and
Evaluation (M&E) officers and Planning Officers at the DHMTs and Councils who assisted us in the
collection of the required quantitative PBF data. We spent many hours in the M&E offices and always
met collaborative attitudes.
Without the patience and willingness of our counterparts at central MOHS and MOFED to share
information and additional data, the External Verification exercise would have been impossible.
The PBF programme in Sierra Leone does not operate in a vacuum as several international
Development Partners contribute to the progress and improvements of the country’s healthcare
sector. The External Verification team had extensive meetings with several of them. This enabled us
to put our findings in a broader perspective. We hope that this report provides useful inputs for further
strategising and alignment of all the interventions in the health sector.
Cordaid is grateful that this assignment was entrusted to us. Our activities not only focused on
performing the technical verification, but also on empowering different actors in the health sector and
on increasing knowledge on internal verification. Thus, it is our sincere hope that the insights and
knowledge that was built during the exercise will strengthen Sierra Leone’s Performance Based
Financing programme. We hope it may also set an example for efficient organisation of independent
external verification in other countries.
The EV team consisted of Dr Jaap Koot, team leader, Mrs Marjan Kruijzen, project manager, Mr Frank
van de Looij, PBF-expert, Mr Chenjerai Sisimayi, data analyst, and Mr David Yambasu, field
coordinator.
PBF External Verification Team

EXTERNAL VERIFICATION PERFORMANCE BASED FINANCING SIERRA LEONE 8
VOLUME 1 MAIN REPORT

EXTERNAL VERIFICATION PERFORMANCE BASED FINANCING SIERRA LEONE 9
VOLUME 1 MAIN REPORT
EXECUTIVE SUMMARY
Introduction
The health sector of Sierra Leone receives support from the World Bank through the Reproductive and
Child Health (RCH) Project, which has the objective to increase utilisation of a package of essential
health services by pregnant and lactating women and children under the age of five. Performance
Based Financing (PBF) is part of the RCH project.
The general objective of the PBF system is: to change the behaviour of health providers at facility level
for them to deliver more quality services under the free health care policy. Free health care is a
collaborative effort of the Government of Sierra Leone and Development Partners to achieve the
Millennium development Goals.
The PBF programme exists of payment for six output indicators, corrected for payment for crosscutting
issues and remoteness of facilities. District health management teams and Council officials perform
quarterly internal verification. Part of the programme is a Hospital PBF, piloted in two hospitals in
Freetown.
The Ministry of Finance and Economic Development - IPAU (Integrated Project Administration Unit) of
the Republic of Sierra Leone contracted the Dutch Non-Governmental Organisation Cordaid for the
External Verification (EV) of the PBF component of the RCH project in the health sector in Sierra
Leone, starting on 28 October 2013 and ending on 28 April 2014.
The Terms of Reference (TOR) for the external verification were:
1. To review the accuracy of the facility data from the registers and other records;
2. To analyse the data of the first full year of PBF implementation (2012);
3. To review the roles and responsibilities of the different PBF stakeholders and advise on the areas
of improvement if necessary;
4. To evaluate the benefits of the performance based financing in term of services delivery,
strengthening the health system information (verification of data and timely reporting), the
governance of health facilities (management of human resources, environmental health, financing,
etc.).
Cordaid developed a methodology for the External Verification and fielded teams to visit all 19
Councils, 13 Districts, 47 Community Health Centres (CHCs), 52 Community Health Posts (CHPs) and
130 MCH Posts, sampled. Furthermore four Hospitals were visited for an external verification of the
Hospital PBF.
Findings of the External Verification of Output Indicators The External Verification of Output Indicators in the PBF system showed:
Considerable, sometime significant differences exist between aggregated numbers in internal and
in external verification. With exception of deliveries, the aggregated Internal Verification (IV)
figures are 12% - 73% higher than the EV.
Recorded attendance in the IV is in the majority of indictors also higher than other sources of
information (Health Management Information System (HMIS), or F-forms1).
In general, the aggregated figures from various sources of information differ, whereby the EV
showed most concordance with F-reports.
The differences cannot be attributed to missing data.
At facility level for all indicators the differences between sources of information are large, often
more than 25% higher or lower.
The differences in recording are spread over the country and not related to specific districts.
Lower-level health facilities show larger error margins than higher-level facilities.
There is no statistically significant difference between IV and EV as regards percentage of
satisfactory or unsatisfactory entries in the records. There is no significant difference per level of
facility, and not per district.
Crosscutting issues
The external verification for crosscutting indicators showed:
The scores for the crosscutting issues in the external verification were consistently lower than in
the internal verification in nearly all districts, for nearly all the indicators.
1 F-forms or “returns” are standard reporting forms filled by PHUs and sent to the District Health Management Team for entry into the automated HMIS.
EXTERNAL VERIFICATION PERFORMANCE BASED FINANCING SIERRA LEONE 10
VOLUME 1 MAIN REPORT
In the external verification standardised assessment criteria were applied, reducing the chances of
personal bias. Those criteria might have been stricter than applied in the internal verification.
Due to the time lapse between 2012 and 2014 differences may have been created, e.g. missing
registers, leading to lower scores.
Worsening supplies of medicines may have caused lower scores in availability of essential
medicines in 2014 compared with 2012.
The high percentage of maximum scores for all indicators in all facilities, as found in the internal
verification in some districts, could not be confirmed in the external verification.
Hospital PBF
The external verification of the Hospital PBF found that:
The EV team gave slightly higher scores in the EV to Ole During Child Hospital compared to the
latest IV (79% vs. 61%), but lower than in other IVs (85%-95%)
The EV team gave slightly lower scores in the EV to Princess Christian Maternal Hospital
compared to the latest IV (84% vs. 89%), in the range of other IVs (82%-89%)
Hospitals not receiving PBF scored lower than PBF hospitals, but one of those scored only slightly
lower, while the score of the other hospital was wide off range.
Patient tracing and satisfaction
The external verification of the patient tracing and satisfaction found that:
92.6% of the patient/clients earmarked for tracing could indeed be identified either by meeting the
clients in person, or by identification by a member of the community.
There is no reason to believe that PHUs recorded “ghost patients” to inflate the numbers of
attendance.
The average satisfaction score of clients was 7.3 (out of 10), with a variation between 4.1 and 9.8.
Client satisfaction was strongly related to short waiting times, friendly treatment, availability of
medicines and non-payment for services.
12% of patients interviewed had to pay for services, although they were supposed to benefit from
Free Health Care.
Systems analysis
Free Healthcare was introduced in 2010, and was supported by several donors an agencies, e.g.
through human resources management, provision of medicines, etc. Free health care has resulted in
considerable increase in service delivery in reproductive and child health services, although recently
there has been a levelling off of service utilisation at a higher level than before the introduction of Free
Healthcare.
The PBF programme works complementary to Free Healthcare, and offers to health facilities a
compensation for the loss of income through patient fees. The programme has been successful in this.
The programme has succeeded in providing more autonomy to health facilities to manage their own
small projects, which contribute to better work environment: more hygiene, better equipped buildings
and better supplies have been achieved.
Financial management is a weak area, with virtually no systems in place at grass root level. Late
payment during the period of review affected continuity of the PBF programme and had high
opportunity costs: PHUs were eager to implement health services improvements, but had to wait for
over one year to get their due payments. Health workers expressed fear that they would not receive
their bonuses after such a long period of delay, e.g. after transfer. Not receiving a performance bonus
created frustration, rather than motivation for better performance.
The programme has succeeded to some extent in improving community contribution to management
of health facilities, although the capacities are still limited.
In Sierra Leone a “light” PBF approach is applied, which means that not all theoretical concepts of
PBF with regard to separation of responsibilities (e.g. Health results Innovation Trust Fund2) are fully
implemented. The Local Council is officially responsible for the health services, but is at the same time
the contracting agency. The DHMT is the technical supervisor and at the same time the internal
verifier. In practice the collaboration between Councils and DHMTs often is not as envisaged in Sierra
Leone’s PBF plan. The DHMTs often operate independently, and Councils do not feel engaged in the
programme.
2 https://www.rbfhealth.org
EXTERNAL VERIFICATION PERFORMANCE BASED FINANCING SIERRA LEONE 11
VOLUME 1 MAIN REPORT
Conclusions
The general objective of the PBF system is: to change the behaviour of health providers at facility level
for them to deliver more quality services under the free health care policy. The EV team concludes
that systems have been put in place and are operational to a reasonable extent in a number of health
facilities (see Chapter 7.1). Further strengthening of the system is possible within the present design
of PBF in Sierra Leone, when a number of implementation issues can be solved.
The EV team concludes that PBF provides cash at facility level to cover the local costs of delivering
services and removing the need for 'informal' fees. Only 12% of the patient paying for those services,
which supposedly are free. Late transfers of PBF funds may have forced PHUs to ask for contributions
for patient records, etc. when funds dried up. Payments by patients may reduce further if PBF
payment improves. Incidental misbehaviour by health workers cannot be ruled out.
The EV team concludes that to some extent PBF provides financial incentives to facilities in order to
increase productivity and quality of care, especially for the identified key indicators. There is an
increase in service utilisation, although that increase is levelling off. There are signs of improved
attention for quality. However, the relation between performance and payments is too weak for health
workers. The incentive system is not transparent enough and payments come so late, that they are no
longer seen as reward for good performance.
Equity of distribution of funds may have taken place using district-based payment formula, but was not
visible for grass root workers. The flow of funds in general was not regular enough to hire contract
workers (with exception of the two PBF hospitals). Outreach may have benefited from PBF funds, e.g.
by repair of motorcycles and purchase of fuel. In general, funds were used for repairs of the building,
furniture, equipment and supplies, water and sanitation, etc. These investments have contributed to
patient satisfaction and higher scores for crosscutting quality indicators.
Recommendations
The MOHS district visits planned for the month of April 2014 will offer an opportunity to confirm with
the Councils the roles and the responsibilities as laid-down in the PBF operational manual. The roles
of the Councils in contracting, in internal verification, and in financial management and reporting have
to be renegotiated per Council, as circumstances and conditions may vary. The roles of HMCs have to
be clarified. New Memoranda of Understanding can be signed to confirm commitments.
During the district visits the MOHS could provide an orientation workshop on quality of internal
verification. The quality of internal verification has to improve: uniform case definitions have to be
applied, and DHMT members involved should understand their tasks well. On the spot double check
of IV report, F-forms and HMIS form (brought from the DHMT’s M&E office) should be introduced to
identify data inconsistencies and resolve them, or explain them.
The validation workshop at the end of the external verification called for simplification of the Internal
Verification, while improving the quality. The idea was to introduce sampling, not only months (one
month per quarter), but also PHUs (e.g. 25% of PHUs). HMIS data would be guiding in payment for
performance, rather than the data from IV. This is possible, but only if certain criteria are met.
The first step in this process is to guarantee data quality of registers, F-forms and HMIS. Facilities
should have the required registers and forms. HMIS and F-forms should be filled completely and
should match. Districts, which cannot meet minimum criteria of HMIS quality, should first bring their
house in order.
The second step is to select PHUs, which meet criteria of data quality, with matching IV and HMIS.
Those with reasonable data quality are admitted to the pool. But they can be removed from the pool if
in a control they are found to be missing the quality standards. From there, step-by-step, more
facilities are added to the pool. NB: quarterly supervision and assessment crosscutting issues should
continue in all health facilities!

EXTERNAL VERIFICATION PERFORMANCE BASED FINANCING SIERRA LEONE 12
VOLUME 1 MAIN REPORT
EXTERNAL VERIFICATION PERFORMANCE BASED FINANCING SIERRA LEONE 13
VOLUME 1 MAIN REPORT
1 INTRODUCTION
1.1 TERMS OF REFERENCE OF THE EXTERNAL VERIFICATION
PBF project
The health sector of Sierra Leone receives support from the World Bank through the Reproductive and
Child Health (RCH) Project, which has the objective to increase utilisation of a package of essential
health services by pregnant and lactating women and children under the age of five3. Performance
Based Financing (PBF) is part of the RCH project.
The general objective of the PBF system is: to change the behaviour of health providers at facility level
for them to deliver more quality services under the free health care policy.
The specific objectives of the system are4:
1. Provide cash at facility level to cover the local costs of delivering services and removing the need
for 'informal' fees.
2. Provide financial incentives to facilities in order to increase productivity and quality of care,
especially for the identified key indicators.
3. Increase the equity of distribution of resources with funds from PBF allowing facilities to hire
contractual workers and finance outreach activities.
Terms of Reference
The Ministry of Finance and Economic Development - IPAU (Integrated Project Administration Unit) of
the Republic of Sierra Leone contracted the Dutch Non-Governmental Organisation Cordaid for the
External Verification (EV) of the PBF component of the RCH project in the health sector in Sierra
Leone, starting on 28 October 2013 and ending on 28 April 2014.
The Terms of Reference (TOR) for the external verification are:
1. To review the accuracy of the facility data from the registers and other records;
2. To analyse the data of the first full year of PBF implementation (2012);
3. To review the roles and responsibilities of the different PBF stakeholders and advise on the areas
of improvement if necessary;
4. To evaluate the benefits of the performance based financing in term of services delivery,
strengthening the health system information (verification of data and timely reporting), the
governance of health facilities (management of human resources, environmental health, financing,
etc.).
The assignment is therefore broader than an external verification per se; it encompasses an
assessment of elements of the project design and implementation. The summary of the Terms of
Reference is found in annex 1, in Volume II of the report.
1.2 THE EXTERNAL VERIFICATION TEAM
The EV team consisted of Dr Jaap Koot, team leader, Mrs Marjan Kruijzen, project manager, Mr Frank
van de Looij, PBF-expert, Mr Chenjerai Sisimayi, data analyst, and Mr David Yambasu, field
coordinator.
The field team for data collection consisted of five teams of local experts from the organisations
Christian Brothers, SEND and Njala University, School of Community Health Science. The names of
the team coordinators and enumerations are listed in annex 2, of Volume II of the report.
1.3 SET UP OF THE REPORT
The following chapters describe the background of the health sector in Sierra Leone (Chapter 2), the
methodology of the external verification and the sampling (chapter 3). Chapter 4 describes the
analysis of output indicators and crosscutting issues, as well the hospital PBF. Chapter 5 gives
3 RCHP project Grant Agreement, 2010
4 PBF Operational Manual, version edited July 2013

EXTERNAL VERIFICATION PERFORMANCE BASED FINANCING SIERRA LEONE 14
VOLUME 1 MAIN REPORT
information on the patient satisfaction survey, and chapter 6 analyses the PBF system. Chapter 7
discusses some key issues and Chapter 8 gives conclusions and recommendations.
The annexes of the report are in a separate volume, and contain Terms of Reference, Team
members, List of Samples Facilities, Specific Council Reports and Case Definitions.
EXTERNAL VERIFICATION PERFORMANCE BASED FINANCING SIERRA LEONE 15
VOLUME 1 MAIN REPORT
2 BACKGROUND
2.1 HEALTH SECTOR IN SIERRA LEONE
2.1.1 HEALTH STATUS
Since the end of the civil war in 2002, Sierra Leone has made progress in improving the health status
of the population1. Maternal Mortality Ratio (MMR) and Child Mortality Rate (CMR) decreased to MMR
890 per 100.000 live births in 2010 and CMR to 174 per 1,000 live births in 2010, but are at still far
from the MDG targets of 320 and 92 respectively5. Fertility rates dropped from 6.5 in 2004 to 5.0 in
2010, but only 17% of the demand for family planning was satisfied in 2010.
The 2010 document that lays the foundation for the Basic Package of Essential Health Services for
Sierra Leone6, stated “the Health Status of the population compared to other sub-Saharan countries is
critical”.
The disease burden of children under-five consists mainly of communicable diseases and poor
nutrition. Malaria (38%), acute respiratory infection (16.9%) and watery & bloody diarrhoea (9.7%)
together, account for about 65% of all diseases. The stunting percentage (36.4% in 2008) also
contributes to the high disease burden for under-fives.
Inequity in the health system also remains a problem, both in terms disparities between income
groups as well as disparities between geographical locations7. For example, the percentage of births
attended by skilled health personnel is around 28% for the poorest and around 75% for the richest
quintiles.
2.1.2 HEALTH SYSTEM
Infrastructure
Peripheral Health Units (PHUs), i.e. Community Health Centres (CHCs), Community Health Posts
(CHPs), and Maternal and Child Health Posts (MCHPs) deliver Primary Health Care. There are 40
hospitals in the country8. The number of government health facilities has increased to over 1,200 in
2012 compared to 843 in 2006. There are now five Basic Emergency Obstetric Care (BEmOC)
centres each in all the 13 districts. In total, 13 district medical stores have been constructed to enable
storage of medicines and medical products both at national and district levels. Blood Banks have been
established in all district hospitals to provide safe blood for transfusion. A school for training midwives
was established in Makeni9.
Since the start of the National Health Sector Strategic Plan (NHSSP) 2010 – 2015, Government has
embarked on a series of improvements in the health sector. It has increased the total workforce in the
public health sector from 7,164 in 2009 to 8,446 in 2011. Incentive allowances are provided to health
workers in remote communities. Many PHUs are still heavily understaffed, or do not dispose of
adequate infrastructure (electricity, water supply) or equipment7.
Organisation
The health system in Sierra Leone is decentralised, with devolution as the mode of operation. The
Ministry of Health and Sanitation (MOHS) is responsible for formulating government health policies
and for technical guidance to the Councils, who as Local Government Authorities are responsible for
the implementation of health services. The MOHS provides technical guidance in the area of health
5 Source : http://www.countdown2015mnch.org/http://www.countdown2015mnch.org/; Sierra Leone Health Data—2012 Profile
6 Basic Package of Essential Health Services for Sierra Leone, Government of Sierra Leone, Ministry of Health and Sanitation,
March 2010. 7 Koyejo Oyerinde, Yvonne Harding, Philip Amara, Rugiatu Kanu, Rumishael Shoo, Kizito Daoh, The status of maternal and
newborn care services in Sierra Leone 8 years after ceasefire, International Journal of Gynecology and Obstetrics, 114 (2011) 168–173. 8 National Health Sector Strategic Plan (NHSSP) 2010 – 2015, Government of Sierra Leone, Ministry of Health and Sanitation,
November 2009 9 MOHS, Health Sector Performance Report, Draft, July 2012
EXTERNAL VERIFICATION PERFORMANCE BASED FINANCING SIERRA LEONE 16
VOLUME 1 MAIN REPORT
and has an important task in development of human resources for health and in logistics and supplies
of medicines and equipment for the health facilities.
The Ministry of Finance and Economic Development (MOFED) finances most of the health services
through the Councils and finances the human resources in health through the Human Resources
Management Office (HRMO).
In the districts the Local Councils are responsible for most of the service provision to the community,
including health. The District Health Management Teams (DHMTs) manage the primary healthcare
services on behalf of the Local Councils.
The NHSSP identifies the following major challenges in relation to health service delivery: (1) weak
M&E capacity, (2) weak mechanisms for public accountability, (3) minimal involvement of
communities, (4) low motivation of health workers, (5) high attrition rate, (6) weak health information
systems and (7) inadequate budgetary allocations.
Healthcare financing
Both MOHS and Development Partners have increased the funding for the health sector considerably
over the last years and have invested in human resources, supply of medicines, improvement of the
infrastructure, etc. The total health expenditure is estimated at US$ 78.7110
. Funding for the health
sector was estimated around US$ 85 million in 201111
.
The MOHS liaises with multilateral organisations such as WHO, UNICEF, UNAIDS, Global Fund,
GAVI, AfDB, EU, and World Bank and with bilateral organisations such as DFID, Ireland. The
Government of Sierra Leone (GOSL) agreed a Health Compact with most of the Development
Partners and NGOs aiming to make faster progress to achieve the ‘Agenda for Change’ in health and
the Millennium Development Goals12
.
2.2 FREE HEALTH CARE INITIATIVE
The President of Sierra Leone launched the Free Health Care Initiative in April 2010 with the aim to
increase access to health services by pregnant women and children. Removing patient fees would
take away the barriers for the poorest in society to seek institutional health care.
Measures undertaken to support this initiative included:
Undertaking a payroll cleaning exercise that removed around 1000 ghost workers, freeing up
resources, which enabled the Government of Sierra Leone (GoSL) to recruit 1000 legitimate
health workers. This resulted in a 15% increase in the health workforce which was cost neutral;
Increasing all health workers salaries by at least 90% with some highly skilled staff receiving five-
fold rises in their salaries;
Procuring over $10 million of pharmaceuticals and strengthening drug storage and supply
systems;
Initiating a new financial mechanism to provide cash grants to all health facilities for them to
purchase essential supplies;
Accelerating essential infrastructure repairs in hospitals, health centres and district drugs stores;
Conducting a mass communications campaign across the country to inform the target population
of their rights to free care.
Indeed, after the introduction the number of under-fives outpatient consultations increased with 250%
compared to the period before the launch of the Free Health Care Initiative, and this trend is
continuing. Immunisation coverage for children increased from 67% in 2006 to 82% in 2011.
Until today inputs from donors like DFID and UNICEF contribute to the Free Health Care Initiative for
e.g. medicines and salary costs. This collaborative effort is the backbone for improving healthcare in
Sierra Leone.
10
MOHS, National Health Accounts, draft 2012 11
MOHS, Health Sector Performance Report 2011, draft July 2012 12
GOSL, Health Compact, December 2011
EXTERNAL VERIFICATION PERFORMANCE BASED FINANCING SIERRA LEONE 17
VOLUME 1 MAIN REPORT
2.3 PBF IN THE SIERRA LEONE CONTEXT
Performance Based Financing was launched in Sierra Leone in April 2011, to strengthen the Free
Health Care Initiative.
PBF is a systematic approach to health reforms, which provides incentives for health worker
performance to improve staff motivation and funds for additional investments at grass root level. It
leverages major paradigm shifts in terms of accountability, governance, information systems, planning
and the inclusion of communities in verification and providing feedback. This approach is expected to
have impact on performance of the healthcare system and to have a multiplier effect on efforts of all
partners involved in the Free Healthcare initiative.
Sierra Leone has chosen to implement a “light-PBF”, with a limited set of indicators and a highly
simplified, but well prioritised quality component. The PBF project team has not created new
structures for the different functions within PBF, but utilises existing institutions for contracting and
internal verification.13
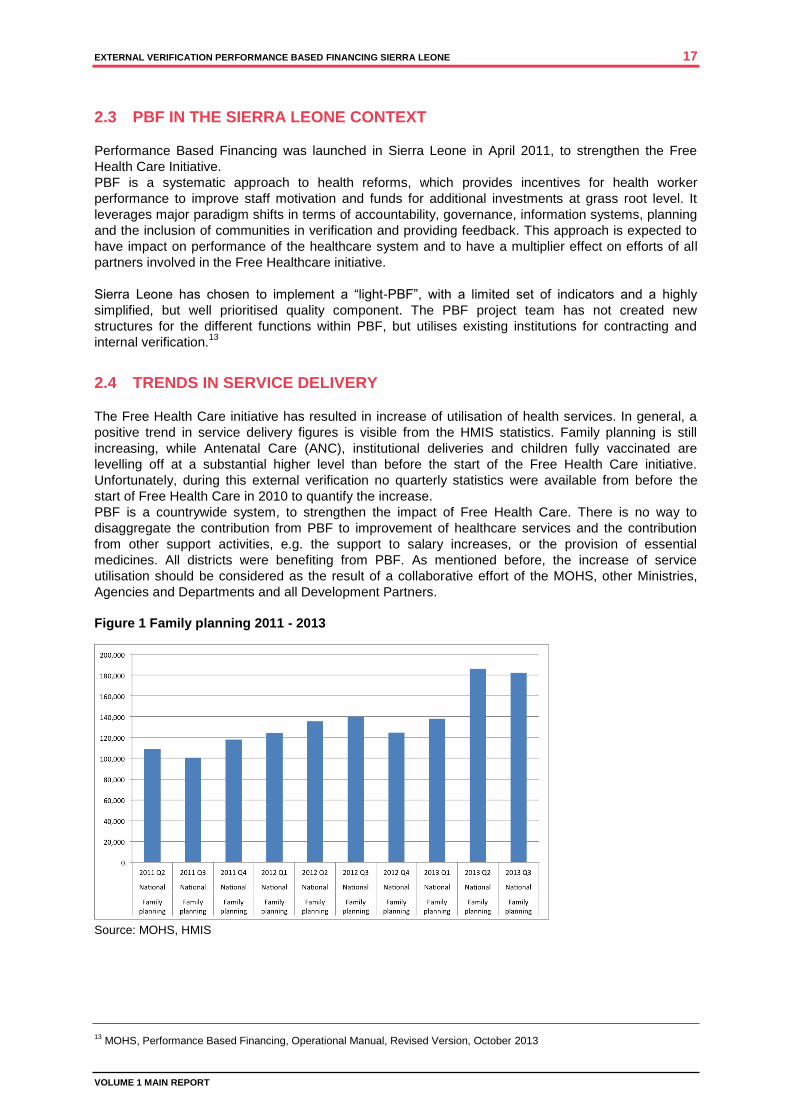
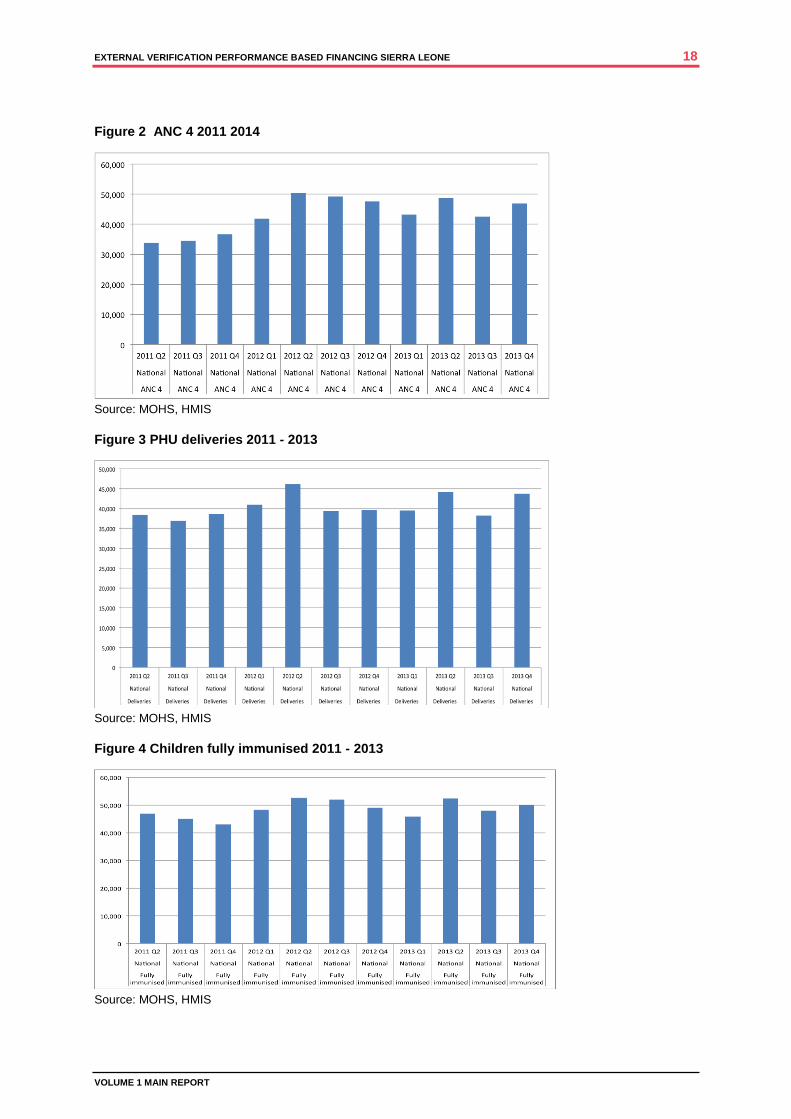
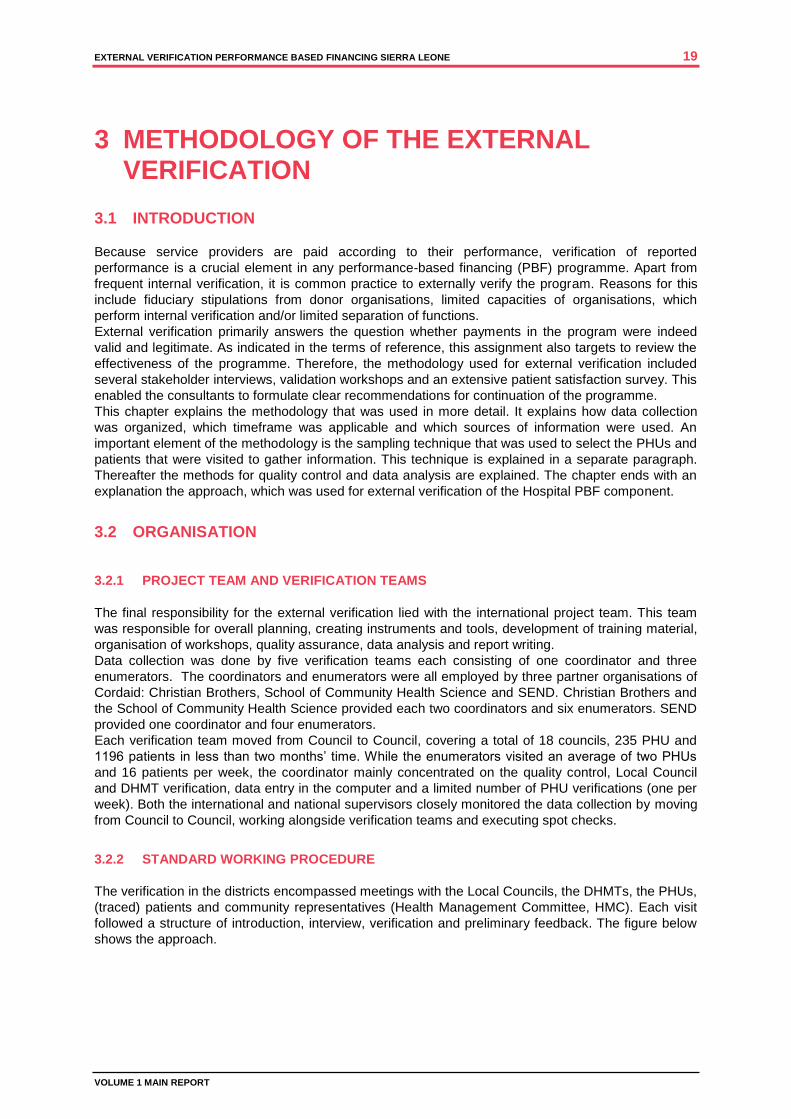
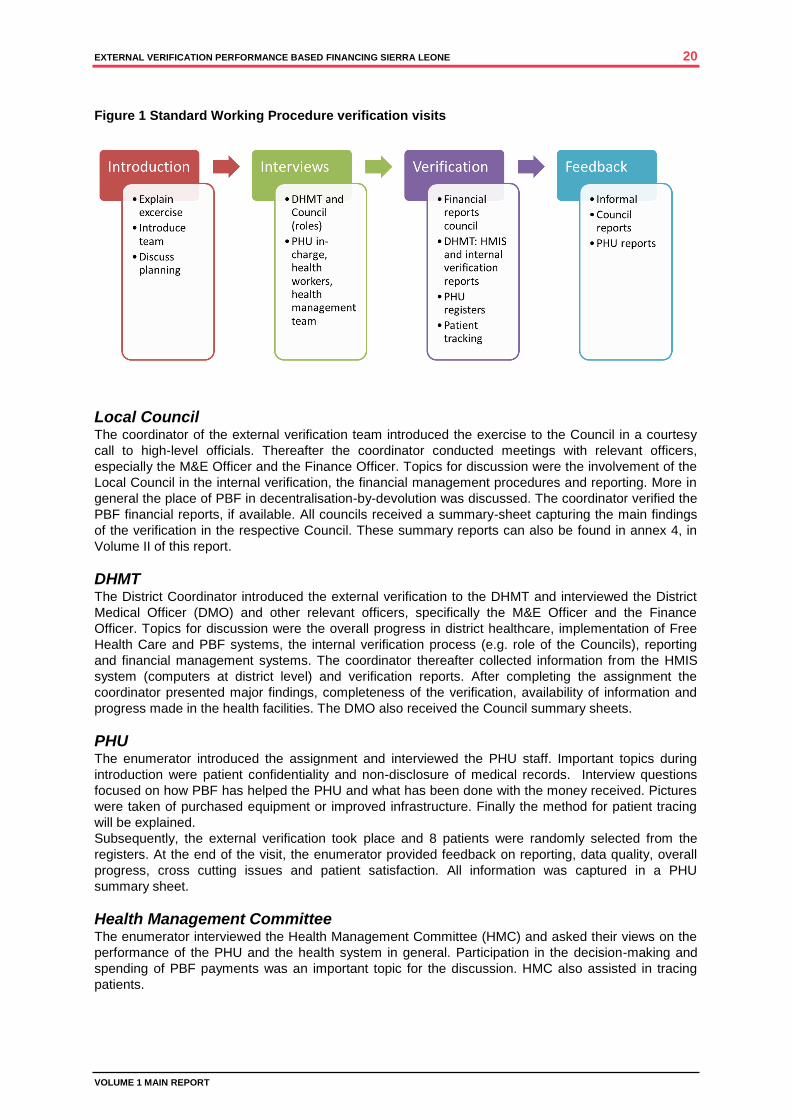
2.4 TRENDS IN SERVICE DELIVERY
The Free Health Care initiative has resulted in increase of utilisation of health services. In general, a
positive trend in service delivery figures is visible from the HMIS statistics. Family planning is still
increasing, while Antenatal Care (ANC), institutional deliveries and children fully vaccinated are
levelling off at a substantial higher level than before the start of the Free Health Care initiative.
Unfortunately, during this external verification no quarterly statistics were available from before the
start of Free Health Care in 2010 to quantify the increase.
PBF is a countrywide system, to strengthen the impact of Free Health Care. There is no way to
disaggregate the contribution from PBF to improvement of healthcare services and the contribution
from other support activities, e.g. the support to salary increases, or the provision of essential
medicines. All districts were benefiting from PBF. As mentioned before, the increase of service
utilisation should be considered as the result of a collaborative effort of the MOHS, other Ministries,
Agencies and Departments and all Development Partners.
Figure 1 Family planning 2011 - 2013
Source: MOHS, HMIS
13
MOHS, Performance Based Financing, Operational Manual, Revised Version, October 2013
EXTERNAL VERIFICATION PERFORMANCE BASED FINANCING SIERRA LEONE 18
VOLUME 1 MAIN REPORT
Figure 2 ANC 4 2011 2014
Source: MOHS, HMIS
Figure 3 PHU deliveries 2011 - 2013
Source: MOHS, HMIS
Figure 4 Children fully immunised 2011 - 2013
Source: MOHS, HMIS
EXTERNAL VERIFICATION PERFORMANCE BASED FINANCING SIERRA LEONE 19
VOLUME 1 MAIN REPORT
3 METHODOLOGY OF THE EXTERNAL VERIFICATION
3.1 INTRODUCTION
Because service providers are paid according to their performance, verification of reported
performance is a crucial element in any performance-based financing (PBF) programme. Apart from
frequent internal verification, it is common practice to externally verify the program. Reasons for this
include fiduciary stipulations from donor organisations, limited capacities of organisations, which
perform internal verification and/or limited separation of functions.
External verification primarily answers the question whether payments in the program were indeed
valid and legitimate. As indicated in the terms of reference, this assignment also targets to review the
effectiveness of the programme. Therefore, the methodology used for external verification included
several stakeholder interviews, validation workshops and an extensive patient satisfaction survey. This
enabled the consultants to formulate clear recommendations for continuation of the programme.
This chapter explains the methodology that was used in more detail. It explains how data collection
was organized, which timeframe was applicable and which sources of information were used. An
important element of the methodology is the sampling technique that was used to select the PHUs and
patients that were visited to gather information. This technique is explained in a separate paragraph.
Thereafter the methods for quality control and data analysis are explained. The chapter ends with an
explanation the approach, which was used for external verification of the Hospital PBF component.
3.2 ORGANISATION
3.2.1 PROJECT TEAM AND VERIFICATION TEAMS
The final responsibility for the external verification lied with the international project team. This team
was responsible for overall planning, creating instruments and tools, development of training material,
organisation of workshops, quality assurance, data analysis and report writing.
Data collection was done by five verification teams each consisting of one coordinator and three
enumerators. The coordinators and enumerators were all employed by three partner organisations of
Cordaid: Christian Brothers, School of Community Health Science and SEND. Christian Brothers and
the School of Community Health Science provided each two coordinators and six enumerators. SEND
provided one coordinator and four enumerators.
Each verification team moved from Council to Council, covering a total of 18 councils, 235 PHU and
1196 patients in less than two months’ time. While the enumerators visited an average of two PHUs
and 16 patients per week, the coordinator mainly concentrated on the quality control, Local Council
and DHMT verification, data entry in the computer and a limited number of PHU verifications (one per
week). Both the international and national supervisors closely monitored the data collection by moving
from Council to Council, working alongside verification teams and executing spot checks.
3.2.2 STANDARD WORKING PROCEDURE
The verification in the districts encompassed meetings with the Local Councils, the DHMTs, the PHUs,
(traced) patients and community representatives (Health Management Committee, HMC). Each visit
followed a structure of introduction, interview, verification and preliminary feedback. The figure below
shows the approach.
EXTERNAL VERIFICATION PERFORMANCE BASED FINANCING SIERRA LEONE 20
VOLUME 1 MAIN REPORT
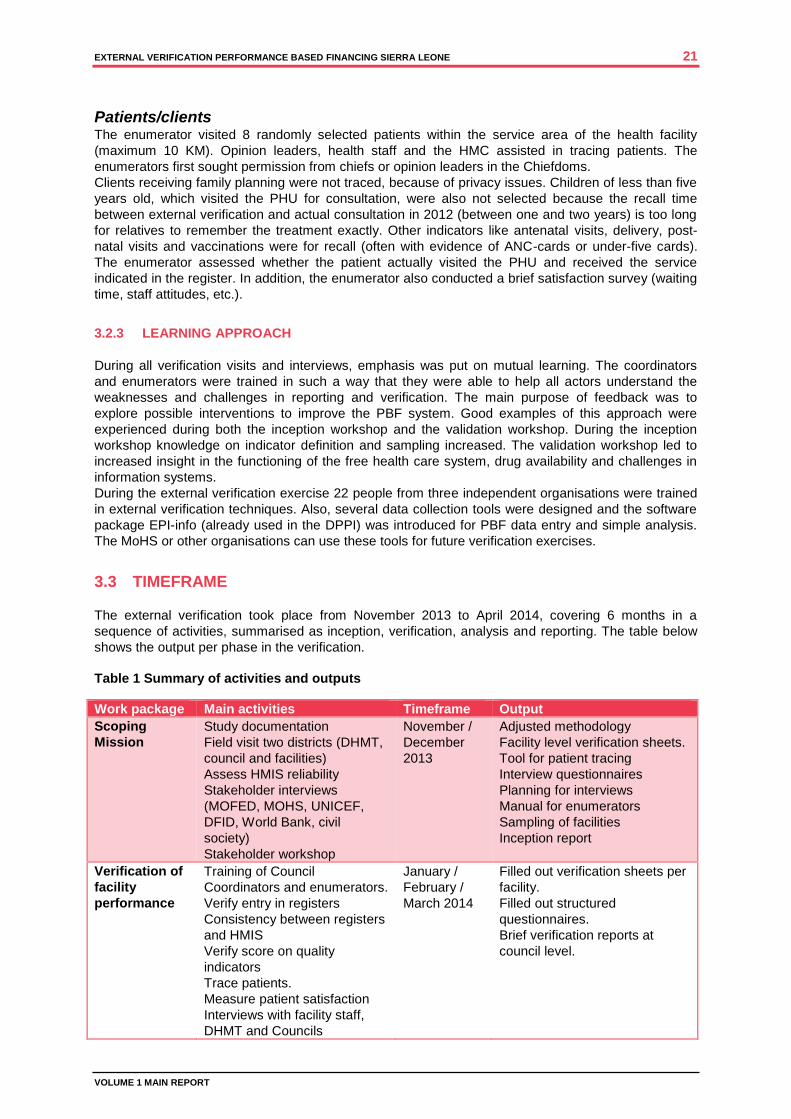
Figure 1 Standard Working Procedure verification visits
Local Council The coordinator of the external verification team introduced the exercise to the Council in a courtesy
call to high-level officials. Thereafter the coordinator conducted meetings with relevant officers,
especially the M&E Officer and the Finance Officer. Topics for discussion were the involvement of the
Local Council in the internal verification, the financial management procedures and reporting. More in
general the place of PBF in decentralisation-by-devolution was discussed. The coordinator verified the
PBF financial reports, if available. All councils received a summary-sheet capturing the main findings
of the verification in the respective Council. These summary reports can also be found in annex 4, in
Volume II of this report.
DHMT The District Coordinator introduced the external verification to the DHMT and interviewed the District
Medical Officer (DMO) and other relevant officers, specifically the M&E Officer and the Finance
Officer. Topics for discussion were the overall progress in district healthcare, implementation of Free
Health Care and PBF systems, the internal verification process (e.g. role of the Councils), reporting
and financial management systems. The coordinator thereafter collected information from the HMIS
system (computers at district level) and verification reports. After completing the assignment the
coordinator presented major findings, completeness of the verification, availability of information and
progress made in the health facilities. The DMO also received the Council summary sheets.
PHU The enumerator introduced the assignment and interviewed the PHU staff. Important topics during
introduction were patient confidentiality and non-disclosure of medical records. Interview questions
focused on how PBF has helped the PHU and what has been done with the money received. Pictures
were taken of purchased equipment or improved infrastructure. Finally the method for patient tracing
will be explained.
Subsequently, the external verification took place and 8 patients were randomly selected from the
registers. At the end of the visit, the enumerator provided feedback on reporting, data quality, overall
progress, cross cutting issues and patient satisfaction. All information was captured in a PHU
summary sheet.
Health Management Committee The enumerator interviewed the Health Management Committee (HMC) and asked their views on the
performance of the PHU and the health system in general. Participation in the decision-making and
spending of PBF payments was an important topic for the discussion. HMC also assisted in tracing
patients.
EXTERNAL VERIFICATION PERFORMANCE BASED FINANCING SIERRA LEONE 21
VOLUME 1 MAIN REPORT
Patients/clients The enumerator visited 8 randomly selected patients within the service area of the health facility
(maximum 10 KM). Opinion leaders, health staff and the HMC assisted in tracing patients. The
enumerators first sought permission from chiefs or opinion leaders in the Chiefdoms.
Clients receiving family planning were not traced, because of privacy issues. Children of less than five
years old, which visited the PHU for consultation, were also not selected because the recall time
between external verification and actual consultation in 2012 (between one and two years) is too long
for relatives to remember the treatment exactly. Other indicators like antenatal visits, delivery, post-
natal visits and vaccinations were for recall (often with evidence of ANC-cards or under-five cards).
The enumerator assessed whether the patient actually visited the PHU and received the service
indicated in the register. In addition, the enumerator also conducted a brief satisfaction survey (waiting
time, staff attitudes, etc.).
3.2.3 LEARNING APPROACH
During all verification visits and interviews, emphasis was put on mutual learning. The coordinators
and enumerators were trained in such a way that they were able to help all actors understand the
weaknesses and challenges in reporting and verification. The main purpose of feedback was to
explore possible interventions to improve the PBF system. Good examples of this approach were
experienced during both the inception workshop and the validation workshop. During the inception
workshop knowledge on indicator definition and sampling increased. The validation workshop led to
increased insight in the functioning of the free health care system, drug availability and challenges in
information systems.
During the external verification exercise 22 people from three independent organisations were trained
in external verification techniques. Also, several data collection tools were designed and the software
package EPI-info (already used in the DPPI) was introduced for PBF data entry and simple analysis.
The MoHS or other organisations can use these tools for future verification exercises.
3.3 TIMEFRAME
The external verification took place from November 2013 to April 2014, covering 6 months in a
sequence of activities, summarised as inception, verification, analysis and reporting. The table below
shows the output per phase in the verification.
Table 1 Summary of activities and outputs
Work package Main activities Timeframe Output
Scoping
Mission
Study documentation
Field visit two districts (DHMT,
council and facilities)
Assess HMIS reliability
Stakeholder interviews
(MOFED, MOHS, UNICEF,
DFID, World Bank, civil
society)
Stakeholder workshop
November /
December
2013
Adjusted methodology
Facility level verification sheets.
Tool for patient tracing
Interview questionnaires
Planning for interviews
Manual for enumerators
Sampling of facilities
Inception report
Verification of
facility
performance
Training of Council
Coordinators and enumerators.
Verify entry in registers
Consistency between registers
and HMIS
Verify score on quality
indicators
Trace patients.
Measure patient satisfaction
Interviews with facility staff,
DHMT and Councils
January /
February /
March 2014
Filled out verification sheets per
facility.
Filled out structured
questionnaires.
Brief verification reports at
council level.
EXTERNAL VERIFICATION PERFORMANCE BASED FINANCING SIERRA LEONE 22
VOLUME 1 MAIN REPORT
Data entry (EPI info)
Data Analysis Final database cleaning and
cross checks on data validity
Standard sequential analysis
of HMIS data
Specific comparative analysis
of indicators and cross
sections
Regression analysis
Interviews at national and
council level
March 2014 Data analysis plan
Preliminary data analysis and
summary of interview findings
as part of the issues paper and
workshop presentations.
Validation of
findings and
reporting
One day workshop with
stakeholders and main
decision makers
Report writing
April 2014 Final report on verification
assignment
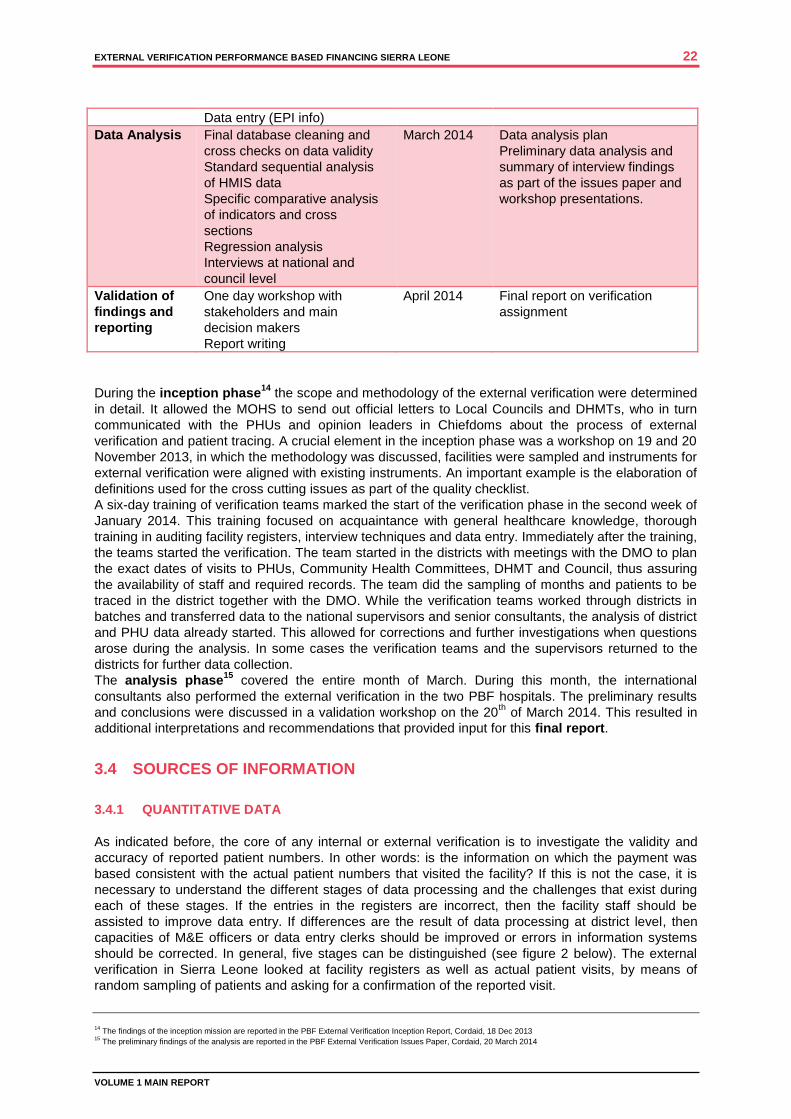
During the inception phase14
the scope and methodology of the external verification were determined
in detail. It allowed the MOHS to send out official letters to Local Councils and DHMTs, who in turn
communicated with the PHUs and opinion leaders in Chiefdoms about the process of external
verification and patient tracing. A crucial element in the inception phase was a workshop on 19 and 20
November 2013, in which the methodology was discussed, facilities were sampled and instruments for
external verification were aligned with existing instruments. An important example is the elaboration of
definitions used for the cross cutting issues as part of the quality checklist.
A six-day training of verification teams marked the start of the verification phase in the second week of
January 2014. This training focused on acquaintance with general healthcare knowledge, thorough
training in auditing facility registers, interview techniques and data entry. Immediately after the training,
the teams started the verification. The team started in the districts with meetings with the DMO to plan
the exact dates of visits to PHUs, Community Health Committees, DHMT and Council, thus assuring
the availability of staff and required records. The team did the sampling of months and patients to be
traced in the district together with the DMO. While the verification teams worked through districts in
batches and transferred data to the national supervisors and senior consultants, the analysis of district
and PHU data already started. This allowed for corrections and further investigations when questions
arose during the analysis. In some cases the verification teams and the supervisors returned to the
districts for further data collection.
The analysis phase15
covered the entire month of March. During this month, the international
consultants also performed the external verification in the two PBF hospitals. The preliminary results
and conclusions were discussed in a validation workshop on the 20th of March 2014. This resulted in
additional interpretations and recommendations that provided input for this final report.
3.4 SOURCES OF INFORMATION
3.4.1 QUANTITATIVE DATA
As indicated before, the core of any internal or external verification is to investigate the validity and
accuracy of reported patient numbers. In other words: is the information on which the payment was
based consistent with the actual patient numbers that visited the facility? If this is not the case, it is
necessary to understand the different stages of data processing and the challenges that exist during
each of these stages. If the entries in the registers are incorrect, then the facility staff should be
assisted to improve data entry. If differences are the result of data processing at district level, then
capacities of M&E officers or data entry clerks should be improved or errors in information systems
should be corrected. In general, five stages can be distinguished (see figure 2 below). The external
verification in Sierra Leone looked at facility registers as well as actual patient visits, by means of
random sampling of patients and asking for a confirmation of the reported visit.
14
The findings of the inception mission are reported in the PBF External Verification Inception Report, Cordaid, 18 Dec 2013 15
The preliminary findings of the analysis are reported in the PBF External Verification Issues Paper, Cordaid, 20 March 2014
EXTERNAL VERIFICATION PERFORMANCE BASED FINANCING SIERRA LEONE 23
VOLUME 1 MAIN REPORT
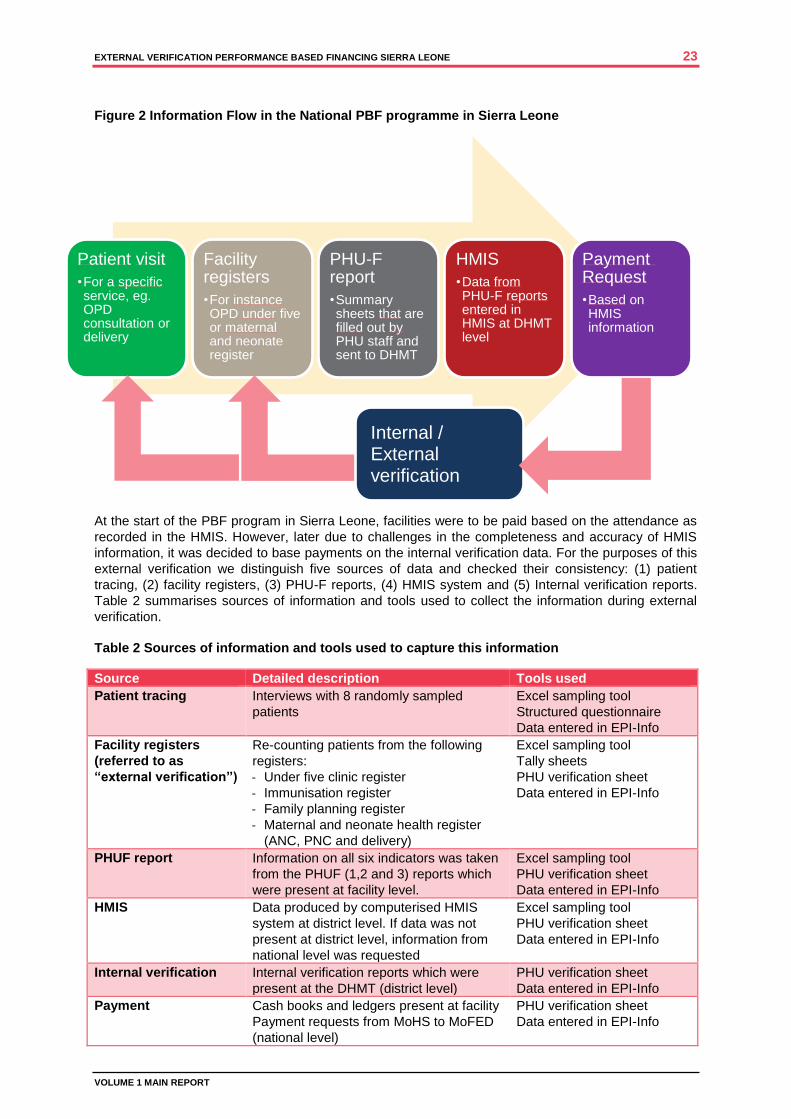
Figure 2 Information Flow in the National PBF programme in Sierra Leone
At the start of the PBF program in Sierra Leone, facilities were to be paid based on the attendance as
recorded in the HMIS. However, later due to challenges in the completeness and accuracy of HMIS
information, it was decided to base payments on the internal verification data. For the purposes of this
external verification we distinguish five sources of data and checked their consistency: (1) patient
tracing, (2) facility registers, (3) PHU-F reports, (4) HMIS system and (5) Internal verification reports.
Table 2 summarises sources of information and tools used to collect the information during external
verification.
Table 2 Sources of information and tools used to capture this information
Source Detailed description Tools used
Patient tracing Interviews with 8 randomly sampled
patients
Excel sampling tool
Structured questionnaire
Data entered in EPI-Info
Facility registers
(referred to as
“external verification”)
Re-counting patients from the following
registers:
- Under five clinic register
- Immunisation register
- Family planning register
- Maternal and neonate health register
(ANC, PNC and delivery)
Excel sampling tool
Tally sheets
PHU verification sheet
Data entered in EPI-Info
PHUF report Information on all six indicators was taken
from the PHUF (1,2 and 3) reports which
were present at facility level.
Excel sampling tool
PHU verification sheet
Data entered in EPI-Info
HMIS Data produced by computerised HMIS
system at district level. If data was not
present at district level, information from
national level was requested
Excel sampling tool
PHU verification sheet
Data entered in EPI-Info
Internal verification Internal verification reports which were
present at the DHMT (district level)
PHU verification sheet
Data entered in EPI-Info
Payment Cash books and ledgers present at facility
Payment requests from MoHS to MoFED
(national level)
PHU verification sheet
Data entered in EPI-Info
Patient visit
•For a specific service, eg. OPD consultation or delivery
Facility registers
•For instance OPD under five or maternal and neonate register
PHU-F report
•Summary sheets that are filled out by PHU staff and sent to DHMT
HMIS
•Data from PHU-F reports entered in HMIS at DHMT level
Payment Request
•Based on HMIS information
Internal / External verification
EXTERNAL VERIFICATION PERFORMANCE BASED FINANCING SIERRA LEONE 24
VOLUME 1 MAIN REPORT
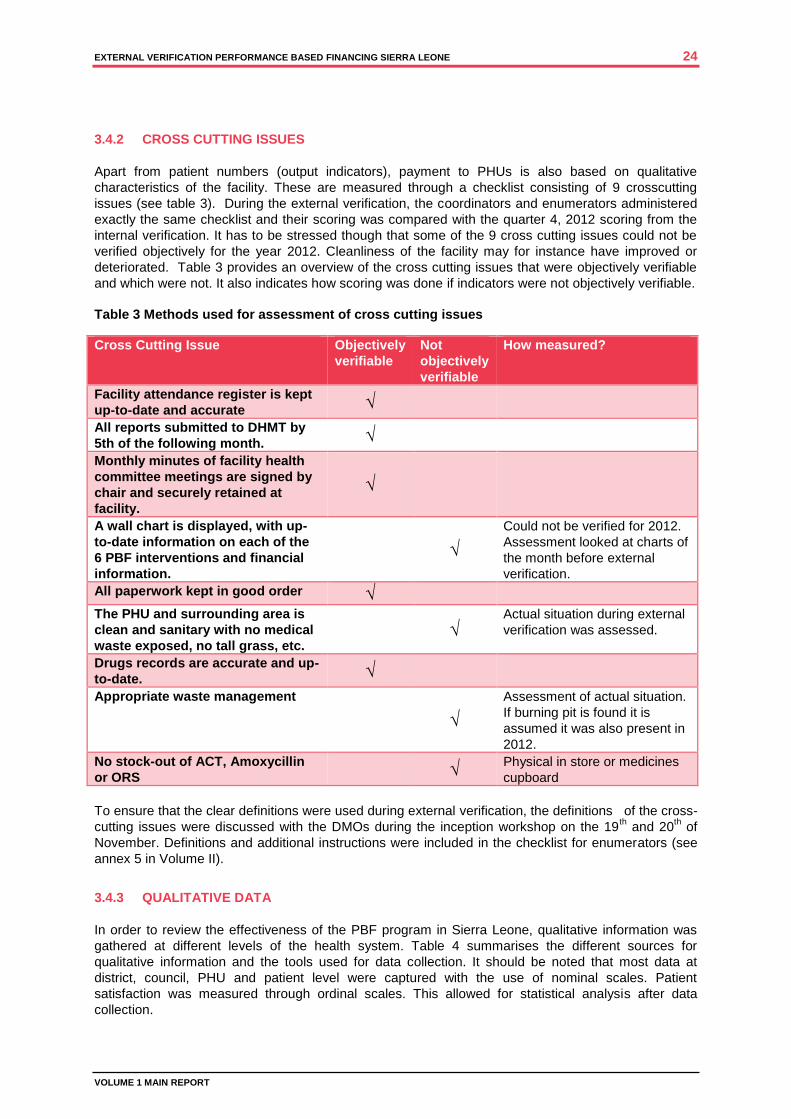
3.4.2 CROSS CUTTING ISSUES
Apart from patient numbers (output indicators), payment to PHUs is also based on qualitative
characteristics of the facility. These are measured through a checklist consisting of 9 crosscutting
issues (see table 3). During the external verification, the coordinators and enumerators administered
exactly the same checklist and their scoring was compared with the quarter 4, 2012 scoring from the
internal verification. It has to be stressed though that some of the 9 cross cutting issues could not be
verified objectively for the year 2012. Cleanliness of the facility may for instance have improved or
deteriorated. Table 3 provides an overview of the cross cutting issues that were objectively verifiable
and which were not. It also indicates how scoring was done if indicators were not objectively verifiable.
Table 3 Methods used for assessment of cross cutting issues
Cross Cutting Issue Objectively
verifiable
Not
objectively
verifiable
How measured?
Facility attendance register is kept
up-to-date and accurate √
All reports submitted to DHMT by
5th of the following month. √
Monthly minutes of facility health
committee meetings are signed by
chair and securely retained at
facility.
√
A wall chart is displayed, with up-
to-date information on each of the
6 PBF interventions and financial
information.
√
Could not be verified for 2012.
Assessment looked at charts of
the month before external
verification.
All paperwork kept in good order √
The PHU and surrounding area is
clean and sanitary with no medical
waste exposed, no tall grass, etc. √
Actual situation during external
verification was assessed.
Drugs records are accurate and up-
to-date. √
Appropriate waste management
√
Assessment of actual situation.
If burning pit is found it is
assumed it was also present in
2012.
No stock-out of ACT, Amoxycillin
or ORS √
Physical in store or medicines
cupboard
To ensure that the clear definitions were used during external verification, the definitions of the cross-
cutting issues were discussed with the DMOs during the inception workshop on the 19th and 20
th of
November. Definitions and additional instructions were included in the checklist for enumerators (see
annex 5 in Volume II).
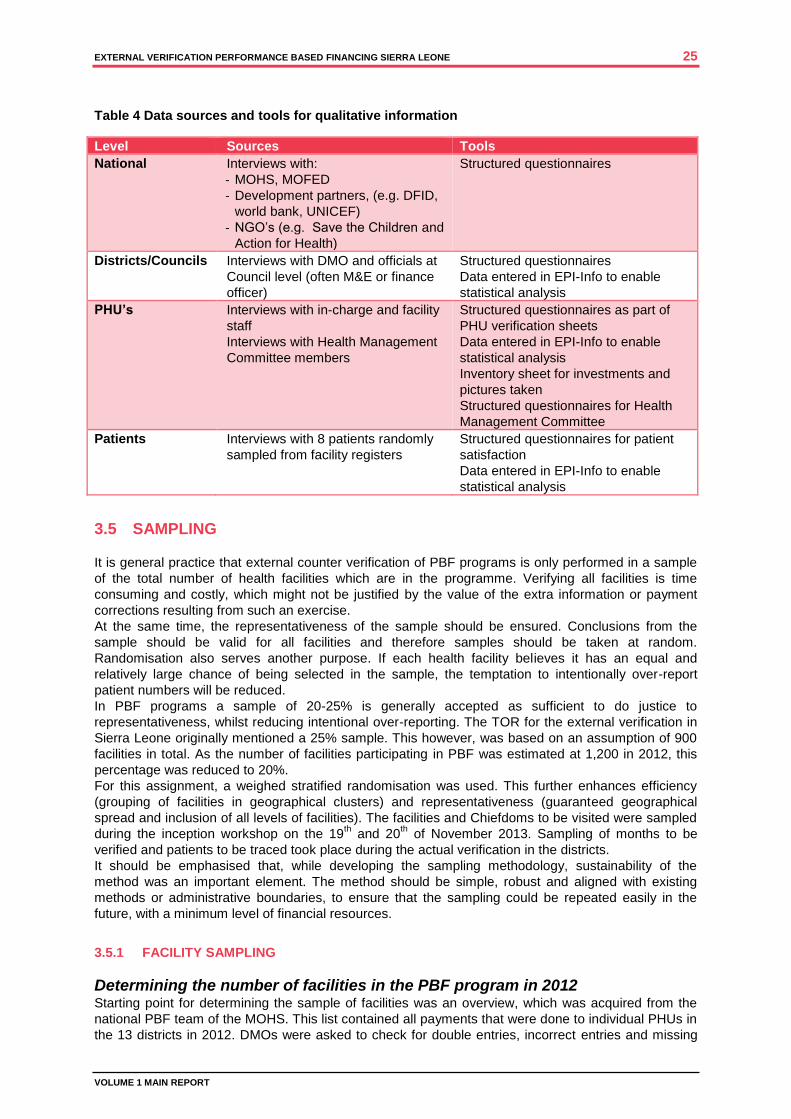
3.4.3 QUALITATIVE DATA
In order to review the effectiveness of the PBF program in Sierra Leone, qualitative information was
gathered at different levels of the health system. Table 4 summarises the different sources for
qualitative information and the tools used for data collection. It should be noted that most data at
district, council, PHU and patient level were captured with the use of nominal scales. Patient
satisfaction was measured through ordinal scales. This allowed for statistical analysis after data
collection.
EXTERNAL VERIFICATION PERFORMANCE BASED FINANCING SIERRA LEONE 25
VOLUME 1 MAIN REPORT
Table 4 Data sources and tools for qualitative information
Level Sources Tools
National Interviews with:
- MOHS, MOFED
- Development partners, (e.g. DFID,
world bank, UNICEF)
- NGO’s (e.g. Save the Children and
Action for Health)
Structured questionnaires
Districts/Councils Interviews with DMO and officials at
Council level (often M&E or finance
officer)
Structured questionnaires
Data entered in EPI-Info to enable
statistical analysis
PHU’s Interviews with in-charge and facility
staff
Interviews with Health Management
Committee members
Structured questionnaires as part of
PHU verification sheets
Data entered in EPI-Info to enable
statistical analysis
Inventory sheet for investments and
pictures taken
Structured questionnaires for Health
Management Committee
Patients Interviews with 8 patients randomly
sampled from facility registers
Structured questionnaires for patient
satisfaction
Data entered in EPI-Info to enable
statistical analysis
3.5 SAMPLING
It is general practice that external counter verification of PBF programs is only performed in a sample
of the total number of health facilities which are in the programme. Verifying all facilities is time
consuming and costly, which might not be justified by the value of the extra information or payment
corrections resulting from such an exercise.
At the same time, the representativeness of the sample should be ensured. Conclusions from the
sample should be valid for all facilities and therefore samples should be taken at random.
Randomisation also serves another purpose. If each health facility believes it has an equal and
relatively large chance of being selected in the sample, the temptation to intentionally over-report
patient numbers will be reduced.
In PBF programs a sample of 20-25% is generally accepted as sufficient to do justice to
representativeness, whilst reducing intentional over-reporting. The TOR for the external verification in
Sierra Leone originally mentioned a 25% sample. This however, was based on an assumption of 900
facilities in total. As the number of facilities participating in PBF was estimated at 1,200 in 2012, this
percentage was reduced to 20%.
For this assignment, a weighed stratified randomisation was used. This further enhances efficiency
(grouping of facilities in geographical clusters) and representativeness (guaranteed geographical
spread and inclusion of all levels of facilities). The facilities and Chiefdoms to be visited were sampled
during the inception workshop on the 19th and 20
th of November 2013. Sampling of months to be
verified and patients to be traced took place during the actual verification in the districts.
It should be emphasised that, while developing the sampling methodology, sustainability of the
method was an important element. The method should be simple, robust and aligned with existing
methods or administrative boundaries, to ensure that the sampling could be repeated easily in the
future, with a minimum level of financial resources.
3.5.1 FACILITY SAMPLING
Determining the number of facilities in the PBF program in 2012 Starting point for determining the sample of facilities was an overview, which was acquired from the
national PBF team of the MOHS. This list contained all payments that were done to individual PHUs in
the 13 districts in 2012. DMOs were asked to check for double entries, incorrect entries and missing
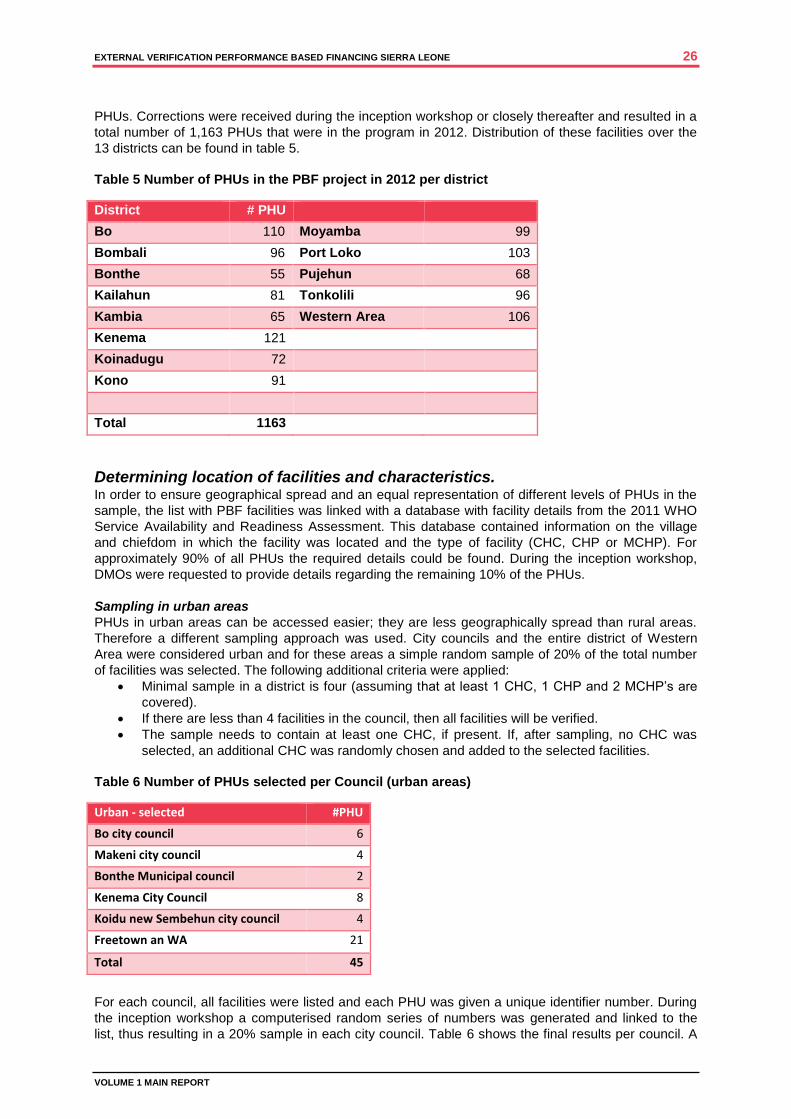
EXTERNAL VERIFICATION PERFORMANCE BASED FINANCING SIERRA LEONE 26
VOLUME 1 MAIN REPORT
PHUs. Corrections were received during the inception workshop or closely thereafter and resulted in a
total number of 1,163 PHUs that were in the program in 2012. Distribution of these facilities over the
13 districts can be found in table 5.
Table 5 Number of PHUs in the PBF project in 2012 per district
District # PHU
Bo 110 Moyamba 99
Bombali 96 Port Loko 103
Bonthe 55 Pujehun 68
Kailahun 81 Tonkolili 96
Kambia 65 Western Area 106
Kenema 121
Koinadugu 72
Kono 91
Total 1163
Determining location of facilities and characteristics. In order to ensure geographical spread and an equal representation of different levels of PHUs in the
sample, the list with PBF facilities was linked with a database with facility details from the 2011 WHO
Service Availability and Readiness Assessment. This database contained information on the village
and chiefdom in which the facility was located and the type of facility (CHC, CHP or MCHP). For
approximately 90% of all PHUs the required details could be found. During the inception workshop,
DMOs were requested to provide details regarding the remaining 10% of the PHUs.
Sampling in urban areas
PHUs in urban areas can be accessed easier; they are less geographically spread than rural areas.
Therefore a different sampling approach was used. City councils and the entire district of Western
Area were considered urban and for these areas a simple random sample of 20% of the total number
of facilities was selected. The following additional criteria were applied:
Minimal sample in a district is four (assuming that at least 1 CHC, 1 CHP and 2 MCHP’s are
covered).
If there are less than 4 facilities in the council, then all facilities will be verified.
The sample needs to contain at least one CHC, if present. If, after sampling, no CHC was
selected, an additional CHC was randomly chosen and added to the selected facilities.
Table 6 Number of PHUs selected per Council (urban areas)
Urban - selected #PHU
Bo city council 6
Makeni city council 4
Bonthe Municipal council 2
Kenema City Council 8
Koidu new Sembehun city council 4
Freetown an WA 21
Total 45
For each council, all facilities were listed and each PHU was given a unique identifier number. During
the inception workshop a computerised random series of numbers was generated and linked to the
list, thus resulting in a 20% sample in each city council. Table 6 shows the final results per council. A

EXTERNAL VERIFICATION PERFORMANCE BASED FINANCING SIERRA LEONE 27
VOLUME 1 MAIN REPORT
detailed list with facility names can be found in Annex 5 of Volume II. All Council samples contained a
CHC.
Sampling in rural areas
Contrary to the approach in urban areas, in rural areas stratified samples were selected. Each rural
Council was divided into 10 geographical areas with a comparable number of facilities. These
geographical areas were primarily based on the existing Chiefdoms. However, if the number of PHUs
per Chiefdom was significantly below average, contiguous Chiefdoms with low PHU numbers were
clustered. If the number of PHUs per Chiefdom was significantly above average, the Chiefdom was
split in two parts. Annex 5 in Volume II provides insight in the number of facilities per geographical
area before and after the re-grouping mentioned above.
For each rural Council all 10 geographical areas were listed and each area was given a unique
number. During the inception workshop two numbers between 1 and 10 were randomly generated in
an Excel sheet for each Council and these numbers were linked to the geographical area. This
resulted in the selection of the following Chiefdoms per council (table 7).
Table 7 Geographical areas selected in each rural Council
Council Chiefdoms
Tonkolili Yoni A, Kunike Barina
Pujehun Soro Gbema, Yakemu Kpukumu Krim (YKK)
Porto Loko Kaffu Bullom, Koya (Porto Loko) A
Moyamba Bagruwa, Timdale, Kaiyamba
Kono Gbane, Gorama Kono, Gbane Kandor, Mafindor
Koinadugu Dembelia Sinkunia , Wara Wara Yagala, Wara Wara Bofadia
Kenema Small Bo, Kandu Leppiama, Dodo, Simbaru, Malegohun
Kailahun Malema, Penguia, Yawei
Kambia Magbema B, Masungbala
Bonthe Bendu Cha, Dema, Jong A
Bombali Libeisaygahun, Sanda Tendaran, Biriwa
Bo Komboya, Niawa Lenga, Badjia, Lugbu
The Chiefdoms of Koya, Magbema and Jong were split and the letter A or B refer to the subgroup. All
facilities in the mentioned Chiefdoms were verified. A full list of facilities verified can be found in Annex
5, Volume II of this report.
Additional Weighing
As mentioned above, the sample was weighed for PHU level. During the inception workshops, the
DMOs and other stakeholders were asked if additional weighing needed to be taken into account, for
instance because of ethnicity, economic status, political orientation of different areas or populations
within the councils. None of the workshop participants deemed this necessary and therefore no
additional weighing was done.
3.5.2 SAMPLING FOR PATIENT TRACING AND PATIENT SATISFACTION SURVEY
Similar to the sampling of facilities, it is not necessary to trace all the patients that visited a health
facility to draw conclusions about the validity of the reported patient numbers and the extent to which
patients are satisfied with the services rendered. In the independent verification of the Sierra Leone
PBF program, 8 patients were randomly chosen in each facility.
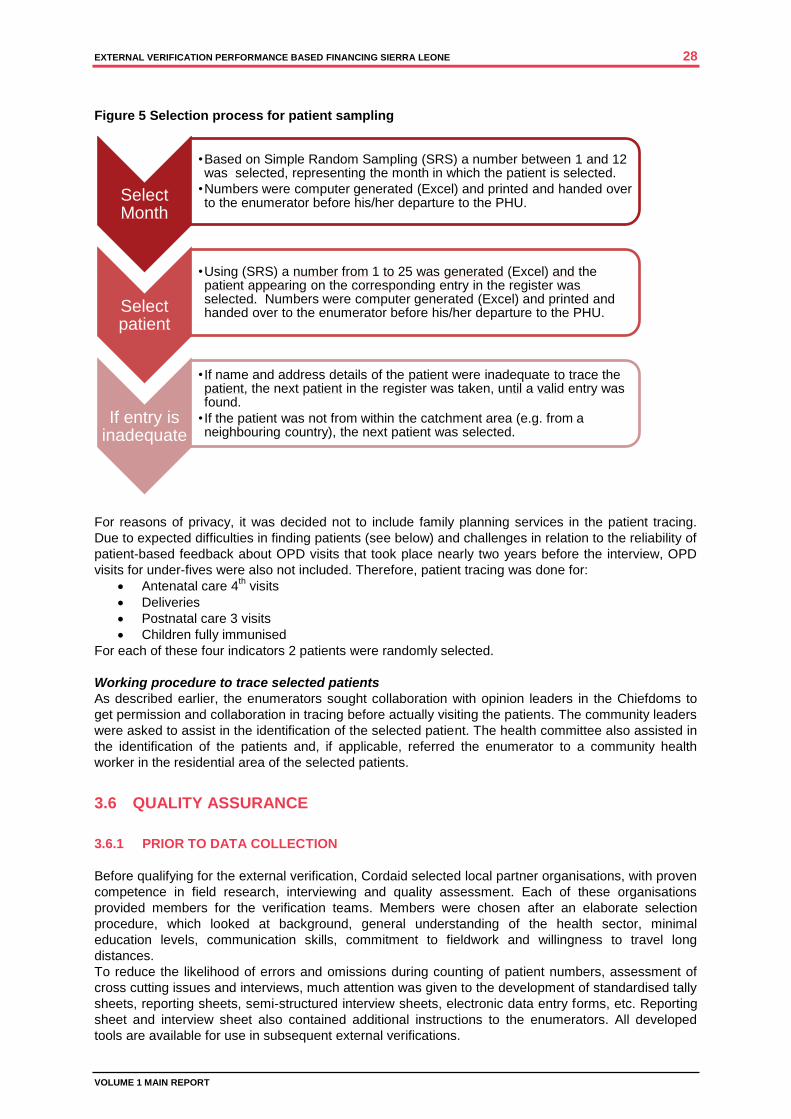
EXTERNAL VERIFICATION PERFORMANCE BASED FINANCING SIERRA LEONE 28
VOLUME 1 MAIN REPORT
Figure 5 Selection process for patient sampling
For reasons of privacy, it was decided not to include family planning services in the patient tracing.
Due to expected difficulties in finding patients (see below) and challenges in relation to the reliability of
patient-based feedback about OPD visits that took place nearly two years before the interview, OPD
visits for under-fives were also not included. Therefore, patient tracing was done for:
Antenatal care 4th visits
Deliveries
Postnatal care 3 visits
Children fully immunised
For each of these four indicators 2 patients were randomly selected.
Working procedure to trace selected patients
As described earlier, the enumerators sought collaboration with opinion leaders in the Chiefdoms to
get permission and collaboration in tracing before actually visiting the patients. The community leaders
were asked to assist in the identification of the selected patient. The health committee also assisted in
the identification of the patients and, if applicable, referred the enumerator to a community health
worker in the residential area of the selected patients.
3.6 QUALITY ASSURANCE
3.6.1 PRIOR TO DATA COLLECTION
Before qualifying for the external verification, Cordaid selected local partner organisations, with proven
competence in field research, interviewing and quality assessment. Each of these organisations
provided members for the verification teams. Members were chosen after an elaborate selection
procedure, which looked at background, general understanding of the health sector, minimal
education levels, communication skills, commitment to fieldwork and willingness to travel long
distances.
To reduce the likelihood of errors and omissions during counting of patient numbers, assessment of
cross cutting issues and interviews, much attention was given to the development of standardised tally
sheets, reporting sheets, semi-structured interview sheets, electronic data entry forms, etc. Reporting
sheet and interview sheet also contained additional instructions to the enumerators. All developed
tools are available for use in subsequent external verifications.
Select Month
•Based on Simple Random Sampling (SRS) a number between 1 and 12 was selected, representing the month in which the patient is selected.
•Numbers were computer generated (Excel) and printed and handed over to the enumerator before his/her departure to the PHU.
Select patient
•Using (SRS) a number from 1 to 25 was generated (Excel) and the patient appearing on the corresponding entry in the register was selected. Numbers were computer generated (Excel) and printed and handed over to the enumerator before his/her departure to the PHU.
If entry is inadequate
• If name and address details of the patient were inadequate to trace the patient, the next patient in the register was taken, until a valid entry was found.
• If the patient was not from within the catchment area (e.g. from a neighbouring country), the next patient was selected.
EXTERNAL VERIFICATION PERFORMANCE BASED FINANCING SIERRA LEONE 29
VOLUME 1 MAIN REPORT
Another important part of the preparation for data collection consisted of an 6-day training for
coordinators and enumerators. This training took place from 6 to 11 January 2014 in Bo and focused
on general information with regard to the health system and data collection, data entry in EPI info, re-
counting patients from the different registers, interpretation of PHUF forms, interpretation of internal
verification forms and interview techniques. At the end of the training was a simulation exercise was
done. This allowed for field-testing of all instruments and procedures by the enumerators and
coordinators.
3.6.2 DURING THE VERIFICATION
The actual external verification exercise start immediately after finalising the training. During the first
two weeks, enumerators and coordinators operated in teams of two. This enabled them to correct
each other and ask for a second opinion in case of doubt. After two weeks, enumerators and
coordinators visited PHU and patients individually. However, several procedures were developed to
allow the enumerators to consult their colleagues or supervisors. First of all, the verification team
coordinators could be contacted by phone for consultation. In addition, it was agreed that the
enumerators took pictures of registers and forms if they doubted the correctness of entries. These
pictures were then discussed with the coordinators, and, if necessary, forwarded for a second opinion
to the supervisors.
During the fieldwork the coordinators crosschecked enumerators, when receiving their reports. This
included an assessment of the completeness of forms and validation when entering data in computer.
In case of large deviations the coordinators contacted the enumerator and discussed whether re-
verification was necessary.
The national supervisors joined each verification team during a period of approximately one week.
This allowed them to apply corrective measures and provide additional instructions to the coordinators
and enumerators. In addition they validated data entry by analysing large deviations and discussing
inconsistencies with the team coordinators.
3.6.3 AFTER DATA COLLECTION
The final data that were entered in EPI-info were exported to Excel and STATA for further analysis.
However, before starting the analysis, the database was validated in two ways:
1. Outliers and irrational entries, e.g. blank entries for external verification or zero-scores for all
indicators in HMIS, were identified. For these cases, the original verification sheets were
examined and, if necessary, corrections were made. Eight cases were found and corrected.
2. A sample of five PHUs per district was taken (representing 25% of all PHUs) and all entries on
the original verification sheet of those PHUs were crosschecked with the data appearing in the
database. Less than 0.2% errors were found. If applicable, data were corrected.
3.7 RELIABILITY AND SIGNIFICANCE
3.7.1 RELIABILITY OF DATA
As described in the previous paragraph, all data were validated before analysis took place. During
validation, errors were found in approximately 0.2% of all data entries. In view of this low percentage
and the fact that found errors were corrected, the internal reliability of the database for the external
verification can be considered high.
3.7.2 EQUAL DISTRIBUTION OF FACILITIES
Figure 6 shows the final number of PHU’s selected for verification.
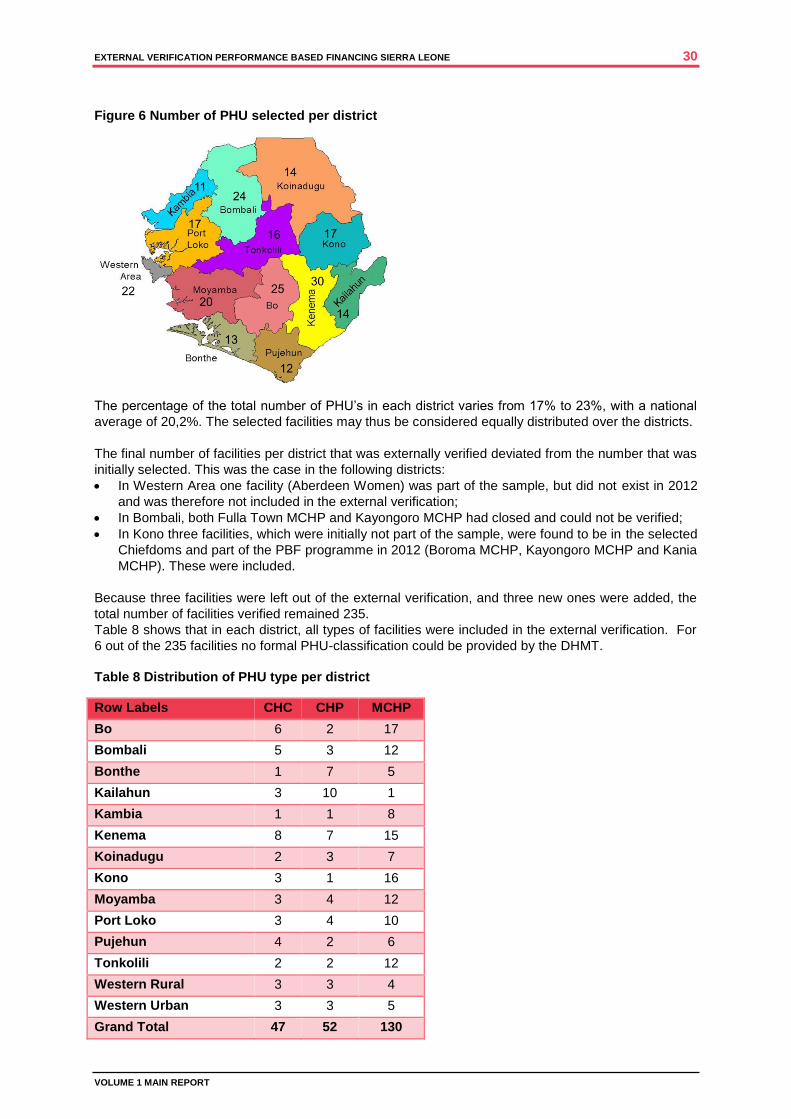
EXTERNAL VERIFICATION PERFORMANCE BASED FINANCING SIERRA LEONE 30
VOLUME 1 MAIN REPORT
Figure 6 Number of PHU selected per district
The percentage of the total number of PHU’s in each district varies from 17% to 23%, with a national
average of 20,2%. The selected facilities may thus be considered equally distributed over the districts.
The final number of facilities per district that was externally verified deviated from the number that was
initially selected. This was the case in the following districts:
In Western Area one facility (Aberdeen Women) was part of the sample, but did not exist in 2012
and was therefore not included in the external verification;
In Bombali, both Fulla Town MCHP and Kayongoro MCHP had closed and could not be verified;
In Kono three facilities, which were initially not part of the sample, were found to be in the selected
Chiefdoms and part of the PBF programme in 2012 (Boroma MCHP, Kayongoro MCHP and Kania
MCHP). These were included.
Because three facilities were left out of the external verification, and three new ones were added, the
total number of facilities verified remained 235.
Table 8 shows that in each district, all types of facilities were included in the external verification. For
6 out of the 235 facilities no formal PHU-classification could be provided by the DHMT.
Table 8 Distribution of PHU type per district
Row Labels CHC CHP MCHP
Bo 6 2 17
Bombali 5 3 12
Bonthe 1 7 5
Kailahun 3 10 1
Kambia 1 1 8
Kenema 8 7 15
Koinadugu 2 3 7
Kono 3 1 16
Moyamba 3 4 12
Port Loko 3 4 10
Pujehun 4 2 6
Tonkolili 2 2 12
Western Rural 3 3 4
Western Urban 3 3 5
Grand Total 47 52 130
EXTERNAL VERIFICATION PERFORMANCE BASED FINANCING SIERRA LEONE 31
VOLUME 1 MAIN REPORT
3.7.3 SIGNIFICANCE OF PHU DATA
The sampling exercise that took place during the inception workshop resulted in 235 PHUs selected
out of the total of 1.163 that received a payment as part of the PBF programme in 2012. The question
is how significant conclusions are, that can be drawn on the basis of the findings in the sample. For
this purpose, a sample size calculation can be used (figure 7). Such a calculation is generally applied
in statistical research16
.
Figure 7 Formula for calculating sample size
( ) ( )
The formula indicates that, with a confidence level of 95% and a sample of 235 PHUs, the outcomes
for the entire population (1,163 facilities) can be predicted with a 6% precision. In other words: If 50%
of the facilities in the sample reported stock-outs of registers, there is a 95% chance that the score will
be between 44% and 56% for all PHUs in the PBF programme. Therefore, conclusions from the
selected sample can be considered powerful. The conclusions of the external verification may be
considered valid for all PHUs in the PBF programme.
3.7.4 SIGNIFICANCE OF PATIENT SATISFACTION DATA
Similar to the calculation for statistical significance that was made for the facility sample (see figure 7),
a calculation can be made for the sample of patients. In total, 1,234 patients were interviewed. With
this number and a confidence level of 95%, the outcomes for the entire population (estimated at 6
million for 2011 according to the United Nations) can be predicted with a 2.5% precision. In other
words, it can be assumed that if the survey shows that 30% of the patients had to pay for services,
there is a 95% chance that between 27.5% and 32.5% of the entire population of Sierra Leone had to
pay for services. Therefore, conclusions from patient tracing and the satisfaction survey can be
considered powerful. The conclusions of the external verification may be considered valid for the
population of Sierra Leone.
3.7.5 COMPLETENESS OF DATA
In order to analyse the consistency between external verification, internal verification, HMIS and the
PHU F-reports, all information from mentioned sources has to be available and accessible. However,
the external verification encountered problems with completeness of information. Figure 8 provides an
example on the availability of data for family planning, one of the indicators in the PBF programme.
16
Naing L, Winn T and Rusli BN. Sample size calculator for prevalence studies, Version 1.0.01. Available at: http://www.kck.usm.my/ppsg/stats_resources.htm Daniel, WW (1999). Biostatistics: A Foundation for Analysis in the Health Sciences. Wiley & Sons, New York
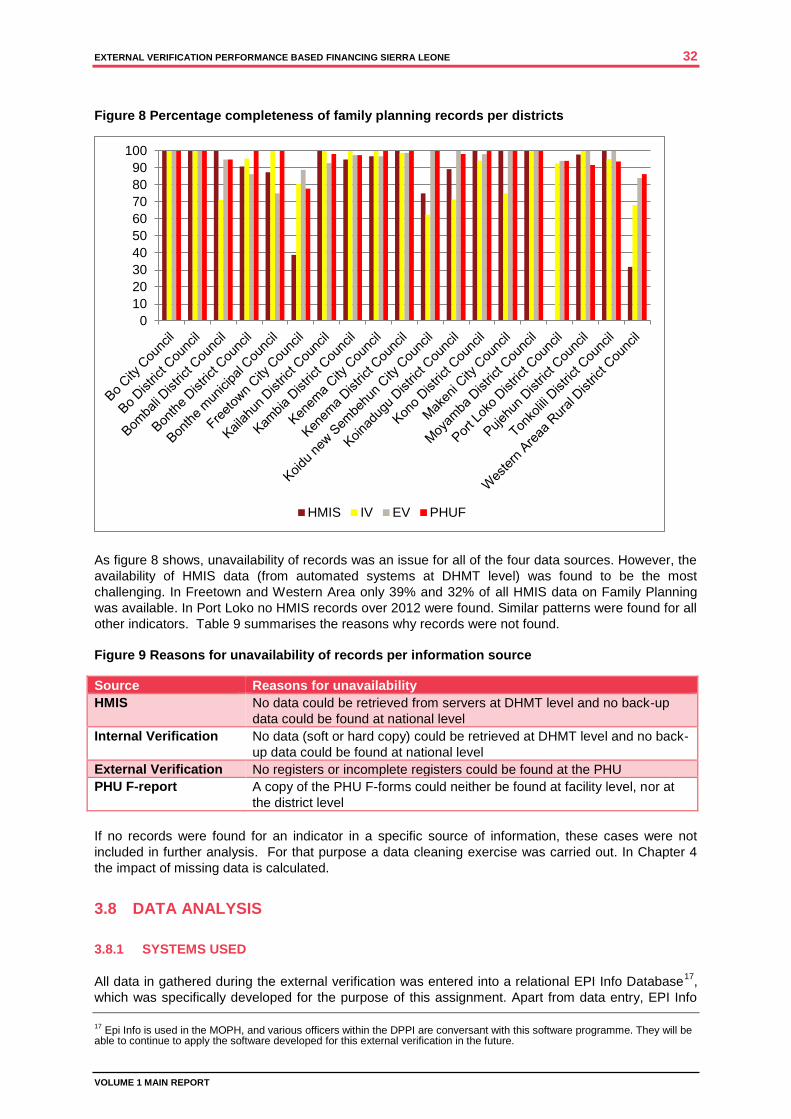
EXTERNAL VERIFICATION PERFORMANCE BASED FINANCING SIERRA LEONE 32
VOLUME 1 MAIN REPORT
Figure 8 Percentage completeness of family planning records per districts
As figure 8 shows, unavailability of records was an issue for all of the four data sources. However, the
availability of HMIS data (from automated systems at DHMT level) was found to be the most
challenging. In Freetown and Western Area only 39% and 32% of all HMIS data on Family Planning
was available. In Port Loko no HMIS records over 2012 were found. Similar patterns were found for all
other indicators. Table 9 summarises the reasons why records were not found.
Figure 9 Reasons for unavailability of records per information source
Source Reasons for unavailability
HMIS No data could be retrieved from servers at DHMT level and no back-up
data could be found at national level
Internal Verification No data (soft or hard copy) could be retrieved at DHMT level and no back-
up data could be found at national level
External Verification No registers or incomplete registers could be found at the PHU
PHU F-report A copy of the PHU F-forms could neither be found at facility level, nor at
the district level
If no records were found for an indicator in a specific source of information, these cases were not
included in further analysis. For that purpose a data cleaning exercise was carried out. In Chapter 4
the impact of missing data is calculated.
3.8 DATA ANALYSIS
3.8.1 SYSTEMS USED
All data in gathered during the external verification was entered into a relational EPI Info Database17
,
which was specifically developed for the purpose of this assignment. Apart from data entry, EPI Info
17
Epi Info is used in the MOPH, and various officers within the DPPI are conversant with this software programme. They will be able to continue to apply the software developed for this external verification in the future.
0
10
20
30
40
50
60
70
80
90
100
HMIS IV EV PHUF
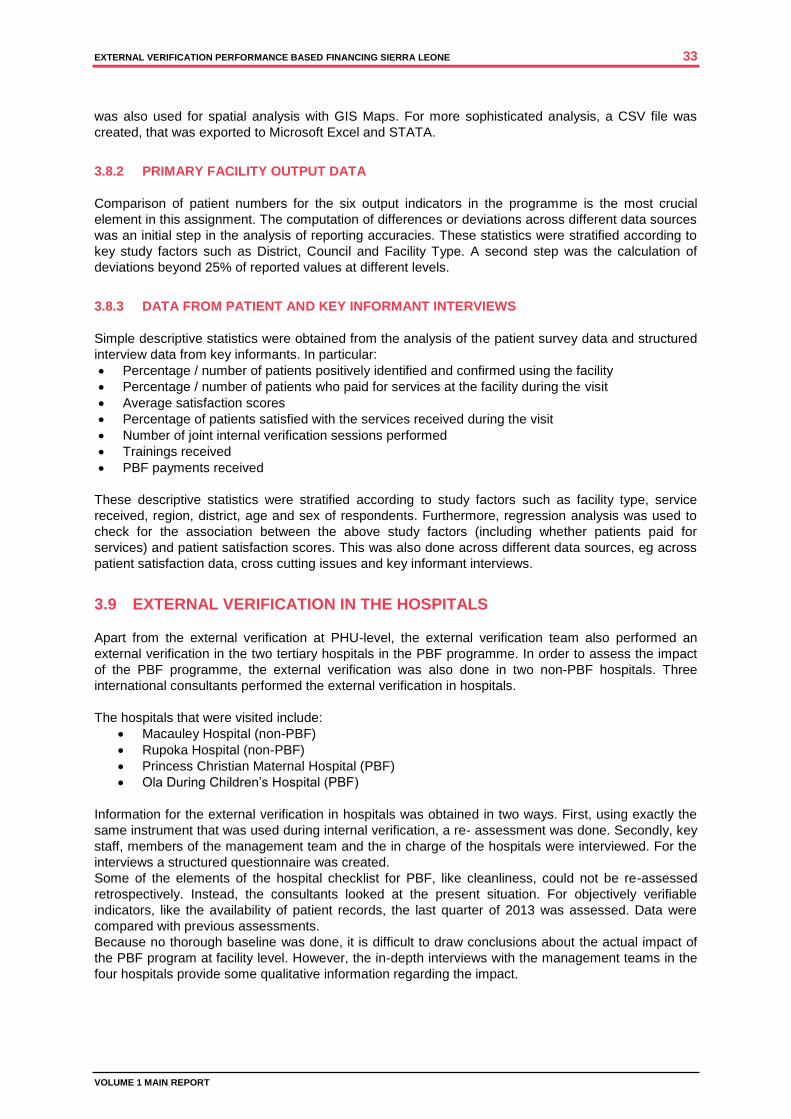
EXTERNAL VERIFICATION PERFORMANCE BASED FINANCING SIERRA LEONE 33
VOLUME 1 MAIN REPORT
was also used for spatial analysis with GIS Maps. For more sophisticated analysis, a CSV file was
created, that was exported to Microsoft Excel and STATA.
3.8.2 PRIMARY FACILITY OUTPUT DATA
Comparison of patient numbers for the six output indicators in the programme is the most crucial
element in this assignment. The computation of differences or deviations across different data sources
was an initial step in the analysis of reporting accuracies. These statistics were stratified according to
key study factors such as District, Council and Facility Type. A second step was the calculation of
deviations beyond 25% of reported values at different levels.
3.8.3 DATA FROM PATIENT AND KEY INFORMANT INTERVIEWS
Simple descriptive statistics were obtained from the analysis of the patient survey data and structured
interview data from key informants. In particular:
Percentage / number of patients positively identified and confirmed using the facility
Percentage / number of patients who paid for services at the facility during the visit
Average satisfaction scores
Percentage of patients satisfied with the services received during the visit
Number of joint internal verification sessions performed
Trainings received
PBF payments received
These descriptive statistics were stratified according to study factors such as facility type, service
received, region, district, age and sex of respondents. Furthermore, regression analysis was used to
check for the association between the above study factors (including whether patients paid for
services) and patient satisfaction scores. This was also done across different data sources, eg across
patient satisfaction data, cross cutting issues and key informant interviews.
3.9 EXTERNAL VERIFICATION IN THE HOSPITALS
Apart from the external verification at PHU-level, the external verification team also performed an
external verification in the two tertiary hospitals in the PBF programme. In order to assess the impact
of the PBF programme, the external verification was also done in two non-PBF hospitals. Three
international consultants performed the external verification in hospitals.
The hospitals that were visited include:
Macauley Hospital (non-PBF)
Rupoka Hospital (non-PBF)
Princess Christian Maternal Hospital (PBF)
Ola During Children’s Hospital (PBF)
Information for the external verification in hospitals was obtained in two ways. First, using exactly the
same instrument that was used during internal verification, a re- assessment was done. Secondly, key
staff, members of the management team and the in charge of the hospitals were interviewed. For the
interviews a structured questionnaire was created.
Some of the elements of the hospital checklist for PBF, like cleanliness, could not be re-assessed
retrospectively. Instead, the consultants looked at the present situation. For objectively verifiable
indicators, like the availability of patient records, the last quarter of 2013 was assessed. Data were
compared with previous assessments.
Because no thorough baseline was done, it is difficult to draw conclusions about the actual impact of
the PBF program at facility level. However, the in-depth interviews with the management teams in the
four hospitals provide some qualitative information regarding the impact.

EXTERNAL VERIFICATION PERFORMANCE BASED FINANCING SIERRA LEONE 34
VOLUME 1 MAIN REPORT

EXTERNAL VERIFICATION PERFORMANCE BASED FINANCING SIERRA LEONE 35
VOLUME 1 MAIN REPORT
4 EXTERNAL VERIFICATION FINDINGS
4.1 INTRODUCTION
The External Verification (EV) consisted of two components of checking the Internal Verification (IV):
Recalculating the output indicators based in recordings in the registers in health facilities;
Repeating the verification of crosscutting (quality) indicators in PHUs and repeating the verification
of hospital (quality) indicators
In addition the EV performed:
Patient tracing and satisfaction survey
Hospital verification of two non-PBF hospitals
The methodology is described in Chapter 3 of this report. This Chapter describes the findings, while in
chapter 7 these findings are put in a bigger context.
4.1.1 INDICATORS
Output indicators
The PBF project in Sierra Leone focuses on improving a number of indicators from the Basic Package
of Essential Health Services, which are part of the Free Healthcare Initiative. It pays a fee-for-service
for: 1. Women of reproductive age using modern family planning (BPEHS 7.2) 2. Pregnant women receiving four antenatal consultations (ANC-IV) (BPEHS 7.1.1) 3. Deliveries conducted under safe conditions (BPEHS 7.1.2) 4. Women receiving three postnatal consultations (PNC-III) (BPEHS 7.1.4) 5. Children under one year of age receiving full and timely course of immunizations (BPEHS 7.6) 6. Outpatient visits with curative services for children under five years old according to Integrated
Management of New-born and Childhood Illness (IMNCI) protocol (BPEHS 7.7)
Crosscutting Issues
In order to stimulate overall performance of the health facilities the PBF project provides additional
incentives for so-called cross cutting issues, which address quality. The following indicators provide a
multiplier for the total payment based on fee-for-service: 1. Recording of staff attendance. 2. Timely submission of DHIS, attendance and PBF reports. 3. A functioning Health Management Committee. 4. Display of up-to-date performance information at the facility. 5. All paperwork kept in good order at the facility. 6. Maintenance of appropriate standards of cleanliness. 7. Appropriate procedures for medical waste management in place and being observed. 8. Maintenance of up-to-date and accurate drugs records. 9. No stock-out of essential drugs for the three childhood diseases with highest mortality
4.1.2 HOSPITAL PBF
In 2012 a pilot was started with hospital PBF in two hospitals in Freetown, closely involved in maternal
and child health, i.e. the Ola During Children’s Hospital and the Princess Christian Maternity Hospital.
The primary focus of hospital PBF is on performance indicators with regard to quality of services,
measured by means of a composite performance score in eight domains as shown in the table below.
Each domain has 3 – 7 indicators, which are either objectively verifiable or more qualitative in nature.
For the performance assessment an extensive checklist is used.
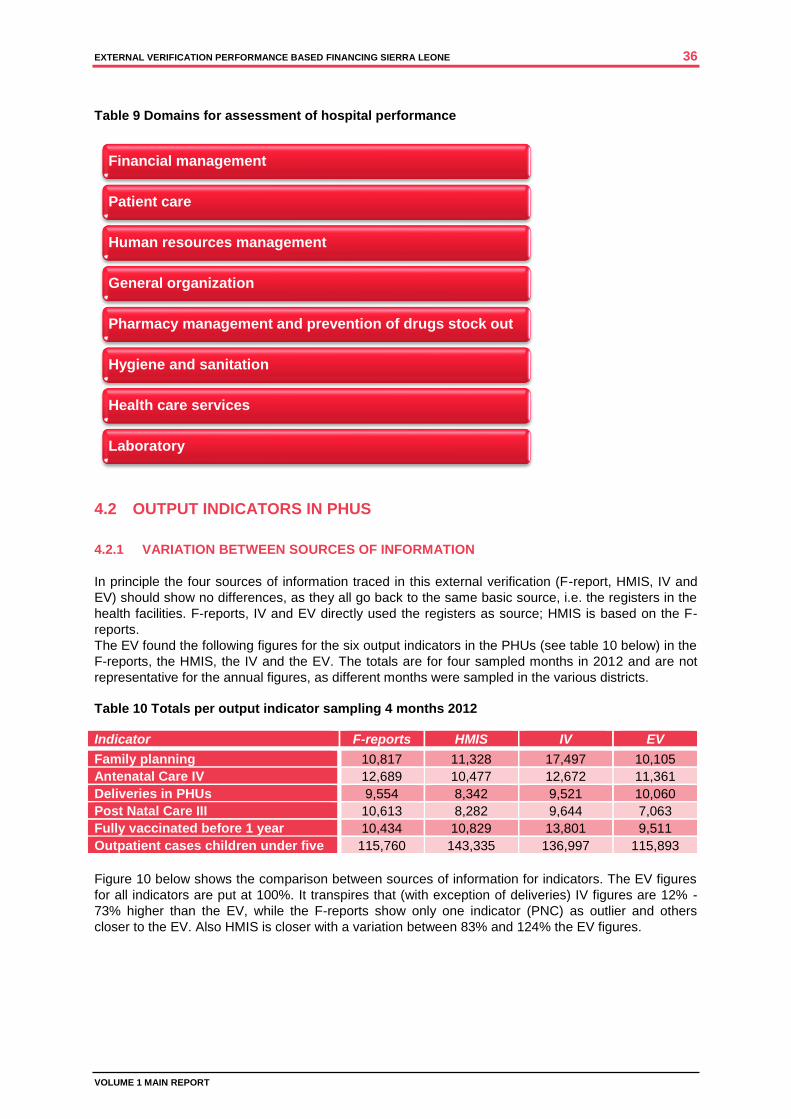
EXTERNAL VERIFICATION PERFORMANCE BASED FINANCING SIERRA LEONE 36
VOLUME 1 MAIN REPORT
Table 9 Domains for assessment of hospital performance
4.2 OUTPUT INDICATORS IN PHUS
4.2.1 VARIATION BETWEEN SOURCES OF INFORMATION
In principle the four sources of information traced in this external verification (F-report, HMIS, IV and
EV) should show no differences, as they all go back to the same basic source, i.e. the registers in the
health facilities. F-reports, IV and EV directly used the registers as source; HMIS is based on the F-
reports.
The EV found the following figures for the six output indicators in the PHUs (see table 10 below) in the
F-reports, the HMIS, the IV and the EV. The totals are for four sampled months in 2012 and are not
representative for the annual figures, as different months were sampled in the various districts.
Table 10 Totals per output indicator sampling 4 months 2012
Indicator F-reports HMIS IV EV
Family planning 10,817 11,328 17,497 10,105
Antenatal Care IV 12,689 10,477 12,672 11,361
Deliveries in PHUs 9,554 8,342 9,521 10,060
Post Natal Care III 10,613 8,282 9,644 7,063
Fully vaccinated before 1 year 10,434 10,829 13,801 9,511
Outpatient cases children under five 115,760 143,335 136,997 115,893
Figure 10 below shows the comparison between sources of information for indicators. The EV figures
for all indicators are put at 100%. It transpires that (with exception of deliveries) IV figures are 12% -
73% higher than the EV, while the F-reports show only one indicator (PNC) as outlier and others
closer to the EV. Also HMIS is closer with a variation between 83% and 124% the EV figures.
Financial management
Patient care
Human resources management
General organization
Pharmacy management and prevention of drugs stock out
Hygiene and sanitation
Health care services
Laboratory
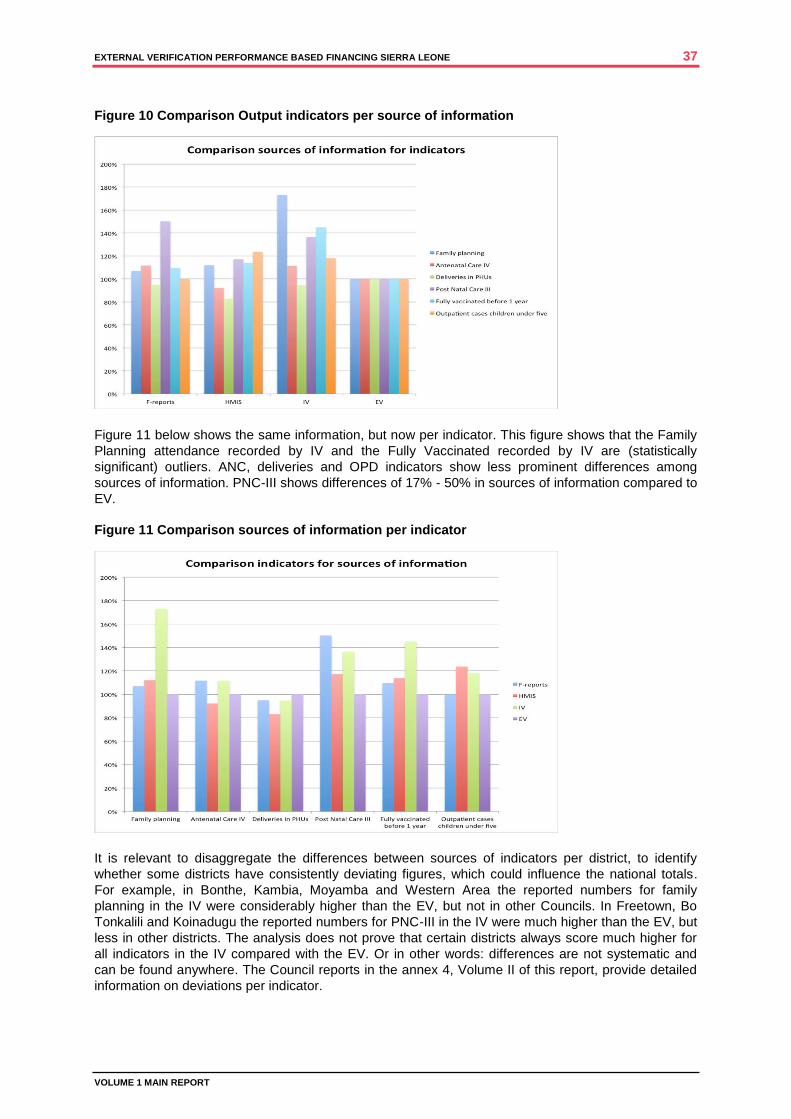
EXTERNAL VERIFICATION PERFORMANCE BASED FINANCING SIERRA LEONE 37
VOLUME 1 MAIN REPORT
Figure 10 Comparison Output indicators per source of information
Figure 11 below shows the same information, but now per indicator. This figure shows that the Family
Planning attendance recorded by IV and the Fully Vaccinated recorded by IV are (statistically
significant) outliers. ANC, deliveries and OPD indicators show less prominent differences among
sources of information. PNC-III shows differences of 17% - 50% in sources of information compared to
EV.
Figure 11 Comparison sources of information per indicator
It is relevant to disaggregate the differences between sources of indicators per district, to identify
whether some districts have consistently deviating figures, which could influence the national totals.
For example, in Bonthe, Kambia, Moyamba and Western Area the reported numbers for family
planning in the IV were considerably higher than the EV, but not in other Councils. In Freetown, Bo
Tonkalili and Koinadugu the reported numbers for PNC-III in the IV were much higher than the EV, but
less in other districts. The analysis does not prove that certain districts always score much higher for
all indicators in the IV compared with the EV. Or in other words: differences are not systematic and
can be found anywhere. The Council reports in the annex 4, Volume II of this report, provide detailed
information on deviations per indicator.
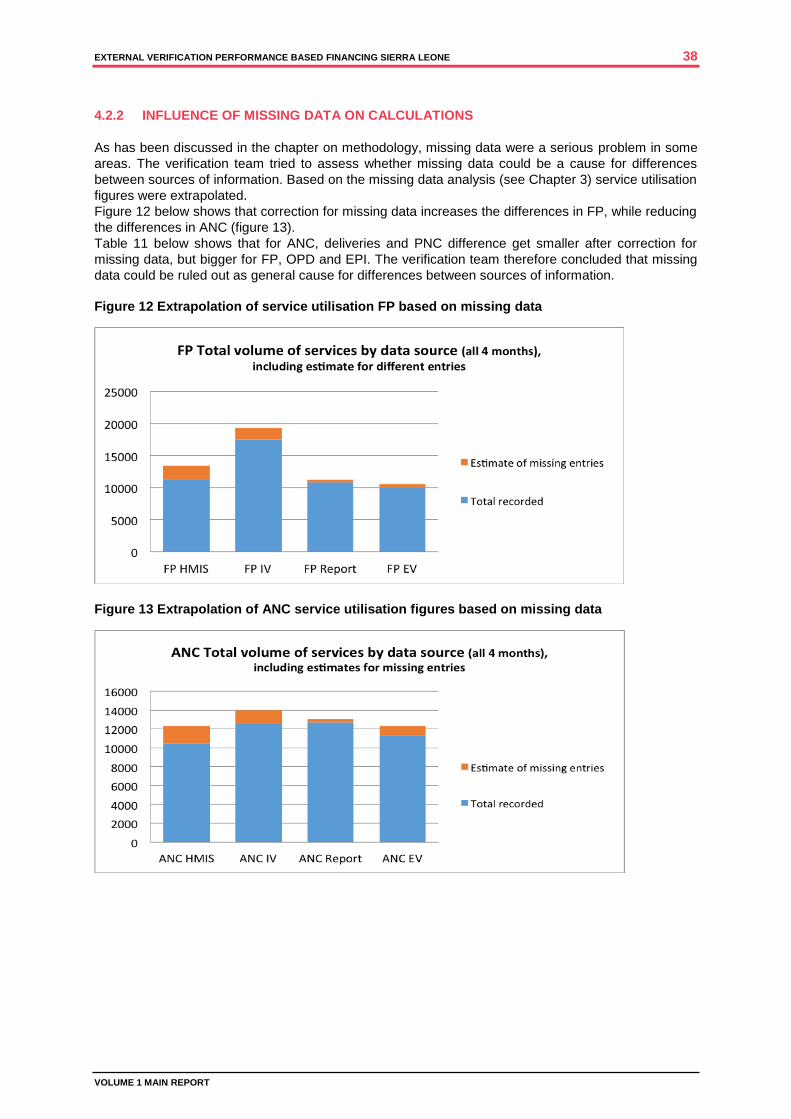
EXTERNAL VERIFICATION PERFORMANCE BASED FINANCING SIERRA LEONE 38
VOLUME 1 MAIN REPORT
4.2.2 INFLUENCE OF MISSING DATA ON CALCULATIONS
As has been discussed in the chapter on methodology, missing data were a serious problem in some
areas. The verification team tried to assess whether missing data could be a cause for differences
between sources of information. Based on the missing data analysis (see Chapter 3) service utilisation
figures were extrapolated.
Figure 12 below shows that correction for missing data increases the differences in FP, while reducing
the differences in ANC (figure 13).
Table 11 below shows that for ANC, deliveries and PNC difference get smaller after correction for
missing data, but bigger for FP, OPD and EPI. The verification team therefore concluded that missing
data could be ruled out as general cause for differences between sources of information.
Figure 12 Extrapolation of service utilisation FP based on missing data
Figure 13 Extrapolation of ANC service utilisation figures based on missing data
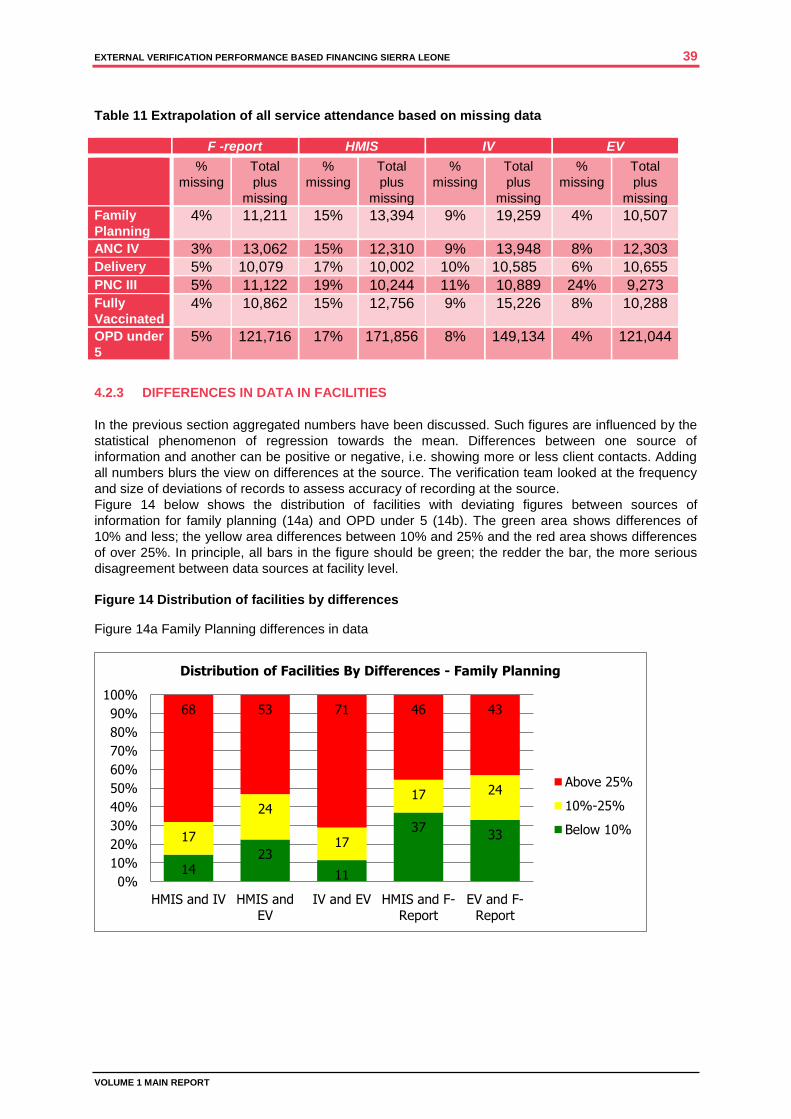
EXTERNAL VERIFICATION PERFORMANCE BASED FINANCING SIERRA LEONE 39
VOLUME 1 MAIN REPORT
Table 11 Extrapolation of all service attendance based on missing data
F -report HMIS IV EV
%
missing
Total
plus
missing
%
missing
Total
plus
missing
%
missing
Total
plus
missing
%
missing
Total
plus
missing
Family
Planning 4% 11,211 15% 13,394 9% 19,259 4% 10,507
ANC IV 3% 13,062 15% 12,310 9% 13,948 8% 12,303
Delivery 5% 10,079 17% 10,002 10% 10,585 6% 10,655
PNC III 5% 11,122 19% 10,244 11% 10,889 24% 9,273
Fully
Vaccinated 4% 10,862 15% 12,756 9% 15,226 8% 10,288
OPD under
5 5% 121,716 17% 171,856 8% 149,134 4% 121,044
4.2.3 DIFFERENCES IN DATA IN FACILITIES
In the previous section aggregated numbers have been discussed. Such figures are influenced by the
statistical phenomenon of regression towards the mean. Differences between one source of
information and another can be positive or negative, i.e. showing more or less client contacts. Adding
all numbers blurs the view on differences at the source. The verification team looked at the frequency
and size of deviations of records to assess accuracy of recording at the source.
Figure 14 below shows the distribution of facilities with deviating figures between sources of
information for family planning (14a) and OPD under 5 (14b). The green area shows differences of
10% and less; the yellow area differences between 10% and 25% and the red area shows differences
of over 25%. In principle, all bars in the figure should be green; the redder the bar, the more serious
disagreement between data sources at facility level.
Figure 14 Distribution of facilities by differences
Figure 14a Family Planning differences in data
14 23
11
37 33 17
24
17
17 24
68 53 71 46 43
0%
10%
20%
30%
40%
50%
60%
70%
80%
90%
100%
HMIS and IV HMIS and
EV
IV and EV HMIS and F-
Report
EV and F-
Report
Distribution of Facilities By Differences - Family Planning
Above 25%
10%-25%
Below 10%
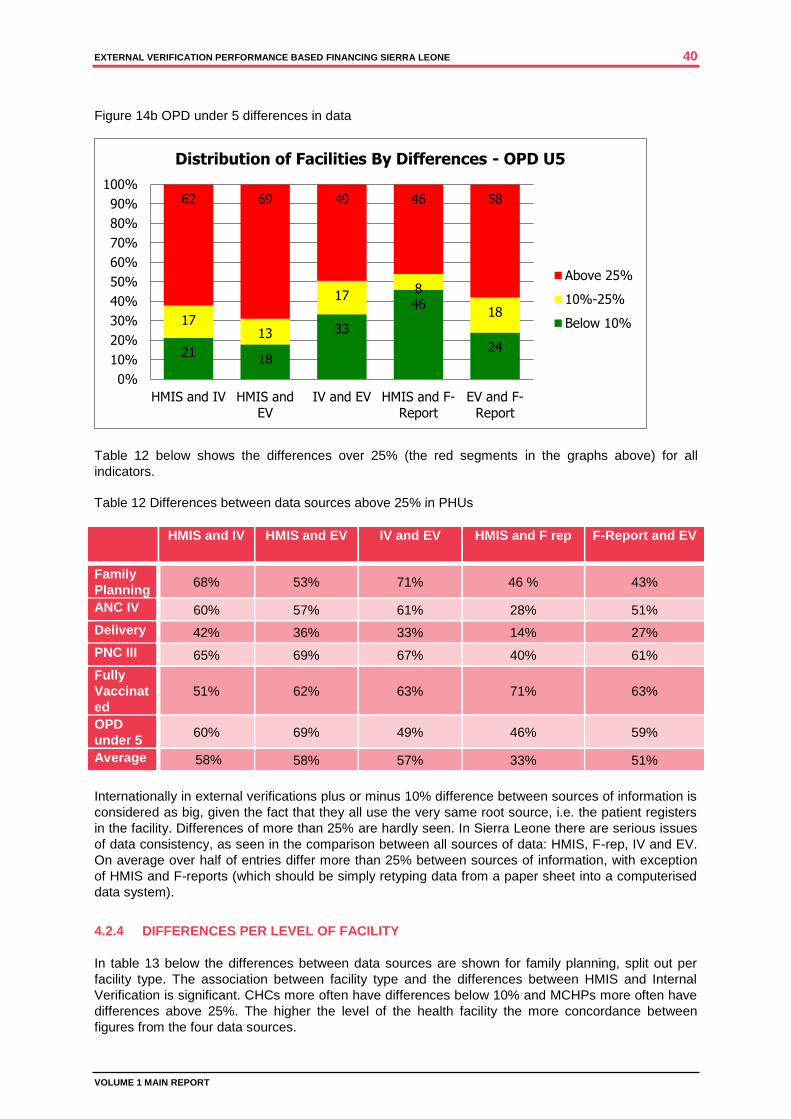
EXTERNAL VERIFICATION PERFORMANCE BASED FINANCING SIERRA LEONE 40
VOLUME 1 MAIN REPORT
Figure 14b OPD under 5 differences in data
Table 12 below shows the differences over 25% (the red segments in the graphs above) for all
indicators.
Table 12 Differences between data sources above 25% in PHUs
HMIS and IV HMIS and EV IV and EV HMIS and F rep F-Report and EV
Family
Planning 68% 53% 71% 46 % 43%
ANC IV 60% 57% 61% 28% 51%
Delivery 42% 36% 33% 14% 27%
PNC III 65% 69% 67% 40% 61%
Fully
Vaccinat
ed
51% 62% 63% 71% 63%
OPD
under 5 60% 69% 49% 46% 59%
Average 58%
58% 57% 33% 51%
Internationally in external verifications plus or minus 10% difference between sources of information is
considered as big, given the fact that they all use the very same root source, i.e. the patient registers
in the facility. Differences of more than 25% are hardly seen. In Sierra Leone there are serious issues
of data consistency, as seen in the comparison between all sources of data: HMIS, F-rep, IV and EV.
On average over half of entries differ more than 25% between sources of information, with exception
of HMIS and F-reports (which should be simply retyping data from a paper sheet into a computerised
data system).
4.2.4 DIFFERENCES PER LEVEL OF FACILITY
In table 13 below the differences between data sources are shown for family planning, split out per
facility type. The association between facility type and the differences between HMIS and Internal
Verification is significant. CHCs more often have differences below 10% and MCHPs more often have
differences above 25%. The higher the level of the health facility the more concordance between
figures from the four data sources.
21 18
33
46
24
17 13
17 8
18
62 69 49 46 58
0%
10%
20%
30%
40%
50%
60%
70%
80%
90%
100%
HMIS and IV HMIS and
EV
IV and EV HMIS and F-
Report
EV and F-
Report
Distribution of Facilities By Differences - OPD U5
Above 25%
10%-25%
Below 10%
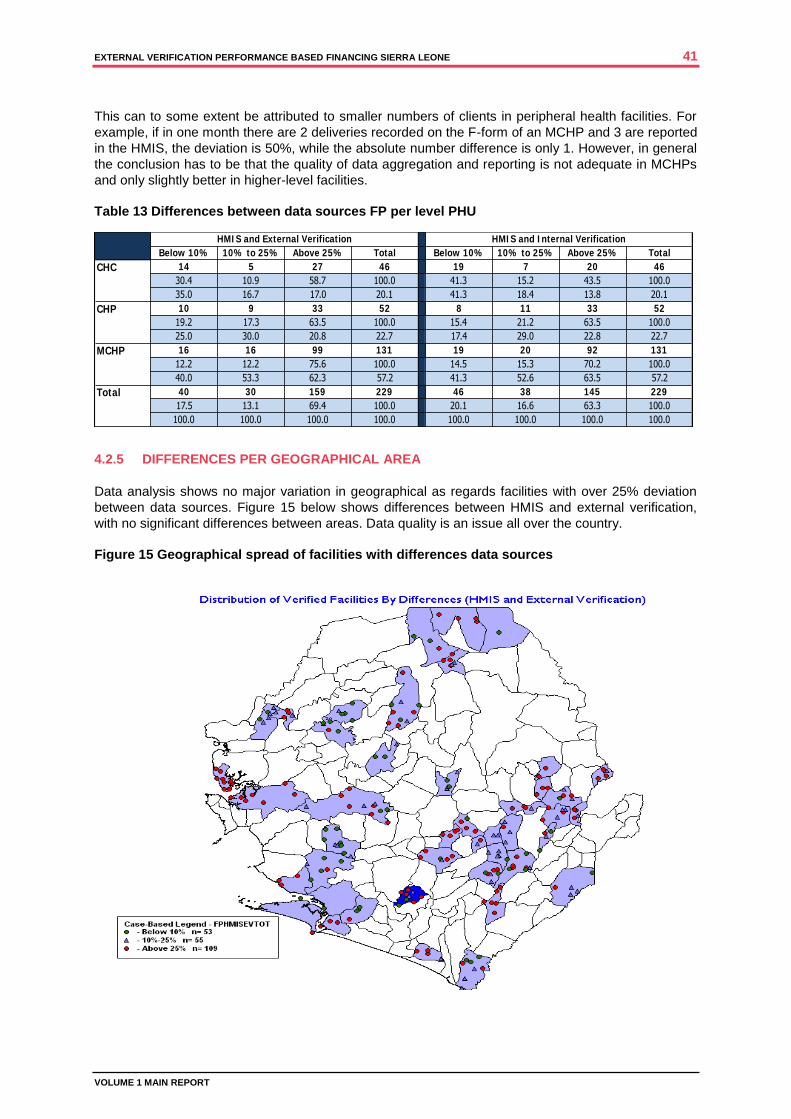
EXTERNAL VERIFICATION PERFORMANCE BASED FINANCING SIERRA LEONE 41
VOLUME 1 MAIN REPORT
This can to some extent be attributed to smaller numbers of clients in peripheral health facilities. For
example, if in one month there are 2 deliveries recorded on the F-form of an MCHP and 3 are reported
in the HMIS, the deviation is 50%, while the absolute number difference is only 1. However, in general
the conclusion has to be that the quality of data aggregation and reporting is not adequate in MCHPs
and only slightly better in higher-level facilities.
Table 13 Differences between data sources FP per level PHU
4.2.5 DIFFERENCES PER GEOGRAPHICAL AREA
Data analysis shows no major variation in geographical as regards facilities with over 25% deviation
between data sources. Figure 15 below shows differences between HMIS and external verification,
with no significant differences between areas. Data quality is an issue all over the country.
Figure 15 Geographical spread of facilities with differences data sources
Below 10% 10% to 25% Above 25% Total Below 10% 10% to 25% Above 25% Total
14 5 27 46 19 7 20 46
30.4 10.9 58.7 100.0 41.3 15.2 43.5 100.0
35.0 16.7 17.0 20.1 41.3 18.4 13.8 20.1
10 9 33 52 8 11 33 52
19.2 17.3 63.5 100.0 15.4 21.2 63.5 100.0
25.0 30.0 20.8 22.7 17.4 29.0 22.8 22.7
16 16 99 131 19 20 92 131
12.2 12.2 75.6 100.0 14.5 15.3 70.2 100.0
40.0 53.3 62.3 57.2 41.3 52.6 63.5 57.2
40 30 159 229 46 38 145 229
17.5 13.1 69.4 100.0 20.1 16.6 63.3 100.0
100.0 100.0 100.0 100.0 100.0 100.0 100.0 100.0
Total
HMI S and External Verification HMI S and I nternal Verification
CHC
CHP
MCHP
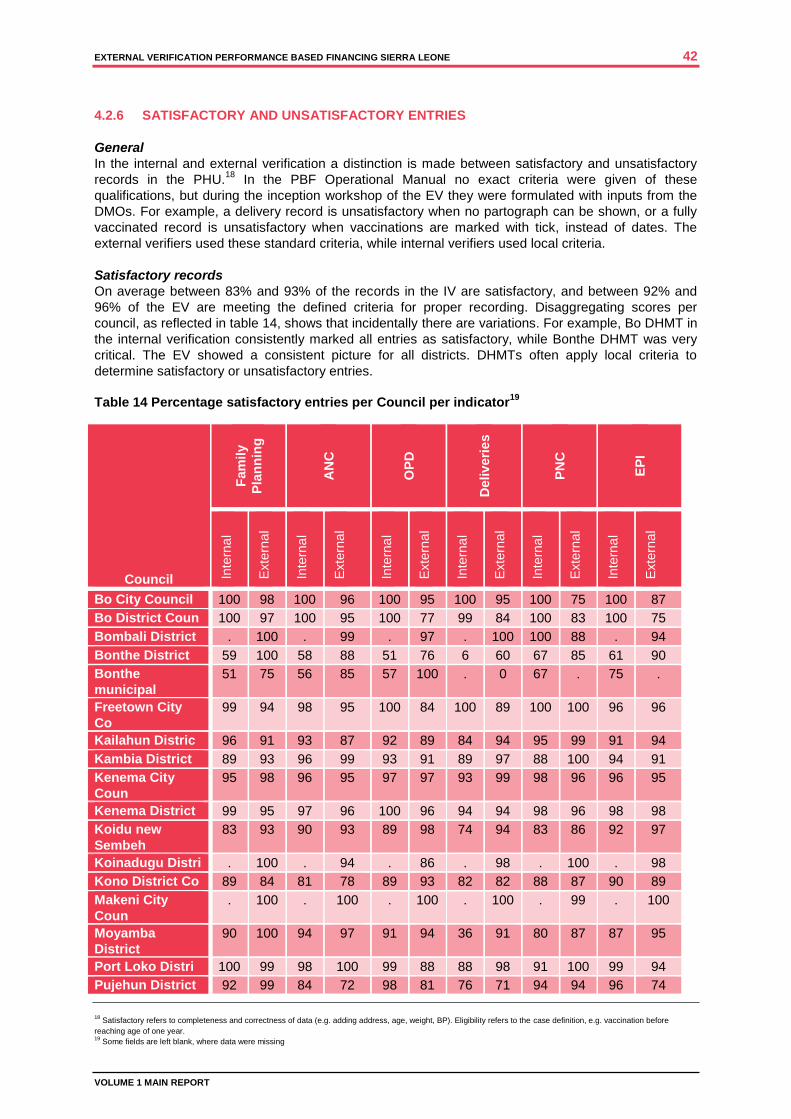
EXTERNAL VERIFICATION PERFORMANCE BASED FINANCING SIERRA LEONE 42
VOLUME 1 MAIN REPORT
4.2.6 SATISFACTORY AND UNSATISFACTORY ENTRIES
General
In the internal and external verification a distinction is made between satisfactory and unsatisfactory
records in the PHU.18
In the PBF Operational Manual no exact criteria were given of these
qualifications, but during the inception workshop of the EV they were formulated with inputs from the
DMOs. For example, a delivery record is unsatisfactory when no partograph can be shown, or a fully
vaccinated record is unsatisfactory when vaccinations are marked with tick, instead of dates. The
external verifiers used these standard criteria, while internal verifiers used local criteria.
Satisfactory records
On average between 83% and 93% of the records in the IV are satisfactory, and between 92% and
96% of the EV are meeting the defined criteria for proper recording. Disaggregating scores per
council, as reflected in table 14, shows that incidentally there are variations. For example, Bo DHMT in
the internal verification consistently marked all entries as satisfactory, while Bonthe DHMT was very
critical. The EV showed a consistent picture for all districts. DHMTs often apply local criteria to
determine satisfactory or unsatisfactory entries.
Table 14 Percentage satisfactory entries per Council per indicator
19
Council
Fam
ily
Pla
nn
ing
AN
C
OP
D
Deliv
eri
es
PN
C
EP
I
Inte
rna
l
Exte
rna
l
Inte
rna
l
Exte
rna
l
Inte
rna
l
Exte
rna
l
Inte
rna
l
Exte
rna
l
Inte
rna
l
Exte
rna
l
Inte
rna
l
Exte
rna
l
Bo City Council 100 98 100 96 100 95 100 95 100 75 100 87
Bo District Coun 100 97 100 95 100 77 99 84 100 83 100 75
Bombali District . 100 . 99 . 97 . 100 100 88 . 94
Bonthe District 59 100 58 88 51 76 6 60 67 85 61 90
Bonthe
municipal
51 75 56 85 57 100 . 0 67 . 75 .
Freetown City
Co
99 94 98 95 100 84 100 89 100 100 96 96
Kailahun Distric 96 91 93 87 92 89 84 94 95 99 91 94
Kambia District 89 93 96 99 93 91 89 97 88 100 94 91
Kenema City
Coun
95 98 96 95 97 97 93 99 98 96 96 95
Kenema District 99 95 97 96 100 96 94 94 98 96 98 98
Koidu new
Sembeh
83 93 90 93 89 98 74 94 83 86 92 97
Koinadugu Distri . 100 . 94 . 86 . 98 . 100 . 98
Kono District Co 89 84 81 78 89 93 82 82 88 87 90 89
Makeni City
Coun
. 100 . 100 . 100 . 100 . 99 . 100
Moyamba
District
90 100 94 97 91 94 36 91 80 87 87 95
Port Loko Distri 100 99 98 100 99 88 88 98 91 100 99 94
Pujehun District 92 99 84 72 98 81 76 71 94 94 96 74
18
Satisfactory refers to completeness and correctness of data (e.g. adding address, age, weight, BP). Eligibility refers to the case definition, e.g. vaccination before
reaching age of one year. 19
Some fields are left blank, where data were missing
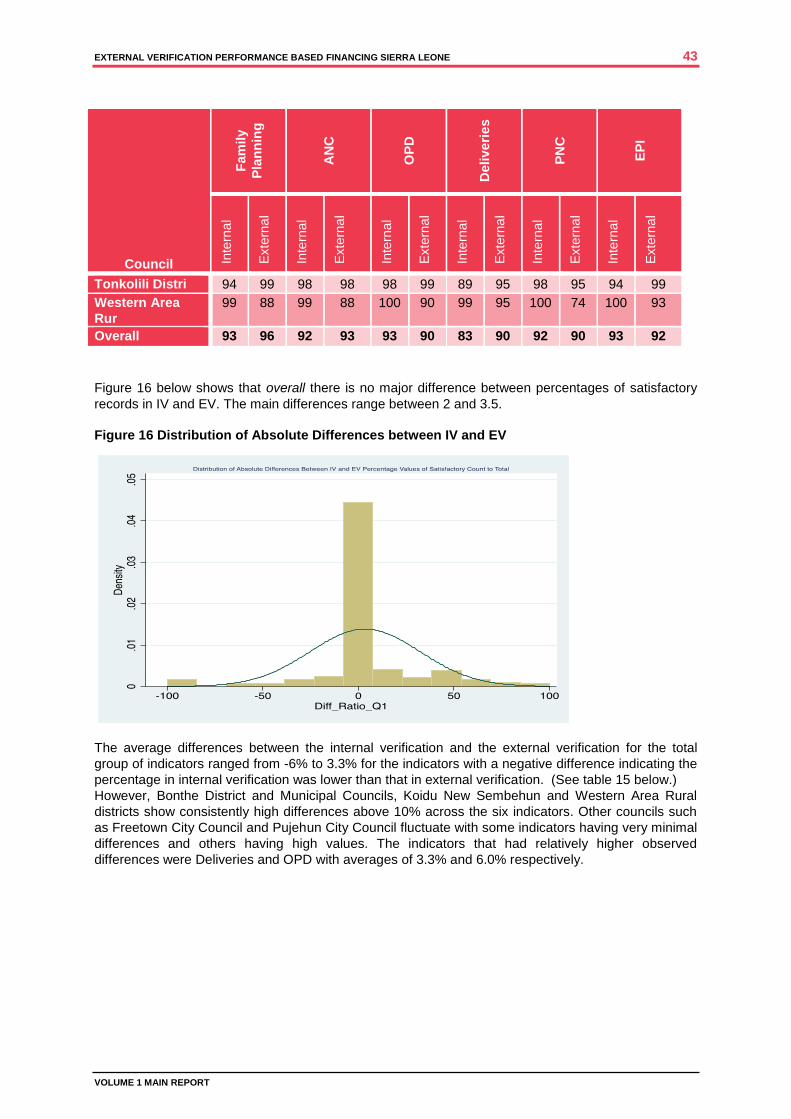
EXTERNAL VERIFICATION PERFORMANCE BASED FINANCING SIERRA LEONE 43
VOLUME 1 MAIN REPORT
Council
Fam
ily
Pla
nn
ing
AN
C
OP
D
Deliv
eri
es
PN
C
EP
I
Inte
rna
l
Exte
rna
l
Inte
rna
l
Exte
rna
l
Inte
rna
l
Exte
rna
l
Inte
rna
l
Exte
rna
l
Inte
rna
l
Exte
rna
l
Inte
rna
l
Exte
rna
l
Tonkolili Distri 94 99 98 98 98 99 89 95 98 95 94 99
Western Area
Rur
99 88 99 88 100 90 99 95 100 74 100 93
Overall 93 96 92 93 93 90 83 90 92 90 93 92
Figure 16 below shows that overall there is no major difference between percentages of satisfactory
records in IV and EV. The main differences range between 2 and 3.5.
Figure 16 Distribution of Absolute Differences between IV and EV
The average differences between the internal verification and the external verification for the total
group of indicators ranged from -6% to 3.3% for the indicators with a negative difference indicating the
percentage in internal verification was lower than that in external verification. (See table 15 below.)
However, Bonthe District and Municipal Councils, Koidu New Sembehun and Western Area Rural
districts show consistently high differences above 10% across the six indicators. Other councils such
as Freetown City Council and Pujehun City Council fluctuate with some indicators having very minimal
differences and others having high values. The indicators that had relatively higher observed
differences were Deliveries and OPD with averages of 3.3% and 6.0% respectively.
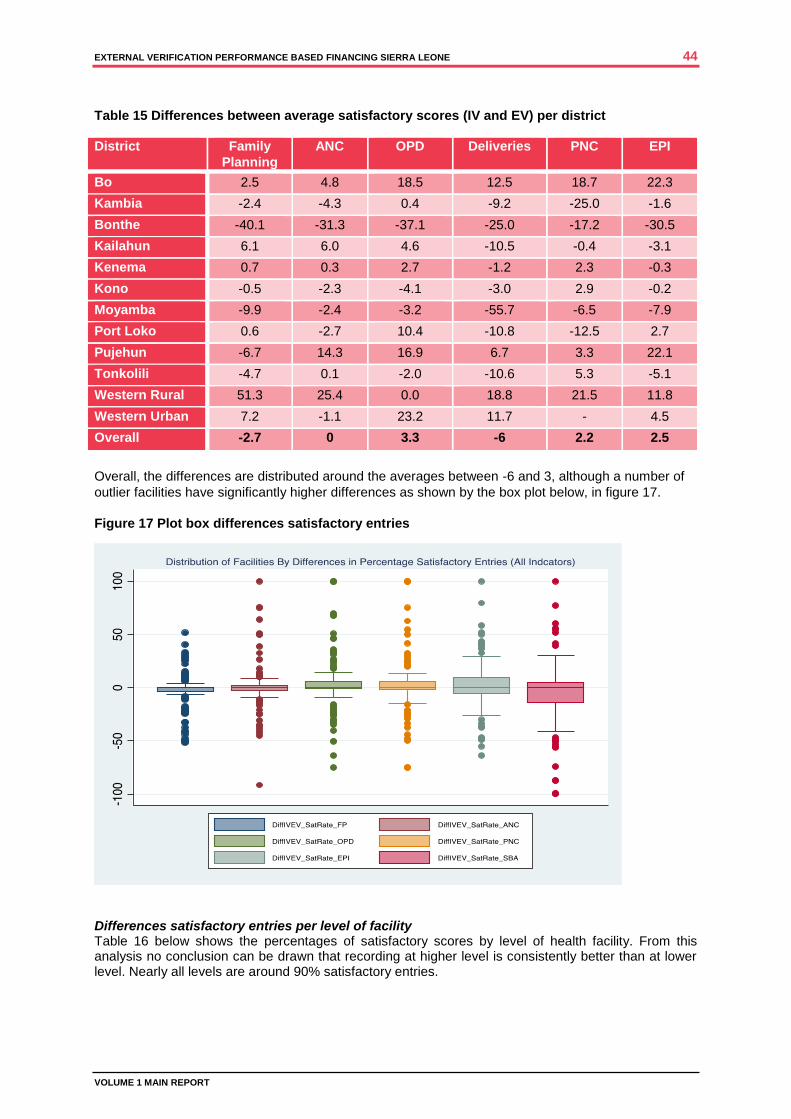
EXTERNAL VERIFICATION PERFORMANCE BASED FINANCING SIERRA LEONE 44
VOLUME 1 MAIN REPORT
Table 15 Differences between average satisfactory scores (IV and EV) per district
District Family
Planning
ANC OPD Deliveries PNC EPI
Bo 2.5 4.8 18.5 12.5 18.7 22.3
Kambia -2.4 -4.3 0.4 -9.2 -25.0 -1.6
Bonthe -40.1 -31.3 -37.1 -25.0 -17.2 -30.5
Kailahun 6.1 6.0 4.6 -10.5 -0.4 -3.1
Kenema 0.7 0.3 2.7 -1.2 2.3 -0.3
Kono -0.5 -2.3 -4.1 -3.0 2.9 -0.2
Moyamba -9.9 -2.4 -3.2 -55.7 -6.5 -7.9
Port Loko 0.6 -2.7 10.4 -10.8 -12.5 2.7
Pujehun -6.7 14.3 16.9 6.7 3.3 22.1
Tonkolili -4.7 0.1 -2.0 -10.6 5.3 -5.1
Western Rural 51.3 25.4 0.0 18.8 21.5 11.8
Western Urban 7.2 -1.1 23.2 11.7 - 4.5
Overall -2.7 0 3.3 -6 2.2 2.5
Overall, the differences are distributed around the averages between -6 and 3, although a number of
outlier facilities have significantly higher differences as shown by the box plot below, in figure 17.
Figure 17 Plot box differences satisfactory entries
Differences satisfactory entries per level of facility Table 16 below shows the percentages of satisfactory scores by level of health facility. From this analysis no conclusion can be drawn that recording at higher level is consistently better than at lower level. Nearly all levels are around 90% satisfactory entries.
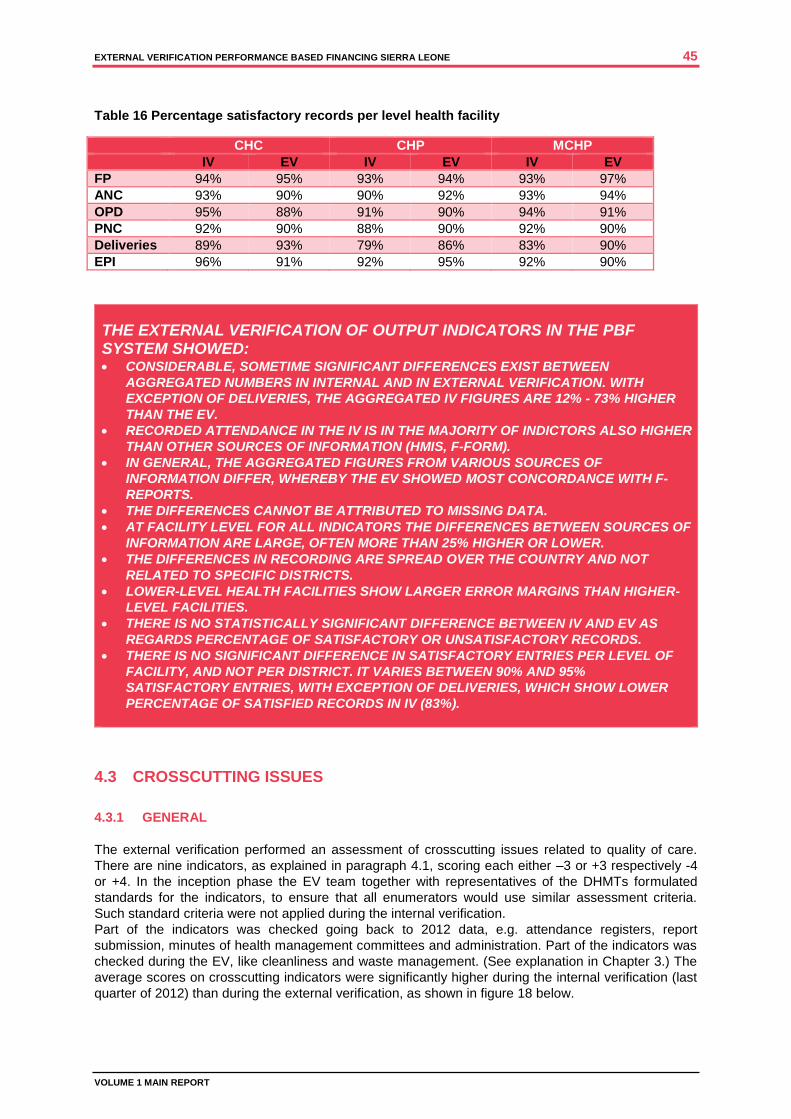
EXTERNAL VERIFICATION PERFORMANCE BASED FINANCING SIERRA LEONE 45
VOLUME 1 MAIN REPORT
Table 16 Percentage satisfactory records per level health facility
CHC CHP MCHP
IV EV IV EV IV EV
FP 94% 95% 93% 94% 93% 97%
ANC 93% 90% 90% 92% 93% 94%
OPD 95% 88% 91% 90% 94% 91%
PNC 92% 90% 88% 90% 92% 90%
Deliveries 89% 93% 79% 86% 83% 90%
EPI 96% 91% 92% 95% 92% 90%
THE EXTERNAL VERIFICATION OF OUTPUT INDICATORS IN THE PBF SYSTEM SHOWED: CONSIDERABLE, SOMETIME SIGNIFICANT DIFFERENCES EXIST BETWEEN
AGGREGATED NUMBERS IN INTERNAL AND IN EXTERNAL VERIFICATION. WITH
EXCEPTION OF DELIVERIES, THE AGGREGATED IV FIGURES ARE 12% - 73% HIGHER
THAN THE EV.
RECORDED ATTENDANCE IN THE IV IS IN THE MAJORITY OF INDICTORS ALSO HIGHER
THAN OTHER SOURCES OF INFORMATION (HMIS, F-FORM).
IN GENERAL, THE AGGREGATED FIGURES FROM VARIOUS SOURCES OF
INFORMATION DIFFER, WHEREBY THE EV SHOWED MOST CONCORDANCE WITH F-
REPORTS.
THE DIFFERENCES CANNOT BE ATTRIBUTED TO MISSING DATA.
AT FACILITY LEVEL FOR ALL INDICATORS THE DIFFERENCES BETWEEN SOURCES OF
INFORMATION ARE LARGE, OFTEN MORE THAN 25% HIGHER OR LOWER.
THE DIFFERENCES IN RECORDING ARE SPREAD OVER THE COUNTRY AND NOT
RELATED TO SPECIFIC DISTRICTS.
LOWER-LEVEL HEALTH FACILITIES SHOW LARGER ERROR MARGINS THAN HIGHER-
LEVEL FACILITIES.
THERE IS NO STATISTICALLY SIGNIFICANT DIFFERENCE BETWEEN IV AND EV AS
REGARDS PERCENTAGE OF SATISFACTORY OR UNSATISFACTORY RECORDS.
THERE IS NO SIGNIFICANT DIFFERENCE IN SATISFACTORY ENTRIES PER LEVEL OF
FACILITY, AND NOT PER DISTRICT. IT VARIES BETWEEN 90% AND 95%
SATISFACTORY ENTRIES, WITH EXCEPTION OF DELIVERIES, WHICH SHOW LOWER
PERCENTAGE OF SATISFIED RECORDS IN IV (83%).
4.3 CROSSCUTTING ISSUES
4.3.1 GENERAL
The external verification performed an assessment of crosscutting issues related to quality of care.
There are nine indicators, as explained in paragraph 4.1, scoring each either –3 or +3 respectively -4
or +4. In the inception phase the EV team together with representatives of the DHMTs formulated
standards for the indicators, to ensure that all enumerators would use similar assessment criteria.
Such standard criteria were not applied during the internal verification.
Part of the indicators was checked going back to 2012 data, e.g. attendance registers, report
submission, minutes of health management committees and administration. Part of the indicators was
checked during the EV, like cleanliness and waste management. (See explanation in Chapter 3.) The
average scores on crosscutting indicators were significantly higher during the internal verification (last
quarter of 2012) than during the external verification, as shown in figure 18 below.
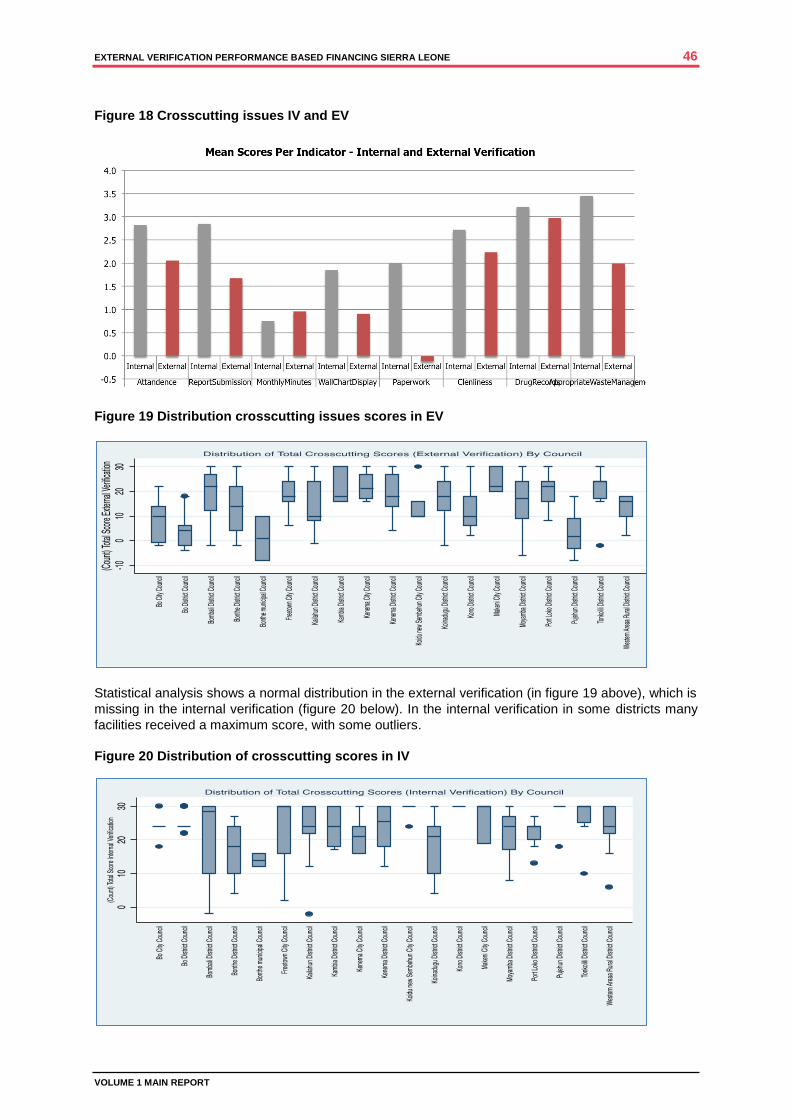
EXTERNAL VERIFICATION PERFORMANCE BASED FINANCING SIERRA LEONE 46
VOLUME 1 MAIN REPORT
Figure 18 Crosscutting issues IV and EV
Figure 19 Distribution crosscutting issues scores in EV
Statistical analysis shows a normal distribution in the external verification (in figure 19 above), which is
missing in the internal verification (figure 20 below). In the internal verification in some districts many
facilities received a maximum score, with some outliers.
Figure 20 Distribution of crosscutting scores in IV

EXTERNAL VERIFICATION PERFORMANCE BASED FINANCING SIERRA LEONE 47
VOLUME 1 MAIN REPORT
All facilities in Kono district received the maximum score for all crosscutting indicators in the internal
verification of the last quarter of 2012, but not in the external verification, as shown in figure 21 below.
Figure 21 Kono District Comparing Crosscutting Indicators IV and EV
4.3.2 SPECIFIC INDICATORS
Scores on indicators, which used similar reference documents in IV and EV (e.g. attendance registers,
or timely submission HMIS reports), were mostly lower in EV. Especially the indicator on
administration scored very low (with exception of Port Loko), as in many health facilities
documentation and registers over 2012 went missing (figure 22).
Figure 22 Comparing crosscutting indicator Administration IV and EV
None of the other indicators assessed with present information in 2014 in the EV scored higher than
the IV in 2012 (e.g. cleanliness, drug records or waste management). Maybe the standardised
assessment in the EV applied stricter criteria than the less-structured assessment in the IV.
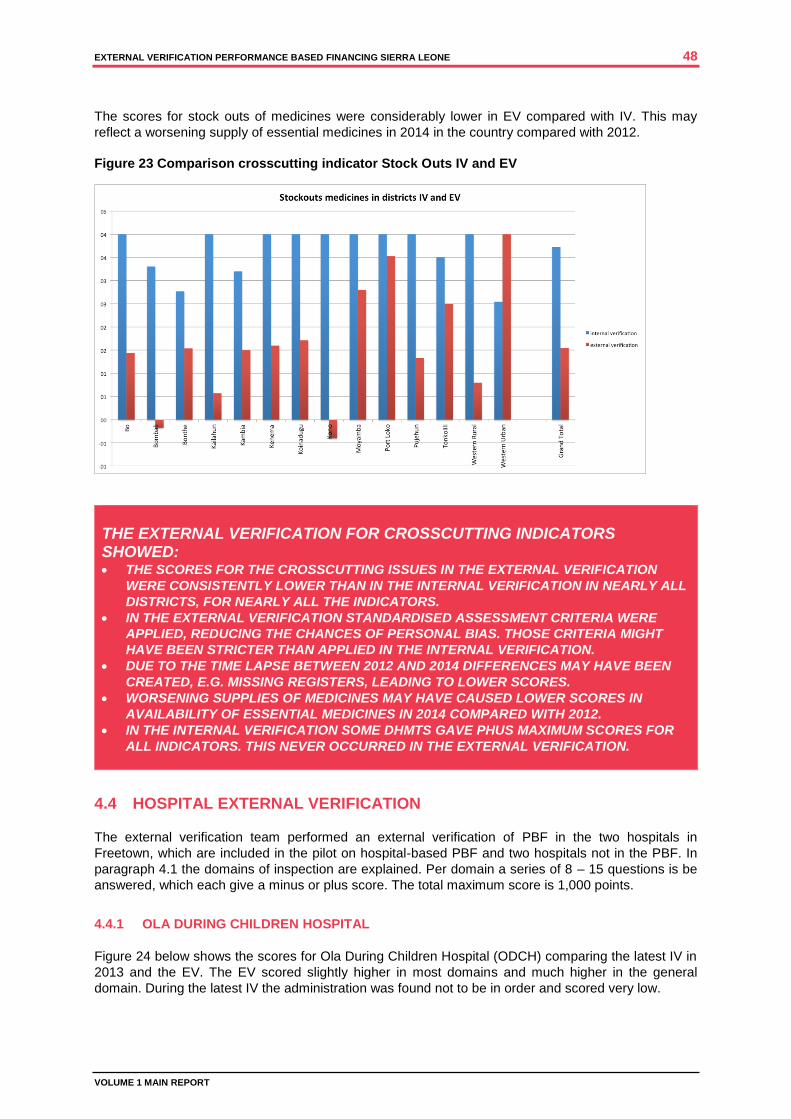
EXTERNAL VERIFICATION PERFORMANCE BASED FINANCING SIERRA LEONE 48
VOLUME 1 MAIN REPORT
The scores for stock outs of medicines were considerably lower in EV compared with IV. This may
reflect a worsening supply of essential medicines in 2014 in the country compared with 2012.
Figure 23 Comparison crosscutting indicator Stock Outs IV and EV
THE EXTERNAL VERIFICATION FOR CROSSCUTTING INDICATORS SHOWED: THE SCORES FOR THE CROSSCUTTING ISSUES IN THE EXTERNAL VERIFICATION
WERE CONSISTENTLY LOWER THAN IN THE INTERNAL VERIFICATION IN NEARLY ALL
DISTRICTS, FOR NEARLY ALL THE INDICATORS.
IN THE EXTERNAL VERIFICATION STANDARDISED ASSESSMENT CRITERIA WERE
APPLIED, REDUCING THE CHANCES OF PERSONAL BIAS. THOSE CRITERIA MIGHT
HAVE BEEN STRICTER THAN APPLIED IN THE INTERNAL VERIFICATION.
DUE TO THE TIME LAPSE BETWEEN 2012 AND 2014 DIFFERENCES MAY HAVE BEEN
CREATED, E.G. MISSING REGISTERS, LEADING TO LOWER SCORES.
WORSENING SUPPLIES OF MEDICINES MAY HAVE CAUSED LOWER SCORES IN
AVAILABILITY OF ESSENTIAL MEDICINES IN 2014 COMPARED WITH 2012.
IN THE INTERNAL VERIFICATION SOME DHMTS GAVE PHUS MAXIMUM SCORES FOR
ALL INDICATORS. THIS NEVER OCCURRED IN THE EXTERNAL VERIFICATION.
4.4 HOSPITAL EXTERNAL VERIFICATION
The external verification team performed an external verification of PBF in the two hospitals in
Freetown, which are included in the pilot on hospital-based PBF and two hospitals not in the PBF. In
paragraph 4.1 the domains of inspection are explained. Per domain a series of 8 – 15 questions is be
answered, which each give a minus or plus score. The total maximum score is 1,000 points.
4.4.1 OLA DURING CHILDREN HOSPITAL
Figure 24 below shows the scores for Ola During Children Hospital (ODCH) comparing the latest IV in
2013 and the EV. The EV scored slightly higher in most domains and much higher in the general
domain. During the latest IV the administration was found not to be in order and scored very low.
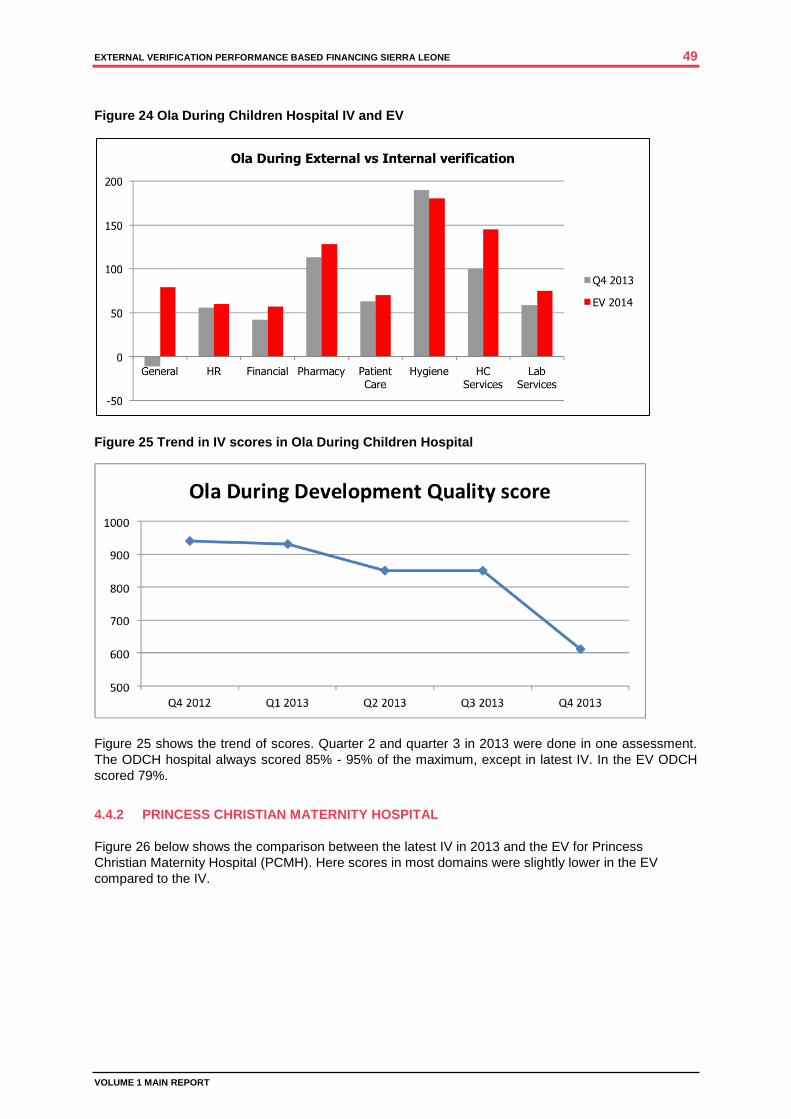
EXTERNAL VERIFICATION PERFORMANCE BASED FINANCING SIERRA LEONE 49
VOLUME 1 MAIN REPORT
Figure 24 Ola During Children Hospital IV and EV
Figure 25 Trend in IV scores in Ola During Children Hospital
Figure 25 shows the trend of scores. Quarter 2 and quarter 3 in 2013 were done in one assessment.
The ODCH hospital always scored 85% - 95% of the maximum, except in latest IV. In the EV ODCH
scored 79%.
4.4.2 PRINCESS CHRISTIAN MATERNITY HOSPITAL
Figure 26 below shows the comparison between the latest IV in 2013 and the EV for Princess
Christian Maternity Hospital (PCMH). Here scores in most domains were slightly lower in the EV
compared to the IV.
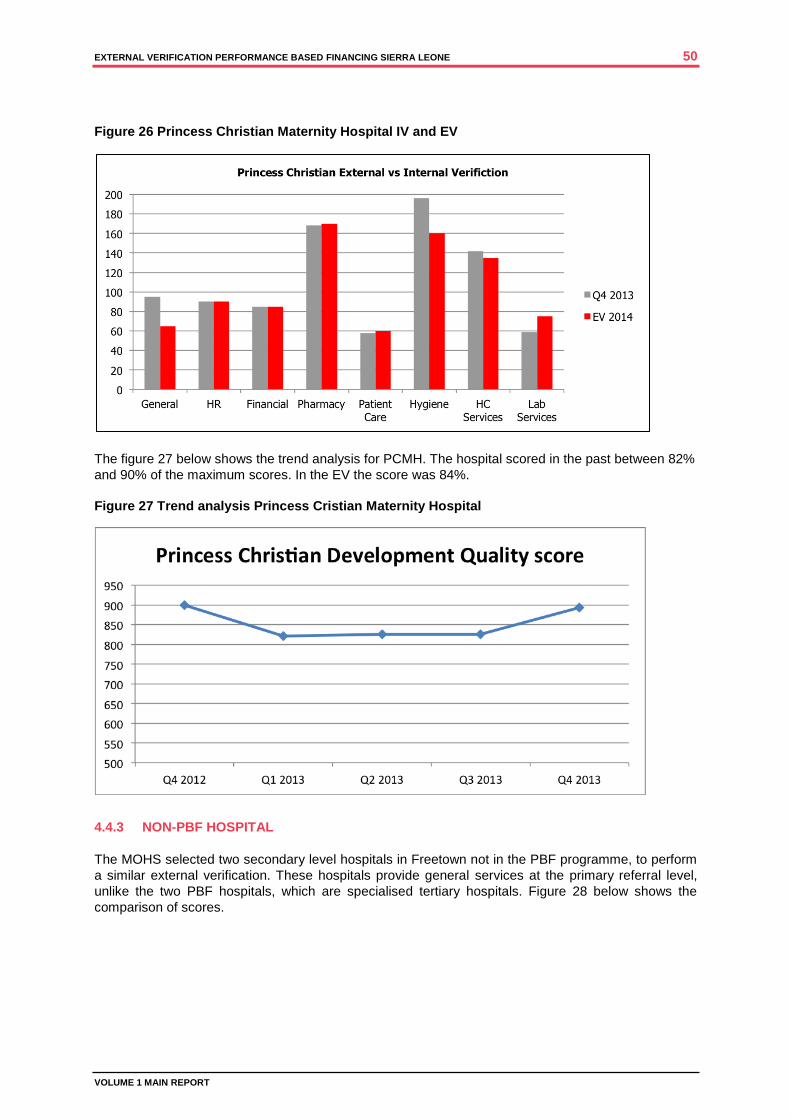
EXTERNAL VERIFICATION PERFORMANCE BASED FINANCING SIERRA LEONE 50
VOLUME 1 MAIN REPORT
Figure 26 Princess Christian Maternity Hospital IV and EV
The figure 27 below shows the trend analysis for PCMH. The hospital scored in the past between 82%
and 90% of the maximum scores. In the EV the score was 84%.
Figure 27 Trend analysis Princess Cristian Maternity Hospital
4.4.3 NON-PBF HOSPITAL
The MOHS selected two secondary level hospitals in Freetown not in the PBF programme, to perform
a similar external verification. These hospitals provide general services at the primary referral level,
unlike the two PBF hospitals, which are specialised tertiary hospitals. Figure 28 below shows the
comparison of scores.
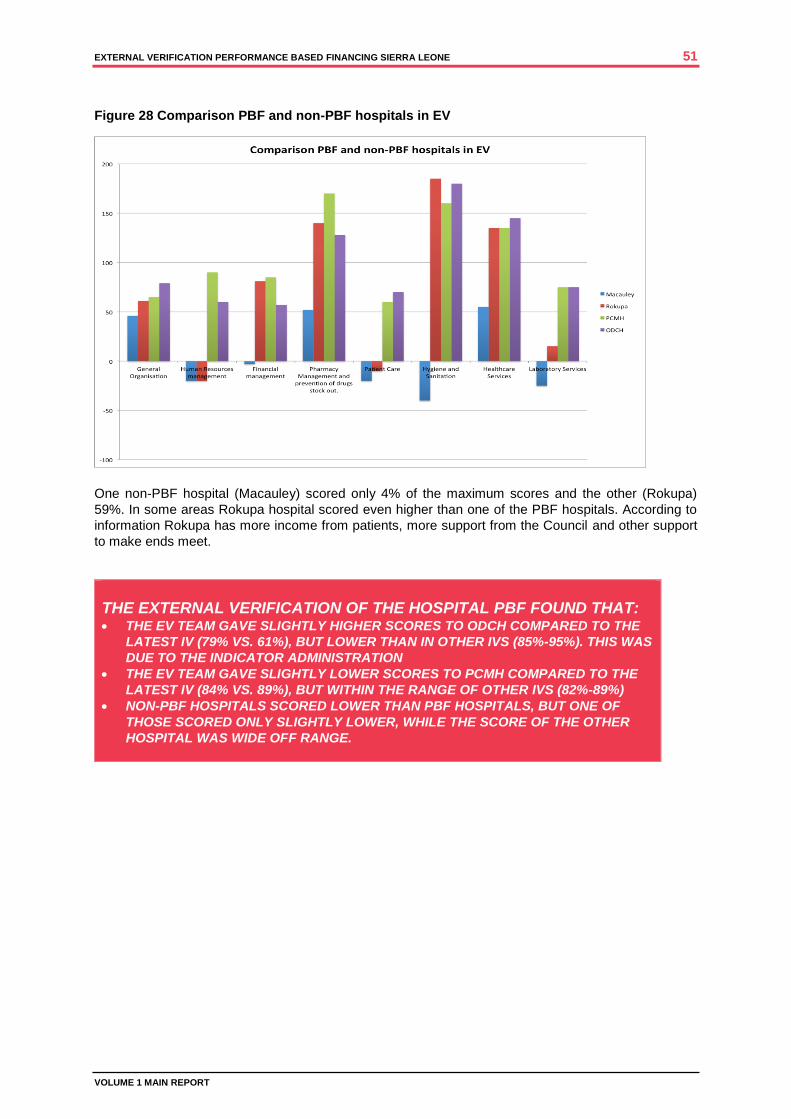
EXTERNAL VERIFICATION PERFORMANCE BASED FINANCING SIERRA LEONE 51
VOLUME 1 MAIN REPORT
Figure 28 Comparison PBF and non-PBF hospitals in EV
One non-PBF hospital (Macauley) scored only 4% of the maximum scores and the other (Rokupa)
59%. In some areas Rokupa hospital scored even higher than one of the PBF hospitals. According to
information Rokupa has more income from patients, more support from the Council and other support
to make ends meet.
THE EXTERNAL VERIFICATION OF THE HOSPITAL PBF FOUND THAT: THE EV TEAM GAVE SLIGHTLY HIGHER SCORES TO ODCH COMPARED TO THE
LATEST IV (79% VS. 61%), BUT LOWER THAN IN OTHER IVS (85%-95%). THIS WAS
DUE TO THE INDICATOR ADMINISTRATION
THE EV TEAM GAVE SLIGHTLY LOWER SCORES TO PCMH COMPARED TO THE
LATEST IV (84% VS. 89%), BUT WITHIN THE RANGE OF OTHER IVS (82%-89%)
NON-PBF HOSPITALS SCORED LOWER THAN PBF HOSPITALS, BUT ONE OF
THOSE SCORED ONLY SLIGHTLY LOWER, WHILE THE SCORE OF THE OTHER
HOSPITAL WAS WIDE OFF RANGE.

EXTERNAL VERIFICATION PERFORMANCE BASED FINANCING SIERRA LEONE 52
VOLUME 1 MAIN REPORT
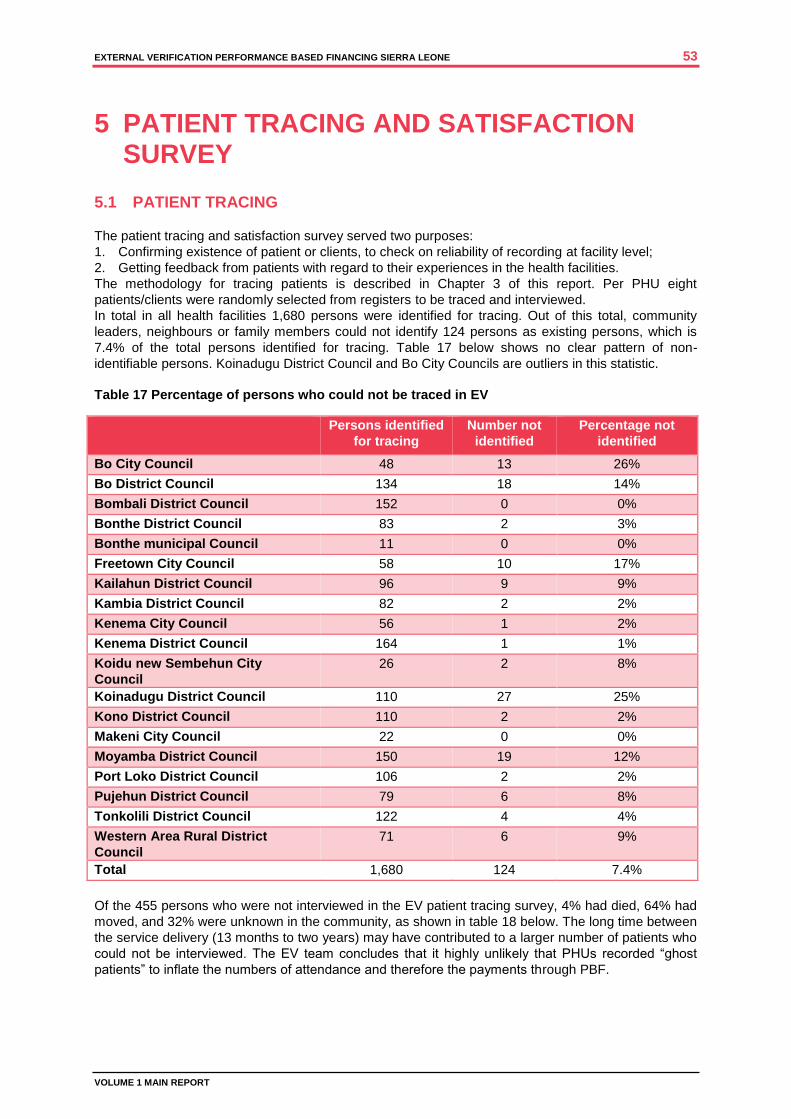
EXTERNAL VERIFICATION PERFORMANCE BASED FINANCING SIERRA LEONE 53
VOLUME 1 MAIN REPORT
5 PATIENT TRACING AND SATISFACTION SURVEY
5.1 PATIENT TRACING
The patient tracing and satisfaction survey served two purposes:
1. Confirming existence of patient or clients, to check on reliability of recording at facility level;
2. Getting feedback from patients with regard to their experiences in the health facilities.
The methodology for tracing patients is described in Chapter 3 of this report. Per PHU eight
patients/clients were randomly selected from registers to be traced and interviewed.
In total in all health facilities 1,680 persons were identified for tracing. Out of this total, community
leaders, neighbours or family members could not identify 124 persons as existing persons, which is
7.4% of the total persons identified for tracing. Table 17 below shows no clear pattern of non-
identifiable persons. Koinadugu District Council and Bo City Councils are outliers in this statistic.
Table 17 Percentage of persons who could not be traced in EV
Persons identified
for tracing
Number not
identified
Percentage not
identified
Bo City Council 48 13 26%
Bo District Council 134 18 14%
Bombali District Council 152 0 0%
Bonthe District Council 83 2 3%
Bonthe municipal Council 11 0 0%
Freetown City Council 58 10 17%
Kailahun District Council 96 9 9%
Kambia District Council 82 2 2%
Kenema City Council 56 1 2%
Kenema District Council 164 1 1%
Koidu new Sembehun City
Council
26 2 8%
Koinadugu District Council 110 27 25%
Kono District Council 110 2 2%
Makeni City Council 22 0 0%
Moyamba District Council 150 19 12%
Port Loko District Council 106 2 2%
Pujehun District Council 79 6 8%
Tonkolili District Council 122 4 4%
Western Area Rural District
Council
71 6 9%
Total 1,680 124 7.4%
Of the 455 persons who were not interviewed in the EV patient tracing survey, 4% had died, 64% had
moved, and 32% were unknown in the community, as shown in table 18 below. The long time between
the service delivery (13 months to two years) may have contributed to a larger number of patients who
could not be interviewed. The EV team concludes that it highly unlikely that PHUs recorded “ghost
patients” to inflate the numbers of attendance and therefore the payments through PBF.
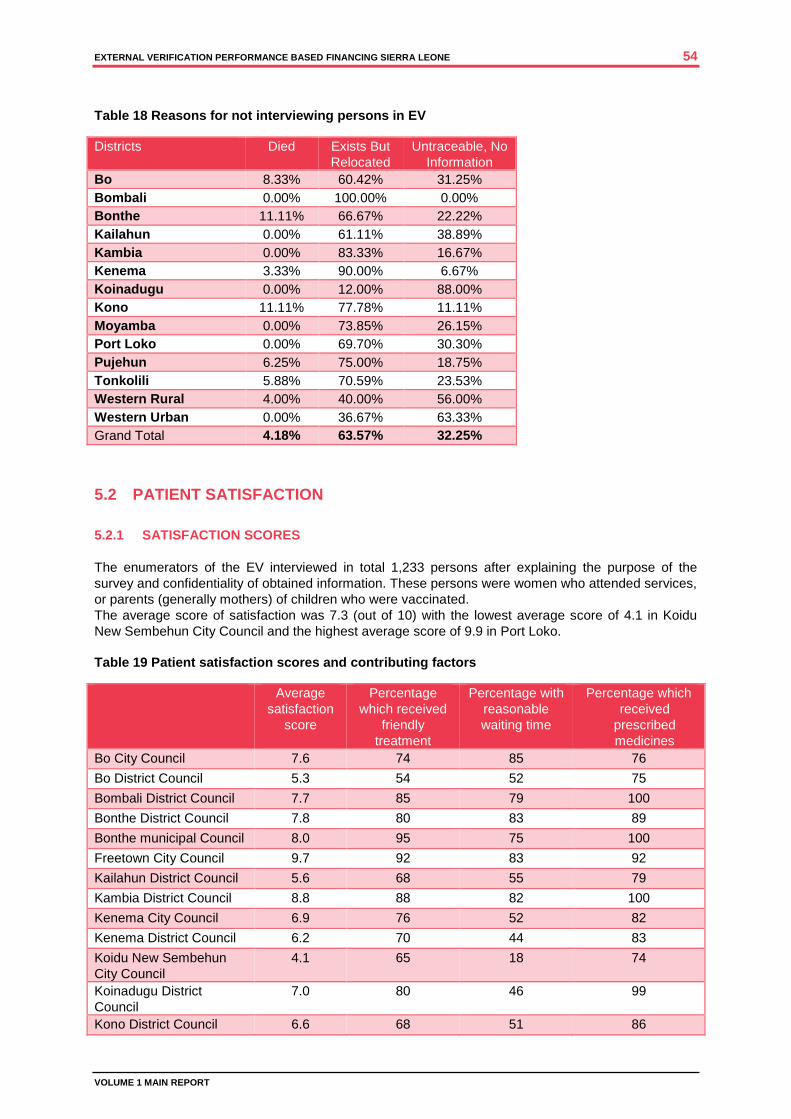
EXTERNAL VERIFICATION PERFORMANCE BASED FINANCING SIERRA LEONE 54
VOLUME 1 MAIN REPORT
Table 18 Reasons for not interviewing persons in EV
Districts Died Exists But
Relocated
Untraceable, No
Information
Bo 8.33% 60.42% 31.25%
Bombali 0.00% 100.00% 0.00%
Bonthe 11.11% 66.67% 22.22%
Kailahun 0.00% 61.11% 38.89%
Kambia 0.00% 83.33% 16.67%
Kenema 3.33% 90.00% 6.67%
Koinadugu 0.00% 12.00% 88.00%
Kono 11.11% 77.78% 11.11%
Moyamba 0.00% 73.85% 26.15%
Port Loko 0.00% 69.70% 30.30%
Pujehun 6.25% 75.00% 18.75%
Tonkolili 5.88% 70.59% 23.53%
Western Rural 4.00% 40.00% 56.00%
Western Urban 0.00% 36.67% 63.33%
Grand Total 4.18% 63.57% 32.25%
5.2 PATIENT SATISFACTION
5.2.1 SATISFACTION SCORES
The enumerators of the EV interviewed in total 1,233 persons after explaining the purpose of the
survey and confidentiality of obtained information. These persons were women who attended services,
or parents (generally mothers) of children who were vaccinated.
The average score of satisfaction was 7.3 (out of 10) with the lowest average score of 4.1 in Koidu
New Sembehun City Council and the highest average score of 9.9 in Port Loko.
Table 19 Patient satisfaction scores and contributing factors
Average
satisfaction
score
Percentage
which received
friendly
treatment
Percentage with
reasonable
waiting time
Percentage which
received
prescribed
medicines
Bo City Council 7.6 74 85 76
Bo District Council 5.3 54 52 75
Bombali District Council 7.7 85 79 100
Bonthe District Council 7.8 80 83 89
Bonthe municipal Council 8.0 95 75 100
Freetown City Council 9.7 92 83 92
Kailahun District Council 5.6 68 55 79
Kambia District Council 8.8 88 82 100
Kenema City Council 6.9 76 52 82
Kenema District Council 6.2 70 44 83
Koidu New Sembehun
City Council
4.1 65 18 74
Koinadugu District
Council
7.0 80 46 99
Kono District Council 6.6 68 51 86
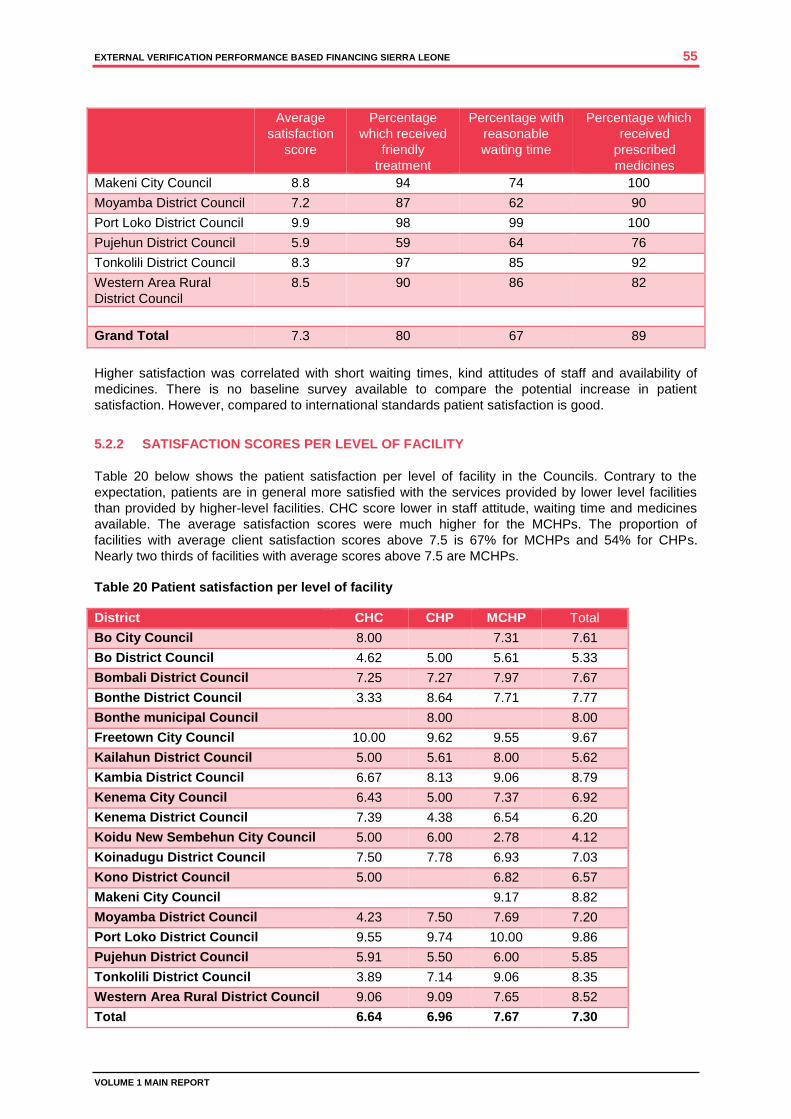
EXTERNAL VERIFICATION PERFORMANCE BASED FINANCING SIERRA LEONE 55
VOLUME 1 MAIN REPORT
Average
satisfaction
score
Percentage
which received
friendly
treatment
Percentage with
reasonable
waiting time
Percentage which
received
prescribed
medicines
Makeni City Council 8.8 94 74 100
Moyamba District Council 7.2 87 62 90
Port Loko District Council 9.9 98 99 100
Pujehun District Council 5.9 59 64 76
Tonkolili District Council 8.3 97 85 92
Western Area Rural
District Council
8.5 90 86 82
Grand Total 7.3 80 67 89
Higher satisfaction was correlated with short waiting times, kind attitudes of staff and availability of
medicines. There is no baseline survey available to compare the potential increase in patient
satisfaction. However, compared to international standards patient satisfaction is good.
5.2.2 SATISFACTION SCORES PER LEVEL OF FACILITY
Table 20 below shows the patient satisfaction per level of facility in the Councils. Contrary to the
expectation, patients are in general more satisfied with the services provided by lower level facilities
than provided by higher-level facilities. CHC score lower in staff attitude, waiting time and medicines
available. The average satisfaction scores were much higher for the MCHPs. The proportion of
facilities with average client satisfaction scores above 7.5 is 67% for MCHPs and 54% for CHPs.
Nearly two thirds of facilities with average scores above 7.5 are MCHPs.
Table 20 Patient satisfaction per level of facility
District CHC CHP MCHP Total
Bo City Council 8.00 7.31 7.61
Bo District Council 4.62 5.00 5.61 5.33
Bombali District Council 7.25 7.27 7.97 7.67
Bonthe District Council 3.33 8.64 7.71 7.77
Bonthe municipal Council 8.00 8.00
Freetown City Council 10.00 9.62 9.55 9.67
Kailahun District Council 5.00 5.61 8.00 5.62
Kambia District Council 6.67 8.13 9.06 8.79
Kenema City Council 6.43 5.00 7.37 6.92
Kenema District Council 7.39 4.38 6.54 6.20
Koidu New Sembehun City Council 5.00 6.00 2.78 4.12
Koinadugu District Council 7.50 7.78 6.93 7.03
Kono District Council 5.00 6.82 6.57
Makeni City Council 9.17 8.82
Moyamba District Council 4.23 7.50 7.69 7.20
Port Loko District Council 9.55 9.74 10.00 9.86
Pujehun District Council 5.91 5.50 6.00 5.85
Tonkolili District Council 3.89 7.14 9.06 8.35
Western Area Rural District Council 9.06 9.09 7.65 8.52
Total 6.64 6.96 7.67 7.30
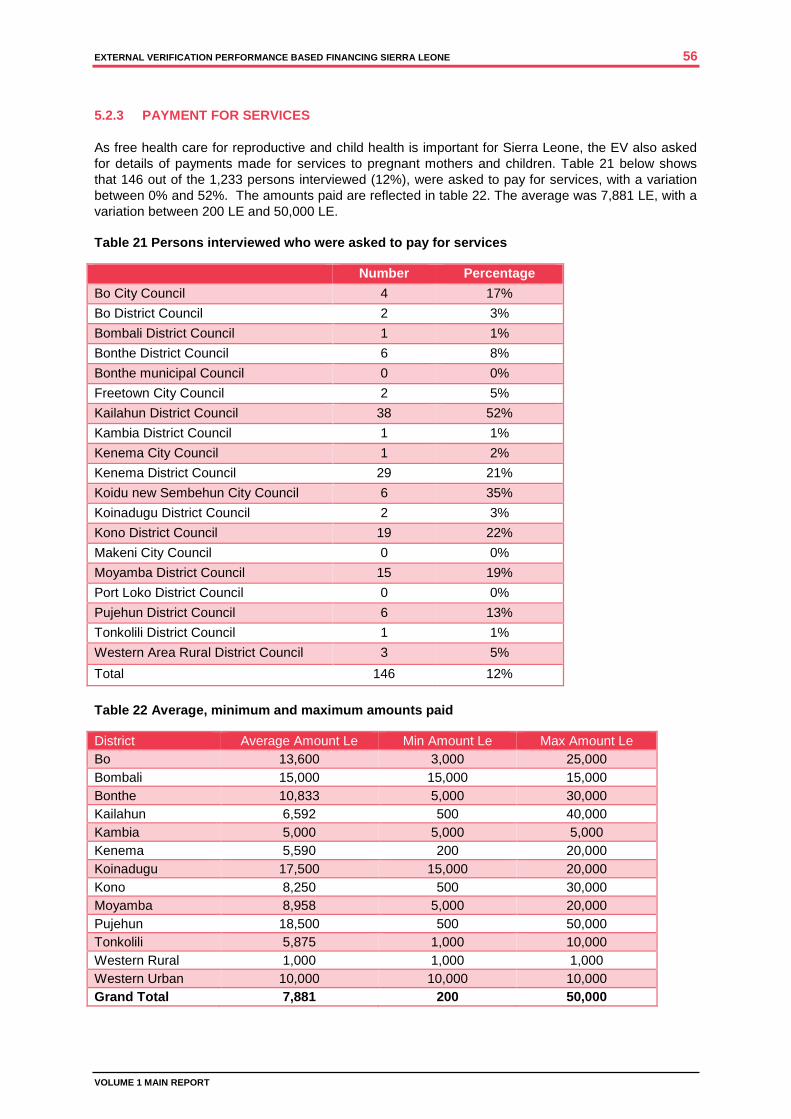
EXTERNAL VERIFICATION PERFORMANCE BASED FINANCING SIERRA LEONE 56
VOLUME 1 MAIN REPORT
5.2.3 PAYMENT FOR SERVICES
As free health care for reproductive and child health is important for Sierra Leone, the EV also asked
for details of payments made for services to pregnant mothers and children. Table 21 below shows
that 146 out of the 1,233 persons interviewed (12%), were asked to pay for services, with a variation
between 0% and 52%. The amounts paid are reflected in table 22. The average was 7,881 LE, with a
variation between 200 LE and 50,000 LE.
Table 21 Persons interviewed who were asked to pay for services
Number Percentage
Bo City Council 4 17%
Bo District Council 2 3%
Bombali District Council 1 1%
Bonthe District Council 6 8%
Bonthe municipal Council 0 0%
Freetown City Council 2 5%
Kailahun District Council 38 52%
Kambia District Council 1 1%
Kenema City Council 1 2%
Kenema District Council 29 21%
Koidu new Sembehun City Council 6 35%
Koinadugu District Council 2 3%
Kono District Council 19 22%
Makeni City Council 0 0%
Moyamba District Council 15 19%
Port Loko District Council 0 0%
Pujehun District Council 6 13%
Tonkolili District Council 1 1%
Western Area Rural District Council 3 5%
Total 146 12%
Table 22 Average, minimum and maximum amounts paid
District Average Amount Le Min Amount Le Max Amount Le
Bo 13,600 3,000 25,000
Bombali 15,000 15,000 15,000
Bonthe 10,833 5,000 30,000
Kailahun 6,592 500 40,000
Kambia 5,000 5,000 5,000
Kenema 5,590 200 20,000
Koinadugu 17,500 15,000 20,000
Kono 8,250 500 30,000
Moyamba 8,958 5,000 20,000
Pujehun 18,500 500 50,000
Tonkolili 5,875 1,000 10,000
Western Rural 1,000 1,000 1,000
Western Urban 10,000 10,000 10,000
Grand Total 7,881 200 50,000
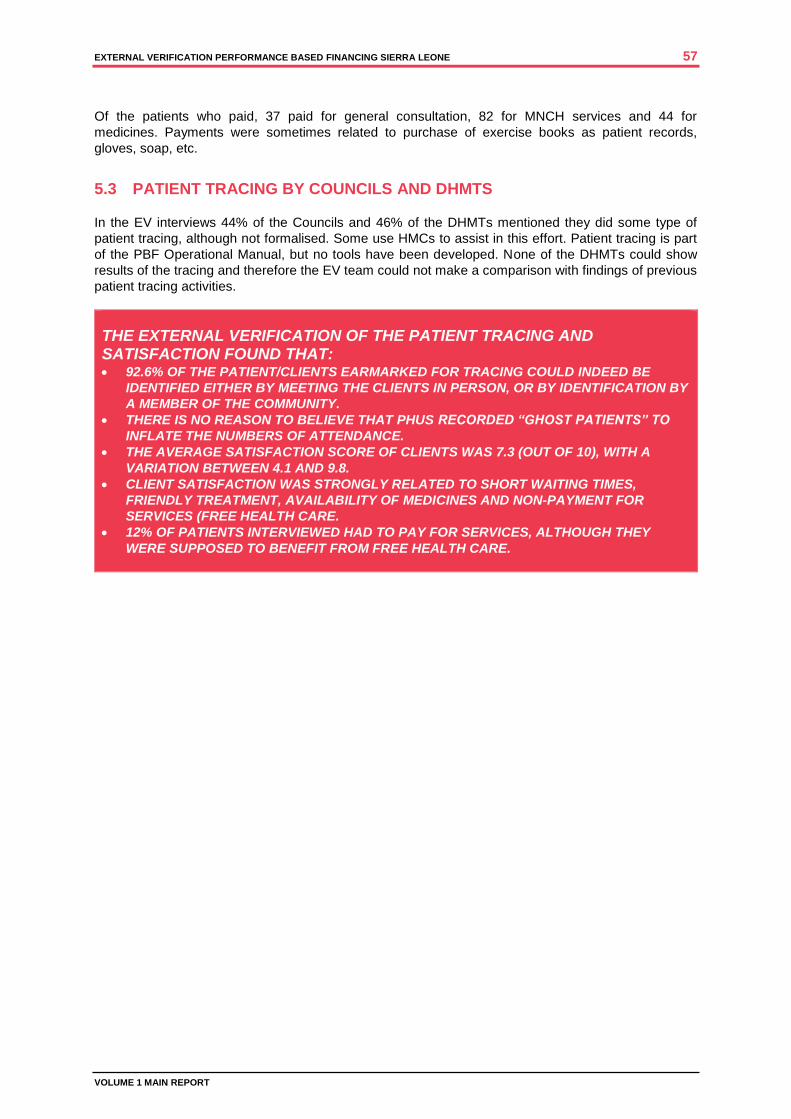
EXTERNAL VERIFICATION PERFORMANCE BASED FINANCING SIERRA LEONE 57
VOLUME 1 MAIN REPORT
Of the patients who paid, 37 paid for general consultation, 82 for MNCH services and 44 for
medicines. Payments were sometimes related to purchase of exercise books as patient records,
gloves, soap, etc.
5.3 PATIENT TRACING BY COUNCILS AND DHMTS
In the EV interviews 44% of the Councils and 46% of the DHMTs mentioned they did some type of
patient tracing, although not formalised. Some use HMCs to assist in this effort. Patient tracing is part
of the PBF Operational Manual, but no tools have been developed. None of the DHMTs could show
results of the tracing and therefore the EV team could not make a comparison with findings of previous
patient tracing activities.
THE EXTERNAL VERIFICATION OF THE PATIENT TRACING AND SATISFACTION FOUND THAT: 92.6% OF THE PATIENT/CLIENTS EARMARKED FOR TRACING COULD INDEED BE
IDENTIFIED EITHER BY MEETING THE CLIENTS IN PERSON, OR BY IDENTIFICATION BY
A MEMBER OF THE COMMUNITY.
THERE IS NO REASON TO BELIEVE THAT PHUS RECORDED “GHOST PATIENTS” TO
INFLATE THE NUMBERS OF ATTENDANCE.
THE AVERAGE SATISFACTION SCORE OF CLIENTS WAS 7.3 (OUT OF 10), WITH A
VARIATION BETWEEN 4.1 AND 9.8.
CLIENT SATISFACTION WAS STRONGLY RELATED TO SHORT WAITING TIMES,
FRIENDLY TREATMENT, AVAILABILITY OF MEDICINES AND NON-PAYMENT FOR
SERVICES (FREE HEALTH CARE.
12% OF PATIENTS INTERVIEWED HAD TO PAY FOR SERVICES, ALTHOUGH THEY
WERE SUPPOSED TO BENEFIT FROM FREE HEALTH CARE.

EXTERNAL VERIFICATION PERFORMANCE BASED FINANCING SIERRA LEONE 58
VOLUME 1 MAIN REPORT
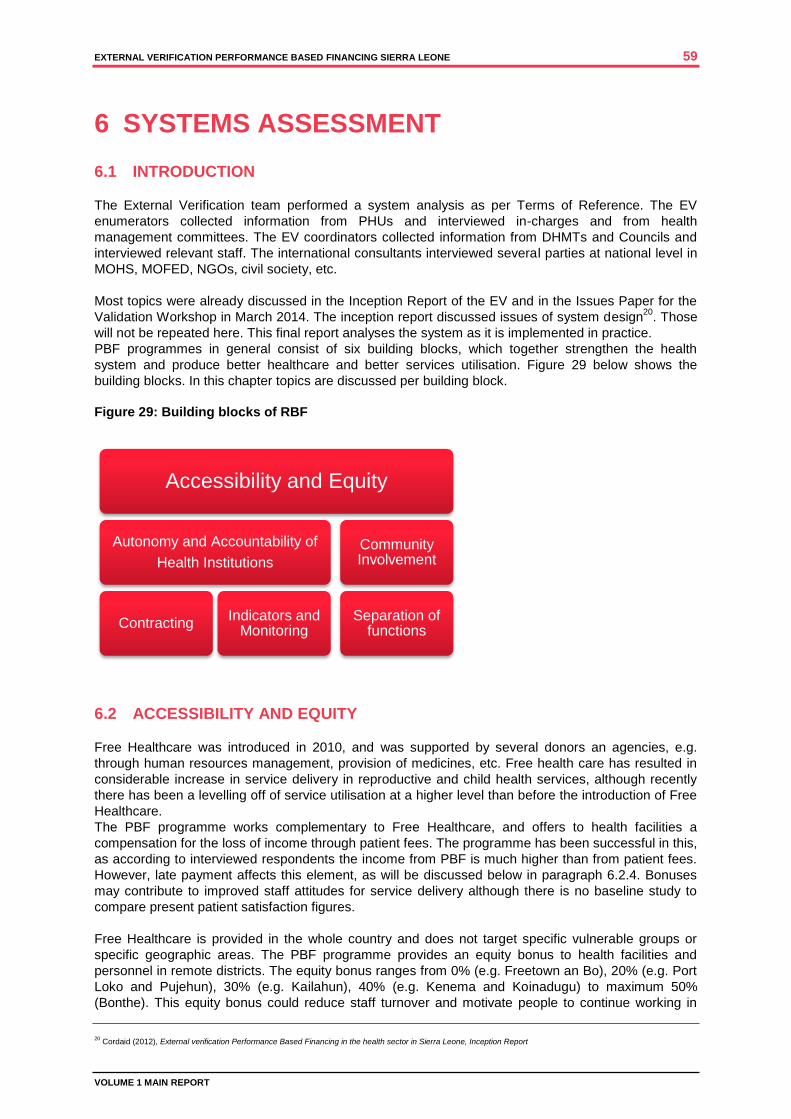
EXTERNAL VERIFICATION PERFORMANCE BASED FINANCING SIERRA LEONE 59
VOLUME 1 MAIN REPORT
6 SYSTEMS ASSESSMENT
6.1 INTRODUCTION
The External Verification team performed a system analysis as per Terms of Reference. The EV
enumerators collected information from PHUs and interviewed in-charges and from health
management committees. The EV coordinators collected information from DHMTs and Councils and
interviewed relevant staff. The international consultants interviewed several parties at national level in
MOHS, MOFED, NGOs, civil society, etc.
Most topics were already discussed in the Inception Report of the EV and in the Issues Paper for the
Validation Workshop in March 2014. The inception report discussed issues of system design20
. Those
will not be repeated here. This final report analyses the system as it is implemented in practice.
PBF programmes in general consist of six building blocks, which together strengthen the health
system and produce better healthcare and better services utilisation. Figure 29 below shows the
building blocks. In this chapter topics are discussed per building block.
Figure 29: Building blocks of RBF
6.2 ACCESSIBILITY AND EQUITY
Free Healthcare was introduced in 2010, and was supported by several donors an agencies, e.g.
through human resources management, provision of medicines, etc. Free health care has resulted in
considerable increase in service delivery in reproductive and child health services, although recently
there has been a levelling off of service utilisation at a higher level than before the introduction of Free
Healthcare.
The PBF programme works complementary to Free Healthcare, and offers to health facilities a
compensation for the loss of income through patient fees. The programme has been successful in this,
as according to interviewed respondents the income from PBF is much higher than from patient fees.
However, late payment affects this element, as will be discussed below in paragraph 6.2.4. Bonuses
may contribute to improved staff attitudes for service delivery although there is no baseline study to
compare present patient satisfaction figures.
Free Healthcare is provided in the whole country and does not target specific vulnerable groups or
specific geographic areas. The PBF programme provides an equity bonus to health facilities and
personnel in remote districts. The equity bonus ranges from 0% (e.g. Freetown an Bo), 20% (e.g. Port
Loko and Pujehun), 30% (e.g. Kailahun), 40% (e.g. Kenema and Koinadugu) to maximum 50%
(Bonthe). This equity bonus could reduce staff turnover and motivate people to continue working in
20
Cordaid (2012), External verification Performance Based Financing in the health sector in Sierra Leone, Inception Report
Accessibility and Equity
Autonomy and Accountability of
Health Institutions
Contracting Indicators and
Monitoring
Community Involvement
Separation of functions
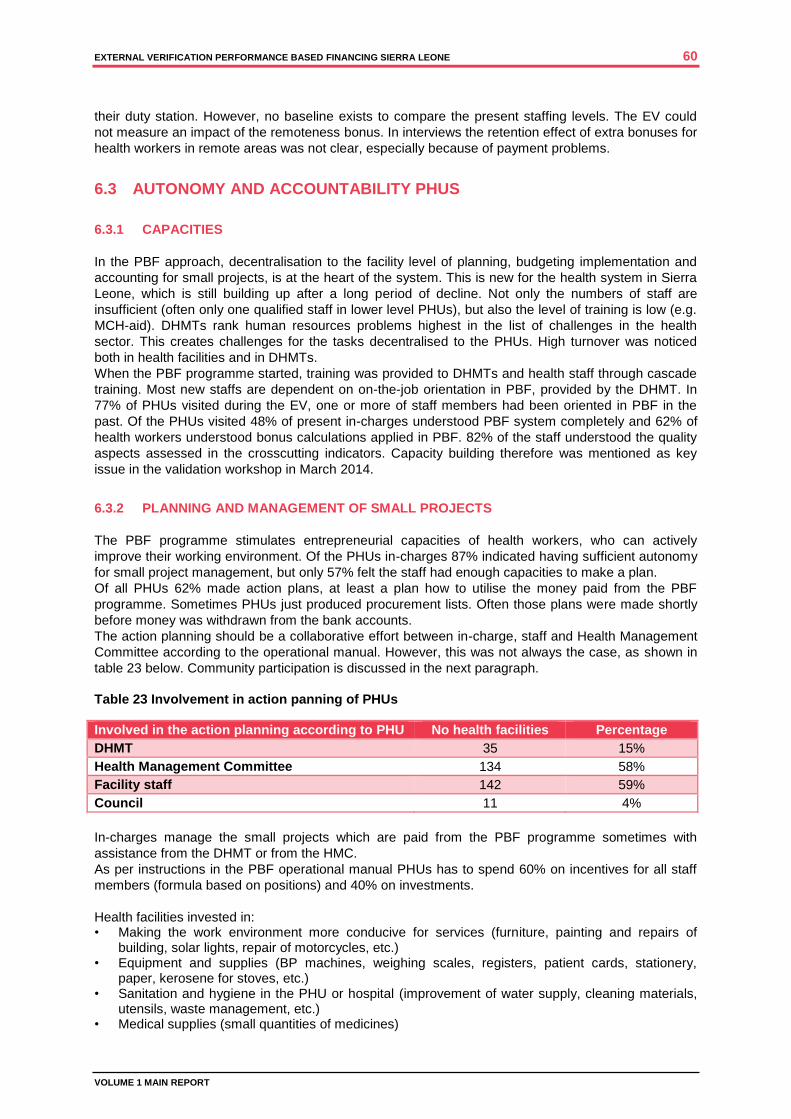
EXTERNAL VERIFICATION PERFORMANCE BASED FINANCING SIERRA LEONE 60
VOLUME 1 MAIN REPORT
their duty station. However, no baseline exists to compare the present staffing levels. The EV could
not measure an impact of the remoteness bonus. In interviews the retention effect of extra bonuses for
health workers in remote areas was not clear, especially because of payment problems.
6.3 AUTONOMY AND ACCOUNTABILITY PHUS
6.3.1 CAPACITIES
In the PBF approach, decentralisation to the facility level of planning, budgeting implementation and
accounting for small projects, is at the heart of the system. This is new for the health system in Sierra
Leone, which is still building up after a long period of decline. Not only the numbers of staff are
insufficient (often only one qualified staff in lower level PHUs), but also the level of training is low (e.g.
MCH-aid). DHMTs rank human resources problems highest in the list of challenges in the health
sector. This creates challenges for the tasks decentralised to the PHUs. High turnover was noticed
both in health facilities and in DHMTs.
When the PBF programme started, training was provided to DHMTs and health staff through cascade
training. Most new staffs are dependent on on-the-job orientation in PBF, provided by the DHMT. In
77% of PHUs visited during the EV, one or more of staff members had been oriented in PBF in the
past. Of the PHUs visited 48% of present in-charges understood PBF system completely and 62% of
health workers understood bonus calculations applied in PBF. 82% of the staff understood the quality
aspects assessed in the crosscutting indicators. Capacity building therefore was mentioned as key
issue in the validation workshop in March 2014.
6.3.2 PLANNING AND MANAGEMENT OF SMALL PROJECTS
The PBF programme stimulates entrepreneurial capacities of health workers, who can actively
improve their working environment. Of the PHUs in-charges 87% indicated having sufficient autonomy
for small project management, but only 57% felt the staff had enough capacities to make a plan.
Of all PHUs 62% made action plans, at least a plan how to utilise the money paid from the PBF
programme. Sometimes PHUs just produced procurement lists. Often those plans were made shortly
before money was withdrawn from the bank accounts.
The action planning should be a collaborative effort between in-charge, staff and Health Management
Committee according to the operational manual. However, this was not always the case, as shown in
table 23 below. Community participation is discussed in the next paragraph.
Table 23 Involvement in action panning of PHUs
Involved in the action planning according to PHU No health facilities Percentage
DHMT 35 15%
Health Management Committee 134 58%
Facility staff 142 59%
Council 11 4%
In-charges manage the small projects which are paid from the PBF programme sometimes with
assistance from the DHMT or from the HMC.
As per instructions in the PBF operational manual PHUs has to spend 60% on incentives for all staff
members (formula based on positions) and 40% on investments.
Health facilities invested in: • Making the work environment more conducive for services (furniture, painting and repairs of
building, solar lights, repair of motorcycles, etc.) • Equipment and supplies (BP machines, weighing scales, registers, patient cards, stationery,
paper, kerosene for stoves, etc.) • Sanitation and hygiene in the PHU or hospital (improvement of water supply, cleaning materials,
utensils, waste management, etc.) • Medical supplies (small quantities of medicines)
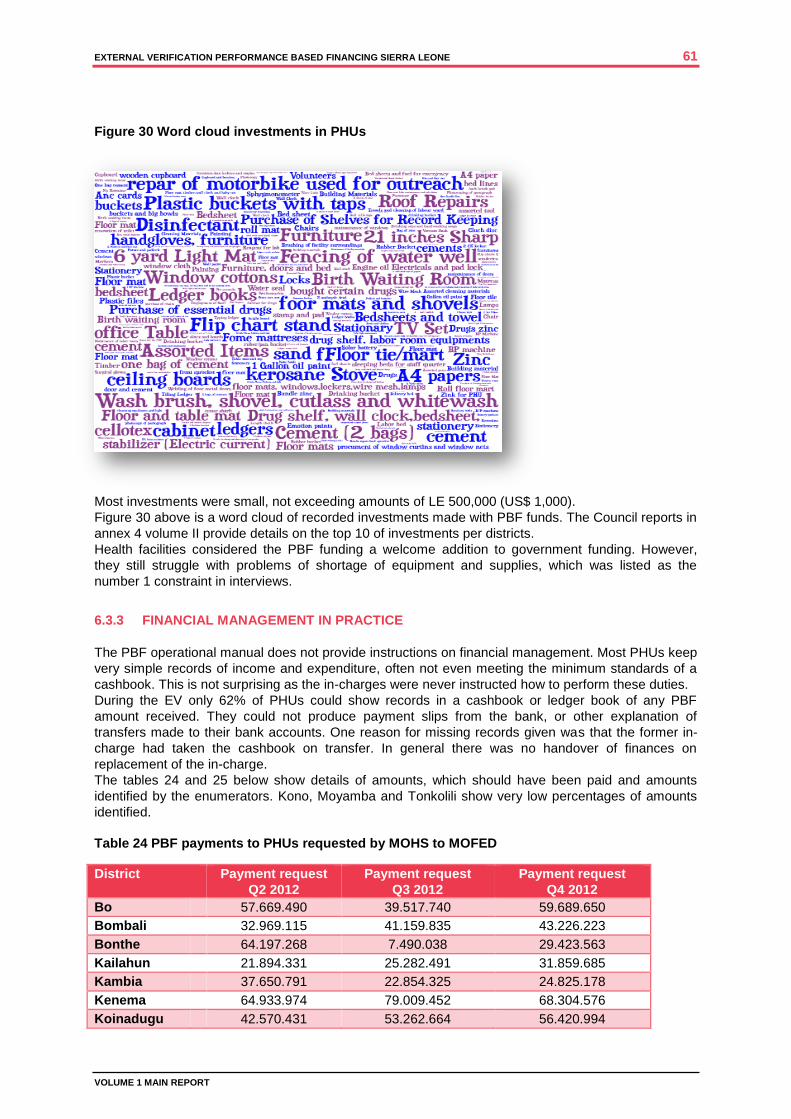
EXTERNAL VERIFICATION PERFORMANCE BASED FINANCING SIERRA LEONE 61
VOLUME 1 MAIN REPORT
Figure 30 Word cloud investments in PHUs
Most investments were small, not exceeding amounts of LE 500,000 (US$ 1,000).
Figure 30 above is a word cloud of recorded investments made with PBF funds. The Council reports in
annex 4 volume II provide details on the top 10 of investments per districts.
Health facilities considered the PBF funding a welcome addition to government funding. However,
they still struggle with problems of shortage of equipment and supplies, which was listed as the
number 1 constraint in interviews.
6.3.3 FINANCIAL MANAGEMENT IN PRACTICE
The PBF operational manual does not provide instructions on financial management. Most PHUs keep
very simple records of income and expenditure, often not even meeting the minimum standards of a
cashbook. This is not surprising as the in-charges were never instructed how to perform these duties.
During the EV only 62% of PHUs could show records in a cashbook or ledger book of any PBF
amount received. They could not produce payment slips from the bank, or other explanation of
transfers made to their bank accounts. One reason for missing records given was that the former in-
charge had taken the cashbook on transfer. In general there was no handover of finances on
replacement of the in-charge.
The tables 24 and 25 below show details of amounts, which should have been paid and amounts
identified by the enumerators. Kono, Moyamba and Tonkolili show very low percentages of amounts
identified.
Table 24 PBF payments to PHUs requested by MOHS to MOFED
District Payment request
Q2 2012
Payment request
Q3 2012
Payment request
Q4 2012
Bo 57.669.490 39.517.740 59.689.650
Bombali 32.969.115 41.159.835 43.226.223
Bonthe 64.197.268 7.490.038 29.423.563
Kailahun 21.894.331 25.282.491 31.859.685
Kambia 37.650.791 22.854.325 24.825.178
Kenema 64.933.974 79.009.452 68.304.576
Koinadugu 42.570.431 53.262.664 56.420.994
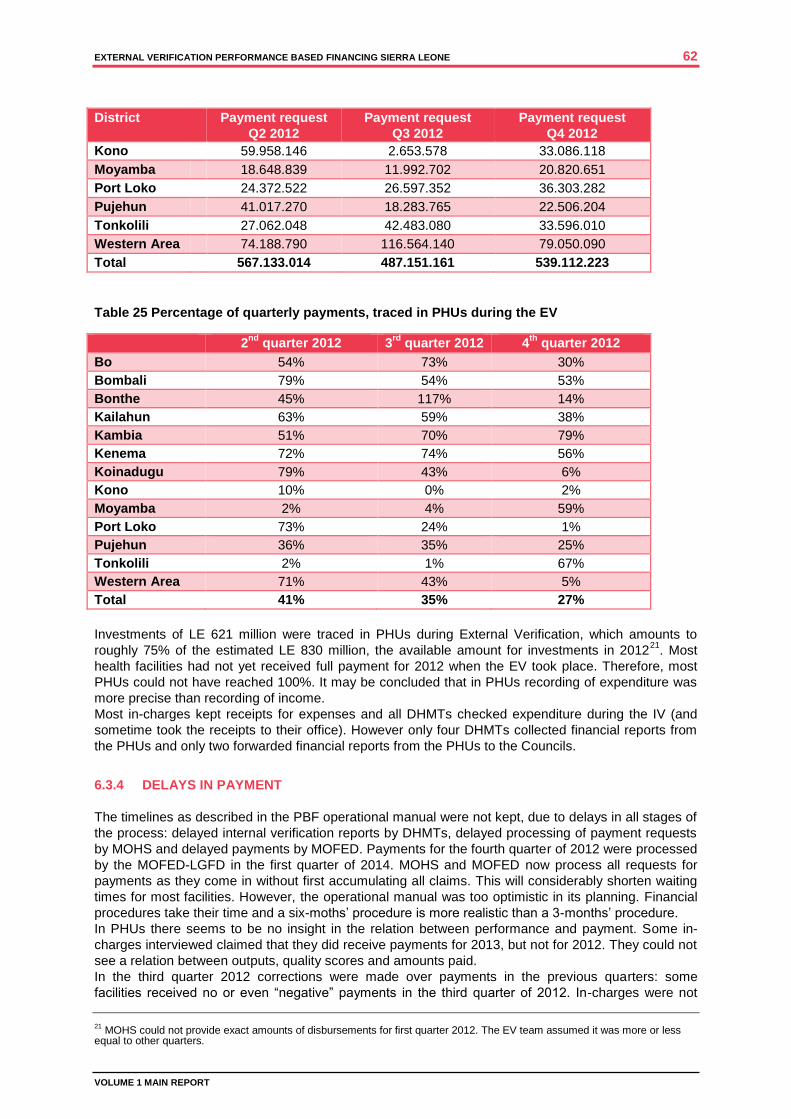
EXTERNAL VERIFICATION PERFORMANCE BASED FINANCING SIERRA LEONE 62
VOLUME 1 MAIN REPORT
District Payment request
Q2 2012
Payment request
Q3 2012
Payment request
Q4 2012
Kono 59.958.146 2.653.578 33.086.118
Moyamba 18.648.839 11.992.702 20.820.651
Port Loko 24.372.522 26.597.352 36.303.282
Pujehun 41.017.270 18.283.765 22.506.204
Tonkolili 27.062.048 42.483.080 33.596.010
Western Area 74.188.790 116.564.140 79.050.090
Total 567.133.014 487.151.161 539.112.223
Table 25 Percentage of quarterly payments, traced in PHUs during the EV
2nd
quarter 2012 3rd
quarter 2012 4th
quarter 2012
Bo 54% 73% 30%
Bombali 79% 54% 53%
Bonthe 45% 117% 14%
Kailahun 63% 59% 38%
Kambia 51% 70% 79%
Kenema 72% 74% 56%
Koinadugu 79% 43% 6%
Kono 10% 0% 2%
Moyamba 2% 4% 59%
Port Loko 73% 24% 1%
Pujehun 36% 35% 25%
Tonkolili 2% 1% 67%
Western Area 71% 43% 5%
Total 41% 35% 27%
Investments of LE 621 million were traced in PHUs during External Verification, which amounts to
roughly 75% of the estimated LE 830 million, the available amount for investments in 201221
. Most
health facilities had not yet received full payment for 2012 when the EV took place. Therefore, most
PHUs could not have reached 100%. It may be concluded that in PHUs recording of expenditure was
more precise than recording of income.
Most in-charges kept receipts for expenses and all DHMTs checked expenditure during the IV (and
sometime took the receipts to their office). However only four DHMTs collected financial reports from
the PHUs and only two forwarded financial reports from the PHUs to the Councils.
6.3.4 DELAYS IN PAYMENT
The timelines as described in the PBF operational manual were not kept, due to delays in all stages of
the process: delayed internal verification reports by DHMTs, delayed processing of payment requests
by MOHS and delayed payments by MOFED. Payments for the fourth quarter of 2012 were processed
by the MOFED-LGFD in the first quarter of 2014. MOHS and MOFED now process all requests for
payments as they come in without first accumulating all claims. This will considerably shorten waiting
times for most facilities. However, the operational manual was too optimistic in its planning. Financial
procedures take their time and a six-moths’ procedure is more realistic than a 3-months’ procedure.
In PHUs there seems to be no insight in the relation between performance and payment. Some in-
charges interviewed claimed that they did receive payments for 2013, but not for 2012. They could not
see a relation between outputs, quality scores and amounts paid.
In the third quarter 2012 corrections were made over payments in the previous quarters: some
facilities received no or even “negative” payments in the third quarter of 2012. In-charges were not
21
MOHS could not provide exact amounts of disbursements for first quarter 2012. The EV team assumed it was more or less equal to other quarters.
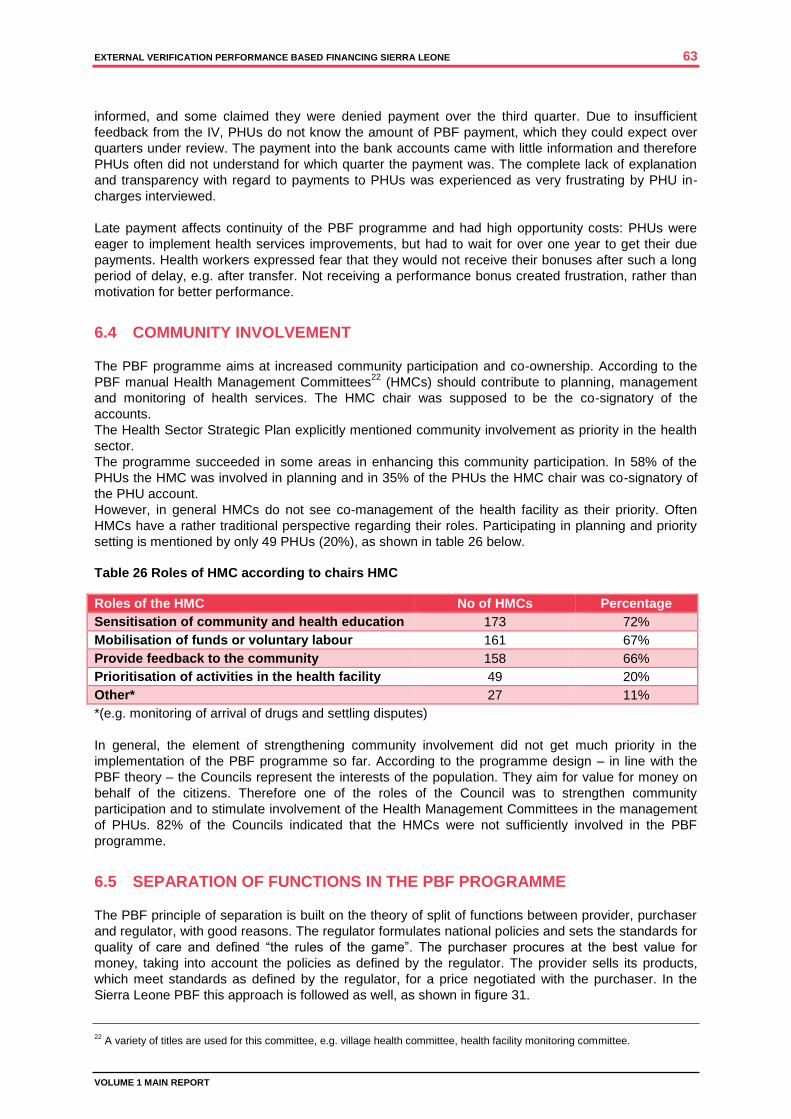
EXTERNAL VERIFICATION PERFORMANCE BASED FINANCING SIERRA LEONE 63
VOLUME 1 MAIN REPORT
informed, and some claimed they were denied payment over the third quarter. Due to insufficient
feedback from the IV, PHUs do not know the amount of PBF payment, which they could expect over
quarters under review. The payment into the bank accounts came with little information and therefore
PHUs often did not understand for which quarter the payment was. The complete lack of explanation
and transparency with regard to payments to PHUs was experienced as very frustrating by PHU in-
charges interviewed.
Late payment affects continuity of the PBF programme and had high opportunity costs: PHUs were
eager to implement health services improvements, but had to wait for over one year to get their due
payments. Health workers expressed fear that they would not receive their bonuses after such a long
period of delay, e.g. after transfer. Not receiving a performance bonus created frustration, rather than
motivation for better performance.
6.4 COMMUNITY INVOLVEMENT
The PBF programme aims at increased community participation and co-ownership. According to the
PBF manual Health Management Committees22
(HMCs) should contribute to planning, management
and monitoring of health services. The HMC chair was supposed to be the co-signatory of the
accounts.
The Health Sector Strategic Plan explicitly mentioned community involvement as priority in the health
sector.
The programme succeeded in some areas in enhancing this community participation. In 58% of the
PHUs the HMC was involved in planning and in 35% of the PHUs the HMC chair was co-signatory of
the PHU account.
However, in general HMCs do not see co-management of the health facility as their priority. Often
HMCs have a rather traditional perspective regarding their roles. Participating in planning and priority
setting is mentioned by only 49 PHUs (20%), as shown in table 26 below.
Table 26 Roles of HMC according to chairs HMC
Roles of the HMC No of HMCs Percentage
Sensitisation of community and health education 173 72%
Mobilisation of funds or voluntary labour 161 67%
Provide feedback to the community 158 66%
Prioritisation of activities in the health facility 49 20%
Other* 27 11%
*(e.g. monitoring of arrival of drugs and settling disputes)
In general, the element of strengthening community involvement did not get much priority in the
implementation of the PBF programme so far. According to the programme design – in line with the
PBF theory – the Councils represent the interests of the population. They aim for value for money on
behalf of the citizens. Therefore one of the roles of the Council was to strengthen community
participation and to stimulate involvement of the Health Management Committees in the management
of PHUs. 82% of the Councils indicated that the HMCs were not sufficiently involved in the PBF
programme.
6.5 SEPARATION OF FUNCTIONS IN THE PBF PROGRAMME
The PBF principle of separation is built on the theory of split of functions between provider, purchaser
and regulator, with good reasons. The regulator formulates national policies and sets the standards for
quality of care and defined “the rules of the game”. The purchaser procures at the best value for
money, taking into account the policies as defined by the regulator. The provider sells its products,
which meet standards as defined by the regulator, for a price negotiated with the purchaser. In the
Sierra Leone PBF this approach is followed as well, as shown in figure 31.
22
A variety of titles are used for this committee, e.g. village health committee, health facility monitoring committee.
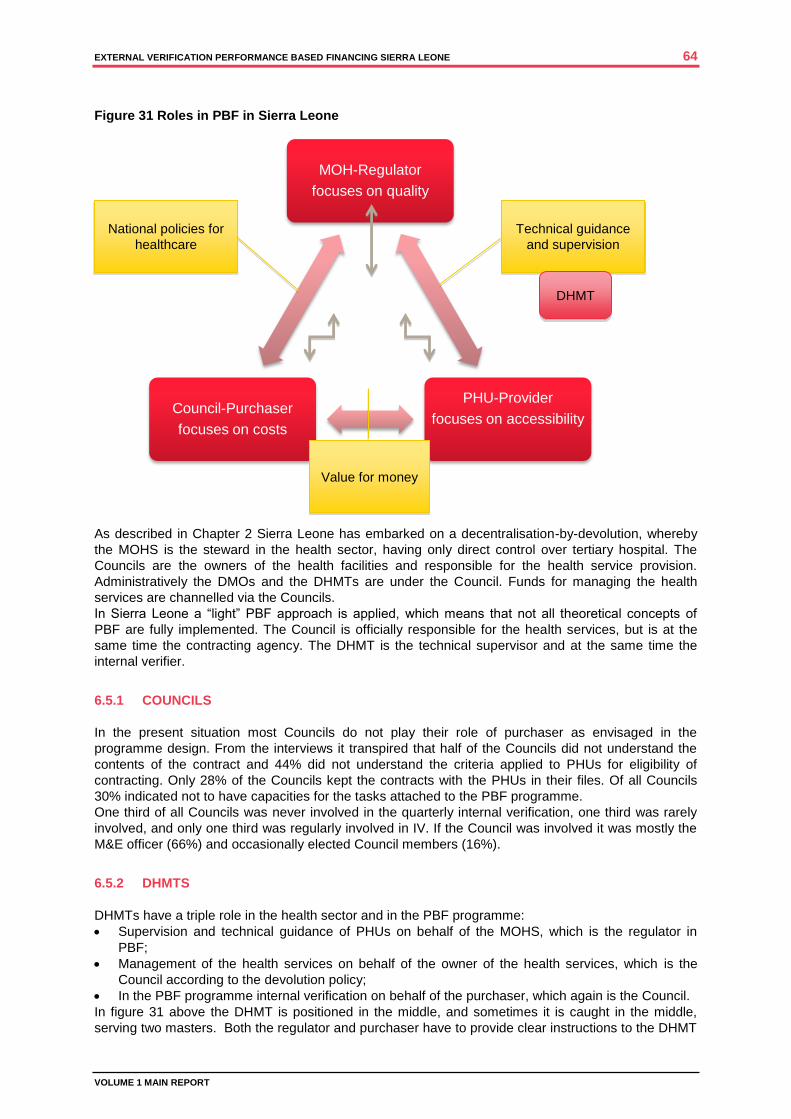
EXTERNAL VERIFICATION PERFORMANCE BASED FINANCING SIERRA LEONE 64
VOLUME 1 MAIN REPORT
MOH-Regulator
focuses on quality
PHU-Provider
focuses on accessibility
Council-Purchaser
focuses on costs
Figure 31 Roles in PBF in Sierra Leone
As described in Chapter 2 Sierra Leone has embarked on a decentralisation-by-devolution, whereby
the MOHS is the steward in the health sector, having only direct control over tertiary hospital. The
Councils are the owners of the health facilities and responsible for the health service provision.
Administratively the DMOs and the DHMTs are under the Council. Funds for managing the health
services are channelled via the Councils.
In Sierra Leone a “light” PBF approach is applied, which means that not all theoretical concepts of
PBF are fully implemented. The Council is officially responsible for the health services, but is at the
same time the contracting agency. The DHMT is the technical supervisor and at the same time the
internal verifier.
6.5.1 COUNCILS
In the present situation most Councils do not play their role of purchaser as envisaged in the
programme design. From the interviews it transpired that half of the Councils did not understand the
contents of the contract and 44% did not understand the criteria applied to PHUs for eligibility of
contracting. Only 28% of the Councils kept the contracts with the PHUs in their files. Of all Councils
30% indicated not to have capacities for the tasks attached to the PBF programme.
One third of all Councils was never involved in the quarterly internal verification, one third was rarely
involved, and only one third was regularly involved in IV. If the Council was involved it was mostly the
M&E officer (66%) and occasionally elected Council members (16%).
6.5.2 DHMTS
DHMTs have a triple role in the health sector and in the PBF programme:
Supervision and technical guidance of PHUs on behalf of the MOHS, which is the regulator in
PBF;
Management of the health services on behalf of the owner of the health services, which is the
Council according to the devolution policy;
In the PBF programme internal verification on behalf of the purchaser, which again is the Council.
In figure 31 above the DHMT is positioned in the middle, and sometimes it is caught in the middle,
serving two masters. Both the regulator and purchaser have to provide clear instructions to the DHMT
Technical guidance
and supervision
National policies for
healthcare
Value for money
DHMT
EXTERNAL VERIFICATION PERFORMANCE BASED FINANCING SIERRA LEONE 65
VOLUME 1 MAIN REPORT
ensuring that all interests are covered adequately. The EV came across several challenges
concerning the DHMT’s role.
Internal verification is taking place systematically. 94% of the PHUs indicated that DHMTs performed
regular supervision and this was confirmed by the DHMTs. The IV puts a huge strain on the DHMTs,
as it is time consuming. With 50 to 100 PHUs in one district the process may take weeks every
quarter, claiming time from DHMT members and claiming means of transport from the office. More
than half of the DHMTs perform the IV within 4 hours; one-fourth spends between 4 and 6 hours and
few more than 6 hours. Based on the experience in the EV it is impossible to do a thorough verification
including review of registers and assessment of the crosscutting issues within 4 hours, certainly if it is
combined with supervision and if it includes travel time.
The results of the internal verification have been discussed extensively in Chapter 4. In general, in the
districts the results of internal verification of output indicators and crosscutting issues were higher (in
some cases significantly higher) that the external verification.
Financial management. DHMTs perform some supervision regarding financial management in PHUs;
One-third of the DHMTs receive a financial report from PHUs, but more often copies of receipts of
purchases. Only two of the 13 DHMTs forwarded them to the Council. DMOs in two districts are co-
signatory of the PHU accounts, and eight DMOs have to check the investment plan before the PHU
can withdraw money from the bank. None of the DHMTs introduced cashbooks in the PHUs.
Capacity building. Officially, the purchaser has the task to ensure that provider understands the rules
for payment for service delivery, i.e. how to register, how to report, how to manage funds, how to plan
for activities, etc. The Councils could delegate the task of capacity building to the DHMT. DHMTs have
indicated to perform on-the-job training, but concentrate more on technical issues than administrative
issues (like financial management). During the EV only half of the in-charges of PHUs indicated to
understand the PBF programme fully, and DHMTs indicated a huge need for capacity building.
6.5.3 MOHS
The MOHS has more functions than strictly according to the PBF theory. Besides producing payment
requests to MOFED, the PBF technical team is responsible for overseeing the verification process by
signing contracts with the internal verification teams, for the M&E systems (e.g. through HMIS) and
quarterly and annual reporting. The PBF programme is managed by a technical team consisting of
representatives from different departments in MOHS (Directorate of Policy, Planning and Information,
Directorate of Primary Health Care, Directorate of Reproductive and Child Health, Directorate of
Financial Management, Human Resources Division). The technical team provides training and
capacity building. The PBF technical team interacts with the Development Partners in the Steering
Committee.
Last year the PBF technical team was reshuffled. The new PBF technical team has not yet performed
a national verification; the previous team did perform verification, but did not produce a report. The EV
team could not check which issues they came across. The new PBF team did not perform data
triangulation of HMIS, IV and F-reports, which did show major data differences in the EV. It processed
payment requests to the MOFED based on IV reports only.
6.5.4 MOFED
The MOFED - Local Government Finance Department is responsible for disbursement of the PBF
fund after request by the MOHS and supervision of financial management by the Local Councils. The
MOFED completed financial reports on PBF for the World Bank, but in those reports only accounted
for money transferred to the PHUs, not how the money was spent in practice.
EXTERNAL VERIFICATION PERFORMANCE BASED FINANCING SIERRA LEONE 66
VOLUME 1 MAIN REPORT
6.6 DEFINITION OF INDICATORS
The domains and indicators and described in Chapter 4.1. Indicators are the backbone for payment to
the PHUs and hospitals. Several indicators did not have SMART definitions in the operational manual
or other documentation. In practice internal verification teams applied no uniform definitions. Therefore
the consultants invited the stakeholders during the inception workshop to work jointly on the
formulation of definitions for indicators and certain terminology. These agreed definitions have been
applied in the external verification. Not having very clear indicators may have affected the internal
verification, leading to variation in scores between DHMTs.
6.7 CONTRACTS
PHUs were contracted for service delivery in tripartite contracts with DHMTs and Councils. As has
been explained above those contracts did not play any further role in the PBF implementation. The
procedures described, e.g. with regard to financial reporting were not followed. Never were any
sanctions applied in case when parties were not adhering to their duties.
Non-governmental healthcare providers would be eligible for contracting as well, according to the PBF
manual. In practice, none was contracted.
6.8 HOSPITAL PBF
6.8.1 CONTRACTS
Princess Christian Maternity Hospital (PCMH) and Ola During Children’s Hospital (ODCH) are the only
hospitals benefiting from the PBF programme. In the hospital PBF system there is strong emphasis on
learning, exchange of best practices, recommendations for improvement and assessment of the
follow-up of these recommendations during the next verification. Following the PBF operational
manual, in 2012 tripartite agreements were made between the Freetown Council, the MOHS and the
hospitals, in which roles and responsibilities were described. The Council acted as the purchaser.
However, the Council did not play a role in internal verification. Per January 2014 tertiary hospitals
were transferred back to the MOHS, but contracts have not been adjusted.
6.8.2 IMPLEMENTATION
ODCH has installed a Quality Assurance (QA) Committee; in PCMH the management team acts as
QA committee. These committees perform self-assessment on a monthly basis, using the PBF
checklist, as described in Chapter 4.1. The self-assessment is the starting point for setting priorities for
quality improvement.
The national PBF technical team, together with invited experts from other ministries, performed the
internal verification. It was noted that every time a different team did the internal verification, which
according to the hospitals resulted in inconsistent recommendations for improvement. The second and
third quarter 2012 internal verification was combined.
6.8.3 INDICATORS
The indicators in eight domains all contribute to a score for that domain. Not all indicators are SMART
(e.g. “are there functional toilets in the hospital”), and not all indicators are applicable (e.g. “clean
labour ward” in ODCH). The scoring may therefore be subjective. Nevertheless, scoring was often
high in the IV, as discussed in chapter 4. The IV forms often only have scores, with the remarks
column left blank. It is therefore not clear where the scoring is based on, making it difficult for a next
team to follow up.
The indicators only concentrate on quality and do not take output into account, with as argument that
tertiary hospitals are dependent on referrals and should not increase their output, taking patients away
from lower level facilities. However, the introduction of free health care has put a strain on quality of
EXTERNAL VERIFICATION PERFORMANCE BASED FINANCING SIERRA LEONE 67
VOLUME 1 MAIN REPORT
care in hospitals. According to respondents, patient numbers increased 4 to 10-fold as a result of
abolishment of user fees, while financial compensation and inputs did not increase proportionally.
6.8.4 EXPENDITURE
Similar to the PBF project in PHUs, hospitals spend a maximum of 60% on staff incentives and 40%
on investments. The incentives are for all staffs and tied to their salary. For most staffs it means an
extra month’s salary every quarter. All workers are therefore very much engaged in PBF. Both
hospitals have introduced a performance element in bonus payment, first only presence and now also
commitment, to vary the height of performance bonus.
The 40% investment money is a lifeline for the hospitals, constituting 40% - 60% of their funds for
running costs. As Government funds are tied to strict procedures through the Freetown City Council,
and often delayed due to cumbersome bureaucracy, this free money offers an opportunity to solve
problems quickly, e.g. shortage of medicines, laboratory supplies, gloves, maintaining water supply,
etc. The funds are also used to procure equipment, stationery and bed linen. Hospitals make a
quarterly investment plan together with the heads of department.
Like PHUs, hospitals are affected by delayed verification and slow procedures of disbursement, which
affects continuity of the work. Recently, Government has informed that their regular budget would be
lowered, because the hospitals get PBF funding.
6.8.5 NON-PBF HOSPITALS
The two non-PBF hospitals verified, operate at very different levels. Rokupa Hospital is a very busy
well-equipped district hospital with many workers and patients. It has a busy theatre and labour ward.
Macaulay Medical Centre is a dilapidated health centre, with a labour ward and theatre under
construction. Their scores in the external verification cannot be compared.
The lesson learned form this comparison is that introduction of PBF requires a good programme of
training and introduction of systems and procedures. Verification forms should be more custom-made
as every level of hospital has other circumstances to be assessed.
SUMMARY OF SYSTEMS ANALYSIS
THE PBF PROGRAMME WORKS COMPLEMENTARY TO FREE HEALTHCARE, AND
OFFERS TO HEALTH FACILITIES A COMPENSATION FOR THE LOSS OF INCOME
THROUGH PATIENT FEES. THE PROGRAMME HAS BEEN SUCCESSFUL IN THIS.
THE PROGRAMME HAS SUCCEEDED IN PROVIDING MORE AUTONOMY TO
HEALTH FACILITIES TO MANAGE THEIR OWN SMALL PROJECTS, WHICH
CONTRIBUTE TO BETTER WORK ENVIRONMENT: MORE HYGIENE, BETTER
EQUIPPED BUILDINGS AND BETTER SUPPLIES HAVE BEEN ACHIEVED.
FINANCIAL MANAGEMENT IS A WEAK AREA, WITH VIRTUALLY NO SYSTEMS IN
PLACE AT GRASS ROOT LEVEL.
LATE PAYMENT DURING THE PERIOD OF REVIEW AFFECTED CONTINUITY OF THE
PBF PROGRAMME AND HAD HIGH OPPORTUNITY COSTS: PHUS WERE EAGER TO
IMPLEMENT HEALTH SERVICES IMPROVEMENTS, BUT HAD TO WAIT FOR OVER
ONE YEAR TO GET THEIR DUE PAYMENTS.
HEALTH WORKERS EXPRESSED FEAR THAT THEY WOULD NOT RECEIVE THEIR
BONUSES AFTER SUCH A LONG PERIOD OF DELAY, E.G. AFTER TRANSFER. NOT
RECEIVING A PERFORMANCE BONUS CREATED FRUSTRATION, RATHER THAN
MOTIVATION FOR BETTER PERFORMANCE.
THE PROGRAMME HAS SUCCEEDED TO SOME EXTENT IN IMPROVING
COMMUNITY CONTRIBUTION TO MANAGEMENT OF HEALTH FACILITIES,
ALTHOUGH THE CAPACITIES ARE STILL LIMITED.
IN SIERRA LEONE A “LIGHT” PBF APPROACH IS APPLIED, WHICH MEANS THAT

EXTERNAL VERIFICATION PERFORMANCE BASED FINANCING SIERRA LEONE 68
VOLUME 1 MAIN REPORT
NOT ALL THEORETICAL CONCEPTS OF PBF WITH REGARD TO SEPARATION OF
RESPONSIBILITIES (E.G. HEALTH RESULTS INNOVATION TRUST FUND23
) ARE
FULLY IMPLEMENTED. THE LOCAL COUNCIL IS OFFICIALLY RESPONSIBLE FOR
THE HEALTH SERVICES, BUT IS AT THE SAME TIME THE CONTRACTING AGENCY.
THE DHMT IS THE TECHNICAL SUPERVISOR AND AT THE SAME TIME THE
INTERNAL VERIFIER. IN PRACTICE THE COLLABORATION BETWEEN COUNCILS
AND DHMTS OFTEN IS NOT AS ENVISAGED IN SIERRA LEONE’S PBF PLAN. THE
DHMTS OFTEN OPERATE INDEPENDENTLY, AND COUNCILS DO NOT FEEL
ENGAGED IN THE PROGRAMME.
THE HOSPITAL PBF HAS STIMULATED THE TWO INVOLVED HOSPITALS TO
IMPROVE PERFORMANCE IN MANY AREAS. HOSPITALS ARE BECOMING
DEPENDENT ON THESE FUNDS AS PART OF THEIR CORE FINANCING.
23
https://www.rbfhealth.org
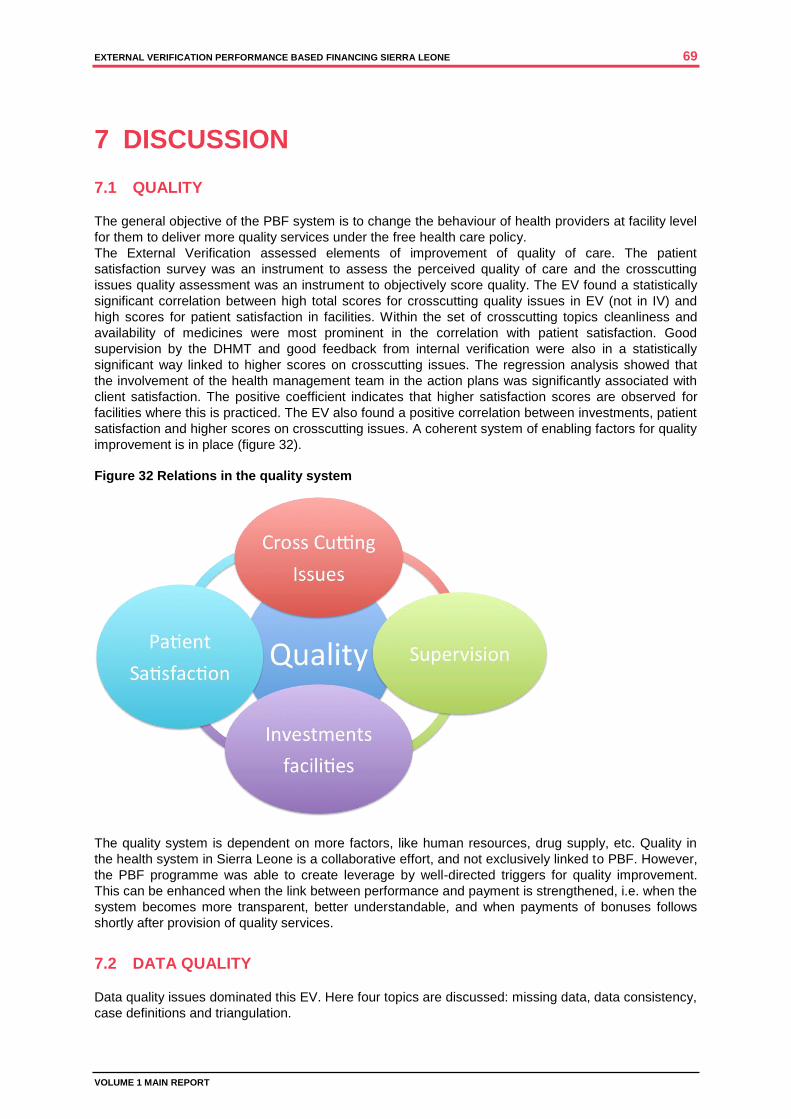
EXTERNAL VERIFICATION PERFORMANCE BASED FINANCING SIERRA LEONE 69
VOLUME 1 MAIN REPORT
7 DISCUSSION
7.1 QUALITY
The general objective of the PBF system is to change the behaviour of health providers at facility level
for them to deliver more quality services under the free health care policy.
The External Verification assessed elements of improvement of quality of care. The patient
satisfaction survey was an instrument to assess the perceived quality of care and the crosscutting
issues quality assessment was an instrument to objectively score quality. The EV found a statistically
significant correlation between high total scores for crosscutting quality issues in EV (not in IV) and
high scores for patient satisfaction in facilities. Within the set of crosscutting topics cleanliness and
availability of medicines were most prominent in the correlation with patient satisfaction. Good
supervision by the DHMT and good feedback from internal verification were also in a statistically
significant way linked to higher scores on crosscutting issues. The regression analysis showed that
the involvement of the health management team in the action plans was significantly associated with
client satisfaction. The positive coefficient indicates that higher satisfaction scores are observed for
facilities where this is practiced. The EV also found a positive correlation between investments, patient
satisfaction and higher scores on crosscutting issues. A coherent system of enabling factors for quality
improvement is in place (figure 32).
Figure 32 Relations in the quality system
The quality system is dependent on more factors, like human resources, drug supply, etc. Quality in
the health system in Sierra Leone is a collaborative effort, and not exclusively linked to PBF. However,
the PBF programme was able to create leverage by well-directed triggers for quality improvement.
This can be enhanced when the link between performance and payment is strengthened, i.e. when the
system becomes more transparent, better understandable, and when payments of bonuses follows
shortly after provision of quality services.
7.2 DATA QUALITY
Data quality issues dominated this EV. Here four topics are discussed: missing data, data consistency,
case definitions and triangulation.
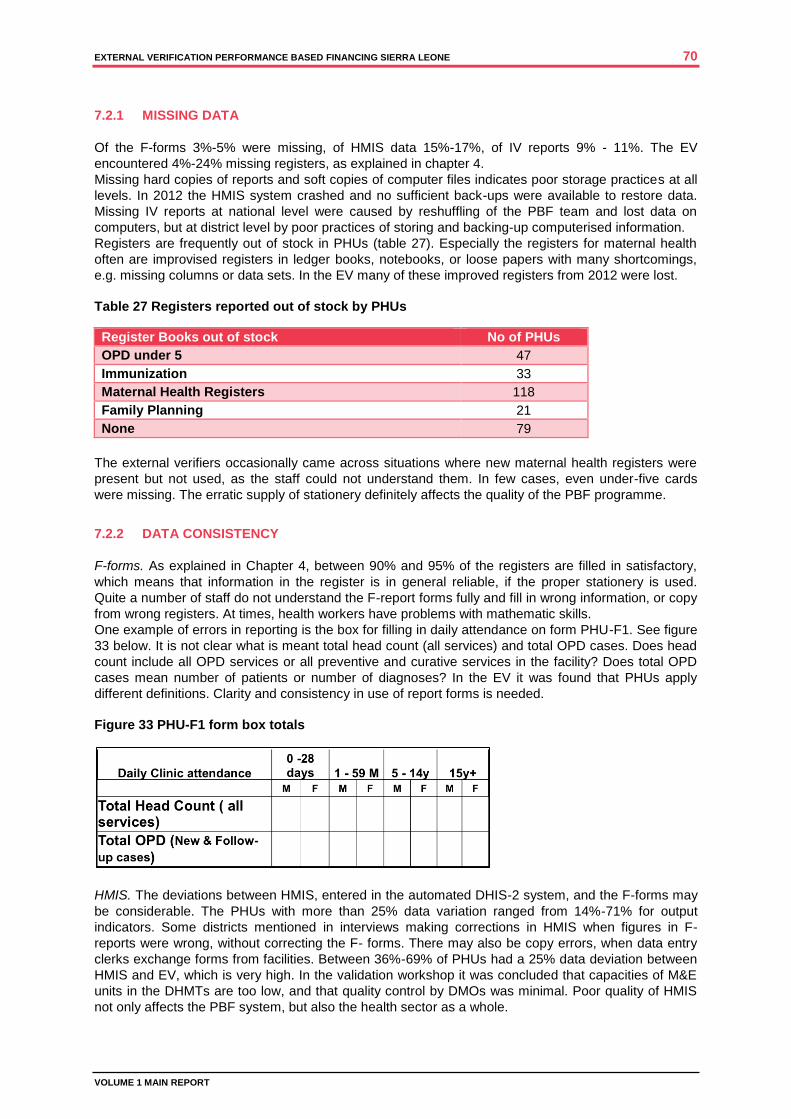
EXTERNAL VERIFICATION PERFORMANCE BASED FINANCING SIERRA LEONE 70
VOLUME 1 MAIN REPORT
7.2.1 MISSING DATA
Of the F-forms 3%-5% were missing, of HMIS data 15%-17%, of IV reports 9% - 11%. The EV
encountered 4%-24% missing registers, as explained in chapter 4.
Missing hard copies of reports and soft copies of computer files indicates poor storage practices at all
levels. In 2012 the HMIS system crashed and no sufficient back-ups were available to restore data.
Missing IV reports at national level were caused by reshuffling of the PBF team and lost data on
computers, but at district level by poor practices of storing and backing-up computerised information.
Registers are frequently out of stock in PHUs (table 27). Especially the registers for maternal health
often are improvised registers in ledger books, notebooks, or loose papers with many shortcomings,
e.g. missing columns or data sets. In the EV many of these improved registers from 2012 were lost.
Table 27 Registers reported out of stock by PHUs
Register Books out of stock No of PHUs
OPD under 5 47
Immunization 33
Maternal Health Registers 118
Family Planning 21
None 79
The external verifiers occasionally came across situations where new maternal health registers were
present but not used, as the staff could not understand them. In few cases, even under-five cards
were missing. The erratic supply of stationery definitely affects the quality of the PBF programme.
7.2.2 DATA CONSISTENCY
F-forms. As explained in Chapter 4, between 90% and 95% of the registers are filled in satisfactory,
which means that information in the register is in general reliable, if the proper stationery is used.
Quite a number of staff do not understand the F-report forms fully and fill in wrong information, or copy
from wrong registers. At times, health workers have problems with mathematic skills.
One example of errors in reporting is the box for filling in daily attendance on form PHU-F1. See figure
33 below. It is not clear what is meant total head count (all services) and total OPD cases. Does head
count include all OPD services or all preventive and curative services in the facility? Does total OPD
cases mean number of patients or number of diagnoses? In the EV it was found that PHUs apply
different definitions. Clarity and consistency in use of report forms is needed.
Figure 33 PHU-F1 form box totals
HMIS. The deviations between HMIS, entered in the automated DHIS-2 system, and the F-forms may
be considerable. The PHUs with more than 25% data variation ranged from 14%-71% for output
indicators. Some districts mentioned in interviews making corrections in HMIS when figures in F-
reports were wrong, without correcting the F- forms. There may also be copy errors, when data entry
clerks exchange forms from facilities. Between 36%-69% of PHUs had a 25% data deviation between
HMIS and EV, which is very high. In the validation workshop it was concluded that capacities of M&E
units in the DHMTs are too low, and that quality control by DMOs was minimal. Poor quality of HMIS
not only affects the PBF system, but also the health sector as a whole.
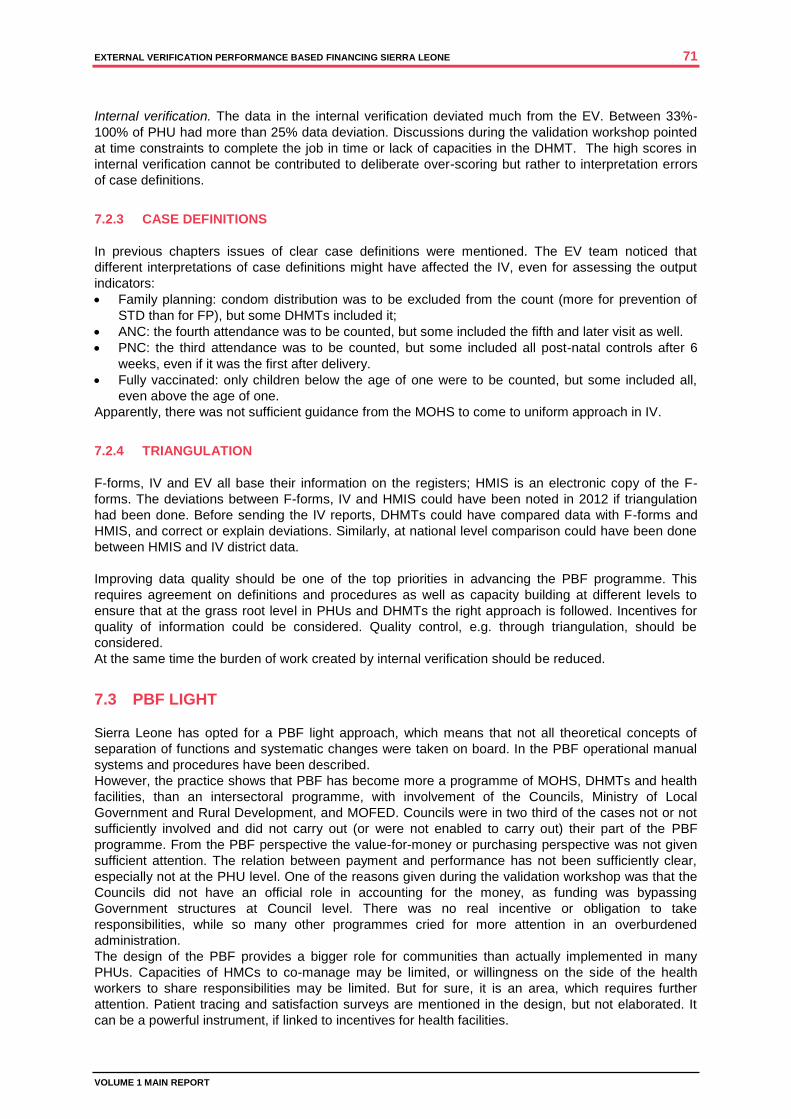
EXTERNAL VERIFICATION PERFORMANCE BASED FINANCING SIERRA LEONE 71
VOLUME 1 MAIN REPORT
Internal verification. The data in the internal verification deviated much from the EV. Between 33%-
100% of PHU had more than 25% data deviation. Discussions during the validation workshop pointed
at time constraints to complete the job in time or lack of capacities in the DHMT. The high scores in
internal verification cannot be contributed to deliberate over-scoring but rather to interpretation errors
of case definitions.
7.2.3 CASE DEFINITIONS
In previous chapters issues of clear case definitions were mentioned. The EV team noticed that
different interpretations of case definitions might have affected the IV, even for assessing the output
indicators:
Family planning: condom distribution was to be excluded from the count (more for prevention of
STD than for FP), but some DHMTs included it;
ANC: the fourth attendance was to be counted, but some included the fifth and later visit as well.
PNC: the third attendance was to be counted, but some included all post-natal controls after 6
weeks, even if it was the first after delivery.
Fully vaccinated: only children below the age of one were to be counted, but some included all,
even above the age of one.
Apparently, there was not sufficient guidance from the MOHS to come to uniform approach in IV.
7.2.4 TRIANGULATION
F-forms, IV and EV all base their information on the registers; HMIS is an electronic copy of the F-
forms. The deviations between F-forms, IV and HMIS could have been noted in 2012 if triangulation
had been done. Before sending the IV reports, DHMTs could have compared data with F-forms and
HMIS, and correct or explain deviations. Similarly, at national level comparison could have been done
between HMIS and IV district data.
Improving data quality should be one of the top priorities in advancing the PBF programme. This
requires agreement on definitions and procedures as well as capacity building at different levels to
ensure that at the grass root level in PHUs and DHMTs the right approach is followed. Incentives for
quality of information could be considered. Quality control, e.g. through triangulation, should be
considered.
At the same time the burden of work created by internal verification should be reduced.
7.3 PBF LIGHT
Sierra Leone has opted for a PBF light approach, which means that not all theoretical concepts of
separation of functions and systematic changes were taken on board. In the PBF operational manual
systems and procedures have been described.
However, the practice shows that PBF has become more a programme of MOHS, DHMTs and health
facilities, than an intersectoral programme, with involvement of the Councils, Ministry of Local
Government and Rural Development, and MOFED. Councils were in two third of the cases not or not
sufficiently involved and did not carry out (or were not enabled to carry out) their part of the PBF
programme. From the PBF perspective the value-for-money or purchasing perspective was not given
sufficient attention. The relation between payment and performance has not been sufficiently clear,
especially not at the PHU level. One of the reasons given during the validation workshop was that the
Councils did not have an official role in accounting for the money, as funding was bypassing
Government structures at Council level. There was no real incentive or obligation to take
responsibilities, while so many other programmes cried for more attention in an overburdened
administration.
The design of the PBF provides a bigger role for communities than actually implemented in many
PHUs. Capacities of HMCs to co-manage may be limited, or willingness on the side of the health
workers to share responsibilities may be limited. But for sure, it is an area, which requires further
attention. Patient tracing and satisfaction surveys are mentioned in the design, but not elaborated. It
can be a powerful instrument, if linked to incentives for health facilities.
EXTERNAL VERIFICATION PERFORMANCE BASED FINANCING SIERRA LEONE 72
VOLUME 1 MAIN REPORT
The PHU design as described in the operational manual is sufficiently robust to guarantee a
performance based financing approach, and reconfirmation of that commitment and restart of that
system would bring more balance in the PBF programme. It requires new engagement of
stakeholders, maybe making adjustments in the procedures where needed.
7.4 FINANCIAL MANAGEMENT
Financial management is discussed in paragraph 6.3.4. The omission in the PBF manual to formulate
requirements and to provide recording and reporting instructions, did never get a follow up. It more or
less ‘fell through the cracks in the system’. Given the very limited financial management capacities of
grass root health workers, it is surprising that most expenditure could be explained and even justified
with documents and receipts in this EV (although income could not be explained, partly because
banks do not provide payment slips).
The fact that Councils did not feel obliged to control financial management, because money was
bypassing their system, is remarkable. Apparently in the contracting process no clear agreement was
reached on roles and responsibilities of partners.
The most important observation during this External Validation was that due to long delays in
payments, the lack of transparency in how amounts were reached, health workers at grass root level
completely missed the “emotion” of payment for performance”. Money was not seen anymore as a
reward for an effort during a given quarter, but as a (long-overdue) welcome addition to other sources
of income or supplies. MOHS and MOFED have started to catch up with clearing the backlog of
payments over 2013, and have changed to processing of payment requests. Hopefully it will go hand
in hand with an effort to reinstate the “payment for performance feeling” in the system.
The issue of payment for travel allowances and payment for incentives for DHMTs and Councils is
another issue to be clarified for involved stakeholders. Present confusion does not contribute to
motivation of DHMT members or Council officials to perform internal verification.
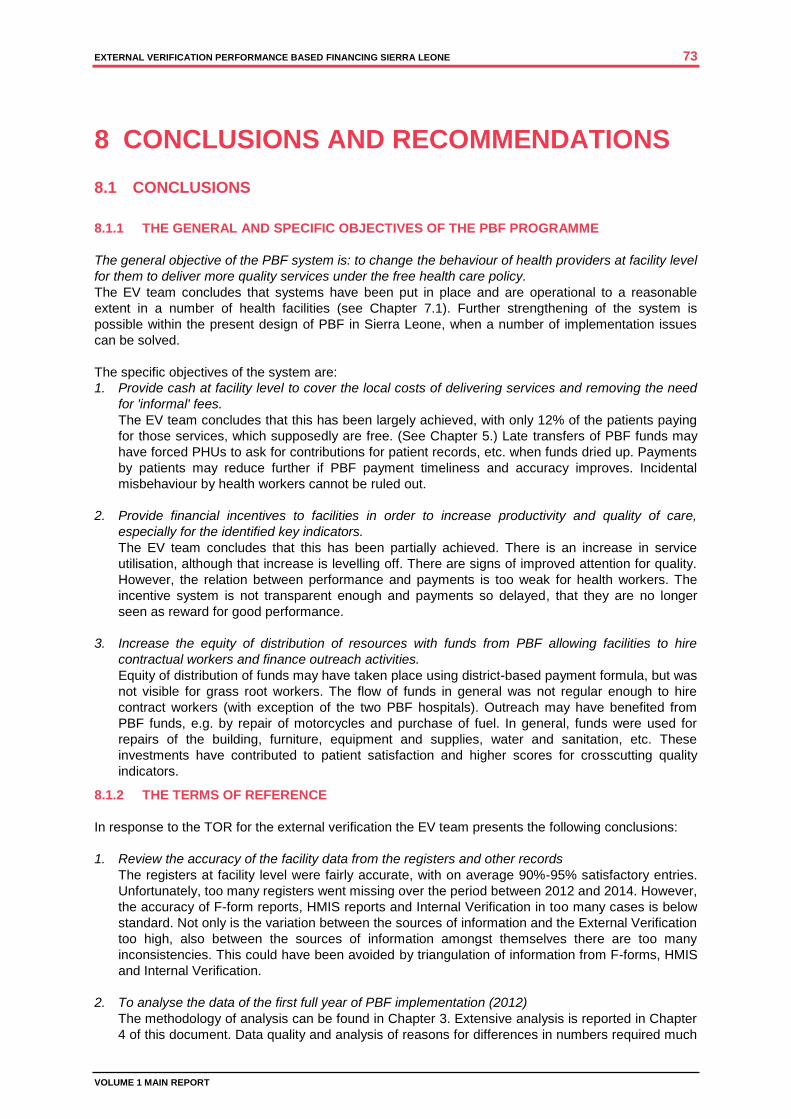
EXTERNAL VERIFICATION PERFORMANCE BASED FINANCING SIERRA LEONE 73
VOLUME 1 MAIN REPORT
8 CONCLUSIONS AND RECOMMENDATIONS
8.1 CONCLUSIONS
8.1.1 THE GENERAL AND SPECIFIC OBJECTIVES OF THE PBF PROGRAMME
The general objective of the PBF system is: to change the behaviour of health providers at facility level
for them to deliver more quality services under the free health care policy.
The EV team concludes that systems have been put in place and are operational to a reasonable
extent in a number of health facilities (see Chapter 7.1). Further strengthening of the system is
possible within the present design of PBF in Sierra Leone, when a number of implementation issues
can be solved.
The specific objectives of the system are:
1. Provide cash at facility level to cover the local costs of delivering services and removing the need
for 'informal' fees.
The EV team concludes that this has been largely achieved, with only 12% of the patients paying
for those services, which supposedly are free. (See Chapter 5.) Late transfers of PBF funds may
have forced PHUs to ask for contributions for patient records, etc. when funds dried up. Payments
by patients may reduce further if PBF payment timeliness and accuracy improves. Incidental
misbehaviour by health workers cannot be ruled out.
2. Provide financial incentives to facilities in order to increase productivity and quality of care,
especially for the identified key indicators.
The EV team concludes that this has been partially achieved. There is an increase in service
utilisation, although that increase is levelling off. There are signs of improved attention for quality.
However, the relation between performance and payments is too weak for health workers. The
incentive system is not transparent enough and payments so delayed, that they are no longer
seen as reward for good performance.
3. Increase the equity of distribution of resources with funds from PBF allowing facilities to hire
contractual workers and finance outreach activities.
Equity of distribution of funds may have taken place using district-based payment formula, but was
not visible for grass root workers. The flow of funds in general was not regular enough to hire
contract workers (with exception of the two PBF hospitals). Outreach may have benefited from
PBF funds, e.g. by repair of motorcycles and purchase of fuel. In general, funds were used for
repairs of the building, furniture, equipment and supplies, water and sanitation, etc. These
investments have contributed to patient satisfaction and higher scores for crosscutting quality
indicators.
8.1.2 THE TERMS OF REFERENCE
In response to the TOR for the external verification the EV team presents the following conclusions:
1. Review the accuracy of the facility data from the registers and other records
The registers at facility level were fairly accurate, with on average 90%-95% satisfactory entries.
Unfortunately, too many registers went missing over the period between 2012 and 2014. However,
the accuracy of F-form reports, HMIS reports and Internal Verification in too many cases is below
standard. Not only is the variation between the sources of information and the External Verification
too high, also between the sources of information amongst themselves there are too many
inconsistencies. This could have been avoided by triangulation of information from F-forms, HMIS
and Internal Verification.
2. To analyse the data of the first full year of PBF implementation (2012)
The methodology of analysis can be found in Chapter 3. Extensive analysis is reported in Chapter
4 of this document. Data quality and analysis of reasons for differences in numbers required much
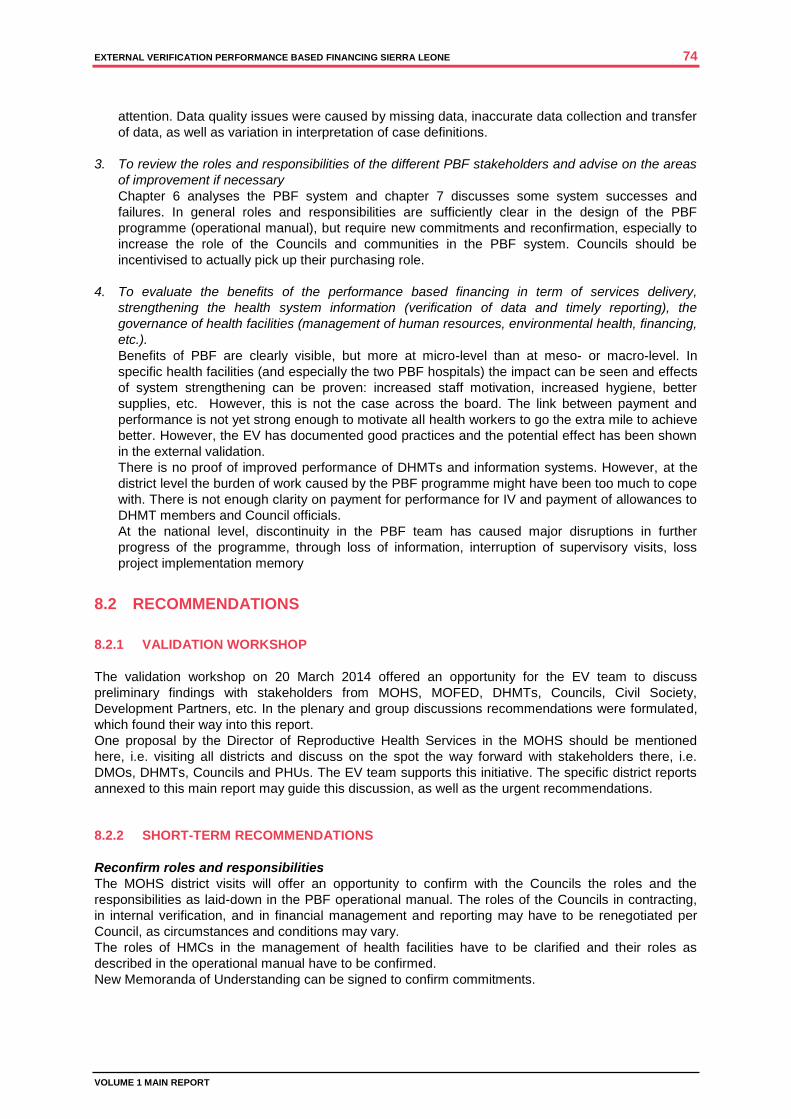
EXTERNAL VERIFICATION PERFORMANCE BASED FINANCING SIERRA LEONE 74
VOLUME 1 MAIN REPORT
attention. Data quality issues were caused by missing data, inaccurate data collection and transfer
of data, as well as variation in interpretation of case definitions.
3. To review the roles and responsibilities of the different PBF stakeholders and advise on the areas
of improvement if necessary
Chapter 6 analyses the PBF system and chapter 7 discusses some system successes and
failures. In general roles and responsibilities are sufficiently clear in the design of the PBF
programme (operational manual), but require new commitments and reconfirmation, especially to
increase the role of the Councils and communities in the PBF system. Councils should be
incentivised to actually pick up their purchasing role.
4. To evaluate the benefits of the performance based financing in term of services delivery,
strengthening the health system information (verification of data and timely reporting), the
governance of health facilities (management of human resources, environmental health, financing,
etc.).
Benefits of PBF are clearly visible, but more at micro-level than at meso- or macro-level. In
specific health facilities (and especially the two PBF hospitals) the impact can be seen and effects
of system strengthening can be proven: increased staff motivation, increased hygiene, better
supplies, etc. However, this is not the case across the board. The link between payment and
performance is not yet strong enough to motivate all health workers to go the extra mile to achieve
better. However, the EV has documented good practices and the potential effect has been shown
in the external validation.
There is no proof of improved performance of DHMTs and information systems. However, at the
district level the burden of work caused by the PBF programme might have been too much to cope
with. There is not enough clarity on payment for performance for IV and payment of allowances to
DHMT members and Council officials.
At the national level, discontinuity in the PBF team has caused major disruptions in further
progress of the programme, through loss of information, interruption of supervisory visits, loss
project implementation memory
8.2 RECOMMENDATIONS
8.2.1 VALIDATION WORKSHOP
The validation workshop on 20 March 2014 offered an opportunity for the EV team to discuss
preliminary findings with stakeholders from MOHS, MOFED, DHMTs, Councils, Civil Society,
Development Partners, etc. In the plenary and group discussions recommendations were formulated,
which found their way into this report.
One proposal by the Director of Reproductive Health Services in the MOHS should be mentioned
here, i.e. visiting all districts and discuss on the spot the way forward with stakeholders there, i.e.
DMOs, DHMTs, Councils and PHUs. The EV team supports this initiative. The specific district reports
annexed to this main report may guide this discussion, as well as the urgent recommendations.
8.2.2 SHORT-TERM RECOMMENDATIONS
Reconfirm roles and responsibilities
The MOHS district visits will offer an opportunity to confirm with the Councils the roles and the
responsibilities as laid-down in the PBF operational manual. The roles of the Councils in contracting,
in internal verification, and in financial management and reporting may have to be renegotiated per
Council, as circumstances and conditions may vary.
The roles of HMCs in the management of health facilities have to be clarified and their roles as
described in the operational manual have to be confirmed.
New Memoranda of Understanding can be signed to confirm commitments.
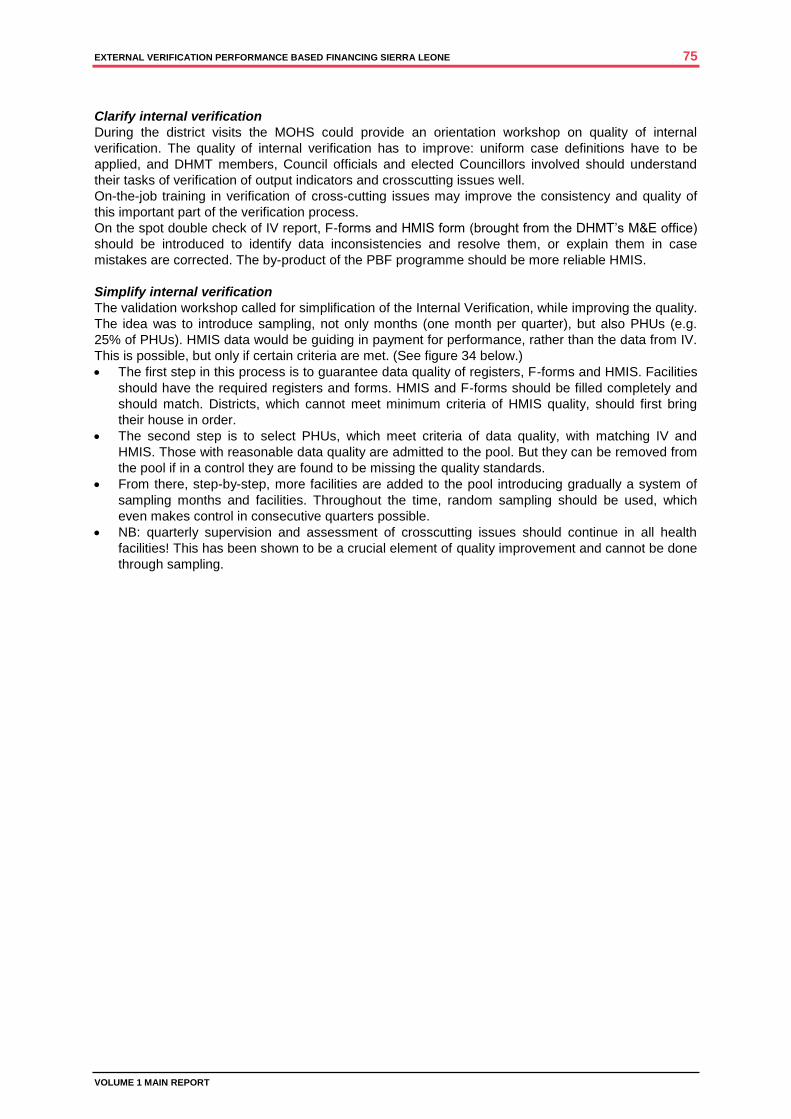
EXTERNAL VERIFICATION PERFORMANCE BASED FINANCING SIERRA LEONE 75
VOLUME 1 MAIN REPORT
Clarify internal verification
During the district visits the MOHS could provide an orientation workshop on quality of internal
verification. The quality of internal verification has to improve: uniform case definitions have to be
applied, and DHMT members, Council officials and elected Councillors involved should understand
their tasks of verification of output indicators and crosscutting issues well.
On-the-job training in verification of cross-cutting issues may improve the consistency and quality of
this important part of the verification process.
On the spot double check of IV report, F-forms and HMIS form (brought from the DHMT’s M&E office)
should be introduced to identify data inconsistencies and resolve them, or explain them in case
mistakes are corrected. The by-product of the PBF programme should be more reliable HMIS.
Simplify internal verification
The validation workshop called for simplification of the Internal Verification, while improving the quality.
The idea was to introduce sampling, not only months (one month per quarter), but also PHUs (e.g.
25% of PHUs). HMIS data would be guiding in payment for performance, rather than the data from IV.
This is possible, but only if certain criteria are met. (See figure 34 below.)
The first step in this process is to guarantee data quality of registers, F-forms and HMIS. Facilities
should have the required registers and forms. HMIS and F-forms should be filled completely and
should match. Districts, which cannot meet minimum criteria of HMIS quality, should first bring
their house in order.
The second step is to select PHUs, which meet criteria of data quality, with matching IV and
HMIS. Those with reasonable data quality are admitted to the pool. But they can be removed from
the pool if in a control they are found to be missing the quality standards.
From there, step-by-step, more facilities are added to the pool introducing gradually a system of
sampling months and facilities. Throughout the time, random sampling should be used, which
even makes control in consecutive quarters possible.
NB: quarterly supervision and assessment of crosscutting issues should continue in all health
facilities! This has been shown to be a crucial element of quality improvement and cannot be done
through sampling.
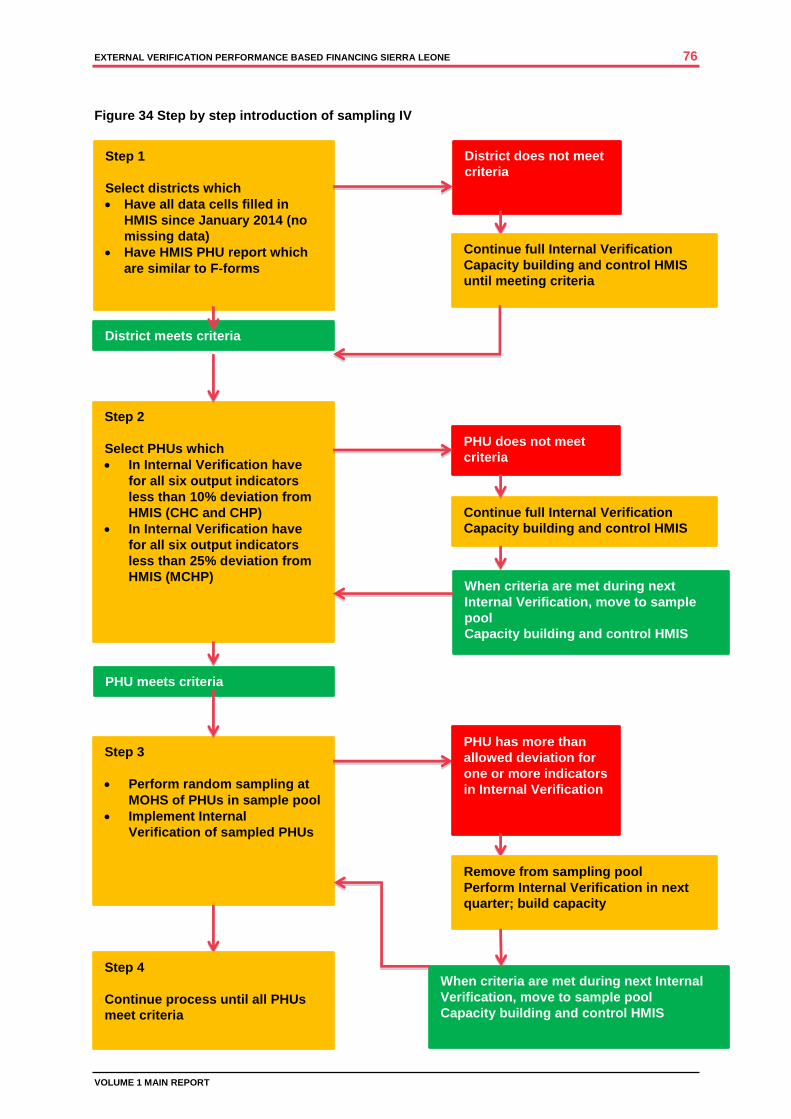
EXTERNAL VERIFICATION PERFORMANCE BASED FINANCING SIERRA LEONE 76
VOLUME 1 MAIN REPORT
Figure 34 Step by step introduction of sampling IV
Step 1
Select districts which
Have all data cells filled in
HMIS since January 2014 (no
missing data)
Have HMIS PHU report which
are similar to F-forms
Step 2
Select PHUs which
In Internal Verification have
for all six output indicators
less than 10% deviation from
HMIS (CHC and CHP)
In Internal Verification have
for all six output indicators
less than 25% deviation from
HMIS (MCHP)
District meets criteria
District does not meet
criteria
Continue full Internal Verification
Capacity building and control HMIS
until meeting criteria
PHU does not meet
criteria
Continue full Internal Verification
Capacity building and control HMIS
Step 3
Perform random sampling at
MOHS of PHUs in sample pool
Implement Internal
Verification of sampled PHUs
PHU has more than
allowed deviation for
one or more indicators
in Internal Verification
Remove from sampling pool
Perform Internal Verification in next
quarter; build capacity
When criteria are met during next
Internal Verification, move to sample
pool
Capacity building and control HMIS
PHU meets criteria
When criteria are met during next Internal
Verification, move to sample pool
Capacity building and control HMIS
Step 4
Continue process until all PHUs
meet criteria

EXTERNAL VERIFICATION PERFORMANCE BASED FINANCING SIERRA LEONE 77
VOLUME 1 MAIN REPORT
8.2.3 CLARIFICATION OF THE OPERATIONAL MANUAL
Within six months MOHS could produce an update of the operational manual, including
communication or orientation of involved stakeholders, whereby the following suggestions can be
considered:
1. Create simple and targeted PBF manuals for different stakeholders at different levels in the
system. Also produce fact sheets and leaflets to inform patients and grass root health workers.
2. Inform PHUs, hospitals, Councils and DHMT directly when money is transferred and provide
details (e.g. period of payment) explain formula for calculating the amounts. Administrators in
Councils should also be informed.
3. Add to the operational manual instructions on financial management in PHUs, using a basic
cashbook as starting point;
4. Simplify the financial reporting procedures for PHUs, e.g. introducing a simple form to be collected
by the DHMT during supervisory visits.
5. Abolish the difference between satisfactory and unsatisfactory entries in the internal verification,
as this does not add value on the whole. Concentrate on overall data quality.24
6. Revise the scoring system for crosscutting issues (-3 or +3) to a simple score, (e.g. 1-5)
7. Introduce new indicators for crosscutting issues, which provide higher challenges of quality25
.
Adjust indicators annually.
8. Create more clarity with regard to incentives and bonuses, e.g. in fact sheets with calculation
tables. Distinguish for DHMT members and Council members clearly travel allowances from PBF
incentives for performing good verification.
9. Introduce an indicator of quality of information system for districts, to be implemented by MOHS
through triangulation of data sources.
10. Clarify the role of the HMC in more detail, and create more conditions for co-management of
health facilities (co-signing account, action plans, etc.).
11. Clarify the role of the national PBF team, the steering committee and institutionalise improved
supervision of DHMT and Council officials.
8.2.4 LONGER-TERM RECOMMENDATIONS
In the coming year the following recommendations could be considered, which require adaptations in
the operational manual, adjustment of agreements between stakeholders and training of persons at
the facility level.
1. Introduce patient satisfaction surveys to be part of payment to PHU (e.g. 20%). The Council might
contract independent Community Based Organisations for that purpose, and ask Civil Society
Organisations to train them. The formats and procedures as used in the EV might be used.
2. Introduce Annual Action Plans in the PHU, which are updated twice per year, to be signed by
PHU, the HMC, the Council and DHMT (which also serve as input for the Council Health Plan)
3. Establish a point at the Councils where patients can complain about healthcare in general (not
through 777) and where they can report when they had to pay for free services.
8.2.5 FUTURE DEVELOPMENTS OF PBF
The following could be considered when further developments of PBF are planned.
1. Increase payment for output indicators (now less than 0,5 USD per capita). This can be possible
when part of regular Government payments to the health system is channelled via PBF systems,
and by including funding from different international donor organisations
2. Include HIV and TB (and maybe other) performance indicators in the PBF system. Consider
channelling Global Fund funds via the PBF programme.
24
NB. Eligibility is another issue! When the indicator is children vaccinated under the age of one, there is no reason to include children over one in the count. Case definitions should be maintained. 25
For example: instead of statistics on wall posters, cumulative graphs of coverage vs. targets; move availability of delivery bed to crosscutting issues and add availability of delivery tray. Instead of minutes of HMC, co-signing HMC on action plan and chair HMC co-signing bank account.
EXTERNAL VERIFICATION PERFORMANCE BASED FINANCING SIERRA LEONE 78
VOLUME 1 MAIN REPORT
8.2.6 HOSPITAL PBF
The following recommendations for hospital PBF could be considered, especially when new hospitals
are involved in the PBF system.
Within six months:
1. Align the checklists for IV with the hospitals, e.g. their level of service, the medical speciality;
create more flexible custom-made checklists, which recognise specific quality challenges for the
hospital.26
2. Organise a meeting to agree on the definition of certain indicators in checklists (e.g. what is meant
with M&E-plan) between hospital and verifiers before introducing revised checklists.
3. Announce visits and field a trained and qualified team, preferably a team, which performs regular
IVs in the same hospital.
4. Revise the scoring system for indicators (-3 or +3) to a simple score, (e.g. 1-5)
On a longer term:
1. Introduce some kind of flexible ceiling for certain output indicators, relevant for the hospitals27
2. Reconsider reduction of the 60% incentive for personnel and make those more tied to real
performance of individuals
26
For example: introduce hospital neonatal mortality as an indicator, or case fatality rate. 27
E.g. surgical interventions, treatment of cancer patients

contact
P.O. Box 164402500 BK The Hague
Lutherse Burgwal 102512 CB The HagueThe Netherlands
+31(0)70-31 36 [email protected]
more information
Frank van de LooijHealth [email protected] Marjan KruijzenCordaid Liaison Sierra [email protected] Remco van der VeenDirector [email protected]
about cordaid
Cordaid is the Catholic Organisation for Relief and Development Aid, with its headquarters in the Hague and country offices in 11 countries. It has been fighting poverty and exclusion in the world’s most fragile societies and conflict-stricken area’s for a century. It delivers innovative solutions to complex problems by emphasizing sustainability and performance in projects that tackle security and justice, health and economic opportunity. Cordaid is deeply rooted in the Dutch society with more than 300,000 private donors. Cordaid is a founding member of Caritas Internationalis and CIDSE.