extent and conservation of tropical dry forests in the...
TRANSCRIPT

Biological Conservation 143 (2010) 144–155
Contents lists available at ScienceDirect
Biological Conservation
journal homepage: www.elsevier .com/locate /b iocon
Extent and conservation of tropical dry forests in the Americas
C.A. Portillo-Quintero, G.A. Sánchez-Azofeifa *
Department of Earth and Atmospheric Sciences, University of Alberta, Edmonton, Canada T6G 2E3
a r t i c l e i n f o
Article history:Received 26 May 2009Received in revised form 16 September2009Accepted 24 September 2009Available online 29 October 2009
Keywords:ConservationDeforestationExtentFragmentationMODISTropical dry forests
0006-3207/$ - see front matter � 2009 Elsevier Ltd. Adoi:10.1016/j.biocon.2009.09.020
Abbreviations: AVHRR, Advanced Very High REnvironmental Systems Research Institute; ETM, eGHRC, Global Historical Climatology Network; GLCFha, hectares; IR, infrared; IUCN, International Union fokm, kilometers; km2, square kilometers; m, meterModerate Resolution Imaging Spectroradiometer; NGnizations; NLCD, National Land Cover Database; PESservices; SPOT, Systeme Pour l’Observation de laTopography Mission; TM, Thematic Mapper.
* Corresponding author. Address: Earth Observationment of Earth and Atmospheric Sciences, University oCanada T6G 2E3. Tel.: +1 780 492 1822; fax: +1 780
E-mail address: [email protected] (G.A. S
a b s t r a c t
This paper shows the results of an assessment on the current extent of Neotropical dry forests based on asupervised classification of MODIS surface reflectance imagery at 500-m resolution. Our findings showthat tropical dry forests extend for 519,597 km2 across North and South America. Mexico, Brazil and Boli-via harbor the largest and best-preserved dry forest fragments. Mexico contains the largest extent at181,461 km2 (38% of the total), although it remains poorly represented under protected areas. On theother hand, Brazil and Bolivia contain the largest proportion of protected tropical dry forests and the larg-est extent in continuous forest fragments. We found that five single ecoregions account for more than halfof the tropical dry forests in the Americas (continental and insular) and these ecoregions are: the Chiquit-ano dry forests, located in Bolivia and Brazil (27.5%), the Atlantic dry forests (10.2%), the Sinaloan dryforests in Mexico (9.7%), the Cuban dry forests (7.1%) and the Bajio dry forests in Mexico (7%). Chiquitanodry forests alone contain 142,941 km2 of dry forests. Of the approximately 23,000 km2 of dry forest underlegal protection, 15,000 km2 are located in just two countries, Bolivia and Brazil. In fact, Bolivia protects10,609 km2 of dry forests, where 7600 km2 are located within the Chiquitano dry forest ecoregion andprotected by a single park. Low extent and high fragmentation of dry forests in countries like Guatemala,Nicaragua, Ecuador, Costa Rica and Peru means that these forests are at a higher risk from humandisturbance and deforestation.
� 2009 Elsevier Ltd. All rights reserved.
1. Introduction characteristics are attractive for human settlement and develop-
Tropical dry forests are among the most threatened ecosystemsin the world as a consequence of intensive anthropogenic distur-bance (Janzen, 1988; Hoekstra et al., 2005). Ewel (1999) explainsthat in this particular ecosystem, the environmental constraintson human development are low in comparison to others. Here, an-nual rainfall does not deviate greatly from potential evapotranspi-ration, irrigation water is needed in modest amounts, yet rainfall isnot so high that pest and nutrient leaching are overbearing prob-lems (Ewel, 1999). This ecosystem has historically supported highhuman population densities given that its climatic and edaphic
ll rights reserved.
esolution Radiometer; ESRI,nhanced thematic mapper;
, Global Land Cover Facility;r the Conservation of Nature;s; mm, millimeters; MODIS,Os, non-governmental orga-
, payment for environmentalTerre; SRTM, Shuttle Radar
Systems Laboratory, Depart-f Alberta, Edmonton, Alberta,492 2030.ánchez-Azofeifa).
ment in the tropics (Tosi and Voertman, 1964; Sánchez-Azofeifaet al., 2005). Furthermore, most scientific efforts for the studyand conservation of tropical vegetation have focused on tropicalrain forests, while little attention has been paid to tropical dry for-ests despite its high species richness and endemism of woodyplants, especially in continental and oceanic islands (Trejo andDirzo, 2000; Sánchez-Azofeifa et al., 2005; Gillespie et al., 2005;Kier et al., 2005).
Several authors have defined tropical dry forests in differentways, based on similar or different criteria. Mooney et al. (1995)defines the tropical dry forest simply as forests occurring in tropi-cal regions characterized by pronounced seasonality in rainfall dis-tribution with several months of drought. Sánchez-Azofeifa et al.(2005) describes tropical dry forests as a vegetation type typicallydominated by deciduous trees where at least 50% of trees presentare drought deciduous, the mean annual temperature is >25 �C,total annual precipitation ranges between 700 and 2000 mm, andthere are three or more dry months every year (precipitation<100 mm). Pennington et al. (2006) uses a wider interpretationof tropical dry forests which includes vegetation that experiencea minimum dry season period of 5–6 months with concomitantstrongly seasonal ecological processes and functions. This defini-tion includes diverse formations such as forests within grasslands,shrublands and savanna ecosystems; from tall forests on the

C.A. Portillo-Quintero, G.A. Sánchez-Azofeifa / Biological Conservation 143 (2010) 144–155 145
more humid dry forest sites to cactus scrub on the driest. Sánchez-Azofeifa et al. (2005) also considers savannas, gallery forests, coast-lines and mangroves among the associated vegetation types thatcan occur within the matrix of tropical dry forests. Despite themany different definitions, it is essential to map the extent andgeographical distribution of these important tropical forestformations.
More than half of tropical dry forests occur in the Americas(approximately 54%, according to Miles et al., 2006). These are re-ferred to as Neotropical dry forests. At present, Neotropical dry for-ests exist as fragments of a once large, contiguous forest thatreached from Mexico to Northern Argentina, reduced primarilyby the timber industry, indigenous fuel–wood extraction, and theexpansion of cattle ranching (Fajardo et al., 2005). In spite of ourawareness of the rapid destruction of dry forests, we still knowvery little about the true current extent and degree of fragmenta-tion of Neotropical dry forests.
Coarse-scale resolution maps (>1 km spatial resolution) basedon the analysis of multispectral imagery from sensors like Ad-vanced Very High Resolution Radiometer (AVHRR), Systeme Pourl’Observation de la Terre (SPOT) and Moderate Resolution ImagingSpectroradiometer (MODIS) have provided comprehensive globalviews of the distribution of Neotropical dry forests. Nonetheless,when examined closely, these maps are inaccurate and tend tooverestimate the extent of tropical humid forests and underesti-mate the extent of tropical dry forests. Such errors affect the accu-racy of carbon stocks estimates based on forest maps, which areessential for the implementation of conservation strategies suchas the Payments for Environmental Services (PES) initiatives (Kala-cska, 2005). Limitations to these analyses include spatial resolu-tion, image classification methodology, the tropical dry forestdefinition used, and also imagery selection procedures that donot account for latitudinal differences in leaf phenology patterns(differences in the date of the range and peak of the dry seasonand wet season). Until now, there has not been a ground-truthedmap derived from moderate-resolution imagery that focusesexclusively on Neotropical dry forests at the regional level and ad-dresses the issues that might affect the assessment of the currentextent of these forests. The development of a comprehensivemap of Neotropical dry forest coverage is therefore especiallyimportant as a first step toward understanding the dry forest con-servation status among different countries in the Americas (Sán-chez-Azofeifa et al., 2005). Providing a land cover assessment ofNeotropical dry forests would allow the scientific community tounderstand the dry forest distribution patterns and improveknowledge on the location of potential restoration areas or newreserves.
The purpose of this paper is to report the results of an assess-ment of the current extent of Neotropical dry forests based onMODIS surface reflectance imagery at 500-m resolution. The anal-ysis focuses on tropical dry forest ecosystems that fall within thefloristic, zoogeographic and bioclimatic parameters suggested byOlson et al. (2001) and by Sánchez-Azofeifa et al. (2005) for NorthAmerica, Central America, the Caribbean islands and South Amer-ica. Imagery selection in this work accounts for latitudinal differ-ences in phenology and provides an accuracy assessment forvalidation. We also included forests outside the strict tropicaldry forest biome limits by mapping the extent of forests withinimportant associated savannas, grasslands and shrublands ecosys-tems such as the Chaco dry forests, Caatinga, Cerrado, the Llanosand other savannas in South America which are considered areaswhere dry forest species could potentially occur (Miles et al.,2006). Furthermore, we analyzed fragmentation patterns and de-gree of protection at continental, sub-continental and nationallevels, and discussed implications for forest management andconservation.
2. Methods
2.1. Definition of tropical dry forest
Rather than limiting our study to a single definition of tropicaldry forest, our analysis intends to examine the extent of tropicaldry forest in a broad sense. We took into account main bioclimaticand phenological characteristics as indicated by several authors(Olson et al., 2001; Sánchez-Azofeifa et al., 2005; Penningtonet al., 2006, Mooney et al., 1995), which are more relevant fromthe remote sensing point of view. Bioclimatic constraints for trop-ical dry forests were used by the adopting Olson et al. (2001) globalbiomes classification and Sánchez-Azofeifa et al. (2005) dry forestdefinition. Patterns of leaf phenology were also crucial during theimage classification process in order to differentiate the spectralresponse of deciduous vegetation from the spectral response ofevergreen vegetation and also from other types of land use. Theuse of tropical dry forest biome boundaries by Olson et al. (2001)and information on the patterns of leaf phenology during the im-age-processing phase is further explained in the next section.
The definition of tropical dry forest proposed by Olson et al.(2001) excludes deciduous vegetation types that authors considerpart of the dry forest ecosystem. For example, Caatinga forest ischaracterized as low height forest consisting mostly of small decid-uous trees and shrubs, frequently displaying twisted trunks andthorns (Queiroz, 2006). Due to ecological and floristic similarities,Pennington et al. (2000, 2006) considers Caatinga vegetation aspart of the Neotropical dry forests. However, Olson et al. (2001)classifies this region as a shrubland ecosystem. The Olson et al.(2001) definition of dry forest neither includes deciduous vegeta-tion in savannas nor Dry Chaco vegetation as part of the distribu-tion of tropical dry forests. Yet the Llanos savannas, the Benisavannas, the Campos Rupestres savannas and the Cerrado all con-tain scattered fragments of deciduous forests, mostly related to soilfertility and moisture gradients (Fajardo et al., 2005; Penningtonet al., 2000, 2006). The Dry Chaco ecosystem is also consideredby some authors as part of the Neotropical dry forests (Gentry,1995; Eva et al., 2004; Gasparri and Grau, 2009), although Prado(1993) considers that the Chaco vegetation has more floristic sim-ilarities with temperate dry formations and therefore, this ecosys-tem should be excluded from the definition of tropical dry forest.
In order to represent tropical dry forest under a range of possi-ble definitions, we focused the assessment on the extent and con-servation of Neotropical dry forests using the geographicalboundaries defined by Olson et al. (2001) for the dry forest biome,and separately, report the extent and conservation status of forestswithin the tropical savannas biome (which includes tropical savan-nas and Dry Chaco vegetation) and the Caatingas from the desertand xeric shrublands biome. Although our assessment adopts theOlson et al. (2001) geographical constraints for potential dry forestdistribution, extending the analyses to include ecologically and flo-ristic related savannas, woodlands and shrublands will allow thescientific community to determine the extent and conservationof Neotropical dry forest using wider definitions of tropical dry for-ests as well. Importantly, rather than climate, the biome delinea-tion by Olson et al. (2001) is a result of the exploration ofexisting global maps of floristic, zoogeographic provinces andbroad vegetation types, and the consultation of regional experts;unlike most classifications available (Miles et al., 2006).
2.2. Study area
In order to map the current extent of Neotropical dry forests, itwas necessary to acquire and process MODIS imagery within thepotential distribution of tropical dry forest in the Americas. The

146 C.A. Portillo-Quintero, G.A. Sánchez-Azofeifa / Biological Conservation 143 (2010) 144–155
assessment by Olson et al. (2001) of the geographic distribution ofthe world’s biomes includes tropical dry forests under a categorynamed ‘‘tropical and subtropical dry broad-leaf forests”. The geo-graphic data is available to the public and scientific communityas a vector data layer for geographic information systems (GIS).By performing a GIS overlay between the dry forest biome datalayer and climatic data from Global Historical Climatology Net-work (GHCR) (Vose et al., 1992), we found that the biome layerencompasses land cover areas with a mean annual precipitationof 1048 mm (ranging from 108 mm to 2050 mm) and a mean an-nual temperature of 23 �C (ranging from 14 �C to 27 �C). This cli-matic range is similar to the one suggested by Sánchez-Azofeifaet al. (2005) for tropical dry forests. The GIS layer also allows toanalyze results by ecoregions within the tropical dry forest biome,which can be useful to highlight distinctive areas that are worthyof greater attention (Olson et al., 2001). Therefore, the study areawas constrained by the geographical boundaries of the ‘‘tropicaland subtropical dry broad-leaf forest” biome available as a GIS datalayer and made available by Olson et al. (2001). We have analyzedthe distribution of forests within the ‘‘tropical and subtropicalgrasslands, savannas and shrublands” biome (which includes sav-annas and Dry Chaco vegetation) and the Caatinga ecoregion fromthe ‘‘Desert and Xeric shrublands” biome (Olson et al., 2001). Wereport the results separately in order to differentiate trends acrossfloristic, ecological and physiognomic types of dry forests. All threebiome boundaries comprise deciduous vegetation existing in 34ecoregions and correspond to deciduous vegetation within 15countries across continental America (Argentina, Bolivia, Brazil,Colombia, Costa Rica, Ecuador, El Salvador, Guatemala, Honduras,Mexico, Nicaragua, Panama, Paraguay, Peru and Venezuela) and 5countries in the Caribbean islands (Cayman Islands, Cuba, Domin-ican Republic, Haiti and Jamaica). All biomes and ecoregion bound-aries are part of a larger mosaic carved from the original ecosystemthat currently includes other land uses such as agriculture, urbandevelopment and pasture lands.
2.3. General approach
We acquired MODIS visible and infrared reflectance data fromthe dry season of year 2004 at 500-m spatial resolution (account-ing for latitudinal shifts in precipitation patterns) along with ancil-lary data (elevation, aspect, slope) and subset it geographicallyaccording to the biome boundaries described above. Then we iden-tified and categorized the range of spectral reflectances represent-ing tropical dry forest, Caatinga, woodlands in the cerradosavannas and dry Chaco vegetation as well as non-forest land coverclasses in MODIS imagery. To do this, we digitized ground controlpoints for all land cover types by exploring higher resolution imag-ery (Landsat TM and ETM+ and Google Earth products). The MODISspectral reflectance data collected at these ground control loca-tions were used as input for the machine learning/decision treeimagery classification approach that was applied to classify theMODIS imagery in land cover classes. All vegetation detected wascross-checked for consistency and coherence with higher-resolu-tion data. We chose a minimum mapping unit of 100-ha (1-km2)for the final map. Materials and methods applied are further ex-plained in the following sections.
2.4. Imagery acquisition
In 1998, onboard the Terra Platform, NASA launched the firstModerate Resolution Imaging Spectroradiometer (MODIS) instru-ment, providing improved capabilities for terrestrial satellite re-mote sensing aimed at meeting the needs of global changeresearch (Justice et al., 1998). The design of the land imaging com-ponent combines characteristics of the AVHRR and the Landsat
Thematic Mapper sensors, adding middle and long-wave infrared(IR) spectral bands, and providing spatial resolutions at 250 m,500 m and 1-km global coverage with a near-daily imagingcapacity.
The imagery used for this analysis included the first sevenbands from MODIS-Terra surface reflectance daily L2G Global dataand the first seven bands from MODIS-Terra surface reflectance8-Day L3 Global composites data. For mapping tropical dry forestextent and structure in a landscape, the use of imagery collectedduring the dry season has proven successful since dry forest struc-tural properties are more pronounced and distinctive during thedry season (Kalacska et al., 2007). This allows tropical dry forestareas to be discerned from semi-deciduous and from evergreengallery forests within the tropical dry forest matrix. The use ofdry season imagery also improves the chances of acquiringcloud-free imagery.
For the selection of imagery within the dry season, we per-formed an inspection of monthly satellite-derived vegetation indi-ces (e.g. the MODIS-Terra Vegetation Indices 16-Day L3 Global 1KM SIN GRID product) for the year 2004 and explored differencesin dry forest phenology patterns within the biogeographical limitsof the Neotropical dry forest. We used published rainfall data todifferentiate precipitation patterns across the region. For tropicalNorth and Central American regions, we identified imagery frommid-April 2004 (April 10th and April 24th) to provide the bestscenes (low cloud cover) from the dry season. For the northern An-dean countries and the Caribbean Islands, imagery was selectedfrom mid-January 2004 (January 25th and January 17th, respec-tively). For countries south of the Amazon basin, imagery was se-lected from the end of August 2004 (specifically, August 28th).MODIS Vegetation Indices 16-Day L3 Global 500 m imagery wasalso acquired for the same dates of the year 2004. The MODISimagery obtained was mosaicked and reprojected from sinusoidalprojection to GCS-WGS84 using the MODIS Reprojection Tool(available from http://lpdaac.usgs.gov/).
2.5. Ancillary data
We acquired continuous surface elevation data at a 1-km spatialresolution, derived from the Shuttle Radar Topography Mission(SRTM), in order to include elevation, aspect and slope as indepen-dent variables in the classification. The SRTM data are availablefrom the Global Land Cover Facility (GLCF) website (http://www.landcover.org). For the derivation of training sites or groundcontrol points, we acquired 17 Landsat TM and ETM+ dry seasonscenes from the GLCF website. These images cover tropical dry for-est landscapes in Mexico, Costa Rica, Bolivia, Venezuela, Colombia,Brazil, Argentina and the Caribbean Islands. A different set of fourLandsat ETM+ scenes were used as a source for selecting validationsites for the final map accuracy assessment in dry forest landscapesof Mexico, Venezuela, Bolivia and Brazil.
2.6. Collection of ground control points
We collected a total of 10,655 locations from ancillary data(Landsat Imagery) over tropical dry forests landscapes in Mexico,Costa Rica, Bolivia, Venezuela, Colombia, Brazil, Argentina, andthe five Caribbean islands. These locations were used as groundcontrol points during the classification process. Points representingforest and non-forest were collected by interpretation of raw Land-sat data and vegetation indices derived from the same Landsatscenes. We selected a separate set of control points to representwoodlands in the Cerrado, Caatinga forests, and Dry Chaco forests.The high-resolution imagery available for visualization on GoogleEarth (http://earth.google.com) was also helpful for the collectionof training sites.
C.A. Portillo-Quintero, G.A. Sánchez-Azofeifa / Biological Conservation 143 (2010) 144–155 147
The collection of ground control points addressed the fact thatdry forest landscapes are mosaics of successional stages, e.g. theproduct of natural or human-induced disturbances through time.For this reason, it was necessary to select deciduous forest controlpoints over a variable range of environmental gradients, topo-graphical characteristics and distances to urban and agriculturalareas in order to account for differences in chronological age andland use history. As a result, the dry forest extent estimates pro-duced in this analysis represent old growth dry forests as well asdifferent successional stages of altered dry forests within the po-tential tropical dry forest biome distribution. The spatial resolutionof MODIS imagery used for this analysis might have made thedetection of early successional stages of dry forests a more difficulttask. Early successional forests primarily consist of sparse patchesof woody vegetation, shrubs and pastures including a single stra-tum of tree crowns reaching a maximum height of approximately6–8 m (Arroyo-Mora et al., 2005). Given the extreme diversity ofthe land cover matrix (Castro et al., 2003) and the amount of pas-ture land and bare soil exposed, pixels presenting either early suc-cessional stage dry forests or highly disturbed forests have a higherprobability of being included in the non-forest class. The map here-in primarily represents old growth and intermediate stages of dryforests with little to moderate structural disturbance.
Dry deciduous vegetation can also be found within tropical hu-mid and subhumid biomes or xeric shrubland biomes as a result oflocalized variations of topography, soil and climate. However, sincewe constrained the analysis to specific geographical regions wheredry forest bioclimatic characteristics predominate; potential localoccurrences of dry forests in humid and xeric biomes were not in-cluded. This approach was necessary in order to maintain coher-ence with the bioclimatic ranges and potential distributionsproposed by previous authors (Sánchez-Azofeifa et al., 2005; Pen-nington et al., 2006; Olson et al., 2001).
2.7. Imagery classification
We subset the acquired imagery and ancillary data, to the ex-tent of the ‘‘tropical and subtropical broad-leaf forest” and the‘‘tropical and subtropical grasslands, savannas and shrublands”biome boundaries. Additionally, we co-registered all imagery andancillary data to 500-m pixel resolution using Erdas Imagine soft-ware (Leica Geosystems). For South America, we also created anadditional subset for the Caatinga ecoregion from the imageryand ancillary data. The Normalized Difference Vegetation Index(NDVI), available from the MODIS Vegetation Indices products,was added to the dataset as variable for the classification.
For image classification, we chose a supervised decision treeclassification approach due to its advantages over other classifica-tion algorithms and its capabilities of achieving higher mappingaccuracy (Friedl et al., 1999, 2002; Hansen et al., 2000; Giri andJenkins, 2005). We performed an extraction of tropical dry forestand non-forest spectral and topographic signatures based on imag-ery and ancillary data using the NLCD Mapping tool for Erdas Imag-ine (made freely available by the Multi-Resolution LandCharacteristics Consortium through the http://www.mrlc.gov web-site) and translated the results into the data mining/machinelearning software See5 (Rulequest Research, 2008). The See5 soft-ware runs a non-parametric algorithm on the training data that re-lies on hierarchical classifiers to predict class membership byrecursively partitioning the dataset into homogeneous subsetsbased on the reduction of deviance (Giri and Jenkins, 2005). Theoutput from See5 was a decision tree or ruleset that we subse-quently applied to acquired imagery data in order to categorizethe imagery in land cover classes using the NLCD mapping tool.
We developed and applied three independent decision trees forthe North and Central America, South America and Caribbean Is-
lands subregions, respectively. We found that MODIS-Terra surfacereflectance daily L2G Global data (pre-processed with cloud covermasking) gave the best results for North and Central America,while the use of MODIS-Terra surface reflectance 8-Day L3 Globalcomposites data improved the results for South America continen-tal coastlines and Caribbean islands by avoiding the recurrentsalt-and-pepper effects from cloud cover over in daily surfacereflectance data.
2.8. Post-classification processing
We evaluated the resultant map of tropical dry forest reservesusing a country by country crosscheck for inconsistencies (areasof obvious misclassification) using MODIS imagery and ancillarydata. Where needed, we performed a manual recoding of misclas-sified pixels using Erdas Imagine. Additionally, for the final map,we chose a minimum mapping unit of 100-ha (1-km2) as a conser-vative threshold in order to avoid including small isolated pixelsarisen due to artifacts of the classification method and the qualityof the imagery and ancillary data.
2.9. Validation
We collected 1144 points representing tropical dry forests andnon-forest sites by interpretation of Landsat imagery collected overMexico, Venezuela, Bolivia and Brazil. The areas selected for thevalidation included tropical dry forest landscapes with combina-tions of large continuous and highly fragmented tracts of forests.The selection was carried out by overlaying a 1-km � 1-km gridover each Landsat scene and generating points randomly withincells that consisted of 100% forest and/or 100% non-forest cover-age. This approach was applied in order to reduce the probabilityof errors typically derived from comparing coarse-scale resolutiondata to higher-resolution data (Foody, 2002). Finally, we con-structed an error or confusion matrix by comparing the tropicaldry forest final map to the validation points (Congalton, 1991;Stehman and Czaplewski, 1998; Foody, 2002). The result allowedus to estimate the overall accuracy of the map. We also calculatedthe Tau coefficient of agreement as a measurement of accuracy ofthe map in order to compensate for chance agreement (Ma andRedmond, 1995; Naesset, 1996).
2.10. Statistics on forest extent, loss, fragmentation and protection
The resultant dry forest map allowed us to extract basic statis-tics on the total area of tropical dry forest detected at continental,sub-continental and national levels. We considered the results ob-tained within the ‘‘tropical and subtropical dry forest” biomeboundaries as representative of the current extent of Neotropicaldry forest, while the results obtained within other biome bound-aries were considered deciduous vegetation areas with potentialfor tropical dry forest species distribution and were labeled ‘‘OtherDeciduous Forests” (ODF). We carried out an assessment on the de-gree of fragmentation of the tropical dry forests at the continental,sub-continental and national levels. This was made possible byquantifying the percentage of tropical dry forests that occurredin small size forest fragments (<2.5 km2), intermediate size forestfragments (>2.5 km2 and <10 km2), and large forest fragments(>10 km2). This categorization is based on previous work that havesuggested that a minimum habitat fragment size of >10 km2 isneeded to capture the majority of species and processes vital formaintaining ecosystems, and that fragments <10 km2 have a high-er probability of being converted to other land covers (Rodríguezet al., 2007a,b). Additionally, we performed an evaluation of thetropical dry forest area under protected status, evaluated at thecontinental, sub-continental and national level. The assessment
148 C.A. Portillo-Quintero, G.A. Sánchez-Azofeifa / Biological Conservation 143 (2010) 144–155
was achieved by overlaying the resultant tropical dry forest mapwith the IUCN World Database on Protected Areas (World Conser-vation Union, 2006) using ArcGIS software (developed by Environ-mental Systems Research Institute – ESRI).
3. Results and discussion
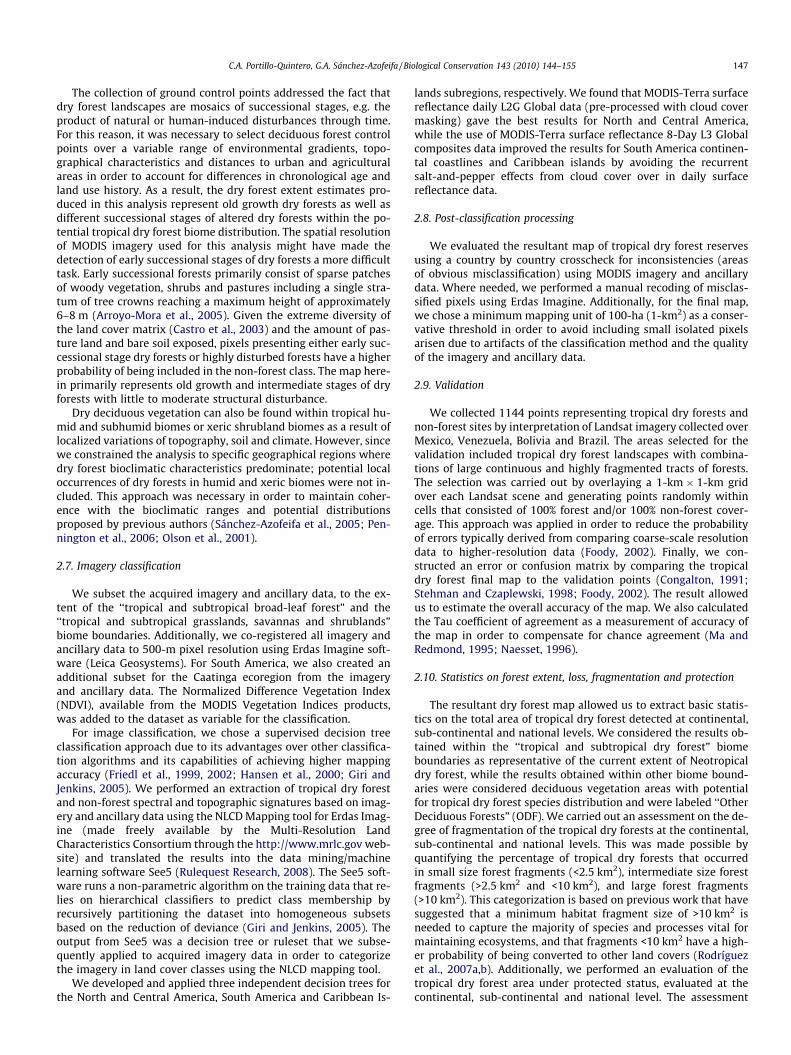
The analysis allowed us to derive a land cover map of tropicaldry forest showing the current extent and distribution in the Amer-icas (Fig. 1). It shows the geographical distribution of tropical dryforests within the ‘‘tropical and subtropical dry broad-leaf forest”biome (Olson et al., 2001) and the distribution of deciduous vege-tation within the Cerrado ecoregion, the Caatinga shrubland ecore-gion, Dry Chaco ecoregion and the Llanos savanna, Beni savannaand Campos Rupestres savanna ecoregions, based on a supervisedclassification of dry season MODIS surface reflectance data at 500-m spatial resolution.
During the visual inspection of the map, we found good spatialcoherence between ancillary data (Landsat scenes), vegetationindices and the distribution of the dry forests at the country-level,though in highly fragmented areas the extent of small fragmentsseems to be overestimated. This overestimation is due to the ef-fects of spatial resolution of MODIS, which detects the presenceof tropical dry forest only at a minimum mapping unit of 0.25 ha(500-m pixel size), even if the forest patch size is smaller than
Fig. 1. Land cover map showing the extent and geographical distribution
the pixel itself. Nonetheless, the map was evaluated using a confu-sion matrix and showed a high overall accuracy of 82% and a Taucoefficient that indicated a spatial agreement of 76% between themap and the ancillary data for all land cover classes (forest/non-forest).
3.1. Tropical dry forest extent
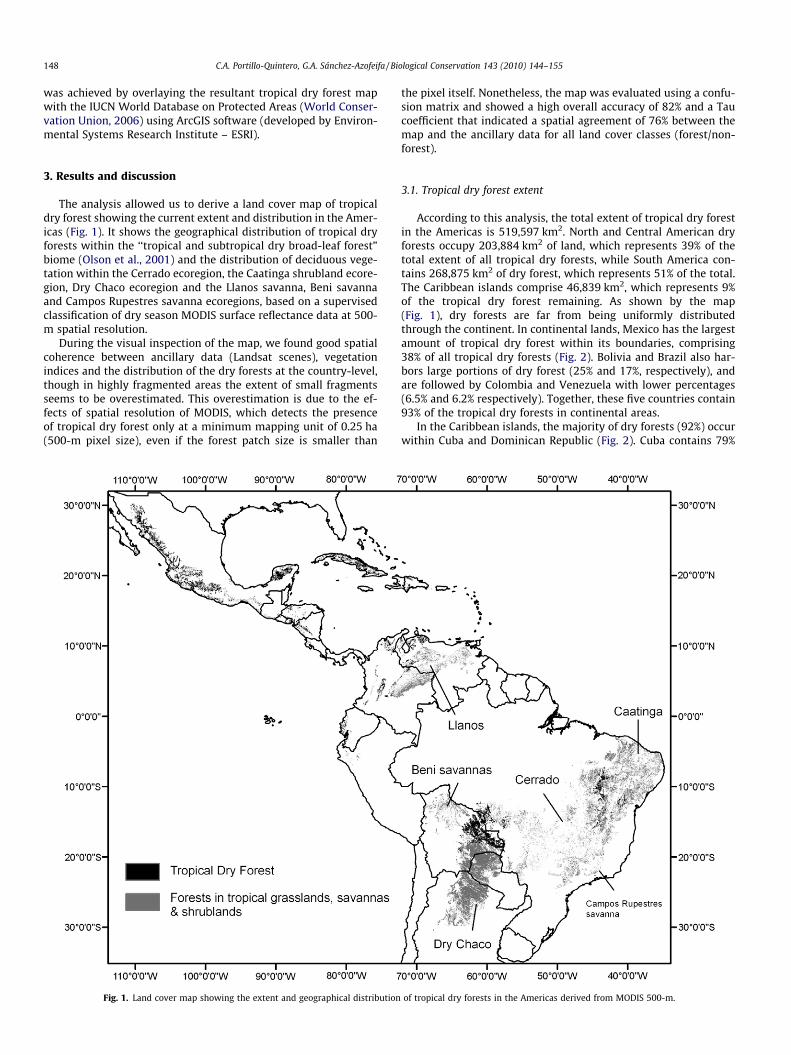
According to this analysis, the total extent of tropical dry forestin the Americas is 519,597 km2. North and Central American dryforests occupy 203,884 km2 of land, which represents 39% of thetotal extent of all tropical dry forests, while South America con-tains 268,875 km2 of dry forest, which represents 51% of the total.The Caribbean islands comprise 46,839 km2, which represents 9%of the tropical dry forest remaining. As shown by the map(Fig. 1), dry forests are far from being uniformly distributedthrough the continent. In continental lands, Mexico has the largestamount of tropical dry forest within its boundaries, comprising38% of all tropical dry forests (Fig. 2). Bolivia and Brazil also har-bors large portions of dry forest (25% and 17%, respectively), andare followed by Colombia and Venezuela with lower percentages(6.5% and 6.2% respectively). Together, these five countries contain93% of the tropical dry forests in continental areas.
In the Caribbean islands, the majority of dry forests (92%) occurwithin Cuba and Dominican Republic (Fig. 2). Cuba contains 79%
of tropical dry forests in the Americas derived from MODIS 500-m.
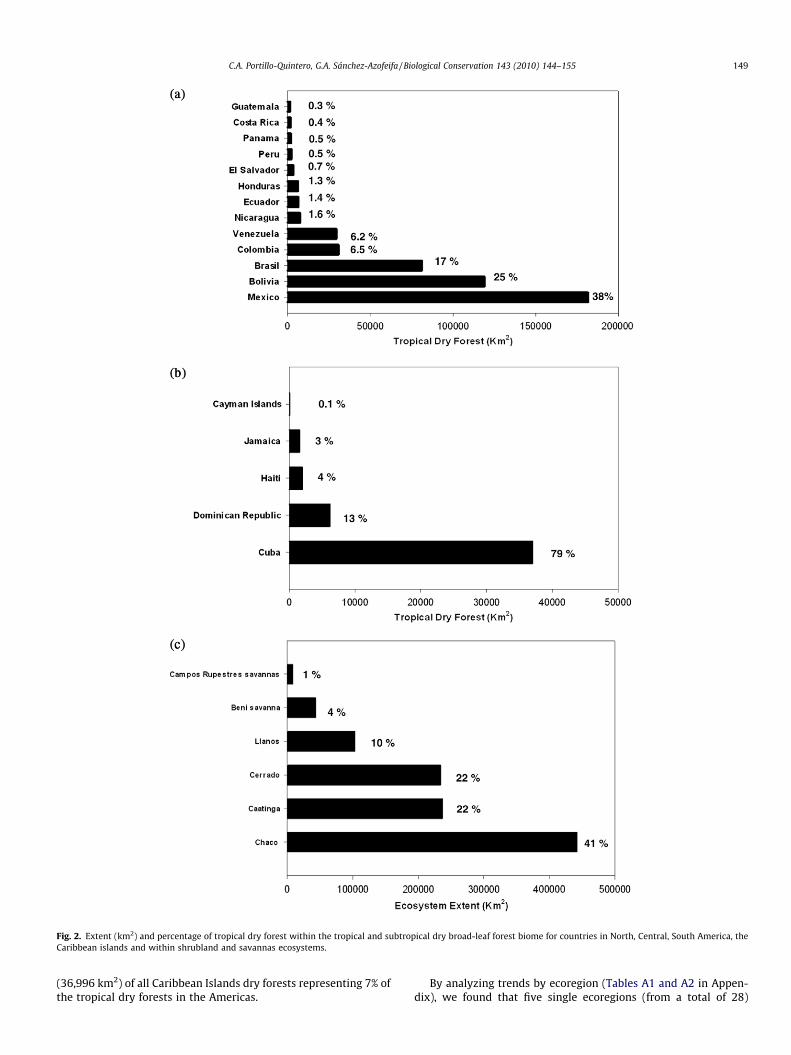
Fig. 2. Extent (km2) and percentage of tropical dry forest within the tropical and subtropical dry broad-leaf forest biome for countries in North, Central, South America, theCaribbean islands and within shrubland and savannas ecosystems.
C.A. Portillo-Quintero, G.A. Sánchez-Azofeifa / Biological Conservation 143 (2010) 144–155 149
(36,996 km2) of all Caribbean Islands dry forests representing 7% ofthe tropical dry forests in the Americas.
By analyzing trends by ecoregion (Tables A1 and A2 in Appen-dix), we found that five single ecoregions (from a total of 28)

150 C.A. Portillo-Quintero, G.A. Sánchez-Azofeifa / Biological Conservation 143 (2010) 144–155
account for more than half of the tropical dry forests in the Amer-icas (continental and insular) and these ecoregions are: the Chi-quitano dry forests (27.5%), the Atlantic dry forests (10.2%), theSinaloan dry forests (9.7%), the Cuban dry forests (7.1%) and the Ba-jio dry forests (7%). The Chiquitano dry forests alone contain142,941 km2 of dry forests.
Regarding the extent of deciduous vegetation in savannas andshrubland ecosystems, e.g. other deciduous forests (ODF), the anal-ysis showed that the Dry Chaco comprises 442,667 km2 of forests,which represent 41% of the estimated 1069,692 km2 total ODF(Fig. 2). The Caatinga and Cerrado both have very similar extentof forest vegetation (237,043 km2 and 234,274 km2, respectively),each of them representing 22% of total ODF. The Llanos and Benisavannas are mostly represented by gallery forests and submon-tane forests encompassing 103,466 km2 and 43,549 km2 corre-spondingly. The Campos Rupestres savannas contain 8689 km2 offorest representing 1% of the total ODF. The total extent of ODF is1,069,691 km2.
3.2. Tropical dry forest loss
Approximately 48.5% of the tropical dry forest has been alreadyconverted to other land uses at the global level (Hoekstra et al.,2005). By comparing the current extent of tropical dry forests inthe Americas to its potential extent according to the delineationof the dry forest biome, we found that 66% of the ecosystem hasbeen already converted to other land uses. In North and CentralAmerica, 72% of dry forest has disappeared, while South Americahas lost 60% of its extent (Table 1c). The Caribbean Islands regionhas lost 66% of its extent. Results by country show the high degreeof disturbance that has affected the tropical dry forest ecosystem inalmost all countries, where the percent lost reaches to 86% in Gua-
Table 1Current tropical dry forest extent (km2) derived from MODIS 500-m data and area undercountries of the Caribbean islands and (c) summary of results per subregion.
Country TDF potential extent(based on Olson et al., 2001)
TDF current extent(this analysis)
(a)Mexico 625,038 181,461Bolivia 216,031 118,940Brazil 168,164 81,046Venezuela 113,143 29,396Colombia 92,664 30,713Peru 48,914 2337Nicaragua 32,277 7414Honduras 26,582 6280Ecuador 25,275 6443El Salvador 11,291 3344Guatemala 10,431 1463Costa Rica 7559 1795Panama 6160 2128
Total 1383,529 472,759
(b)SubregionN&C America 719,338 203,884South America 664,191 268,875C. Islands 137,130 46,839Total 1520,659 519,597
(c)CountryCuba 109,879 36,996Dominican 14,669 6194Haiti 8971 2002Jamaica 3438 1585Cayman Islands 173 63
Total 137,130 46,839
temala and 95% in Peru (Table 1a and b). The analysis was not ap-plied to shrubland and savannas ecosystems since these aregenerally conformed of a heterogeneous mosaic of vegetationtypes and there is no estimate for potential forest extent withinthese areas.
3.3. Fragmentation
One of the principal consequences of deforestation is the crea-tion of landscapes occupied by forest fragments that are remnantsof original continuous forest cover (Laurance and Bierregaard,1997). These fragments are usually embedded in matrices of trans-formed habitats and can support important biodiversity. Speciesrichness is positively correlated with fragment size, hence, intactlarge tracts of continuous forest contain a higher number of speciesper unit area than do smaller forest fragments (Laurance et al.,2002). Since tropical dry forests occur in disjunct patches scatteredthroughout the Neotropics (Pennington et al., 2006), the land covermap of tropical dry forests at the continental level allow us to fur-ther explore the proportion of forest that occurs in smaller frag-ments (<2.5 km2), intermediate size fragments (>2.5 km2 and<10 km2) and larger forest fragments (>10 km2). Larger fragmentscapture the majority of species and processes vital for maintainingecosystems functions, while critical size fragments (intermediateand smaller fragments) have higher species extinction rates andprobability of being converted to other land covers (Lauranceet al., 2002; Rodríguez et al., 2007a,b).
Bolivia contains the highest proportion of dry forests in largefragments across the continent, followed by Brazil and Mexico(Fig. 3). It is important to note that in almost all countries, the pro-portion of dry forests in larger fragments is >60%. This pattern mightbe due to the way deforestation advances, fragmenting lowland
protected areas at three levels: (a) North, Central and South American countries; (b)
TDF converted (%) TDF Protected (km2) Percentage underprotection
71 336 0.245 10,609 8.952 5015 6.274 302 1.067 1555 5.195 188 8.177 – –76 – –75 147 2.370 9 0.386 - -76 279 15.665 - -
66 18,620 3.9
72 624 0.360 17,816 6.666 4797 10.266 23,417 4.5
66 4023 10.958 368 6.078 0 054 400 2564 3.5 5.6
66 4797 10.2

Fig. 3. Percentage of tropical dry forest under three levels of fragmentation within the tropical and subtropical dry broad-leaf forest biome for countries in North, Central,South America, the Caribbean islands and within shrubland and savannas ecosystems.
C.A. Portillo-Quintero, G.A. Sánchez-Azofeifa / Biological Conservation 143 (2010) 144–155 151
forests and leaving areas of more difficult access and gallery forestsintact. Though this pattern of deforestation has reduced a large partof dry forest biodiversity, it can also translate into opportunities for
the design of nature reserves and corridors of remaining forests. Thehighest proportion of critical size fragments is found in countrieslike Nicaragua, Guatemala, Ecuador, Costa Rica and Peru, which

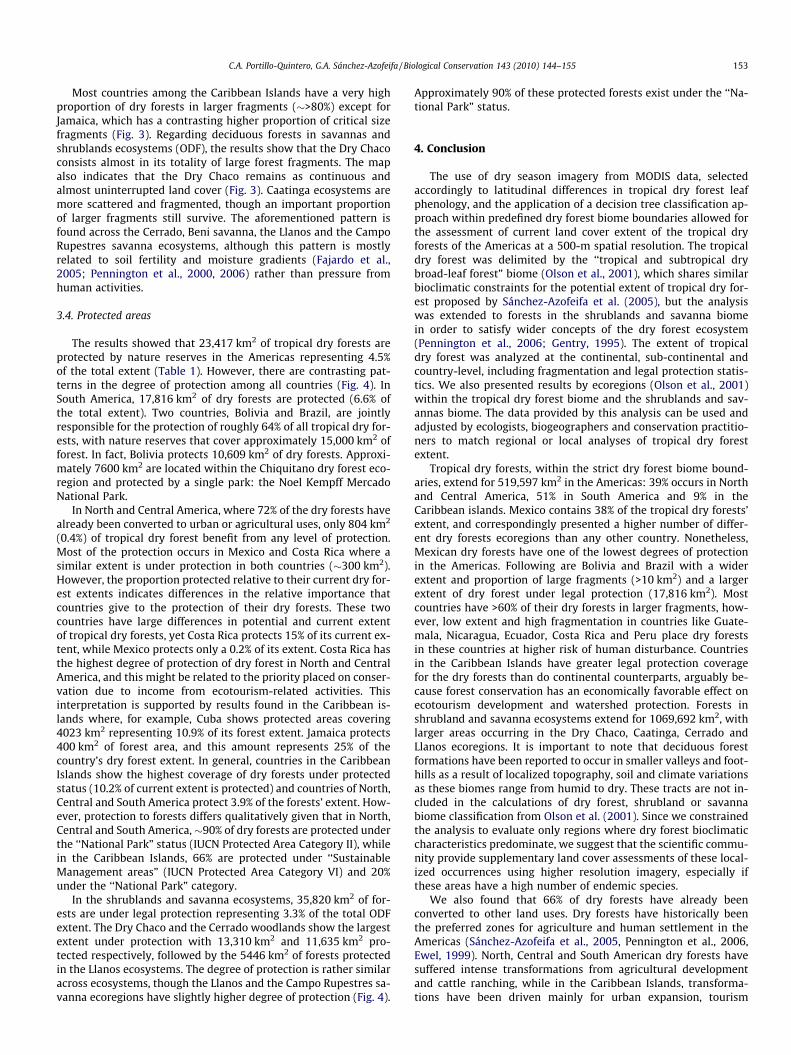
Fig. 4. Percentage of tropical dry forest under protected areas (IUCN, 2006) within the tropical and subtropical dry broad-leaf forest biome for countries in North, Central,South America, the Caribbean islands and within shrubland and savannas ecosystems.
152 C.A. Portillo-Quintero, G.A. Sánchez-Azofeifa / Biological Conservation 143 (2010) 144–155
are also low in dry forest extent compared to other countries. Be-cause of the combined effects of their reduced general extent and in-
creased fragmentation, tropical dry forests in these countries have ahigher risk of experiencing pressure from human disturbance.
C.A. Portillo-Quintero, G.A. Sánchez-Azofeifa / Biological Conservation 143 (2010) 144–155 153
Most countries among the Caribbean Islands have a very highproportion of dry forests in larger fragments (�>80%) except forJamaica, which has a contrasting higher proportion of critical sizefragments (Fig. 3). Regarding deciduous forests in savannas andshrublands ecosystems (ODF), the results show that the Dry Chacoconsists almost in its totality of large forest fragments. The mapalso indicates that the Dry Chaco remains as continuous andalmost uninterrupted land cover (Fig. 3). Caatinga ecosystems aremore scattered and fragmented, though an important proportionof larger fragments still survive. The aforementioned pattern isfound across the Cerrado, Beni savanna, the Llanos and the CampoRupestres savanna ecosystems, although this pattern is mostlyrelated to soil fertility and moisture gradients (Fajardo et al.,2005; Pennington et al., 2000, 2006) rather than pressure fromhuman activities.
3.4. Protected areas
The results showed that 23,417 km2 of tropical dry forests areprotected by nature reserves in the Americas representing 4.5%of the total extent (Table 1). However, there are contrasting pat-terns in the degree of protection among all countries (Fig. 4). InSouth America, 17,816 km2 of dry forests are protected (6.6% ofthe total extent). Two countries, Bolivia and Brazil, are jointlyresponsible for the protection of roughly 64% of all tropical dry for-ests, with nature reserves that cover approximately 15,000 km2 offorest. In fact, Bolivia protects 10,609 km2 of dry forests. Approxi-mately 7600 km2 are located within the Chiquitano dry forest eco-region and protected by a single park: the Noel Kempff MercadoNational Park.
In North and Central America, where 72% of the dry forests havealready been converted to urban or agricultural uses, only 804 km2
(0.4%) of tropical dry forest benefit from any level of protection.Most of the protection occurs in Mexico and Costa Rica where asimilar extent is under protection in both countries (�300 km2).However, the proportion protected relative to their current dry for-est extents indicates differences in the relative importance thatcountries give to the protection of their dry forests. These twocountries have large differences in potential and current extentof tropical dry forests, yet Costa Rica protects 15% of its current ex-tent, while Mexico protects only a 0.2% of its extent. Costa Rica hasthe highest degree of protection of dry forest in North and CentralAmerica, and this might be related to the priority placed on conser-vation due to income from ecotourism-related activities. Thisinterpretation is supported by results found in the Caribbean is-lands where, for example, Cuba shows protected areas covering4023 km2 representing 10.9% of its forest extent. Jamaica protects400 km2 of forest area, and this amount represents 25% of thecountry’s dry forest extent. In general, countries in the CaribbeanIslands show the highest coverage of dry forests under protectedstatus (10.2% of current extent is protected) and countries of North,Central and South America protect 3.9% of the forests’ extent. How-ever, protection to forests differs qualitatively given that in North,Central and South America,�90% of dry forests are protected underthe ‘‘National Park” status (IUCN Protected Area Category II), whilein the Caribbean Islands, 66% are protected under ‘‘SustainableManagement areas” (IUCN Protected Area Category VI) and 20%under the ‘‘National Park” category.
In the shrublands and savanna ecosystems, 35,820 km2 of for-ests are under legal protection representing 3.3% of the total ODFextent. The Dry Chaco and the Cerrado woodlands show the largestextent under protection with 13,310 km2 and 11,635 km2 pro-tected respectively, followed by the 5446 km2 of forests protectedin the Llanos ecosystems. The degree of protection is rather similaracross ecosystems, though the Llanos and the Campo Rupestres sa-vanna ecoregions have slightly higher degree of protection (Fig. 4).
Approximately 90% of these protected forests exist under the ‘‘Na-tional Park” status.
4. Conclusion
The use of dry season imagery from MODIS data, selectedaccordingly to latitudinal differences in tropical dry forest leafphenology, and the application of a decision tree classification ap-proach within predefined dry forest biome boundaries allowed forthe assessment of current land cover extent of the tropical dryforests of the Americas at a 500-m spatial resolution. The tropicaldry forest was delimited by the ‘‘tropical and subtropical drybroad-leaf forest” biome (Olson et al., 2001), which shares similarbioclimatic constraints for the potential extent of tropical dry for-est proposed by Sánchez-Azofeifa et al. (2005), but the analysiswas extended to forests in the shrublands and savanna biomein order to satisfy wider concepts of the dry forest ecosystem(Pennington et al., 2006; Gentry, 1995). The extent of tropicaldry forest was analyzed at the continental, sub-continental andcountry-level, including fragmentation and legal protection statis-tics. We also presented results by ecoregions (Olson et al., 2001)within the tropical dry forest biome and the shrublands and sav-annas biome. The data provided by this analysis can be used andadjusted by ecologists, biogeographers and conservation practitio-ners to match regional or local analyses of tropical dry forestextent.
Tropical dry forests, within the strict dry forest biome bound-aries, extend for 519,597 km2 in the Americas: 39% occurs in Northand Central America, 51% in South America and 9% in theCaribbean islands. Mexico contains 38% of the tropical dry forests’extent, and correspondingly presented a higher number of differ-ent dry forests ecoregions than any other country. Nonetheless,Mexican dry forests have one of the lowest degrees of protectionin the Americas. Following are Bolivia and Brazil with a widerextent and proportion of large fragments (>10 km2) and a largerextent of dry forest under legal protection (17,816 km2). Mostcountries have >60% of their dry forests in larger fragments, how-ever, low extent and high fragmentation in countries like Guate-mala, Nicaragua, Ecuador, Costa Rica and Peru place dry forestsin these countries at higher risk of human disturbance. Countriesin the Caribbean Islands have greater legal protection coveragefor the dry forests than do continental counterparts, arguably be-cause forest conservation has an economically favorable effect onecotourism development and watershed protection. Forests inshrubland and savanna ecosystems extend for 1069,692 km2, withlarger areas occurring in the Dry Chaco, Caatinga, Cerrado andLlanos ecoregions. It is important to note that deciduous forestformations have been reported to occur in smaller valleys and foot-hills as a result of localized topography, soil and climate variationsas these biomes range from humid to dry. These tracts are not in-cluded in the calculations of dry forest, shrubland or savannabiome classification from Olson et al. (2001). Since we constrainedthe analysis to evaluate only regions where dry forest bioclimaticcharacteristics predominate, we suggest that the scientific commu-nity provide supplementary land cover assessments of these local-ized occurrences using higher resolution imagery, especially ifthese areas have a high number of endemic species.
We also found that 66% of dry forests have already beenconverted to other land uses. Dry forests have historically beenthe preferred zones for agriculture and human settlement in theAmericas (Sánchez-Azofeifa et al., 2005, Pennington et al., 2006,Ewel, 1999). North, Central and South American dry forests havesuffered intense transformations from agricultural developmentand cattle ranching, while in the Caribbean Islands, transforma-tions have been driven mainly for urban expansion, tourism

154 C.A. Portillo-Quintero, G.A. Sánchez-Azofeifa / Biological Conservation 143 (2010) 144–155
development and agriculture (World Wildlife Fund, 2001). Thehigh degree of historical contraction of the extent of tropical dryforests found in this analysis supports the urgency that the scien-tific community has emphasized in the last decades. The drivers ofdry forest conversion should be, however, further analyzed bycountry, not only because of the large differences in policies fordry forest conservation in the seventeen cited countries, but alsobecause of the broad range of ecological and physical characteris-tics that can limit or facilitate human use and accessibility to dryforests. Such information can help identify and promote potentialsustainable practices through social, agricultural and environmen-tal policies implemented at various levels of decision-making(international, national, provincial, etc.).
Even though tropical dry forests evidently play an historicaldirect role in sustaining human livelihoods, efforts from non-governmental organizations (NGOs) and national institutions re-main sporadic regarding the promotion of actions toward theprotection and sustainable management of tropical dry forests.Most organizations focus primarily on the protection of humidforest habitats and species (Sánchez-Azofeifa et al., 2005). Glob-ally, approximately 16–18% of tropical humid forests, grasslandsand savannas are protected (Hoekstra et al., 2005), a much high-er percentage than the 4.5% protection rate for Neotropical dryforests. Tropical humid forests have generally high levels ofalpha diversity, perhaps justifying greater protection efforts,particularly in comparison to other ecosystems (Lopez andZambrana-Torrelio, 2006). However, it is important to empha-size that higher biodiversity areas should not always meanhigher social and financial investment priorities (Fajardo et al.,2005; Rodríguez et al., 2007a,b). Tropical dry forests not onlymaintain high levels of species diversity and endemicity but alsohold important links to human development in developingcountries of Latin America, where its conservation is essential
Table A1Current tropical dry forest extent (km2) derived from MODIS 500-m data within the dry f
Ecoregions (Olson et al., 2001) BOL BRA COL CR ECU SAL
Bolivian Montane Forests 4010Chiquitano dry forests 114,930 28,011Atlantic dry forests 53,036Apure-Villavicencio dry forests 8484Cauca Valley dry forests 1977Magdalena Valley dry forests 9057Patía Valley dry forests 1251Sinú Valley dry forests 9945Central American dry forests 1795 334Ecuadorian dry forests 5549Tumbes-Piura dry forests 894.8Chiapas Depression dry forestsBajío dry forestsBalsas dry forestsJalisco dry forestsSierra de la Laguna dry forestsSinaloan dry forestsSonoran–Sinaloan transition
subtropical dry forestSouthern Pacific dry forestsVeracruz dry forestsYucatán dry forestsPanamanian dry forestsMarañón dry forestsLara-Falcón dry forestsMaracaibo dry forests
Total country 118,940 81,046 3,0713 1795 6443 334
a BOL: Bolivia, BRA: Brazil, COL: Colombia, CR: Costa Rica, ECU: Ecuador, SAL: El SalvadPER: Peru, VEN: Venezuela.
for securing freshwater availability, protecting fertile soils fromerosion, and allowing poor communities to benefit from alterna-tive sources of income (e.g. ecotourism; payments for environ-mental services).
Furthermore, in the neotropics, the deforestation frontier oc-curs mostly along valleys and foothills of human-dominateddry forest landscapes. Promoting the creation of new protectedareas and ecological corridors within fragmented dry forest land-scapes, and engaging local communities in sustainable dry forestmanagement initiatives should be more seriously considered as ahigh priority measure for the mitigation of overall tropicaldeforestation.
Acknowledgements
This work was carried out with the aid of a grant from the Inter-American Institute for Global Change Research (IAI) CRN2-021which is supported by the US National Science Foundation (GrantGEO-0452325). We are grateful to all researchers and participantsof the Tropi-Dry research network who have provided useful in-sights and suggestions during the network annual meetings to im-prove this land cover assessment. Special thanks are given to JulioCalvo, Mauricio Quesada, Mario Marcos do Espirito Santo and Ger-aldo Wilson Fernandes for their comments and suggestions onearly versions. We thank also the comments and suggestions ofthree anonymous reviewers. We also thank the University of Alber-ta for logistical support.
Appendix A
Tables A1 and A2.
orest ecoregions of North, Central and South American countries.a
GUA HON MEX NIC PAN PER VEN Total % of totalTDF inAmerica
4010 0.77142,941 27.51
53,036 10.2110,926 19,411 3.74
1977 0.389057 1.741251 0.249945 1.91
4 1245 6280 495 7414 20,573 3.965549 1.07
1497 2392 0.46217.5 2556 2774 0.53
14,455 14,455 2.7836,416 36,416 7.0114,867 14,867 2.86
2563 2563 0.4950,568 50,568 9.7319,337 19,337 3.72
12128 12128 2.33926 926 0.18
27,151 27,151 5.232128 2128 0.41
839.5 840 0.168597 8597 1.659873 9873 1.90
4 1462 6279 181,461 7414 2128 2337 29,396 472,759 91
or, GUA: Guatemala, HON: Honduras, MEX: Mexico, NIC: Nicaragua, PAN: Panama,

Table A2Current tropical dry forest extent (km2) derived from MODIS 500-m data within the dry forest ecoregions of the Caribbean islands.
Ecoregions (Olson et al., 2001) Cayman islands Cuba Dominican Republic Haiti Jamaica Total % of total TDF in America
Cuban dry forests 63 36,996 37,058 7.1Hispaniolan dry forests 6194 2002 8196 1.6Jamaican dry forests 1585 1585 0.3
Total country 63 36,996 6194 2002 1585 46,839 9
C.A. Portillo-Quintero, G.A. Sánchez-Azofeifa / Biological Conservation 143 (2010) 144–155 155
References
Arroyo-Mora, J.P., Sánchez-Azofeifa, G.A., Kalácska, M., Rivard, B., 2005. Secondaryforest detection in a Neotropical dry forest using Landsat 7 ETM+ imagery.Biotropica 37 (4), 497–507.
Castro, K., Sánchez-Azofeifa, G.A., Rivard, B., 2003. Monitoring secondary tropicalforest using space-borne data: implications for Central America. InternationalJournal of Remote Sensing 24 (9), 1853–1894.
Congalton, R., 1991. A review of assessing the accuracy of classification of remotelysensed data. Remote Sensing of Environment 37, 35–46.
Eva, Hugh D. et al., 2004. A land cover map of South America. Global Change Biology10 (5), 731–744.
Ewel, J.J., 1999. Natural systems as models for the design of sustainable systems ofland use. Agroforestry Systems 45, 1–21.
Fajardo, L., González, V., Nassar, J., Lacabana, P., Portillo, Q., Carrasquel, F., Rodríguez,J.P., 2005. Tropical dry forests of Venezuela: characterization and currentconservation status. Biotropica 37 (4), 531–546.
Foody, G., 2002. Status of land cover classification accuracy assessment. RemoteSensing of Environment 80, 185–201.
Friedl, M.A., Brodley, C.A., Strahler, A.H., 1999. Maximizing land cover classificationaccuracies produced by decision trees at continental to global scales. IEEETransactions on Geosciences and Remote Sensing 37 (2).
Friedl, M.A. et al., 2002. Global land cover mapping from MODIS: algorithms andearly results. Remote Sensing of Environment 83, 287–302.
Gasparri, N.I., Grau, R., 2009. Deforestation and fragmentation of Chaco dryforest in NW Argentina (1972–2007). Forest Ecology and Management 258,913–921.
Gentry, A., 1995. Diversity and floristic composition of Neotropical dry forests. In:Bullock, S.H., Mooney, H.A., Medina, E. (Eds.), Seasonally Dry Tropical Forests.Cambridge University Press, Cambridge, pp. 146–194.
Gillespie, T.W., 2005. Predicting woody-plant species richness in tropical dryforests: a case study from south Florida, USA. Ecological Applications 15 (1), 27–37.
Giri, C., Jenkins, C., 2005. Land cover mapping of Greater Mesoamerica using MODISdata. Canadian Journal of Remote Sensing 31 (4), 274–282.
Hansen, M., Defries, R.S., Townshend, J.R.G., 2000. Global land cover classification at1 km spatial resolution using a classification tree approach. InternationalJournal of Remote Sensing (6–7), 1331–1364.
Hoekstra, J., Boucher, T., Ricketts, T., Roberts, C., 2005. Confronting a biome crisis:global disparities of habitat loss and protection. Ecology Letters 8, 23–29.
Janzen, D.H., 1988. Tropical dry forests. The most endangered major tropicalecosystem. In: Wilson, E.O. (Ed.), Biodiversity. National Academy Press,Washington, pp. 130–137.
Justice, C. et al., 1998. The moderate resolution imaging spectroradiometer(MODIS): land remote sensing for global change research. IEEE Transactionson Geosciences and Remote Sensing 36 (4).
Kalacska, M., 2005. Use of remotely sensed data to assess Neotropical dry foreststructure and diversity. A thesis submitted to the Faculty of Graduate Studiesand Research in partial fulfillment of the requirements for the degree of Doctorof Philosophy. Department of Earth and Atmospheric Sciences. University ofAlberta, Edmonton, Alberta.
Kalacska, M., Sanchez-Azofeifa, G.A., Rivard, B., Caelli, T., Peter White, H., Calvo-Alvarado, J.C., 2007. Ecological fingerprinting of ecosystem succession:estimating secondary tropical dry forest structure and diversity using imagingspectroscopy. Remote Sensing of Environment 108 (1), 82–96.
Kier, G., Mutke, J., Dinerstein, E., Rickets, T., Kuper, W., Kreft, H., Barthlott, W., 2005.Global patterns of plant diversity and floristic knowledge. Journal ofBiogeography 32, 1107–1116.
Laurance, W., Bierregaard, R. (Eds.), 1997. Tropical Forest Remnants: Ecology,Management and Conservation of Fragmented Communities. The University ofChicago Press, USA. p. 612.
Laurance, W. et al., 2002. Ecosystem decay of Amazonian forest fragments: a 22-year investigation. Conservation Biology 16, 605–618.
Lopez, R.P., Zambrana-Torrelio, C., 2006. Representation of Andean dry ecoregionsin the protected areas of Bolivia: the situation in relation to the newphytogeographical findings. Biodiversity and Conservation 15, 2163–2175.
Ma, Z., Redmond, R., 1995. Tau coefficients for accuracy assessment of classificationof remote sensing data. Photogrammetric Engineering and Remote Sensing 61,435–439.
Miles, L., Newton, A., DeFries, R., Ravilious, C., May, I., Blyth, S., Kapos, V., Gordon, J.,2006. A global overview of the conservation status of tropical dry forests.Journal of Biogeography 33, 491–505.
Mooney, H.A., Bullock, S.H., Medina, E., 1995. Introduction, In: Bullock, S.H.,Mooney, H.A., Medina, E. (Eds.), Seasonally Dry Tropical Forests. CambridgeUniversity Press, Cambridge, pp. 146–194.
Naesset, E., 1996. Conditional tau coefficient for assessment of producer’s accuracyof classified remotely sensed data. ISPRS Journal of Photogrammetry & RemoteSensing 51, 91–98.
Olson, D.M. et al., 2001. Terrestrial ecoregions of the world: a new map of life onearth. BioScience 51, 933–938.
Pennington, R.T., Prado, D.A., Pendry, C., 2000. Neotropical seasonally dry forestsand quaternary vegetation changes. Journal of Biogeography 27, 261–273.
Pennington, T., Lewis, G., Ratter, J., 2006. Neotropical Savannas and SeasonallyDry Forests: Plant Diversity, Biogeography and Conservation. CRC Press, FL,USA.
Prado, D.E., 1993. What is the Gran Chaco vegetation in South America? I. A review.Contribution to the study of flora and vegetation of the Chaco. V. Candollea 48(1), 145–172.
Queiroz, L.P., 2006. The Brazilian caatinga: phytogeographical patterns inferredfrom distribution data of the leguminosae. In: Pennington, R.T., Ratter, J.A.,Lewis, G.P. (Eds.), Neotropical Savannas and Seasonally Dry Forests: PlantBiodiversity, Biogeography and Conservation. CRC Press, Boca Raton, FL.
Rodríguez, J.P., Balch, J.K., Rodríguez-Clark, K.M., 2007a. Assessing extinction risk inthe absence of species-level data: quantitative criteria for terrestrialecosystems. Biodiversity and Conservation 16, 183–209.
Rodríguez, J.P. et al., 2007b. Globalization of conservation: a view from the south.Science 317 (5839), 755–756.
Rulequest Research, 2008. See5: An Informal Tutorial. <http://www.rulequest.com/see5-win.html>.
Sánchez-Azofeifa, G.A. et al., 2005. Research priorities for Neotropical dry forests.Biotropica 37 (4), 477–485.
Stehman, R., Czaplewski, R., 1998. Design and analysis for thematic map accuracyassessment: fundamental principles. Remote Sensing of Environment 64, 331–344.
Tosi Jr., J.A., Voertman, R.F., 1964. Some environmental factors in the economicdevelopment of the tropics. Economic Geography 40, 189–205.
Trejo, I., Dirzo, R., 2000. Deforestation of seasonally dry tropical forest: a nationaland local analysis in Mexico. Biological Conservation 94, 133–142.
Vose, R.S., Schmoyer, R.L., Steurer, P.M., Peterson, T.C., Heim, R., Karl, T.R., Eischeid,J., 1992. The Global Historical Climatology Network: Long-term MonthlyTemperature, Precipitation, Sea Level Pressure, and Station Pressure Data.ORNL/CDIAC-53, NDP-041. Carbon Dioxide Information Analysis Center, OakRidge National Laboratory, Oak Ridge, Tennessee.
World Conservation Union (IUCN), 2006. 2006 World Database on Protected Areas.The WDPA Consortium [CD-ROM].
World Wildlife Fund, 2001. Tropical & Subtropical Dry Broadleaf Forests EcoregionsReport. <http://www.worldwildlife.org/wildworld/profiles/terrestrial_nt.html>.