extended maxwell-garnett-mie formulation applied to size
TRANSCRIPT

HAL Id: hal-01517451https://hal.univ-lorraine.fr/hal-01517451
Submitted on 11 May 2017
HAL is a multi-disciplinary open accessarchive for the deposit and dissemination of sci-entific research documents, whether they are pub-lished or not. The documents may come fromteaching and research institutions in France orabroad, or from public or private research centers.
L’archive ouverte pluridisciplinaire HAL, estdestinée au dépôt et à la diffusion de documentsscientifiques de niveau recherche, publiés ou non,émanant des établissements d’enseignement et derecherche français ou étrangers, des laboratoirespublics ou privés.
Extended Maxwell-Garnett-Mie formulation applied tosize dispersion of metallic nanoparticles embedded in
host liquid matrixY. Battie, A. Resano-Garcia, N. Chaoui, Y. Zhang, A. En Naciri
To cite this version:Y. Battie, A. Resano-Garcia, N. Chaoui, Y. Zhang, A. En Naciri. Extended Maxwell-Garnett-Mie for-mulation applied to size dispersion of metallic nanoparticles embedded in host liquid matrix. Journalof Chemical Physics, American Institute of Physics, 2014, 140 (4), pp.044705. �10.1063/1.4862995�.�hal-01517451�
Extended Maxwell-Garnett-Mie formulation applied to size dispersion of metallicnanoparticles embedded in host liquid matrix
Y. Battie, , A. Resano-Garcia, N. Chaoui, Y. Zhang, and A. En Naciri
Citation: The Journal of Chemical Physics 140, 044705 (2014); doi: 10.1063/1.4862995View online: http://dx.doi.org/10.1063/1.4862995View Table of Contents: http://aip.scitation.org/toc/jcp/140/4Published by the American Institute of Physics

THE JOURNAL OF CHEMICAL PHYSICS 140, 044705 (2014)
Extended Maxwell-Garnett-Mie formulation applied to size dispersionof metallic nanoparticles embedded in host liquid matrix
Y. Battie,1,a) A. Resano-Garcia,1 N. Chaoui,1 Y. Zhang,2 and A. En Naciri11LCP-A2MC, Institut Jean Barriol, Université de Lorraine, 1 Bd Arago, 57070 Metz, France2LEM3, Université de Lorraine, Ile du Saulcy, 57045 Metz, France
(Received 23 September 2013; accepted 10 January 2014; published online 27 January 2014)
The optical properties of metallic spherical nanoparticles embedded in host liquid matrix are studied.Extended Maxwell-Garnett-Mie formulation which accounts for size dispersion, the intrinsic con-finement, and extrinsic size effect, is proposed for the calculation of the effective dielectric functionand absorption coefficient of size dispersion of colloidal solution of Au and Ag nanoparticles in wa-ter. We demonstrate that the size distribution induces an inhomogeneous broadening and an increaseof the amplitude of the plasmon band. A large redshift of the plasmon band is also observed forsilver nanoparticles. Compared to the conventional Maxwell Garnett theory, we demonstrated thatthis model gives better description of the measured absorption spectra of colloidal gold solutions.© 2014 AIP Publishing LLC. [http://dx.doi.org/10.1063/1.4862995]
I. INTRODUCTION
Noble metal nanoparticles (NPs) are increasingly utilizedin many fields of applied sciences, such as sensors,1 opticalfiltering,2, 3 optoelectronics devices,4 information storage,5
and nonlinear optics.6 Indeed, these NPs exhibit unique op-tical properties such as strong surface plasmon resonances(SPR) coming from the collective oscillations of their con-duction electrons. The characteristics of the SPR depend onthe dielectric constant of the host medium and on size andshape of the NPs.7, 8 In the case of spherical NPs, the SPRdiameter dependence is related to both intrinsic confinementand extrinsic dynamic effects.9, 10 The intrinsic confinementtraduces the modification of the dielectric function of metaldue to the finite size of the NPs while the extrinsic dynamiceffect comes from the non-uniformity of the electric field in-side the NPs.
Conventional preparation routes unavoidably conductto NPs showing a size distribution which induces drasticchanges in the optical properties of the effective compositemedium which consists of NPs embedded in a host matrix.Indeed, as experimentally revealed by Billaud et al.,11 the sizedistribution of NPs generates an inhomogeneous broadeningof the SPR band. Amendola and Meneghetti12 introduced thesize distribution in the Mie Gans theory by weighting the ex-tinction cross section of individual nanoparticles by the sizedistribution. However, Mie theory does not consider interac-tion between nanoparticles, so this approach is only restrictedto dilute nanoparticle arrays. Moreover, the complex effectivedielectric function of the composite medium, which is a keyparameter for ellipsometric investigation, cannot be directlyextracted from the Mie theory. Ellipsometric measurementsperformed on silver NPs with highly dispersed size revealed abroad SPR linewidth13 which could not have been interpreted
a)Author to whom correspondence should be addressed. Electronic mail:[email protected]
in terms of conventional effective medium theories such asMaxwell Garnett (MG) theories.14 Indeed, MG theory is ex-tensively used to describe the optical properties of collectionsof metallic nanoparticules embedded in a host medium. How-ever, this theory, which originally derives by invoking thedipolar character of the NPs, takes into account their meansize and neglects their size distribution. Few approaches wereproposed to introduce the size dispersion in effective mediumtheory.15–18 Barrera et al.15 extended the effective mediumtheory to polydisperse NPs by taking into account the cor-related fluctuation among the induced dipole moment and in-ternal field. However, retardation effects, which are predom-inant for NPs radius higher than 10 nm,10, 19 were neglectedby these authors. Retardation effects induce a redshift of theplasmon resonance as the nanoparticle radius increases.20 Onthe other hand, Chylek and Srivastava16 developed an effec-tive medium model which consisted in annulling the forward-scattering amplitude of a cell of the composite medium, im-mersed inside the effective homogeneous background. Thesize distribution was included through the dipolar magneticcontribution of the NPs. This model did not take into accountintrinsic confinement effects observed for NPs size smallerthan the mean free path of the conduction electrons. More-over, as shown by Ruppin,21 the magnetic dipolar contribu-tion can be neglected for noble metallic NPs. A realistic ex-tension of the Maxwell Garnett model was reported by Banyaiand Koch18 and successfully applied to determine the opticalproperties of silicon quantum dots embedded in a dielectricmatrix.22 However, this model was based on the numericalcalculation of the average polarizability of the ensemble ofNPs in quasistatic approximation. In other words, it did nottake into account dynamic effects such as retardation effectsthat occur for large NP diameter.
In this paper, a modified effective medium theory basedon dipolar approximation is developed to take into accountthe size distribution of spherical NPs, the intrinsic confine-ment effects and extrinsic dynamic effects. Our approach is
0021-9606/2014/140(4)/044705/9/$30.00 © 2014 AIP Publishing LLC140, 044705-1
044705-2 Battie et al. J. Chem. Phys. 140, 044705 (2014)
similar to the reported one by Niu et al.23 to describethe optical properties of a mixture of nanoparticles dis-tributed in shape, by averaging the dipole moments of individ-ual nanoparticles. The averaging was performed by weight-ing dipole moments over the relative abundance of eachparticle.23 The influence of the diameter dispersion on theplasmon resonance of colloidal gold and silver NPs dispersedin water is investigated through several simulations. The the-oretical model can be validated by comparing these simula-tions to experimental absorption spectra of colloidal gold so-lutions. We demonstrate that the effective optical propertiesof the composite medium depend on both the size distributionand the nature of the NPs.
II. THEORY
A. Maxwell-Garnett (MG) and Maxwell-GarnettMie theories (MGM)
In dipolar approximation, the effective dielectric functionεeff of the composite medium which consists of spherical in-clusions embedded in a host matrix is related to the polar-izability α of the inclusions through the Clausius-Mossottirelation:9, 10
εeff − εm
εeff + 2εm
= f
R̄3α(R̄), (1)
where εm is the dielectric function of the matrixand R̄ and fare the mean radius of NPs radius and the volume fraction ofthe inclusions, respectively. Note that the size of the inclusionmust be smaller than the wavelength and the volume fractionmust be small enough to satisfy the dipolar approximation.In quasistatic limit, the polarizability of an inclusion with aradius R is given by
αMG(R) = R3 εnp − εm
εnp + 2εm
, (2)
where εnp is the dielectric function of the inclusion, i.e., theNPs. When substituted into Eq. (1), this yields the usualMG formula.14 The radius does not explicitly appear inthe MG formula, and only intrinsic confinement is takeninto account. Indeed, quasistatic approximation is only validfor homogeneous field inside the NPs. As a consequence,the polarizability must be redefined to incorporate dynamiceffects in effective medium theory. Doyle24 suggested that asize-dependent extension of the MG formula can be obtainedby deriving the electric dipole polarizability from the Mietheory:
αMGM (R) = 3iλ3
16π3ε3/2m
a1(R), (3)
where a1 is the first electric Mie coefficient given by
a1(R) =√
εnp�1(2πR
√εnp/λ
)� ′
1
(2πR
√εm/λ
) − √εm�1
(2πR
√εm/λ
)� ′
1
(2πR
√εnp/λ
)√
εnp�1(2πR
√εnp/λ
)ξ ′
1
(2πR
√εm/λ
) − √εm�1
(2πR
√εm/λ
)ξ ′
1
(2πR
√εnp/λ
) , (4)
where �1 and ξ 1 are the first order Riccati Bessel functions.Note that for small NP size, Eqs. (2) and (3) are equiva-lent. The modified long wavelength approximation7 whichmodifies the quasistatic polarizability to introduce radiativedamping and dynamic depolarization is only a four order ex-pansion of Eq. (3). In the considered radius range, i.e., forradius smaller than 25 nm, MLWA and Eq. (3) are similar.The combination of Eqs. (1), (3), and (4) gives the so-calledMaxwell-Garnett Mie theory (MGM) and allows calculatingthe effective dielectric function by considering both intrinsicconfinement and extrinsic dynamic effects.9
Although conventional Mie theory well describes lightabsorption in dilute dispersions of weakly interacting spheres,this single-particle approach fails to interpret the interactionsin nanoparticle arrays.25 On the other hand, MGM takes intoaccount dipolar-interactions between nanoparticles. In otherwords, contrary to the Mie theory, MGM is more adequateto describe the optical properties of a collection of smallnanoparticles. In addition, contrary to the Mie theory, MGMdetermines the effective dielectric function of nanoparticle ar-rays which is a useful parameter for ellipsometric, reflecto-metric, or interferometric measurements.
B. Modified Maxwell-Garnett Mie theory (MMGM)
Realistic composite materials are made of NPs with vari-able sizes. As a consequence, each NP exhibits its ownpolarizability value. Considering the mean field theory, theEqs. (1) and (3) should be revised by taking into accountthe mean polarizability of the NPs. This gives the ModifiedMaxwell-Garnett Mie theory (MMGM):
εeff − εm
εeff + 2εm
= 3iλ3
16π3ε3/2m
f
R̄3
∫ Rmax
Rmin
P (R)a1(R)dR, (5)
where P(R) is the NPs size distribution. Rmin and Rmax repre-sent the lower and upper bounds of the size distribution. Theconstant average nanoparticles radius (R), which appears inthe denominator of Eq. (5), comes from the volume fractionintroduced in the Clausius Mossoti relation (1). Note that theMMGM respects the Kramers-Kronig relations and is validfor any distribution law P(R).
As pointed out by Ruppin,21 the effective dielectric func-tion has a physical meaning only if the scattering cross sectionof the NPs is smaller than their absorption cross section. Thislimits the validity of the effective medium theory, and thus,

044705-3 Battie et al. J. Chem. Phys. 140, 044705 (2014)
the MMGM theory to radius less than 25 nm for gold andsilver NPs.10
C. Dielectric function of metallic nanoparticles
The dielectric function of noble metal NPs such as sil-ver and gold consists of two contributions accounting for in-terband and intraband electron transitions that involve boundand free electrons, respectively. In classical approach, con-finement effects appear when the mean free path of conduc-tion electron is limited by the nanoparticle size. Assumingthat only the free electrons are affected by the NPs size,26 thedielectric function of metallic NPs can be expressed in thefollowing way:10
εnp(R) = εbulk − ω2p
ω(ω + i0)+ ω2
p
ω(ω + i
(0 + A
vf
R
)) ,
(6)where εbulk, ωp, vf , and 0 are the tabulated dielectricfunction of the bulk,27, 28 the plasma frequency, the Fermivelocity of free electrons, and electron damping, respec-tively. A is a constant which depends on the details of theelectron-nanoparticle surface scattering process. For spher-ical nanoparticles, classical approach gives A = 1 or 0.75for isotropic and diffusive electron scattering, respectively29
while quantum theory yield to 0.75 or 0.86 values. Due tochemical interface damping, this constant also depends onthe surrounding medium.30 As example, measurements per-formed on spherical silver/silica core shell nanoparticles yieldto A = 0.6, i.e., a slightly smaller value than the predictedone by classical and quantum theory.31, 32 In this paper, theconstant A is assumed to be equal to one. Note that an over-estimation of A could induce a broadening of the SPR band.As shown by the density functional theory,26 this dispersionlaw can be used for NP radius above 1 nm. In other words,the combination of Eqs. (5) and (6) can be used for spher-
ical nanoparticles with radius ranging from 1 nm to 25 nmThe first two terms of Eq. (6) traduce the interband dielectricfunction while the third term describes the intraband dielec-tric function. This latter term contains intrinsic confinementeffects due to the limitation of the mean free path of free elec-trons by the scattering from the particle surface. For silverNPs, εbulk was taken from Palik’s handbook27 and parame-ters ωp, 0 and vf were fixed to 8.4 eV, 0.08 eV, and 1.39× 10⁶ m/s, respectively. For gold NPs, εbulk was extractedfrom the Ref. 28 while parameters ωp, 0 and vf were9.06 eV, 0.077 eV, and 1.4 × 10⁶ m/s, respectively.
III. SIMULATIONS
A. Size effects
The effective complex dielectric function of metallicspherical NPs embedded in host liquid matrix was calcu-lated for different NPs sizes. The simulations of the opti-cal response of aqueous colloidal solutions of Au and Agwere performed using MG and MGM without considering thesize dispersion. The mean radii of NPs were 1, 2, 5, 10, and20 nm and the volume fraction was 1%. The results are givenin Fig. 1 and Fig. 2 for Au and Ag, respectively.
The spectra of real and imaginary parts of the effective di-electric function calculated by Maxwell-Garnett model showa slight shift of the plasmon resonance toward higher energieswith increasing size accompanied by a narrowing and an in-crease of the amplitude of the plasmon band. The evolutionof the full width at half maximum (FWHM) of the plasmonband can be attributed to the intrinsic confinement effects.10
Indeed, the damping coefficient of free electrons, which is in-versely proportional to the NP radius, may induce broadeningof the plasmon band for small sizes. The amplitudes increaseof the dielectric function with increasing NPs size is muchmore important for Ag compared to Au NPs. In the case of
FIG. 1. [(a), (d)] Absorption coefficient and [(b), (c), (e), (f)] effective complex dielectric function of monodisperse gold NPs in water calculated from MG andMGM, respectively. The volume fraction is fixed at 1%.

044705-4 Battie et al. J. Chem. Phys. 140, 044705 (2014)
FIG. 2. [(a), (d)] Absorption coefficient and [(b), (c), (e), (f)] effective complex dielectric function of monodisperse silver NPs in water calculated from MGand MGM, respectively. The volume fraction is fixed at 1%.
Au NPs, interband transition threshold is closed to the plas-mon resonance. As a consequence, the interband transitionsof Au NPs reduce the amplitude of the plasmon band33 by25% with respect to that of silver NPs. Therefore, the dif-ference between dielectric functions calculated by MG andMGM models is much more marked for silver NPs. This dif-ference is caused by the dynamic depolarization effects whichare weakly visible in gold due to the presence of interbandtransitions closed to the plasmon energy.10 In the UV spectralrange, the effective dielectric function, calculated accordingto the MG model weakly depends on NP size. In this model,the NP radius is only contained in the Drude part (Eq. (6)),i.e., the plasmon resonance. By contrast, the dielectric func-tion is strongly related to the radius in MGM theory. This ra-dius dependence introduces a variation of dielectric functionamplitudes beyond the plasmon resonance at around 2.8 eVfor Au and 3.2 eV for Ag.
In agreement with Kreibig and Vollmer,10 the red shiftobserved in the MGM model is attributed to dynamic depo-larization effects. This phenomenon can be explained by thenon-instantaneous uniformity of the electric field inside theNP.10 By performing a four order expansion of the first Miecoefficient, Kuwata et al.20 have shown that dynamic depolar-ization can be decomposed into two effects: retardation effectand radiation loss effect. Retardation effect which brings inthe second order term of the expansion of the first electricMie coefficient induces a redshift of the plasmon resonance.In the other hand, radiation loss effects which appears in thethird order term of the expansion of the first electric Mie co-efficient introduces a broadening of the plasmon resonance asthe nanoparticle radius increases. In agreement with Kreibigand Vollmer,10 radiation loss effect is negligible in the 1 nm–25 nm radius range and only retardation effect are observedfor nanoparticle radius larger than 10 nm (Figs. 1–3).
In order to clearly show the difference between MGand MGM models, the evolution of FWHM of the plasmonband has been plotted against resonance energy for both Au(Fig. 3(a)) and Ag (Fig. 3(b)) for NPs radii ranging from 1 to25 nm.
For small particles size (< 3 nm for Ag and < 6 nm forAu), MGM and MG give same results. Indeed, the resonanceenergy exhibits a blue shift with increasing NPs radius. Thisblue shift is attributed to intrinsic confinement effect.10 Thedifference between MGM and MG becomes significant from3 nm for Ag NPs and 6 nm for Au NPs. With increasing ra-dius, this difference is more pronounced for Ag for whichthe resonance exhibits a strong red shift when calculated byMGM theory. This difference between silver and gold is dueto the prominent inter-band transitions of gold that minimizeNP size effects.10
MG model can be applied to study only the optical re-sponses of smaller sizes (less than 3 nm for Ag and 6 nm forAu). However, the MGM theory can be considered as a moregeneral model, it can describe the optical properties of bothsmall NPs as well as the large size (< 25 nm).21
FIG. 3. Bandwidth of the plasmon band versus the resonance energy of (a)gold and (b) silver NPs in water calculated for different radius from MG andMGM. The volume fraction is fixed at 1%.

044705-5 Battie et al. J. Chem. Phys. 140, 044705 (2014)
B. Size dispersion effects
Figure 4 shows the imaginary part of effective dielectricfunction of Au and Ag NPs calculated by taking into accountsize dispersion of NPs in water matrix. The simulations wereperformed by MMGM formulas (Eq. (5)) for a lognormal sizedistribution with σ = 1.20 corresponding to typical distribu-tions frequently observed in TEM histograms.34 Three differ-ent mean radii, i.e., 2, 5, and 10 nm were taken into considera-tion in calculation. A monodisperse and a normal distributionof nanoparticles are also considered. The standard deviationsand the mean value of the normal distributions are deducedfrom the second and the first order moment of the correspond-ing lognormal distributions.
Simulations performed from lognormal and normal dis-tributions give similar results. Indeed, for each mean radius,both distributions considered in Figure 4 have the same firstand second central moment. Now, we focus our discussion onsimulations performed from lognormal distribution. If the sizedistribution does not change drastically the behaviours of di-electric functions, a significant increase of both amplitude andwidth is however observed as the size dispersion rises. Forexample, for an average radius of 2 nm of Au NPs, the realand imaginary of the dielectric function at resonance changesfrom 1.83 to 1.85 and 0.056 to 0.068, respectively. In otherwords, an augmentation of the real and imaginary parts ofdielectric function is observed when the size distribution isintroduced in MGM model.
For Ag NPs, the imaginary part of the dielectric func-tion of 2 nm average size at plasmon resonance changes from0.171 to 0.212 while its real part at resonance remains almostconstant. In addition to the change of amplitude and width, aredshift is also observed for Ag NPs.
As a first approximation, by considering quasistatic po-larizability without including intrinsic size effects, the changeof amplitudes of optical responses can be explained by an ar-tificial increase of the volume fraction feff of NPs when thesize distribution is taken into account in the model. This neweffective volume fraction (feff) can be written
feff = f
R̄3
∫ Rmax
Rmin
P (R)R3dR, (7)
where f is the initial volume fraction value of NPs in water.It is also interesting to consider the optical properties of
these NPs obtained with MMGM formula for various values(from 1.05 to 1.80) of the size dispersion σ for a fixed meanradius of 2 nm, 5 nm, and 10 nm. Figure 5 plots the evo-lution of the real and imaginary parts of the dielectric func-tions and the absorption coefficient of Au NPs with 2, 5, and10 nm mean radii and for variable size dispersion σ . Theseresults were determined from the numerical simulation ofMMGM (5).
First, it is observed that both amplitude and width of theplasmon band increase with increasing σ . This result traducesan inhomogeneous broadening of the plasmon resonance. For
FIG. 4. [(a), b, (c)] Nanoparticles distribution used to simulate imaginary part of the complex dielectric function of [(d), (e), (f)] Au and [(g), (h), (i)] Ag NPs.Three distribution laws are investigated: a monodisperse distribution (black line), a lognormal distribution (red line), and a normal (blue line) distribution. Themean radii of the lognormal distribution are [(a), (d)] 2 nm, [(b), (e)] 5 nm, and [(c), (f)] 10 nm. A 1.2 standard deviation is considered for lognormal distribution.The mean value and standard deviation of normal distributions are calculated from the first and second central moment of lognormal distributions, respectively.
044705-6 Battie et al. J. Chem. Phys. 140, 044705 (2014)
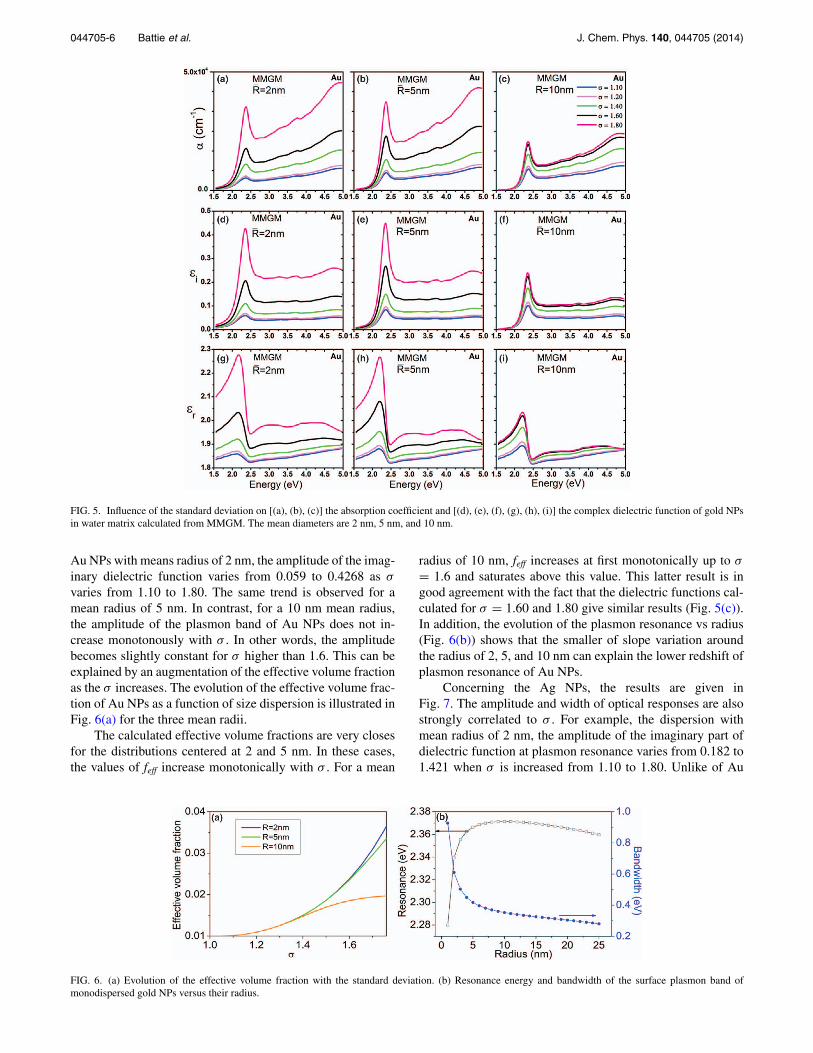
FIG. 5. Influence of the standard deviation on [(a), (b), (c)] the absorption coefficient and [(d), (e), (f), (g), (h), (i)] the complex dielectric function of gold NPsin water matrix calculated from MMGM. The mean diameters are 2 nm, 5 nm, and 10 nm.
Au NPs with means radius of 2 nm, the amplitude of the imag-inary dielectric function varies from 0.059 to 0.4268 as σ
varies from 1.10 to 1.80. The same trend is observed for amean radius of 5 nm. In contrast, for a 10 nm mean radius,the amplitude of the plasmon band of Au NPs does not in-crease monotonously with σ . In other words, the amplitudebecomes slightly constant for σ higher than 1.6. This can beexplained by an augmentation of the effective volume fractionas the σ increases. The evolution of the effective volume frac-tion of Au NPs as a function of size dispersion is illustrated inFig. 6(a) for the three mean radii.
The calculated effective volume fractions are very closesfor the distributions centered at 2 and 5 nm. In these cases,the values of feff increase monotonically with σ . For a mean
radius of 10 nm, feff increases at first monotonically up to σ
= 1.6 and saturates above this value. This latter result is ingood agreement with the fact that the dielectric functions cal-culated for σ = 1.60 and 1.80 give similar results (Fig. 5(c)).In addition, the evolution of the plasmon resonance vs radius(Fig. 6(b)) shows that the smaller of slope variation aroundthe radius of 2, 5, and 10 nm can explain the lower redshift ofplasmon resonance of Au NPs.
Concerning the Ag NPs, the results are given inFig. 7. The amplitude and width of optical responses are alsostrongly correlated to σ . For example, the dispersion withmean radius of 2 nm, the amplitude of the imaginary part ofdielectric function at plasmon resonance varies from 0.182 to1.421 when σ is increased from 1.10 to 1.80. Unlike of Au
FIG. 6. (a) Evolution of the effective volume fraction with the standard deviation. (b) Resonance energy and bandwidth of the surface plasmon band ofmonodispersed gold NPs versus their radius.

044705-7 Battie et al. J. Chem. Phys. 140, 044705 (2014)
FIG. 7. Influence of the standard deviation on [(a), (b), (c)] the absorption coefficient and [(d), (e), (f), (g), (h), (i)] the complex dielectric function of silver NPsin water matrix calculated from MMGM. The mean diameters are 2 nm, 5 nm, and 10 nm.
NPs, a redshift of plasmon resonance is observed with the in-crease of σ . This is attributed to the higher size dependenceof dielectric function of Ag NPs (Fig. 3(b)).
For a collection of monodisperse Ag NPs, the curve ofplasmon resonance as a function of radius shows that the slopeincreases with the redshift (Fig. 8). Compared to Au NPs, theoptical response of Ag NPs is more pronounced at high NPssize and induces a shift to lower energies. So the asymmetricalredshift is obtained by varying the size dispersion. Indeed, theredshift is more important for distribution centered at 10 nmthan that centered at 2 nm.
We conclude that in both cases, the size distribution de-pendence of the dielectric function of Au and Ag NPs hasas effect an augmentation of the amplitude and an inhomo-
FIG. 8. Resonance energy and bandwidth of the surface plasmon band ofmonodispersed silver NPs versus their radius.
geneous broadening of the plasmon band. Although effectivevolume fraction approximation (Eq. (7)) can be applied to Au,it is not valid for the Ag NPs. The main difference betweenthese nanometals is derived from interband transitions that in-fluence strongly the optical responses in larger optical spec-trum range.
FIG. 9. [(a), (c)] TEM images and [(b), (d)] radius distribution of [(a), (b)]S1 and [(c), (d)] S2.

044705-8 Battie et al. J. Chem. Phys. 140, 044705 (2014)
FIG. 10. Comparison between experimental absorption spectra of (a) S1 and (b) S2 and the theoretical ones by MG and MMGM.
IV. EXPERIMENTAL
To validate the MMGM model, simulations were com-pared to the absorption coefficient of two commercial goldcolloids (S1 and S2) dispersed in water purchased from SigmaAldrich. Their volume fractions, given by the supplier, are inthe 1.10−4%–6.10−4% range. Note that measurements on Agcolloids are in progress and will be reported in a later pa-per. Transmission electron microscopy (TEM) and absorptionspectroscopy were performed with a Phillips CM200 TEM,and a Horiba Jobin Yvon spectrometer. Figure 9 illustrates theTEM images of S1 and S2. The corresponding diameter distri-butions extracted from the statistical analysis of TEM imagesare also reported.
Although S2 NPs seem more faceted, S1 and S2 can beconsidered as spherical. The radius distribution can be de-scribed by a lognormal distribution law. The average radiusof S1 and S2 NPs are estimated to 5 nm and 15.5 nm, respec-tively. The standard deviations of the S1 and S2 distributionsare 1.08 and 1.12, respectively.
Figure 10 compares the measured absorption coefficientof S1 and S2 to the simulated ones from the MMGM and theconventional MG theories. Note that the simulations were per-formed without free parameter excepted for the volume frac-tion. To respect the domain of validity of Eqs. (5) and (6),the lower and upper limits of integral in Eq. (5) are 1 nm and25 nm, respectively. The latter, estimated from the MMGMtheory, are 1.9 × 10⁻⁴% and 2.6 × 10⁻⁴%, for S1 and S2,respectively. This is in good agreement with the volume frac-tion range given by the supplier. As shown in Figure 10, bothmodels precisely predict the SPR energy. However, the sim-ulated spectra obtained from the MMGM theory is in muchbetter agreement with the measured spectra than that obtainedfrom the MG theory. The small deviations, mainly observedfor S2, can be reasonably attributed to the facetted shape ofS2 NPs. In particular, the MMGM theory allows predictingthe energy, amplitudes, and width of the SPR band. These re-sults also suggest that the assumption that the scattering eventconstant A is close to 1 is valid. This unambiguously demon-strates that the NP size distribution must be considered in or-der to describe the optical properties of a collection of NPswith a high accuracy.
V. CONCLUSIONS
In conclusion, a new model based on dipolar approxima-tion was developed to describe the effective optical properties
of a collection of spherical NPs by taking into account theNP size distribution, the intrinsic confinement, and the extrin-sic dynamic effects. The complex effective dielectric functionand the absorption coefficient of gold and silver NPs dispersedin water were investigated for different lognormal size distri-butions. The size distribution was found to induce an inho-mogeneous broadening and an increase of the amplitude ofthe SPR band. A large redshift of the SPR was also observedfor silver NPs. Compared to the conventional MG theory, theMMMG model provides a better description of the absorptionspectra of colloidal gold solutions. Thus, this model is a newstep forwards the comprehension of the optical properties ofcomposite materials.
1J. N. Anker, W. Paige Hall, O. Lyandres, N. C. Shah, J. Zhao, and R. P. VanDuyne, Nat. Mater. 7, 442 (2008).
2G. Carotenuto, Appl. Organomet. Chem. 15, 344 (2001).3R. Sayah, L. Nadar, F. Vocanson, Y. Battie, S. Reynaud, R. Vera, A.Boukenter, and N. Destouches, Microporous Mesoporous Mater. 139, 45(2011).
4Y. Dirix, C. Bastiaansen, W. Caseri, and P. Smith, Adv. Mater. 11, 223(1999).
5T. Fournel, N. Destouches, Y. Battie, L. Bois, and Y. Boutant, J. Phys.:Conf. Ser. 139, 012019 (2008).
6S. Porel, S. Singh, S. S. Harsha, D. N. Rao, and T. P. Radhakrishnan, Chem.Mater. 17, 9 (2005).
7K. L. Kelly, E. Coronado, L. L. Zhao, and G. C. Schatz, J. Phys. Chem. B107, 668 (2003).
8C. Noguez, J. Phys. Chem. C 111, 3806 (2007).9V. Myroshnychenko, J. Rodriguez-Fernandez, I. Pastoriza-Santos, A. M.Funston, C. Novo, P. Mulvaney, L. M. Liz-Marzan, and F. J. Garcıa deAbajo, R. Soc. Rev. 37, 1792 (2008).
10U. Kreibig and M. Vollmer, Optical Properties of Metal Clusters (Springer,Berlin, 1995).
11P. Billaud, J.-R. Huntzinger, E. Cottancin, J. Lermé, M. Pellarin, L. Ar-naud, M. Broyer, N. Del Fatti, and F. Vallée, Eur. Phys. J. D 43, 271(2007).
12V. Amendola and M. Meneghetti, J. Phys. Chem. C 113, 4277 (2009).13Y. Battie, N. Destouches, F. Chassagneux, D. Jamon, L. Bois, N.
Moncoffre, and N. Toulhoat, Opt. Mater. Express 1, 1019 (2011).14G. J. C. Maxwell Garnett, Philos. Trans. R. Soc. London, Ser. A 203, 385
(1904).15R. G. Barrera, P. Villasenir-Gonzalez, W. L. Mochan, and G. Monsivais,
Phys. Rev. B 41, 7370 (1990).16P. Chýlek and V. Srivastava, Phys. Rev. B 27, 5098 (1983).17L. G. Grechko, V. N. Pustovit, and K. W. Whites, Appl. Phys. Lett. 76,
1854 (2000).18L. Banyai and S. X. Koch, Semiconductor Quantum Dots (World Scientific,
Singapore, 1993).19S. Berciaud, L. Cognet, P. Tamarat, and B. Lounis, Nano Lett. 5, 515
(2005).20H. Kuwata, H. Tamaru, K. Esumi, and K. Miyano, Appl. Phys. Lett. 83,
4625 (2003).21R. Ruppin, Opt. Commun. 182, 273 (2000).22A.-S. Keita and A. En Naciri, Phys. Rev. B 84, 125436 (2011).

044705-9 Battie et al. J. Chem. Phys. 140, 044705 (2014)
23Z. Niu, Y.-R. Zhen, M. Gong, Q. Peng, P. Nordlander, and Y. Li, Chem.Sci. 2, 2392 (2011).
24W. T. Doyle, Phys. Rev. B 39, 9852 (1989).25S. K. Ghosh and T. Pal, Chem. Rev. 107, 4797 (2007).26Y. He and T. Zeng, J. Phys. Chem. C 114, 18023 (2010).27E. D. Palik, Handbook of Optical Constants of Solids (Academic Press,
Orlando, 1985).28P. B. Johnson and R. W. Christy, Phys. Rev. B 6, 4370 (1972).29E. A. Coronado and G. C. Schatz, J. Chem. Phys. 119, 3926 (2003).
30H. Hövel, S. Fritz, A. Hilger, U. Kreibig, and M. Volmer, Phys. Rev. B48(24), 18178 (1993).
31H. Baida, P. Billaud, S. Marhaba, D. Christofilos, E. Cottancin, A. Crut,J. Lerme, P. Maioli, M. Pellarin, M. Broyer, N. Del Fatti, F. Vallee, A.Sanchez-Iglesias, I. Pastoriza-Santos, and L. M. Liz-Marzan, Nano Lett. 9,3463 (2009).
32G. V. Hartland, Chem. Rev. 111, 3858 (2011).33M. I. Stockman, Opt. Express 19, 22029 (2011).34B. Roy and D. Chakravorty, J. Phys.: Condens. Matter 2, 9323 (1990).