extended abstract: migration and … abstract: migration and entrepreneurship in mexico kevin thom...
TRANSCRIPT

Extended Abstract: Migration and Entrepreneurship
in Mexico
Kevin ThomNew York University
Daniel Yi XuNew York University and NBER
January 29, 2010
1 Introduction
The Mexican labor force is distinguished by exceptionally high rates of both international migration
and entrepreneurship. During the last half-century, large flows of Mexican workers have migrated
to the United States. As noted by Hanson (2006), approximately 10% of the Mexican population
resided in the United States in 2004. On the other hand, about 25% of the Mexican labor force is
self-employed, making Mexico one of the most entrepreneurial countries in the world (Fairlie 2006).
The factors that affect entrepreneurship may be particularly important in explaining the dynam-
ics of emerging economies such as Mexico, since entrepreneurship appears to be an important driver
of development and growth. (Murphy et al. (1991), Schmitz (1989), Banerjee and Newman (1993))
. A natural question then, is whether labor migration and entrepreneurial activity are related in an
economy. One argument advanced by both Mesnard (2004)and Dustmann and Kirchkamp (2002)is
that higher rates of international migration might increase rates of entrepreneurship if individuals
face credit constraints and must incur non-divisible entry costs when starting a new business. In
such an environment, individuals can temporarily migrate in order to more quickly raise startup
funds. Studies using Mexican data suggest that there may be such a positive connection between
migration and entrepreneurship. (Woodruff and Zenteno (2007), Massey and Emilio (1998)).
1
However, it is not clear whether positive correlation between entrepreneurship and migration
in Mexico reflects this particular causal link, or if it could be driven by other causal mechanisms,
or perhaps the self-selection of certain kinds of workers into both migration and entrepreneurship.
Our paper extends this literature by further investigating the relationship between entrepreneur-
ship and migration in Mexico, and attempts to assess the importance of theoretical arguments
on this relationship that have hitherto been ignored or viewed in isolation. Our preliminary em-
pirical analysis using Mexican Migrant Project (MMP) data suggests that migration experience
can boost the probability that a return migrant will start a business. We hope to explore three
possible explanations for the relationship between these activities: (1). Migration Complements
Entrepreneurship I: Prospective business owners may choose to temporarily migrate and accumu-
late assets in the U.S. in order to overcome credit constraints impeding entrepreneurship in Mexico
(2). Migration Complements Entrepreneurship II: Temporary out-migration to U.S. could also im-
prove Mexican worker’s entrepreneurship ability through learning-by-observing and increase their
chance of success back in Mexico. (3). Migration is a Substitute for Entrepreneurship: Individuals
from communities with a high propensity to migrate might also have the kinds of characteristics
and opportunities that increase their propensity for entrepreneurship. If so, then restrictions on
their migratory opportunities might actually increase their rates of business ownership.
We hope to make a novel contribution to the literature by developing a model of an individ-
ual’s migration and entrepreneurship decisions over the course of the life-cycle which captures all
three explanations identified above. Using data from the MMP, we will estimate the parameters
of this structural model. Such structural parameter estimates will allow us to perform interesting
counter-factual policy experiments, such as assessing the consequences of changes in US migration
policy or Mexican entrepreneurship policy on the behavior of Mexican workers. Understanding the
relative strengths of the three mechanisms is crucial for shaping a policy response to poverty. If
mechanisms (1) and (2) above are dominant, then policies that increase the ease of migration will
also stimulate greater entrepreneurship in Mexico. Policymakers should then also be interested the
2
Mexican and U.S. policies shaping the costs and benefits of legal and illegal migration. However, if
mechanism (3) dominates, then migration and entrepreneurship may be alternate pathways to the
alleviation of poverty. In this case, policymakers must be careful that their proposals are promoting
the most expedient pathway. Of course, all three of these mechanisms may be operative, and the
optimal policy response will depend on their relative strengths.
2 Data and Descriptive Statistics
In this section, we briefly introduce the primary data source for our project. We also hope to
further expand this data to combine with Mexican Census. Every year since 1987, the Mexican
Migration Project (MMP) has conducted household interviews in Mexican communities.1 The
database also includes survey responses from a pilot project conducted in 1982 and 1983. The data
used here are those included in the MMP124 database, which includes 124 surveyed communities.
After selecting a particular community for inclusion in the database, the Project randomly selects
households within that community for the survey.2
The MMP collects data on household and community level demographic and economic variables
and the migration histories of the household members, with more detailed data on the most recent
migratory trip taken by each member. Some survey items, such as the income of the household
head, are recorded as of the time of the interview. However, the survey also requests a detailed,
self-reported life history from household heads recording some economic, demographic, and migra-1The Project is jointly administered by researchers from the University of Guadalajara and Princeton University.
For more details, see http://mmp.opr.princeton.edu2Two potential problems with the use of the MMP data relate to the selection of communities for the survey
and the problem of absent migrants. The Project does not randomly select the communities involved in its surveys,but instead employs a method that “targets specific communities for intensive study.” (Massey et al., 2003) Earlywaves of the MMP surveys focused on communities in the high-migration areas of West-Central Mexico. This focusraises the concern that the MMP data may overrepresent households prone to migration. This concern is partiallyalleviated by the inclusion of new regions and communities in each successive year of the Project’s survey. Newsurvey locations are chosen to “build into the sample variation with respect to population size, geographic location,climate, economic base, social structure, and ethnic composition.” Massey et al. (2003).
3
tion variables for every year in their lives. The data allow one to track whether or not a household
head made a new trip in a given year, what documentation, if any, was used in making such a trip,
and the number of months spent in the U.S. each year. The survey also asks for a retrospective
life-history of the ownership of some assets, including businesses, which will be crucial for the pur-
poses of this study.
Our basic sample consists of all male household heads aged 15 years or older in the Mexican
Migrant Project LIFE file observed during the years 1987-2008. To avoid modeling the process by
which legal visas are allocated, we exclude individuals who are ever observed migrating legally to the
United States, unless they migrated legally under the auspices of the Bracero program from 1942-
1967.3 Since those with legal migration experience constitute less than 9% of the larger sample, we
feel that any selection bias introduced by this restriction is unlikely to be severe. However, ignoring
legal migration greatly simplifies our efforts to model the joint migration and entrepreneurship
decisions.
2.1 Identifying Entrepreneurship in the Data
The MMP questionnaire explicitly asks household heads when they acquired any businesses and
when they exited the businesses. The answers to these direct questions furnish our most basic
measurement of entrepreneurial activity. We define the variable BusinessDef1it to take the value
1 if individual i reports owning any business in year t based on this variable, and 0 otherwise.4
We refer to this as Definition 1 of business ownership in a given year. One concern in directly
using this variable is that it may capture very small businesses that do not represent a substantial
source of income for the individual. To get a feel for whether or not reported business ownership
corresponds to a full-time enterprise, we can examine the distribution of reported occupations dur-
ing the person-year of each business start observed in the data, which is summarized by Table3The only exceptions are individuals who entered the United States as temporary Bracero workers during the
period 1942-1967. These individuals4Although individuals do report owning multiple businesses, we will focus on explaining the extensive decision to
become an entrepreneur.
4
1. First, note that business owners report a large variety of occupations. The top two responses,
“Agricultural Workers,” and “Merchants, retail business owners,” account for 15% and 13% of the
sample, respectively. However, a large number of occupations each account for less than 2% of the
sample, and these occupations collectively represent about 40% of the observations.
Many of the top-ranking reported occupations appear to be consisted with entrepreneurial
activities. For example, the occupations “Merchants, retail business owners,” (13%), “Small and
Medium Service Establishment Owners,” (7%), and “Small and Medium Sized Factory Owners”
(3%) are represented among the most frequent responses. Also represented are several occupations
that do not necessarily imply the ownership of an establishment, but may require the acquisition
of certain pieces of capital equipment, such as “Truck Drivers” (3%), and “Ambulatory service
workers (e.g. food vendors),” (1.77%). Still, we may be concerned that some of these reported
occupations suggest that the individuals are engaged in substantial paid work that is not related to
a business. For example, Agricultural work accounts for about 14% of the person-year observations,
and this might come about if people consider farm ownership to be small business ownership. We
are reasonably satisfied that individuals are primarily engaged in entrepreneurial work during the
the vast majority of person-years with reported business ownership. However, we also introduce
a second, more restrictive definition of business ownership. Since the Mexican Migrant Project
data also ask for a retrospective occupational history, we can identify those years during which
an individual was engaged in an occupation that is highly likely to be entrepreneurial. Table 2
lists the occupations that we believe satisfy this criterion. Let the variable BusinessDef2it take
the value 1 if individual i reports being involved an an occupation that unambiguously suggests
business ownership or other entrepreneurial activities.
5

3 Preliminary Findings: Descriptives on Entrepreneurship and
Migration
We report some of the preliminary findings we have to motivate our theoretical model. These
findings indicate that investigating individual joint decisions of entrepreneurship and migration as
well as its implications on growth and poverty is a promising research agenda.
To characterize the prevalence of entrepreneurial activity in the sample, it is useful to look at
entrepreneurship rates at different points in the life-cycle. The top panel of Figure 1 reveals that
the fraction of individuals currently owning a Definition 1 business appears to grow steadily over
the course of the life-cycle. Whereas less than 10% of individuals own Def. 1 businesses in their
early twenties, between 20% and 25% of individuals report owning businesses in their late forties.
At any given age, the fraction of individuals who report ownership of Definition 2 businesses is
substantially lower than the fraction reporting ownership of Definition 1 businesses. However, own-
ership of Def. 2 businesses also steadily increases over the life-cycle, from well under 5% during the
early twenties, to just under 10% during the late 40s.
In contrast, the bottom panel of Figure 1 plots out the fraction of individuals at different ages
who have ever migrated. This reveals that the propensity to take a first migration is very high
during an individual’s late teens and early twenties. Indeed, the fraction of individuals who have
ever migrated increases from about 3% at age 16 to 13% at age 20, and appears to plateau near
20% at the age of 30. This suggests that individuals who migrate typically take their first migration
early on in life. However, individuals who choose to become entrepreneurs tend to wait longer, with
entry rates into entrepreneurship steadily increasing even after 30.
Since the plots in Figure 1 only look at current business ownership, they reveal nothing about
dynamics in entrepreneurial activity. For example, we might be interested in whether individuals
6
cycle in and out of entrepreneurship, and how likely they are to exit a business. To address the first
point, Table 3 presents the distribution of the number of entrepreneurial spells that an individual
undertakes, under Definition 1. The vast majority of entrepreneurs, over 96%, are only observed
engaging in one entrepreneurial spell. It appears to be quite rare for an individual to enter a busi-
ness, subsequently exit that business, and then later engage in another round of entrepreneurial
activity. Therefore, to simplify our theoretical analysis, we ignore the possibility of this kind of
cycling in entrepreneurial behavior, and exclude individuals engaging in multiple entrepreneurial
spells from our sample.
A second noteworthy feature of the data is that entrepreneurship and migration do not occur
simultaneously. Our assumption is that any businesses in the sample are owned and operated
in Mexico. However, it could be the case that individuals either own businesses in the United
States as migrants, or are able to maintain possession of their Mexican businesses and operate
them while abroad. However, these patterns of behavior are almost never seen in the data. Of the
32,606 person-years that we observe in which an individual owns a business (Def. 1), only 698,
or about 2% are observed during a year in which the individual spent some time in the United
States. Furthermore, if migration and business ownership both occur in the same year, this doesn’t
mean that they occur simultaneously, as these events could occur in different parts of the year. To
simply our analysis, we exclude a small number of people who report owning a business while they
are in the United States, and are also in the United States in both the preceding and following years.
3.1 The Relationship between Migration and Entrepreneurship
One of our primary interests is learning about what linkages exist between the decision to migrate
and the decision to become an entrepreneur. First, it is useful to see if having past experience as
a migrant is related to one’s current status as an entrepreneur. Figure 2 plots out the fraction of
individuals at each age who currently own a business for two groups: those who have ever migrated
7

by that age and are currently in Mexico, and those who have no migration experience by that age.
The plots reveal that, at almost every age, individuals who have never migrated are more likely to
currently own a business than return migrants. While non-migrants have a non-trivial advantage in
terms of entrepreneurship rates during the twenties, this gap seems to close, so that both migrants
and non-migrants have approximately the same rates of entrepreneurship in their early thirties.
However, non-migrants appear to be more likely to be entrepreneurs at older ages. At the very
least, this establishes that at any given age, past migration experience migration does not appear
to be unconditionally associated with higher rates of entrepreneurship. In fact there appears to be
a trade-off, with non-migrants being more likely to start a business.
Since the evidence in Figure 2 only informs us about unconditional correlations between mi-
gration and entrepreneurship at a given age, it is useful to investigate the correlations between
migration and entrepreneurship a bit more formally. Table 4 presents estimates of a linear proba-
bility model explaining the probability that an individual starts a business in a given person-year. In
these regressions, we include all person-years from our basic sample occurring before an individual
starts a business, along with the person-years in which an individual starts a business. Recall that
we have dropped the small number of individuals observed with multiple entrepreneurial spells, so
an individual can have at most one entry. We only include person-years during which an individual
reside entirely in Mexico. In all specifications, we include controls for age and it square, education,
as well as fixed effects controlling for the year and the individual’s home community in Mexico. In
Column 1 of Table 4, we include two regressors related to migration experience. First, we include
a dummy indicating if an individual has just returned from a migratory trip. For a year t, this
indicates if the individual was in the United States in year t− 1. We have also included a dummy
variable indicating if the individual has accumulated migration experience at any point in the past.
The results from Column 1 indicate that individuals with any past migration experience are about
0.4% more likely to start a business than a non-migrant in any given year, no matter when their
migration experience was accumulated. Furthermore, the coefficient on Return indicates that an
8

individual who has just returned from a migration is about 2.4% more likely to start a business
in that year relative to all other individuals. Both of these coefficients are significant at the 0.01
level. The economic significance of these estimates are perhaps most clearly seen by comparing
the entry probabilities of an individual who has never migrated and an individual who has just
returned from a migration. If both individuals are aged 30 years old with 6 years of education
and come from the same arbitrary community in Mexico, then in the year 2000, the non-migrant
would have a predicted probability of 0.0214 of entering a business. However, an individual who
just returned from a migratory spell would have a predicted probability of 0.0496, which is 132%
larger than the entry probability for the non-migrant. Furthermore, in future years, the estimates
suggest that having some migration experience increases an individual’s probability of starting a
business by about 19% in any later year relative to a non-migrant.
Columns 2 and 3 of Table 4 add additional regressors to the linear probability model, and the
results demonstrate that the correlation between migration and entrepreneurship depends on the
kind of migration experience that an individual accumulates. In Column 2, we interact the Return
dummy variable with a continuous measure of the duration of the individual’s migratory trip,
measured in months, as well as the square of this duration variable. The coefficient on the Duration
term is positive and significant at the 0.01 level, and the coefficient on the squared Duration term is
small and negative but significant. For the range of durations observed in the data, these estimates
suggest that individuals who return from longer migratory trips are more likely to start businesses
than those taking shorter trips. Indeed, the migratory duration matters critically. When these
duration interactions are added, the coefficient on the Return dummy becomes very close to zero.
For example, fixing the controls at the same levels discussed in the previous paragraph, this means
that while an individual returning from a 1 year migration will start a business with probability
0.0437, and individual returning from a 3 year migration will start a business with probability
0.0767, which is approximately 75% larger. Finally, Column 3 of Table 4 indicates that when we
also add in interactions between Return and the age variables, these interactions are also found to
9

be significant. Return migration appears to boost the probability of entering a business the most
for individuals in their early forties.
3.2 Discussion
The descriptive statistics suggest that at any age, return migrants are less likely to currently own
a business in Mexico than non-migrants. However, if we look at the probability of entering an
entrepreneurial activity, this is substantially higher for return migrants immediately after their
return, and remains higher in all subsequent years. Furthermore, longer migrations are associated
with higher probabilities of starting a business, and migration appears to be less strongly associated
with an increased start-up probability for very young and very old individuals.
A number of theoretical explanations could rationalize the patterns that we see in the data.
For example, it could be the case that these patterns are purely a consequence of heterogeneity in
the population and self-selection into migration and entrepreneurship. Individuals with high wages
and returns to entrepreneurship in Mexico may be less likely to migrate than those with worse
domestic opportunities. In this scenario, the positive correlation between return migration and
entrepreneurship might simply reflect the endogeneity of the return decision. That is, we might
observe higher business start-up rates among newly returned migrants because a positive shock to
the payoff of becoming an entrepreneur might have triggered a return. However, such a theory by
itself would seem to have a difficult time explaining why migratory duration seems to influence the
effect of return on a business startup. An alternate explanation is that, in the presence of credit
constraints, some individuals might use migration as a tool for more quickly accumulating the assets
needed to start their businesses in Mexico. Individuals are unable to self-finance entrepreneurial
projects in Mexico, so they migrate, accumulate assets, and return when they have saved enough
to cover the costs of entry. The positive relationship between duration and the probability that a
return migrant starts a business emerges in this scenario because individuals who choose to return
after short migratory spells are less likely to have accumulated the necessary start-up funds.
10
In the next section, we propose a model to nest both of these theoretical explanations. We aim
to accomplish several goals using this model for our paper. First, we will modify and complete the
modeling specifications such that it can be used for quantitative analysis. Second, we will apply
this model to our data and assess the relative importance of each of mechanisms linking migration
and entrepreneurship. Finally, using estimated model parameters, we plan to conduct systematic
counterfactual experiments which will shed light on how immigration and entrepreneurship policies
affect Mexican worker’s occupational choice, migration decision, and long-run wealth accumulation.
4 Model
Consider the following environment. An individual lives for T discrete periods, and each period
can either choose to locate in Mexico, m, or in the United States, us. Each period, the individual
chooses to work in one of three sectors. The individual can be a worker in Mexico, an entrepreneur
in Mexico, or a worker in the United States. The choice of sector implies a location choice, Lit,
where Lit = 0 indicates location in Mexico and Lit = 1 indicates location in the United States.
We assume that every individual is endowed with some entrepreneurial idea, which consists of
a productivity as an entrepreneur, uei , and a start-up cost, SCi. We assume that SCi is drawn
from a distribution that is independent of uei : SCi ∼ Gsc. An individual knows their own values of
uei and SCi, although the actual payoff each period to owning a business is stochastic. We assume
that an individual will only start one business in their lifetime. If they open a business and then
exit a business, they will not have the option of starting another business in the model. We also
assume that businesses can only be opened in Mexico, and that the individual exits the business
upon leaving Mexico. These are strong assumptions, but as demonstrated in the previous section,
we observe very few people that engage in more than one entrepreneurial spell, and we observe
very few person-years in which a person both resides in the United States and owns a business.
Let Eit be a variable that keeps track of an individual’s entrepreneurial status. Let Eit = 0 if an
11

individual has not yet opened a business, Eit = 1 if an individual is currently running a business,
and Eit = 2 if an individual has exited a business.
When an individual is in Mexico and chooses to be a worker, he or she inelastically supplies
labor each period and receives the following period labor income:
wm,lit = Xmit β
m,l + u`i + εm,lit (1)
Where Xmit is a vector of observable characteristics that may also include time-trend terms. The
variable u`i represents a permanent component to heterogeneity that is known to to the individual,
and εm,lit is wage shock that is i.i.d. across individuals and time periods. When an individual is in
the United States and chooses to be a worker, he or she inelastically supplies labor each period and
receives the following labor income:
wusit = Xusit β
US + γu`i + εusit (2)
Where Xusit contains the same variables as Xm
it except with different, U.S.-specific time trend terms.
We assume that, u`i , the permanent unobserved heterogeneity term from the Mexican labor income
equation, also appears in the U.S. labor income equation, but now multiplied by the parameter γ
which may capture the imperfect portability of human capital across countries. Note that εusit is
an income shock that is i.i.d. across individuals and periods.
When an individual chooses to be an entrepreneur, he or she receives the following period
income:
wm,eit = Xmit β
m,e + uei + εm,lit (3)
An individual’s productivity as an entrepreneur, uei enters as a permanent component of en-
trepreneurial income. We assume the pair of individual productivity components, u`i , uei is jointly
12
distributed in the population according to some bivariate distribution: u`i , uei ∼ Ge,l. As before,
εm,lit is an income shock that is distributed i.i.d. across individuals and periods.
Important that we are modeling entrepreneurship as a black-box income process. We assume
that an individual pays some start-up cost, SCi and this entitles him or access some income pro-
cess wm,eit . Thus, while individuals are not constantly making decisions about investment in their
business period after period, this is in some sense rolled into our more reduced form notion of
net income from entrepreneurial activities. The data are not sufficiently rich to allow us to track
business investment, and therefore empirically implement an model that incorporates these features.
We assume that asset market in Mexico is incomplete, so individuals can only save out of their
own retained earnings. They need to make their consumption and saving problems over their life
cycle. Every period, an individual receives draws of the following shocks, which constitute an in-
dividual’s information set at the start of time t: Ωit = εm,lit , εusit , ε
m,lit , ηit, ext. Here the ε shocks
are the shocks described above, ηit is a preference shock that indicates the relative desirability of
residing in the United States over Mexico, and ext is the real exchange rate in period t (pesos per
dollar). On the basis of these shocks, the individuals choose an activity, Sit ∈ `m, `us, em, where
`m and `us denote working in the Mexico and the US, respectively, and em denotes acting as an
entrepreneur. Simultaneously, the individual also makes a decision about the level of consumption,
cit, where consumption is measured in units of real pesos.
Let V mt (Ait, Eit,Ωit) denote the value to starting period t in Mexico with asset stock Ait, en-
trepreneurial status Eit, and shocks Ωit. Likewise define the value function V ust (Ait, Eit,Ωit) for
beginning period t in the United States conditional on the state variables. In order to define the in-
dividual’s activity choice problem and the values functions, V mt (Ait, Eit,Ωit) and V us
t (Ait, Eit,Ωit) ,
it is useful to define two sub-value functions that will be used in defining the larger value functions.
Specifically, let’s define νmt (Ait, Eit) and νust (Ait, Ei,t+1, ext) as the values associated with residing
13

in m or us, and choosing the optimal consumption choice in period t given that you entrepreneur-
ship status will be Ei,t+1 in the next period, and that you have net assets on hand of Ait. Net
assets here means gross assets, At, plus any income that that has been earned, and less migration
costs or business fixed costs that have been paid in that period.
When an individual is in Mexico, the consumption-savings problem can be summarized by the
sub-value function νmt and it’s solution:
νmt (Ait, Ei,t+1) = maxcit
u(cit) + βEΩt+1
[V mt+1(Ai,t+1, Ei,t+1,Ωt+1)
](4)
s.t. At+1 = R[Ait − cit
]cit ≤ Ait
Likewise, when an individual is in the United States, the consumption-savings problem can be
summarized by the sub-value function νust and it’s solution:
νust (Ait, Ei,t+1, ext) = maxcit
u(citppp
ext) + βEΩt+1
[V ust+1(Ai,t+1, Ei,t+1,Ωt+1)
](5)
s.t. At+1 = R[Ait − cit
]cit ≤ Ait
Now we are in a position to define the beginning of period value functions V mt (Ait, Eit,Ωit) and
V ust (Ait, Eit,Ωit). First, consider the case where Eit = 2, so the individual has exited the business.
In this scenario, the individual compares the options of either working in Mexico or working in the
United States, if migration is feasible. The value functions are given by:
14

V mt (Ait, Eit,Ωit) =
νmt (At + wm,`it , Ei,t+1 = 2) if extAt < λt
max[νmt (At + wm,`it , Ei,t+1 = 2),
ηit + νust (At + wus,`it − λit, Ei,t+1 = 2)]
if extAt ≥ λt
(6)
V ust (Ait, Eit,Ωit) = max[νmt (At + wm,`it , Ei,t+1 = 2),
ηit + νust (At + wus,`it , Ei,t+1 = 2)] (7)
Now, if the individual is currently running a business, which means that Eit = 1 and that he
or she must be in Mexico, then the value functions are given by:
V mt (Ait, Eit,Ωit) =
max[νmt (At + wm,`it , Ei,t+1 = 2),
νmt (At + wm,eit , Ei,t+1 = 1)] if extAt < λt
max[νmt (At + wm,`it , Ei,t+1 = 2),
νmt (At + wm,eit , Ei,t+1 = 1)]
ηit + νust (At + wus,`it − λit, Ei,t+1 = 2)]
if extAt ≥ λt
(8)
Now, if the individual has not yet started a business, which means that Eit = 0, then the value
functions are given by:
15
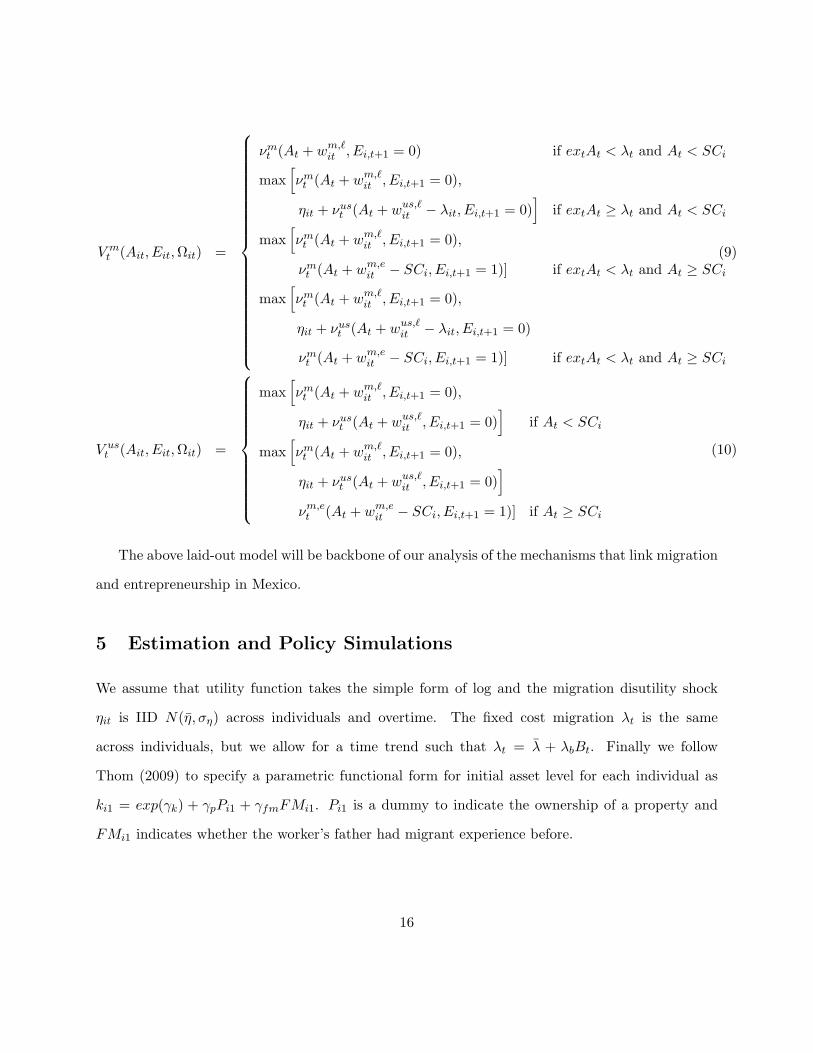
V mt (Ait, Eit,Ωit) =
νmt (At + wm,`it , Ei,t+1 = 0) if extAt < λt and At < SCi
max[νmt (At + wm,`it , Ei,t+1 = 0),
ηit + νust (At + wus,`it − λit, Ei,t+1 = 0)]
if extAt ≥ λt and At < SCi
max[νmt (At + wm,`it , Ei,t+1 = 0),
νmt (At + wm,eit − SCi, Ei,t+1 = 1)] if extAt < λt and At ≥ SCi
max[νmt (At + wm,`it , Ei,t+1 = 0),
ηit + νust (At + wus,`it − λit, Ei,t+1 = 0)
νmt (At + wm,eit − SCi, Ei,t+1 = 1)] if extAt < λt and At ≥ SCi
(9)
V ust (Ait, Eit,Ωit) =
max[νmt (At + wm,`it , Ei,t+1 = 0),
ηit + νust (At + wus,`it , Ei,t+1 = 0)]
if At < SCi
max[νmt (At + wm,`it , Ei,t+1 = 0),
ηit + νust (At + wus,`it , Ei,t+1 = 0)]
νm,et (At + wm,eit − SCi, Ei,t+1 = 1)] if At ≥ SCi
(10)
The above laid-out model will be backbone of our analysis of the mechanisms that link migration
and entrepreneurship in Mexico.
5 Estimation and Policy Simulations
We assume that utility function takes the simple form of log and the migration disutility shock
ηit is IID N(η, ση) across individuals and overtime. The fixed cost migration λt is the same
across individuals, but we allow for a time trend such that λt = λ + λbBt. Finally we follow
Thom (2009) to specify a parametric functional form for initial asset level for each individual as
ki1 = exp(γk) + γpPi1 + γfmFMi1. Pi1 is a dummy to indicate the ownership of a property and
FMi1 indicates whether the worker’s father had migrant experience before.
16

There are persistent unobserved heterogeneity across individuals in terms of their worker and
entrepreneur abilities uli and uei . In addition, their business start-up cost is also different sci. We
utilize a finite mixture model to assume that individuals can be summarized by a finite number
J types. For each j = 1, 2, ..., J , the individual of type j is endowed with a tuple (ulj , uej , scj).
Denote the probability of an individual i being type j as pji , we will further parameterize pji as a
CDF function Φ of individual observable Xi. We will need to estimate Φ and (ulj , uej , scj)j=1,..,J
jointly.
We also allow contemporaneous income shocks to workers in both US and Mexico and en-
trepreneurs in Mexico. We assume these shocks εmlit , εulit , ε
meit . We assume each of these shocks
is IID normally distributed with mean zero. The standard deviations of these distributions are
σml, σul, σme respectively. Finally, we allow worker ability uli to affect wages in Mexico and US in
different ways by multiplying it with γuw in US wage equation.
To summarize, we need to estimate the following parameters: (1) contemporaneous income and
utility shocks η, ση, σml, σul, σme, (2) migration fixed cost λ, λb and US wage-ability shifter γuw,
(3)J tuples u = (ulj , uej , scj)j=1,..,J , (4) initial capital condition γk, γp, γfm, and (5) CDF Φ, which
determines probability of an individual i being type j. Denote these model parameters by blocks
θ = (θ1, ...θ4) ∈ Θ and Φ.
For given set of parameters in (1) (2) (3), we can solve the optimal life-cycle migration and
entrepreneurship decisions of each type j individuals using our theoretical model. These policy
functions can then be used to simulate path of migration and entrepreneurship activities, condi-
tional on our sample individual’s observable Di = (Xi, Pi1, FMi1). Any model conditional moments
E[m(θ,Φ)|Di] = E[∑
j pj(Di)m(θ; j)|Di] can be approximated can a mixture of simulated moments
1S
∑s
∑j Φj(Xi)ms(θ; j, Pi1, FMi1). Since pji is not simulation specific, we can write the simulated
moment of individual i as a weighted sum:∑
j Φj(Xi) 1S
∑sm
s(θ; j, Pi1, FMi1).
17
Define sample vectorized moments of individual i as mi, then denote the difference between
sample moments and model moments as:
g(Di,mi; θ,Φ) = mi −
∑j
Φj(Xi)1S
∑s
ms(θ; j, Pi1, FMi1)
Finally, using the sample analog of E[g(Di,mi; θ,Φ)|Xi] = 0, we can define the objective function
as:
g(θ,Φ,D,W) =1N
∑i
[mi ⊗Xi −∑j
Φj(Xi)1S
∑s
ms(θ; j, Pi1, FMi1)⊗Xi]
W1N
∑i
[mi ⊗Xi −∑j
Φj(Xi)1S
∑s
ms(θ; j, Pi1, FMi1)⊗Xi]′
Using the estimated parameters, we plan to conduct several policy simulations. They include
(1). How does immigration reform in U.S. affect Mexican entrepreneurship and poverty. (2). How
does increased border control of U.S. affect Mexican migration and entrepreneurship. (3). How
does a subsidy program for business startups in Mexico affect Mexican worker’s migration and
entrepreneurship decisions.
18

References
Banerjee, Abhijit and Andrew F. Newman, “Occupational Choice and the Process of Devel-opment,” The Journal of Political Economy, 1993, 101, 274–298.
Dustmann, Christian and Oliver Kirchkamp, “The optimal migration duration and activitychoice after re-migration,” Journal of Development Economics, 2002, 67, 351372.
Hanson, Gordon H., “Illegal Migration from Mexico to the United States,” Journal of EconomicLiterature, 2006, 44 (4), 869 – 924.
Massey, Douglas S., Jorge Durand, and Nolan J. Malone, Beyond Smoke and Mirrors:Mexican Immigration in an Era of Economic Integration, Russell Sage Foundation Publications,2003.
Massey, Douglas.S. and A. Parrado Emilio, “International migration and business formationin Mexico,” Social Science Quaterly, 1998, pp. 1–34.
Mesnard, Alice, “Temporary migration and capital market imperfections,” Oxford EconomicPapers, 2004, 56, 242–262.
Murphy, Kevin, Andrei Schleifer, and Robert Vishny, “The Allocation of Talent: Implica-tion for Growth,” Quarterly Journal of Economics, 1991, pp. 503–530.
Schmitz, James A., “Imitation, Entrepreneurship, and Long-run Growth,” The Journal of Po-litical Economy, 1989, 97, 721–739.
Woodruff, Christopher and Rene Zenteno, “Migration networks and microenterprises inMexico,” The Journal of Development Economics, 2007, 82, 509–528.
19

Table 1: Distribution of Reported Occupations when Owning a Business
Reported Occupation Percentage of SampleAgricultural Workers 14.87Merchants, retail business owners 12.57Small and Med. Service Estab. Owners 7.41Sales Agents or Representatives 6.02Metal Production and treatment workers 4.73Truck Drivers, land-transports drivers 3.25Other craftsmen or manufacturing workers 3.20Workers in retail establishments 2.53Small and Medium Sized Factory Owners 2.44Other unskilled workers 2.44Construction, installation, maintenance 1.82Ambulatory service workers (e.g. food vendors) 1.82Other 36.90The full sample consists of 24,587 person-year observations of malehousehold heads born during or after 1950 who are aged 15 years orolder.
Table 2: Entrepreneurial Occupations
President, director, senior manager, large factory ownerSmall and Med. sized factory ownerSmall and Med. Service Estab. OwnersOther administrators such as entrepreneursMerchants, retail business owners
20

Figure 1: Entrepreneurship Rates and Migration Experience by Age
15 20 25 30 35 40 45 500
0.05
0.1
0.15
0.2
0.25
Age
Fra
ctio
n O
wni
ng a
Bus
ines
s
Business Ownership (Def. 1)Business Ownership (Def. 2)Business Ownership (Def. 3)
15 20 25 30 35 40 45 500
0.05
0.1
0.15
0.2
0.25
Age
Fra
ctio
n W
ho H
ave
Eve
r M
igra
ted
Notes
21

Table 3: Frequency of Entrepreneurial Spells
Number of Spells Frequency Fraction of Entrepreneurs1 4,581 0.962 169 0.043 13 <0.014 1 <0.01
22
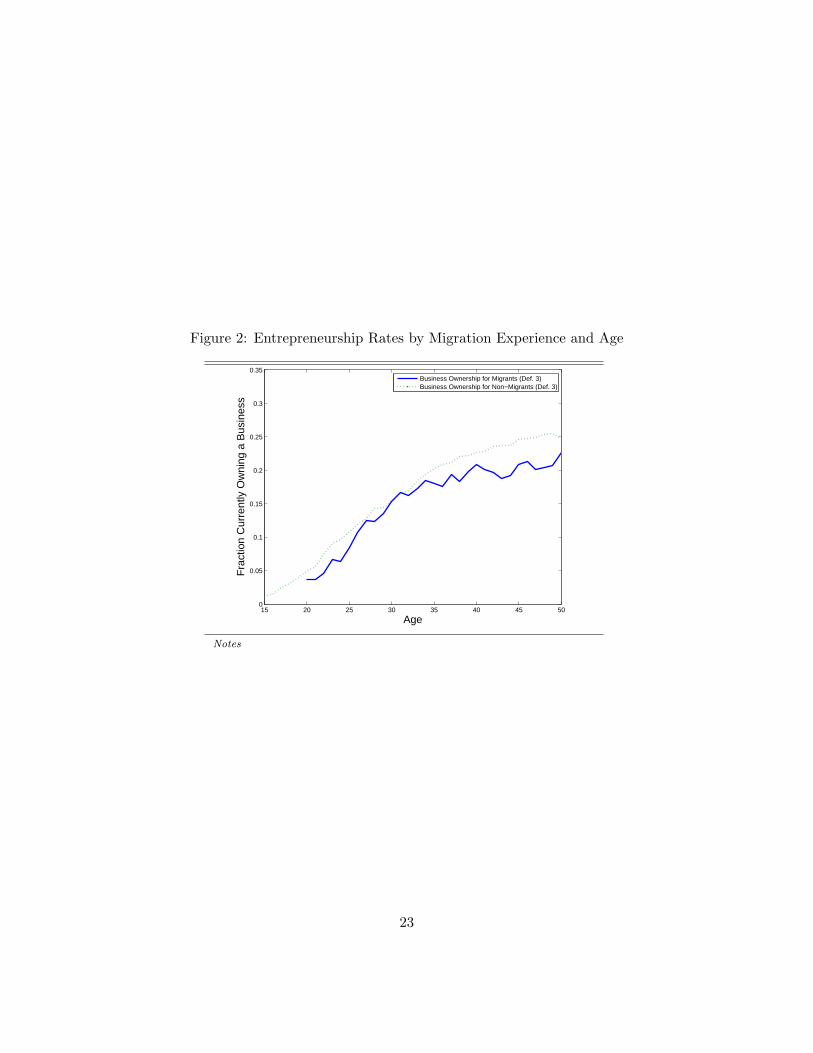
Figure 2: Entrepreneurship Rates by Migration Experience and Age
15 20 25 30 35 40 45 500
0.05
0.1
0.15
0.2
0.25
0.3
0.35
Age
Fra
ctio
n C
urre
ntly
Ow
ning
a B
usin
ess
Business Ownership for Migrants (Def. 3)Business Ownership for Non−Migrants (Def. 3)
Notes
23

Table 4: Linear Probability Estimates of Probability of Starting Business while in Mexico
(1) (2) (3)Age 0.001*** 0.001*** 0.001***
(0.000) (0.000) (0.000)Age2/100 -0.001*** -0.001*** -0.001***
(0.000) (0.000) (0.000)Educ. (Y ear) 0.001*** 0.001*** 0.001***
(0.000) (0.000) (0.000)Return 0.024*** 0.004 -0.074***
(0.003) (0.004) (0.024)Return X Duration 0.001*** 0.001***
(0.000) (0.000)Return X Duration2 / 100 -0.000* -0.000
(0.000) (0.000)Return X Age 0.004***
(0.001)Return X Age2 / 100 -0.006***
(0.002)Any US Experience 0.004*** 0.004*** 0.004***
(0.001) (0.001) (0.001)Community F ixed Effects Yes Yes YesY ear F ixed Effects Yes Yes YesN 132,960 132,960 132,960R2 0.009 0.010 0.010
24