exposure pathways to high-consequence pathogens in the
TRANSCRIPT

EPA/600/R-18/221 | July 2018 www.epa.gov/homeland-security-research
Exposure Pathways to High-Consequence Pathogens in the Wastewater Collection and Treatment Systems
Office of Research and Development Homeland Security Research Program

EPA/600/R-18/221
July 2018
Exposure Pathways to High-Consequence Pathogens in the Wastewater Collection
and Treatment Systems
by
Sandip Chattopadhyay, Ph.D. Sarah Taft, Ph.D.
Threat and Consequence Assessment Division National Homeland Security Research Center
Cincinnati, OH 45268
Contract No. EP-C-14-001 to ICF under Work Assignment 40
U.S. Environmental Protection Agency Project Officer Office of Research and Development Homeland Security Research Program
Cincinnati, OH 45268

ii
Disclaimer The U.S. Environmental Protection Agency (EPA) through its Office of Research and Development funded and managed the research described here under Contract No. EP-C-14-001 to ICF under Work Assignment 40. It has been subjected to the Agency’s review and has been approved for publication. Note that approval does not signify that the contents necessarily reflect the views of the Agency. Any mention of trade names, products, or services does not imply an endorsement by the U.S. Government or EPA. The EPA does not endorse any commercial products, services, or enterprises. Questions concerning this document or its application should be addressed to: Sandip Chattopadhyay, Ph.D., M.B.A. National Homeland Security Research Center Office of Research and Development U.S. Environmental Protection Agency 26 W. Martin Luther King Drive, MS NG16 Cincinnati, OH 45268 Phone: 513-569-7549 Fax: 513-487-2555 E-mail: [email protected]

iii
Table of Contents
Table of Contents ........................................................................................................................... iii Acronyms ...................................................................................................................................... vii Executive Summary ....................................................................................................................... ix 1 Introduction ............................................................................................................................. 1 2 Problem Formulation ............................................................................................................... 3 3 Potential Disease Transmission During Wastewater Collection and Treatment ..................... 5 4 Fate and Transport of Pathogens During Wastewater Collection and Treatment ................... 8
4.1 Collection ......................................................................................................................... 8 4.2 Pathogens in Wastewater During Transport and Treatment .......................................... 12 4.3 Formation of Bioaerosols ............................................................................................... 16
4.3.1 Background ...................................................................................................... 16 4.3.2 Bioaerosol Generation During the Toilet Flush .............................................. 20 4.3.3 Bioaerosol Generation During Wastewater Treatment ................................... 26
5 Challenges to Performance of Quantitative Microbial Exposure Assessment ...................... 34 6 Overview of Screening Process ............................................................................................. 36
6.1 Conceptual Exposure Model for Exposure in the Wastewater System .......................... 36 6.2 Elements of Screening Process ...................................................................................... 39
6.2.1 Pathogen Disease Transmission Characteristics .............................................. 42 6.2.2 Pathogen Potential to Persist in Wastewater or Deposited Droplet ................. 43 6.2.3 Pathogen Potential to Form Viable Bioaerosols .............................................. 43 6.2.4 Bridging Pathogen-specific Data Gaps for Fate and Transport ....................... 44
6.3 Selection of Emerging Pathogens for Two Case Study Evaluations ............................. 49 7 Case Study: Ebola Virus ........................................................................................................ 50
7.1 Does Pathogen Exhibit Identified Disease Transmission Characteristics? .................... 50 7.1.1 Pathogen Shedding in Feces, Urine, or Vomit ................................................ 50 7.1.2 Disease Transmission and Associated Exposure Doses by Route of
Exposure ......................................................................................................... 52 7.1.3 Is Ebola Virus a High-Consequence Pathogen? .............................................. 53
7.2 Does the Pathogen Persist in Wastewater or Deposited Droplet? .................................. 53 7.2.1 Wastewater Persistence ................................................................................... 53 7.2.2 Deposited Droplet Persistence ......................................................................... 59
7.3 Does Pathogen Form Viable Bioaerosols from a Toilet Flush or the Wastewater Treatment Process? ........................................................................................................ 59
7.4 Conclusion: Could Ebola Virus Form Viable Exposure Pathways in the Wastewater System? ...................................................................................................... 61
8 Case Study: Bacillus anthracis Spores .................................................................................. 63 8.1 Does Pathogen Exhibit Identified Disease Transmission Characteristics? .................... 63
8.1.1 Direct Entry via Decontamination Wastewater ............................................... 63 8.1.2 Disease Transmission and Associated Exposure Doses by Route of
Exposure ......................................................................................................... 63 8.1.3 Is the Spore Form of Bacillus anthracis a High-Consequence
Pathogen? ........................................................................................................ 64 8.1 Does the Pathogen Persist in Wastewater or a Deposited Droplet? ............................... 66
8.1.1 Wastewater Persistence ................................................................................... 66

iv
8.1.2 Deposited Droplet Persistence ......................................................................... 66 8.2 Does Pathogen Form Viable Bioaerosols from the Wastewater Treatment
Process? ......................................................................................................................... 67 8.3 Conclusion: Could the Spore Form of Bacillus anthracis Form Viable Exposure
Pathways in the Wastewater System? ............................................................................ 67 9 Data Gaps and Suggested Research to Further Refine Screening Process ............................ 69 10 Glossary ................................................................................................................................. 71 11 References ............................................................................................................................. 73

v
List of Tables
Table 4-1. Characteristics with Potential to Lead to a Higher or Lower Dilution Factor ............. 14 Table 4-2. Available Data for Bioaerosol Concentration of Microorganisms from Toilet Flush. 23 Table 4-3. Range of Reported Bacterial Bioaerosol Concentrations from Identified Wastewater
Treatment Processes and Maintenance Activities ................................................................... 32 Table 4-4. Range of Reported Viral Bioaerosol Concentrations from Identified Wastewater
Treatment Processes................................................................................................................ 33 Table 4-5. Estimated Bioaerosol Concentration Range for Bacterial or Viral Wastewater
Pathogens with Inhaled Doses for 10 Minutes, 60 Minutes, and 8 Hours .............................. 34 Table 6-1. Assumptions Incorporated in Screening Process ........................................................ 41 Table 6-2. Terminology, Definitions, and Examples for Process to Bridge Data Gaps ............... 46 Table 7-1. Summary of Ebola Disease Transmission Characteristics .......................................... 54 Table 7-2. Potential Surrogates and Benchmark Indicators for Persistence of Ebola Virus in
Wastewater .............................................................................................................................. 55 Table 8-1. Summary of Bacillus anthracis Disease Transmission Characteristics ...................... 65

vi
List of Figures
Figure 4-1. Overview of exposure assessment pathways for wastewater collection and treatment.................................................................................................................................................. 10
Figure 4-2. Toilet flush showing aerosol and particle deposition. ................................................ 21
Figure 6-1. Conceptual exposure model for pathogen exposure during wastewater collection and treatment. ................................................................................................................................ 37
Figure 6-2. Flow chart for screening process for a high-consequence pathogen (HCP). ............. 40
Figure 7-1. Published data describing time for a 2-log reduction of Ebola virus in wastewater and water. ....................................................................................................................................... 56
Figure 7-2. Summary of Ebola virus exposure pathways and screening process outputs. ........... 62
Figure 8-1. Summary of Bacillus anthracis spore exposure pathways and screening process outputs. .................................................................................................................................... 68

vii
Acronyms
cfu colony-forming unit(s)
EBOV Ebola virus(es)
ELISA enzyme linked immunosorbent assay
EPA U.S. Environmental Protection Agency
EVD Ebola virus disease
HCP high-consequence pathogen(s)
HIV human immunodeficiency virus
MHV murine hepatitis virus
MPN most probable number
NACWA National Association of Clean Water Agencies
NHP nonhuman primate(s)
PCR polymerase chain reaction
pfu plaque-forming unit(s)
qPCR quantitative polymerase chain reaction
RNA ribonucleic acid
rRT-PCR real-time reverse-transcription polymerase chain reaction
RT-PCR reverse-transcription polymerase chain reaction
SARS severe acute respiratory syndrome
SSO sanitary sewer overflow
TCID50 50% tissue culture infective dose
UV–APS ultraviolet-aerodynamic particle sizer
VEP viable exposure pathway(s)
WWTP wastewater treatment plant(s)

viii
Acknowledgements
The following individuals and organizations have been acknowledged for their contributions towards the development and/or review of this document. United States Environmental Protection Agency (EPA), Office of Research and Development (ORD), National Homeland Security Research Center (NHSRC)
Sandip Chattopadhyay, Ph.D., M.B.A. (Principal Investigator) Sarah Taft, Ph.D. Eric Rhodes, Ph.D.
EPA Office of Research and Development, National Exposure Research Laboratory Shannon M. Griffin EPA Office of Research and Development, Office of Wastewater Management Robert K. Bastian, M.S.
Phil Zahreddine, M.S. Env. Eng.
Occupational Safety & Health Administration (OSHA), Office of Emergency Management and Preparedness
Chris Brown Marti Sinclair (CSRA) is acknowledged for technical editing; and quality assurance reviewer Eletha Brady-Roberts (ORD, NHSRC) is acknowledged for contributions to this report.

ix
Executive Summary
The recent development of disease outbreaks in the United States and throughout the world has heightened concerns regarding the potential for exposure to emerging pathogens during wastewater collection and treatment. Emerging pathogens may enter wastewater systems from pathogen shedding in human waste, introduction of decontamination wastewater, illicit activity, or surface water runoff following a wide-area biological incident. Emerging pathogens may exhibit fate and transport characteristics that provide for atypical transmission pathways or higher exposure concentrations than natural transmission sources (e.g., human-to-human transmission, fomite contamination from infected individuals). Given the significant health threat posed by some emerging pathogens (e.g., Ebola virus [EBOV], severe acute respiratory syndrome [SARS]), exposure to emerging pathogens in a wastewater system could result in potentially serious health outcomes. As a result, there is a need to evaluate potential exposure and disease transmission from wastewater systems.
There are significant data gaps in understanding emerging pathogens that may limit or preclude the performance of a quantitative exposure assessment. Research on fate and transport of pathogens that enter the wastewater system focuses on bacteria and enteric viruses, though quantitative data describing persistence and fate for estimation of bioaerosol generation and concentration are scarce. As a result, the estimation of bioaerosol concentration generated by an individual wastewater collection or treatment process exhibits very high uncertainty for bacterial and enteric viruses. Published data that quantitatively describe the fate and transport behavior (e.g., persistence, formation of viable aerosols) of enveloped viruses or bacterial spores in a wastewater system are also scarce. Collectively, these data gaps significantly limit the current capability to perform a quantitative exposure assessment for emerging pathogens in the wastewater system.
This report describes a conceptual exposure model based upon a review of the relevant literature for fate and transport elements for pathogens when present in wastewater systems. A screening process is then presented that evaluates emerging pathogens for the presence of two characteristics: (1) the potential to exhibit high-consequence disease transmission characteristics in wastewater systems, and (2) the potential to exhibit viable exposure pathways (VEP)1 for human receptors who have contact with wastewater systems. The screening process is developed for use with pathogens with varying levels of available data. However, the screening process is designed to be usable with pathogens with limited data, and for the screening process to incorporate quantitative data when it is available. Furthermore, this report assists users on the selection and use of data on surrogate microorganisms in decision-making for elements of the screening process. Lastly, case studies for the EBOV and the spore form of Bacillus anthracis are then presented to illustrate use of the screening process to evaluate pathogens and the presence of VEP.
The EBOV is determined to be a high-consequence pathogen (HCP) with potentially severe or lethal disease transmission from all routes of exposure identified in the conceptual exposure model: inhalation, incidental ingestion, dermal contact, and ocular (including conjunctival) or 1 A VEP is a complete exposure pathway for a microorganism that includes routes of exposure along with documented disease transmission potential.

x
oral mucous membrane contact (Koonin et al., 2015; Fischer and Wohl, 2016; NASEMSO, 2018; Public Health England, 2018). There is high uncertainty in the determination that viable infectious pathogens are shed in the feces. However, there is the potential for exposure from the toilet flush from released bioaerosols or the splash of the toilet contents. One study was identified for the toilet flush that utilized the enveloped Phi6 bacteriophage, but reported no detection of bioaerosol over a 20-minute period (Lin and Marr, 2017). There is increasing evidence that enveloped viruses can survive in wastewater, primarily supported by the recent Ye et al. (2016) study documenting persistence exceeding one day for enveloped viruses in raw wastewater. Given the rapid transit time between wastewater collection and arrival at the wastewater treatment plant (WWTP), the hypothesized persistence of EBOV could allow for potential exposure to individuals prior to WWTP entry (e.g., combined sewer overflow, sanitary sewer overflow [SSO]), or during wastewater treatment. Data reviewed in the report indicate that under certain conditions, EBOV in wastewater deposited on surfaces (before or after drying) could persist. Additionally, the EBOV has been shown to form viable bioaerosols when aerosolized from a nebulizer in a protective fluid medium, such as tissue culture fluid. However, there are no bioaerosol data for enveloped viruses that originate from WWTP processes. The model predicted that EBOV has the potential to exhibit the defining characteristics of an HCP and to result in VEP for all exposure pathways identified in the wastewater system.
The spore form of B. anthracis is also determined to exhibit HCP characteristics in a wastewater system. Disease transmission is documented to occur for all routes of exposure identified in the conceptual exposure model: inhalation, incidental ingestion, dermal contact, and ocular or oral mucous membrane contact. There is low uncertainty in the identified routes of exposure associated with disease transmission. The case study presented in the report evaluated the introduction of B. anthracis spore-containing wastewater as part of the management process for wastewater generated from decontamination activities. Therefore, an assessment of the potential for shedding of viable B. anthracis spores by individuals infected with anthrax was not performed. With the exception of the toilet flush, all potentially complete exposure pathways identified in the conceptual exposure model for wastewater systems are VEP for B. anthracis spores. Thus, the spore form of B. anthracis is found to exhibit behavior of an HCP and result in a VEP in the wastewater system for all pathways evaluated.
The primary benefit of the screening process is a systematic approach to evaluate disease transmission and potential exposure to pathogens in the wastewater system. The successful case study evaluations for EBOV and the form of B. anthracis demonstrate the overall proof of concept for pathogens with a range of disease transmission characteristics, differences in fate and transport characteristics, and variability in the amount of available data for the assessment. The screening process was also demonstrated to be resource-efficient for those pathogens for which sufficient data were available to easily determine either disease transmission and/or fate and transport determinations.
The review of available literature and development of the screening process highlighted data gaps that could be bridged with further research to increase the reliability of the screening process evaluations. Five key areas were identified for further research:

xi
• Development of analytical techniques for counting enveloped viruses in the wastewater medium and bioaerosol form with known levels of recovery, which would support quantitative microbial exposure assessment,
• Development of data sets to better understand the driving mechanisms and quantitative relationship between culture-based and molecular-based approaches for biological groups in matrices of interest (e.g., human feces, wastewater, and bioaerosols) with the goal of ultimate development of viability corrected measures,
• Development of data sets that describe the type and magnitude of exposure relative to the range of potential technologies used in each treatment unit processes (e.g., primary, secondary, sludge management),
• Evaluation of aggregate exposure of individual WWTP workers based on contact with multiple unit processes during typically defined job descriptions, and
• Performance of studies for persistence and other measures in environmental conditions (e.g., high relative humidity, winter temperature conditions) typical for WWTP in indoor and outdoor settings for a variety of regions and weather conditions to generate data suitable for assessment across the United States.

1
1 Introduction
Interest in the potential for disease transmission during wastewater management has been heightened over the past decade by the potential for emerging pathogens to pose novel hazards when introduced into wastewater management systems. Concern regarding the potential for human exposure to pathogens during wastewater management has been heightened by recent disease events. Some recent disease events have included emerging pathogens (e.g., Ebola virus [EBOV], pandemic influenza), about which less information on disease transmission is available. Recent disease events include the care of Ebola virus disease (EVD) patients by United States (U.S.) hospitals during the recent African epidemic (Bibby et al., 2015a), pandemic preparedness activities after appearance of the H5N1 influenza virus in Asia (World Health Organization, 2007), and the severe acute respiratory syndrome (SARS) outbreak in 2002 (Yu et al., 2014). As noted by Wigginton et al. (2015), “Should a major virus pandemic occur, wastewater and drinking water treatment industries would be under increased scrutiny for serving as a potential means of transmission.” So, these recent disease events have exposed the need for better information on the potential for disease transmission to occur through environmental exposure routes, including the wastewater exposure pathway.
There are a number of ways that pathogens can enter the wastewater management system. For pathogens that remain viable when shed in bodily fluids, human disease outbreaks can introduce emerging pathogens into wastewater systems via the collection of wastewater from residential toilets. Emerging pathogens could also enter wastewater treatment systems from illicit activity or through capture of surface-water runoff following a wide-area biological incident. Decontamination wastewater is another way pathogens can make it into the wastewater management system. Decontamination wastewater is defined as wastewater generated during decontamination activities, such as remediation of building interiors after release of biological materials (e.g., anthrax spores). For this report, decontamination wastewater does not include infectious materials generated from medical treatment in or outside a medical treatment facility. In the aftermath of the release of biological materials, the decontamination wastewater could be released to the wastewater treatment system and enter the WWTP (wastewater treatment plant). Decontamination wastewater and surface water runoff carrying pathogens could enter the wastewater collection system through sanitary or combined sewer-sanitary systems (NACWA, 2005). Decontamination wastewater is assumed to be pre-treated prior to discharge to the collection system or prior to direct addition at the WWTP. However, there is uncertainty in the actual loadings of residual pathogens as well as concern for potential exposure to WWTP workers or others who may contact pathogens in the wastewater system.
Emerging pathogens can exhibit fate and transport characteristics in the wastewater system that provide for novel exposure pathways relative to pathways associated with natural disease transmission. Bioaerosol generation during the wastewater treatment process provide for atypical transmission pathways or generate higher exposure concentrations than those produced by infected individuals in natural transmission environments. As a result, pathogens that are not typically transmitted from human-to-human via inhalation exposure in a natural environment could be transmitted via inhalation exposure in the built environment (Roy and Milton, 2004).
In the Woolhouse and Gaunt (2007) systematic literature review of emerging human pathogens reported between 1980 to 2005, approximately 66% of emerging pathogens were viruses and

2
91% of these viruses were enveloped. Fungal species represented the next highest percentage of emerging pathogens at 15% (Woolhouse and Gaunt, 2007). To date, the study of viral pathogens in wastewater systems has focused on nonenveloped enteric viruses because they have been generally considered to exhibit significantly better survival in the aqueous environment than enveloped viruses (Wigginton et al., 2015). The high representation of viruses for recently identified emerging pathogens, coupled with the observation that viruses may be less effectively removed by wastewater treatment processes than bacteria (Dias et al., 2015), could indicate an increased potential of exposure or higher exposure levels throughout the wastewater treatment process. Few studies have addressed the persistence of viable fungal or bacterial spores in the wastewater environment. As a result, there are significant uncertainties associated with infectivity, persistence, and the ultimate fate of enveloped and nonenveloped viruses (Wigginton et al., 2015), of the spore form of bacteria, and of other groups of nonbacterial microorganisms (e.g., fungal microsporidia) that are likely to include emerging pathogens.
Data needed to predict the presence, persistence, and fate of emerging pathogens when a human disease outbreak introduce such pathogens into a typical wastewater management system are scarce. Data need to meet challenges presented by the introduction of emerging pathogens into the wastewater management system from collection of decontamination wastewater are similarly scarce. Studies performed to evaluate the hazard posed by wastewater pathogens have often relied on epidemiological tools or serological analyses to conduct their assessments (e.g., Khuder et al. [1998]). Alternatively, however, bacterial pathogens and nonenveloped viruses in wastewater are generally amenable to environmental recovery and laboratory analysis using available techniques, and exposure data can readily be developed. On the other hand, however, the overrepresentation of enveloped viruses in the list of likely emerging pathogens challenges the assumption that data can easily be generated to estimate exposure. Current culture-based analytical capabilities exhibit limitations for the enumeration of viable (i.e., infective) enveloped viruses in wastewater, with difficulties associated with cell culture techniques and virus extraction methods identified as potential causes (Wigginton et al., 2015). This raises questions whether available analytical capabilities can be rapidly deployed to quantitatively evaluate exposure, especially when these pathogens are aerosolized or present in complex media (e.g., feces, wastewater).
An additional impediment to gathering analytical data for many emerging pathogens is stringent requirements that limit the laboratories and personnel that can perform studies relative to typical wastewater pathogens (Wigginton et al., 2015). For example, work with live EBOV for culture-based analysis requires the highest laboratory biosafety level and is generally restricted to specialized research laboratories or governmental agencies with high performance costs (Broadhurst et al., 2016). In contrast, more common wastewater pathogens from bacterial or nonenveloped virus groups can be analyzed in many laboratories at reasonable cost without highly specialized facilities or protective equipment. The lack of quantitative data and appropriate models for emerging pathogens significantly limit technical capabilities to perform an exposure assessment for the wastewater system. The difficulty in obtaining new data for many emerging pathogens drives the current need to assess potential wastewater system exposure using qualitative approaches that leverage available quantitative data.
In this report, we examine the potential for a viable exposure pathway (VEP), i.e., a complete exposure pathway for a microorganism that includes routes of exposure with documented disease

3
transmission potential. An exposure pathway has five parts: a source of contamination, an environmental media and transport mechanism, a point of exposure, a route of exposure, and a receptor population (USEPA 2012). “When all five parts are present, the exposure pathway is characterized as “complete”, that is, capable of contributing to human health risks” (USEPA 2012). For a VEP, in the case of a microbial contaminant, the contaminant must not only be capable of reaching the receptor, it must also retain its infectivity upon reaching the receptor.
This report presents a screening process to evaluate emerging pathogens for the presence of two traits: (1) the potential to exhibit high-consequence disease transmission characteristics in the wastewater system, and (2) the potential to exhibit viable exposure pathways (VEP) for human receptors who may have contact with the wastewater system. Receptors include individuals who use and then flush the toilet, and WWTP workers or others who may contact wastewater during collection or treatment processes. Case studies for the EBOV and spore form of Bacillus anthracis are then presented to illustrate use of the screening process to evaluate pathogens for high-consequence pathogen (HCP) disease transmission characteristics and the presence of VEP. A Glossary (Section 10) is also included to define exposure assessment and disease transmission terms used in the report.
2 Problem Formulation
A screening process is presented to evaluate potentially complete exposure pathways resulting from the introduction of emerging pathogens into a wastewater system. In the development of the screening process, no primary data are gathered and the project relies on secondary data for the analysis. Given the limited availability of data, the screening process outputs likely exhibit high levels of uncertainty. The wastewater system in this study includes (1) the toilet as the collection point for human bodily waste or some other introduction point for pathogen-containing wastewater from other sources (e.g., decontamination wastewater), (2) the collection system that transports wastewater from households to the WWTP, (3) wastewater treatment processes, and (4) locations where maintenance activities are performed. The purposes of the screening process are: (1) to identify distinguishing characteristics of an HCP in the context of wastewater collection and treatment processes, and (2) to evaluate the presence of a VEP for identified HCP in a wastewater system. The literature on emerging pathogens typically exhibits significant data gaps that may limit or preclude quantitative exposure assessment. Accordingly, the screening process is qualitative, but quantitative data are incorporated when available. The output is a determination of the presence of a VEP for an identified HCP when present in the wastewater system. The risk of disease transmission or severity of illness is not determined.
The screening process evaluates exposure pathways for emerging pathogens that are introduced to wastewater from bodily fluids (i.e., defined as feces, urine, vomit) shed by infected individuals or from other means of entry into the system. Other means of direct entry to the system can include management of decontamination wastewater, illicit activity, and surface runoff after a wide-area biological incident. Decontamination wastewater is assumed to have undergone agent-specific pre-treatment (e.g., bleach addition to wastewater containing B. anthracis spores), but wastewater added to the system may have residual low levels of biological contamination. However, pathogens that enter the wastewater system via the toilet will not be assumed to have had any pretreatment (e.g., chemical introduction, increased retention time), nor will pathogens

4
that enter the system through entry into sewer system from nonpoint surface runoff or infiltration of lines.
Exposure pathways are identified for three human receptors: (1) individuals that shed viable pathogens into the toilet and are then exposed to these pathogens during the flush of the toilet, (2) individuals that contact wastewater containing viable pathogens during the collection and treatment process, and (3) individuals that contact untreated wastewater containing pathogens during a spill or release of wastewater from the collection system. For toilet usage, the exposure assessment begins with the determination of potential receptor exposure pathways resulting from the flush of the toilet. However, receptor exposure from the introduction of decontamination wastewater or other means of entry to the wastewater system are not assessed. Exposure to pathogens from decontamination wastewater is evaluated only after the pathogens enter the wastewater system during maintenance or treatment. Once in the wastewater system, exposure is evaluated relative to potential contact with wastewater during a spill or release of wastewater from the collection system (e.g., sanitary sewer overflow [SSO], combined sewer overflow, or sewer main break), treatment in WWTP processes, and general maintenance activities (e.g., spray cleaning) for treatment units.
Given the lack of fate and transport data for emerging pathogens necessary to rigorously quantify exposures from emerging pathogens in wastewater systems, this screening process is designed to allow for a qualitative evaluation of available data to estimate the potential for exposure and disease transmission for receptors. As published data were available, they were incorporated into the screening model but data have not been consistently generated to address the diversity of potential treatment processes or possible configurations of wastewater treatment systems throughout the United States. The boundaries of the assessment were drawn to focus effort on assessing direct exposures from wastewater collection and treatment. As a result, exposure to treated wastewater effluent or biosolids is not evaluated, nor it the potential for the presence or generation of reservoirs (e.g., biofilms) that may extend of otherwise alter the character of the initial exposure scenario. Raw sewage sludge could be produced by the waste water treatment system if this material is managed off-site at a centralized processing or disposal facility. Class B sewage sludge (biosolids) generated by wastewater treatment system could be handled with land application. Class B material is treated to significantly reduce pathogen content and relies on natural die-off to control residual levels in the soil. This management scenario raises questions for waste that had been contaminated with a viral pathogen. However, those questions are beyond the scope of this assessment. The potential for exposure via land application of biosolids to farmland, forested areas, land reclamation sites, or other sites are not evaluated here. Exposure is not evaluated from residential sewage overflows, or contact with receiving surface water bodies either prior to treatment (e.g., combined sewer overflow) or after treatment. Since the evaluation is focused on the human receptor, exposure to ecological receptors is not considered.
Exposure of receptors is evaluated for wastewater bioaerosol, bulk or splashed wastewater, and wastewater that is deposited on surfaces from bioaerosol particles, droplets, or splashed wastewater (Chattopadhyay et al., 2017). For the toilet flush, surfaces are defined to include the toilet tank, flush handle, toilet lid, and sink or vanity surfaces. For the wastewater treatment processes, surfaces can include piping, table tops, floors, or other horizontal and vertical surfaces that individuals may contact them with their hands. Surfaces can be composed of materials that are porous or nonporous, but most are anticipated to be nonporous surfaces. Exposure to

5
bioaerosol and to bulk or splashed wastewater are assessed for the following potential routes of exposure: inhalation, incidental ingestion, dermal, and potential contact with mucous membranes (e.g., ocular, oral). The identified routes of exposure from complete exposure pathways are then considered relative to the routes of exposure documented to be associated with disease transmission.
This screening process is designed to answer the following questions:
• What are the potentially complete exposure pathways for HCP during and after introduction to the wastewater system?
• Which disease transmission characteristics are associated with the potential for a pathogen to exhibit HCP activity in the wastewater system?
• How can an HCP be screened for the potential presence of VEP in the wastewater system?
3 Potential Disease Transmission During Wastewater Collection and Treatment
For pathogens not directly introduced into the wastewater system, disease transmission may result from viable pathogens that are shed in bodily fluids and remain infectious until exposure. Potential linkages between pathogens in wastewater and disease transmission were identified in the early 1900s, with the first published report dating back to 1907 (Johnson et al., 2013a). Research interest in occupational exposure to wastewater peaked in the 1970s and 1980s after the published descriptions of sewage workers’ syndrome by Clark et al. (1977) and Rylander et al. (1976). During this time, the primary transmission hazard posed to workers during wastewater treatment was identified as oral exposure to enteric viruses through incidental ingestion via contaminated hands (U.S. Environmental Protection Agency, 1980). It is commonly accepted that fecal-oral pathogens, primarily from bacterial and nonenveloped viral biological groups, have the potential for disease transmission from incidental ingestion of feces-contaminated wastewater.
Traditionally, disease transmission of respiratory viruses was assumed to be driven by: (1) person-to-person contact with bioaerosols generated from an infected individual who was shedding virus (e.g., cough, sneeze, exhalation) or (2) fomites contaminated from bioaerosols or large droplets from the infected individual (Weber and Stilianakis, 2008). Respiratory viruses were not considered to be transmissible from water sources (e.g., wastewater, drinking water) (Weber and Stilianakis, 2008). During the 1980s, there were few pathogens that were both known to initiate infection in the lungs and frequently occur in wastewater (U.S. Environmental Protection Agency, 1980). It was viewed as an anomaly if an enteric pathogen was “uniquely infectious by the aerosol route”, with the noted exception of the respiratory bacterium Mycobacterium tuberculosis (U.S. Environmental Protection Agency, 1980). There were also no available analytical methods to quantitate enveloped viruses in wastewater. As a result, wastewater treatment disease transmission studies from that time did not usually consider respiratory pathogens.
However, there were preliminary indications in the literature prior to the 1970s that disease transmission from wastewater collection and treatment may not be limited to fecal-oral

6
pathogens and the oral route of exposure. Darlow and Bale (1959) hypothesized that aerosols generated by the toilet flush could provide for disease transmission from fecal-oral pathogens that could produce infection via the respiratory tract (e.g., poliovirus) or pathogen-containing particles that were incidentally ingested after inhalation of bioaerosols. Darlow and Bale (1959) also noted the potential hazard posed by sewage treatment sources by processes that resulted in turbulent movement of sewage and may generate aerosols. Consistent with U.S. Environmental Protection Agency (1980) assertion, Darlow and Bale (1959) also identified the potential for fecal-associated transmission pathways for inhalation exposure to the respiratory pathogen, M. tuberculosis.
Independent of the Darlow and Bale (1959) paper, Slote (1976) developed a conceptual model to describe the potential linkage between the shedding of identified enveloped and nonenveloped viruses in human feces and urine, the confirmed presence of these viruses in wastewater, and the pathogen-specific potential to transmit disease via oral, nasal, or inhalation exposure. Through this process, Slote (1976) hypothesized the potential for exposure and disease transmission from a broad variety of viruses (e.g., infectious hepatitis, smallpox) present in the wastewater and routes of exposure (e.g., ingestion, inhalation) known to be present during wastewater treatment.
The hypothesis of disease transmission from wastewater or sewage containing respiratory viruses as described by Darlow and Bale (1959) and Slote (1976) gained credibility from disease transmission studies during the 2003 SARS epidemic in Hong Kong. The SARS outbreak was fueled by bioaerosol generation during the collection and transport of sewage that allowed for distant disease transmission (Roy and Milton, 2004; Yu et al., 2014). The movement of SARS-contaminated sewage through the floor drains generated high concentrations of aerosolized virus that remained virulent and of sufficient dose to cause infection after airborne travel a considerable distance from the original source (Roy and Milton, 2004).
Interestingly, the SARS outbreak advanced the understanding of conditions for airborne transmission of pathogens that seemingly lack this form of transmission in the natural environment or human-to-human transmission. Using the SARS virus and other respiratory pathogens as examples, Roy and Milton (2004) conceptualized aerosol disease transmission by a range of descriptors that describe potential fluidity of disease transmission for pathogens with varying levels of dependence on respiratory pathways (i.e., obligate, preferential, or opportunistic). Each type of airborne transmission shares the common element that the pathogen exhibits a reasonable probability of initiation of infection from aerosol inhalation exposure through a small dose in the lung (Roy and Milton, 2004).
Pathogens characterized as obligate respiratory pathogens are transmitted solely via respiratory exposure to aerosols (e.g., tuberculosis) (Roy et al., 2010). Preferential2 and opportunistic3) respiratory pathogens can be transmitted through both respiratory and non-respiratory exposure, 2 Diseases with preferentially airborne transmission are caused by agents that can naturally initiate infection through multiple routes but are predominantly transmitted by aerosols deposited in distal airways (airways less than 2 mm in diameter and are comprised of both membranous bronchioles and gas exchange ducts).
3 Diseases with opportunistically airborne transmission are infections that naturally cause disease through other routes but that can also initiate infection through the distal lung and may use fine-particle aerosols as an efficient means of propagating in favorable environments.

7
with the potential for differing disease presentation and severity based on the type of exposure (Roy et al., 2010). No process is agreed upon to evaluate whether an individual pathogen may exhibit preferential or opportunistic transmission. However, approaches are described to determine the potential for transmission from bioaerosols that could facilitate the identification of these potential respiratory pathogens. For example, pathogens that exhibit replication in the lungs for at least one stage in their life cycle may also exhibit the potential for transmission via bioaerosols (Tang et al., 2006).
In the assessment of wastewater disease transmission, emerging pathogens may pose an opportunistic disease transmission hazard in the built environment or in association with specific human activities. For example, “unorthodox transmission patterns” in the built environment may exist when sources that generate concentrated aerosols are combined with an agent that exhibits a high probability of respiratory infection (Roy and Milton, 2004). This combination produces conditions for the presence of novel exposure sources and/or routes of exposure that allows for disease transmission to differ from natural transmission patterns (Roy and Milton, 2004). Unique transmission patterns can arise when pathogen exposure from novel exposure pathways is greater than natural transmission pathways. This condition can result from two potential causes: (1) generation of bioaerosols that exceed natural levels generated by infected individuals and (2) production of bioaerosols that optimize production of respirable particle sizes relative to natural sources. Pathogen concentrations in bioaerosols that are generated from infected individuals have a biological ceiling based on degree of pathogenicity of a microorganism (i.e., how easily it can invade a host and the severity of the disease it can cause) and the ceiling can easily be exceeded in aerosols artificially generated under optimized environmental conditions (such as hot tub, showering, flushing) (Roy et al., 2010; Chattopadhyay et al. 2017). Dependent on the technology4 or the built environment5, artificially produced bioaerosols may also exhibit particle size distributions not constrained by the size distribution of particles expelled from the human respiratory system or released from natural environmental reservoirs.
The Legionella spp. bacterium provides an example of disease transmission facilitated by built environment conditions that lead to higher bioaerosol concentrations and a more optimized particle size for inhalation than natural environmental sources. Legionella spp. is a naturally occurring bacterium in surface water bodies that is rarely associated with transmission from these natural environments. However, hot tubs, spas, shower, and hot water heaters provide optimal conditions for bacterial multiplication and for release mechanisms for human exposure. Breiman (1996) characterized the hazard posed by Legionella spp. exposure as a function of conditions of the built environment (e.g., high water temperatures in hot water heater that could allow for extensive bacterial growth) and the presence of technology (e.g., showerhead) to produce aerosol particle sizes that are ideal for disease transmission via inhalation. In another example of disease transmission facilitated by the built environment, novel disease pathways associated with sewage collection practices in a large apartment complex contributed to the SARS outbreak (Roy and Milton, 2004; Yu et al., 2014). The collection and movement of human 4 Collison nebulizer, atomizer, bubbling generator, liquid sparging aerosolizer or other technologies.
5 Major sources in the built environment include plumbing sources (e.g., showers, faucets, and toilets), cooling towers, respiratory devices (e.g., humidifiers, vaporizers, and nebulizers), swimming pools (including spas/hot tubs and whirlpools), steam-producing appliances, and ornamental fountains.

8
waste aerosolized the respiratory virus and facilitated distant airborne transmission. In addition to structures in the built environment, human activities that increase the potential for aerosolization of emerging pathogens may also facilitate opportunistic disease transmission.
Though human-to-human airborne transmission of EBOV from aerosols of small droplets or droplet nuclei is thought to be unlikely from the natural epidemiology of the disease, disease transmission may be facilitated by generation of aerosolized body fluids containing the virus (Judson et al., 2015). Aerosol generating procedures in the medical setting, including intubation or manual ventilation, may generate large droplets or aerosols from bodily fluids or respiratory secretions that are associated with disease transmission potential (Judson et al., 2015). The conditions associated with the nonhuman primate (NHP) outbreak of EBOV-Reston that was hypothesized to result from mechanical aerosolization of EBOV generated during cage cleaning and other activities provides support for this mechanism (Judson et al., 2015). In the context of wastewater treatment and collection, it could also be assumed that the movement of the wastewater or movement of air through wastewater could result in aerosolization of the EBOV if present in wastewater. Given the lack of epidemiological evidence for human-to-human respiratory exposure of aerosol or droplets released from the human respiratory tract as a likely means of transmission of human EBOV infection (Judson et al., 2015), EBOV could be considered an opportunistic respiratory pathogen in this context.
4 Fate and Transport of Pathogens During Wastewater Collection and Treatment
The identification of potential exposure pathways from the wastewater system to human receptors requires knowledge of initial pathogen loading and the anticipated fate and transport of pathogens as they move with the wastewater through the wastewater system from collection to treatment. The following sections will describe fate and transport characteristics of pathogens in the wastewater systems as the pathogens move through wastewater collection, transport, and treatment. Fate and transport characteristics considered include the initial loading in bodily fluids and resulting wastewater concentration, viability of pathogens in wastewater, adhesion to solids/organics that may affect exposure, and the potential for phase shifts (e.g., aerosolization of the wastewater medium to the air medium) from wastewater.
4.1 Collection
The residential toilet is the first location for collection of wastewater as well as the first generation point for potential receptor exposure to wastewater pathogens (Figure 4-1). Many infectious diseases result in the shedding of viable pathogens in urine, feces, or vomit from infected individuals (Johnson et al., 2013a). The system-wide loading of pathogens from the collection system is determined by the total number of infected individuals (i.e., ill and convalescent) who shed viable pathogens combined with the daily volume or mass of waste and an associated pathogen concentration for the waste.
Fecal pathogen loadings for common fecal-oral pathogens (e.g., norovirus) can be as high as 108 to 109 genomic copies per gram of feces and at least 106 genomic copies per milliliter of vomit (Johnson et al., 2013a). Pathogen numbers reported per gram of feces for typical indicator fecal pathogens (e.g., bacteria, nonenveloped viruses) associated with fecal-oral transmission
9
pathways have also been reported (e.g., Campylobacter spp. [106 number/gram feces], Vibrio cholerae [105 number/gram feces], and enteroviruses [106 number/gram feces]) (World Health Organization, 2017).
Numerous respiratory viruses have been reported in feces, including respiratory syncytial virus, SARS coronavirus, adenovirus, and bocavirus (Arena et al., 2012). For enveloped respiratory viruses like human influenza (both seasonal and pandemic forms), molecular measurements (e.g., viral ribonucleic acid [RNA] identification) are the most frequently reported (Minodier et al., 2015). The isolation of viable virus from feces is less frequent (Minodier et al., 2015). As a result, quantitative data that describe viable pathogen numbers in bodily fluids, especially feces, for many respiratory pathogens are scarce and/or highly uncertain.

10
Figure 4-1. Overview of exposure assessment pathways for wastewater collection and treatment.

11
The total load of pathogens collected in the toilet from an individual can be affected by pathogen-specific and intra-individual variability in disease presentation. For example, pathogen contributions by an infected individual may exhibit atypically high pathogen waste concentrations (i.e., “super-spreaders” who shed disproportionately high levels of pathogens relative to the average or even upper-bound levels), increased volumes of generated waste per individual, and the possibility of an extended duration of shedding after resolution of clinical illness. In addition to increased loading levels per unit mass or volume of waste, diarrhea can significantly increase the waste volume per day for some pathogens. For example, waste generation of up to 9 L of liquid waste per day is reported for individuals with EVD (Lowe et al., 2014). Chughtai et al. (2016) also reported extended shedding of EBOV RNA in urine after resolution of clinical disease symptoms for up to 30 days after the clinical illness was identified. Phenotypic variation in viral shedding among EBOV strains is hypothesized based on observations of the 2013–2016 EVD outbreak where patients exhibited prolonged disease progression and more frequent diarrhea (Vetter et al., 2017).
Once pathogen-containing bodily fluids are added to the toilet, pathogens may partition to surfaces or other solid elements in the toilet. Prior to the flush, pathogens that enter the toilet may be adsorbed to solid fecal or vomit material; absorbed within the solid fecal or vomit material; contained unbound in liquids (e.g., urine, vomit, or water); associated with particles in the toilet bowl; or adsorbed to the material lining the bowl. The bowl surface and contents (i.e., clean water, feces, urine, vomit) have a very short time period (i.e., minutes) for potential partitioning between solid and liquid states. Titcombe Lee et al. (2016) evaluated short-term partitioning (i.e., 5 to 10 minutes) of the nonenveloped MS-2 and the enveloped Phi6 bacteriophages between water, diarrhea surrogates (i.e., synthetic sludge, anaerobically digested sludge), and fabricated bowl surfaces (i.e., porcelain, concrete, polyvinyl chloride, polypropylene). After spiking the sludge with 108 plaque-forming units (pfu) of bacteriophage and additional water to mimic diarrhea, the liquid and solid fractions were then generated via centrifugation after 5 to 10 minutes (Titcombe Lee et al., 2016). The time duration allowed for sorption in this study is generally consistent with a slightly extended partitioning time prior to a toilet flush. Adsorption between unsterilized sludge, water, and a range of material surfaces was found to be generally low over short time periods with at least 94% of MS-2 and Phi6 as measured by quantitative polymerase chain reaction (qPCR) remaining in the liquid fraction across all replicates (Titcombe Lee et al., 2016). The viral load in water is then available for aerosolization from the toilet water during the flush (Titcombe Lee et al., 2016).
The flushing of the toilet may contribute to exposure from aerosolization of toilet contents, including potential pathogens, and deposition of splashed toilet water or aerosol particles on surfaces that may act as fomites (Johnson et al., 2013a). Pathogens or pathogen-containing materials that sorb to the sidewall of the toilet may generate bioaerosols over subsequent flushes even absent the introduction of additional pathogen sources to the toilet (Gerba et al., 1975; Barker and Jones, 2005; Johnson et al., 2013a). In contrast to the limited direct partitioning to toilet bowl surfaces reported by Titcombe Lee et al. (2016), biofilms present on toilet surfaces are suggested to easily capture and then release pathogens during subsequent flushes (Johnson et al., 2013a). Receptors who may be exposed to pathogens released from the toilet flush include infected individuals that use and flush the toilet and/or contact fomites as well as individuals that may be exposed to successive flushes and/or contact with pre-existing or newly deposited fomites.

12
4.2 Pathogens in Wastewater During Transport and Treatment
After pathogens are introduced to wastewater during collection via the toilet, they are transported with wastewater to the WWTP through the collection system. The concentration of pathogens in wastewater during transport is of potential concern to individuals who may contact wastewater during transit (e.g., via maintenance activities, combined sewer overflow) or during the early stages of treatment when pathogens are present at their highest levels.
There is evidence that even relatively small numbers of individuals can contribute to detectable pathogens in wastewater, with considerable mixing of introduced pathogens noted during release and catch studies of poliovirus in collection systems (Hovi et al., 2001). As an example, it was estimated that poliovirus excretion by 70 people in a population of 700,000 could be detected downstream in wastewater based on capture of poliovirus spiked in the wastewater system. (Hovi et al., 2001). Researchers developing polio surveillance programs reported that the shedding of live poliovirus at average levels of 50% tissue culture infective dose (TCID50) equal to 1.3 × 10⁵ per gram of feces was associated with detectable peak measurements of approximately 102 pfu per liter of sewage (Lodder et al., 2012). It is relevant to note that the average poliovirus fecal levels (i.e., 105 order of magnitude) reported in the Hovi et al. (2001) study are within the general levels described in Section 4.1 for fecal-oral pathogens of bacterial or nonenveloped origin. Poliovirus is hypothesized to provide a conservative estimate for persistence in wastewater because of its demonstrated ability to survive in feces and wastewater. For similar loading levels, pathogen characteristics and wastewater collection systems; the peak measurement value of 102 pfu per liter of sewage could be considered as a ceiling concentration for hardy, nonreplicative pathogens. In this context, hardy is defined to describe pathogens with known persistence in wastewater, with classic examples being enteric bacteria or viruses.
The wastewater concentration of a pathogen during transport is a function of several parameters: pathogen loading of the waste, wastewater volume over which the pathogen will be diluted (i.e., system size, expected wastewater volume), location within the collection network and type of equipment used to transport wastewater, and persistence of the pathogen in wastewater relative to the expected time between collection and the time of interest. One approach to estimate the potential wastewater concentration after pathogen entrance to the wastewater system is the development of a dilution factor. A dilution factor describes the quantitative relationship between the concentration of the pathogen in feces (or other bodily wastes) and concentration as diluted by wastewater. As noted earlier, quantitative data describing the viable fecal pathogen loading per gram of feces are scarce for the primary biological group of enveloped pathogens that are most often associated with emerging pathogens. However, fecal concentration data are available for some common fecal indicator microorganisms or fecal-oral pathogens and these data can inform the development of estimated ranges for emerging pathogen wastewater concentrations. For example, published ranges of pathogen concentrations in feces and associated wastewater concentrations are reported for several commonly recognized fecal-oral pathogen groups (e.g., World Health Organization [2017], Feachem et al. [1983]).
The U.S. Environmental Protection Agency (1980) estimated a dilution factor range of 1,000 to 10,000 for the relationship between the feces concentration of normal intestinal flora relative to the expected wastewater concentration of these flora prior to WWTP entry. The U.S. Environmental Protection Agency (1980) dilution factor predicted that a fecal concentration of 108 pathogens per gram of feces when present in 1% to 10% of the population would result in 105 to 107 pathogens per

13
liter of sewage (U.S. Environmental Protection Agency, 1980). However, no further information on the generation of the U.S. Environmental Protection Agency (1980) dilution factor range was identified.
Table 4-1 summarizes disease transmission, pathogen, wastewater system, and service population characteristics that may contribute to a higher or lower dilution factor value in an individual wastewater system. For example, pathogen-specific data provide insight into relevant fate characteristics (e.g., persistence time outside the host in wastewater) that can be used with specified system-specific environmental conditions (e.g., seasonal temperature, variance in pH) to identify a potential dilution factor. Data describing these characteristics are expected to be unavailable or highly uncertain for most emerging pathogens. However, a modeling approach could also be considered to estimate pathogen concentration during transport and treatment.
When considering the application of a generic dilution factor to estimate wastewater concentration of a pathogen, it should be noted that dilution factors implicitly incorporate the characteristics that are identified in Table 4-1. When determining the appropriateness of the published generic factors for application to emerging pathogens, comparability among the characteristics (e.g., persistence in wastewater, percentage of population excreting pathogen) of the emerging pathogen relative to the pathogen represented by the range should be evaluated to avoid potential over- or underestimation of wastewater concentration. Similarly, comparability among the system characteristics should also be explicitly considered.
Given the complex interactions between the characteristics that can affect the dilution factor, the identification of quantitative thresholds for characteristic values associated with pathogen detection cannot be reliably determined. For example, there are no general guidelines that can be identified with regard to the values individual characteristics most likely to be associated with receptor exposure (e.g., loading of pathogen in waste). As a result, relative descriptors (e.g., higher versus lower percentage of infected individuals) were used in Table 4-1 to provide general direction on how individual elements may affect the value of the dilution factor (i.e., potential tradeoffs) with other elements remaining constant unless specifically identified.

14
Table 4-1. Characteristics with Potential to Lead to a Higher or Lower Dilution Factor
Characteristics Potential for Lower Dilution Factor Potential for Higher Dilution Factor
Disease Transmission
Shedding of pathogen in infectious form
• Higher percentage of infected individuals shed pathogen in infectious form
• Fecal-oral or respiratory pathogens that are associated with multiple pathways of shedding that could enter the wastewater system (i.e., feces, urine, vomit)
• Lower percentage of infected individuals shed pathogen in infectious form
Concentration of pathogen in waste and volume of waste generated
• Presence of fecal-oral and respiratory pathogens that can be excreted at high concentrations in feces and other bodily wastes, pathogen numbers up to 108 to 109 per gram of feces and 106 per mL vomit have been reported for some pathogens (Johnson et al., 2013a)
• Waste production that is significantly increased, example of EBOV infection leading to up to 10 liters of waste per day (Lowe et al., 2014)
• Pathogens present at extremely low levels in waste with low infected population percentages may have potential to be diluted beyond detection
Pathogen
Persistence in wastewater
• Physical structure of nonenveloped enteric viruses and spore forms of bacteria may provide for greater persistence in complex wastewater medium
• Fecal-oral and other types of bacteria may increase in number during transit in the collection system
• Persistence that exceeds transit time, as described by Ye et al. (2016) data indicating that persistence may exceed typical transit time in most wastewater systems for some enveloped viruses
• Physical structure of enveloped viruses may exhibit lessened persistence due to microbial predation and susceptibility of envelope to damage
System and Service Population Percentage of population infected
• Higher percentage of service population infected
• Lower percentage of service population infected
Volume of wastewater in system
• Smaller volume of system wastewater relative to the waste loading rate
• Larger volume of system wastewater relative to the waste loading rate
Complete references are found at the end of the report.

15
Dilution factors do not describe the distribution of pathogens within the wastewater system. However, predictions regarding the partitioning of pathogens within wastewater and the potential for subsequent media shifts (e.g., aerosolization from water medium to air medium) can be made to inform identification of potential routes of exposure (Chattopadhyay et al., 2017). Adsorption to solids may also affect aerosolization and the resulting bioaerosol concentration (Hejkal et al., 1981; Chattopadhyay et al., 2002). One key mobilization determination is whether pathogens remain unbound (i.e., dispersed or aggregated and not adhered to any particle, surface, or other organic matter) in wastewater or are associated with particles (Chattopadhyay and Puls, 1999). For unbound pathogens in wastewater, there is the potential for sequestration by existing wastewater particles, system piping, or biofilms associated with the piping or treatment processes. Wastewater contains an abundance of solid particles available for binding. Most virus aggregates and viruses adsorbed to solids are associated with submicron-sized particles, with almost three-quarters of particles reported to be 0.3 µm or smaller in size (Hejkal et al., 1981). Surface properties (e.g., surface charge, hydrophobicity) of a microorganism and surface properties of solids, and wastewater pH are common factors associated with the efficacy of common wastewater treatment elements including coagulation, disinfection, environmental transport, and adhesion to surfaces (White et al., 2012). However, the vast majority of studies cited by White et al. (2012) report data for bacteria (spores and vegetative form) or the protozoa Cryptosporidium spp. Studies are needed to evaluate potential surface charge relationships between viruses, especially enveloped viruses, and common treatment processes within the relevant pH range of wastewater. Pathogens that strongly sorb to solids in wastewater are more likely to be captured by the settling process. For example, sewage sludge is the ultimate fate of particle-associated viruses and can function as an integrator of viruses introduced to wastewater (Bibby and Peccia, 2013). Worker exposure from some downstream treatment processes (e.g., secondary treatment technologies) may be reduced, but exposures from the sludge treatment processes may increase. As result, potential exposures to wastewater workers are not removed, but may be shifted to other processes in the treatment plant.
Fecal matter, urine, and most domestic sewage exhibit a neutral range of pH (Sobsey and Meschke, 2003; Rose et al., 2015). However, wastewater typically exhibits fluctuating pH conditions due to ongoing wastewater additions to the system, but generally stays within the neutral range. Viruses are generally described as exhibiting an isoelectric point (i.e., the pH value at which the zeta potential is approximately zero indicating no net electrical charge of the substrate) below the neutral pH range observed for wastewater, though some strain-specific variability in virus isoelectric points is also described (Sobsey and Meschke, 2003). In the neutral pH of wastewater, the virus is hypothesized to be positively charged and therefore attracted to the solids in wastewater that typically exhibit a negative charge.
However, the composition and surface properties of enveloped viruses are different from bacteria and nonenveloped viruses. Enveloped viruses have multiple structures emanating from their envelope and each structure can have a unique isoelectric point. In contrast, the isoelectric point of nonenveloped viruses is principally determined by the functional groups of the coat protein (Michen and Graule, 2010). The individual isoelectric points presented by an enveloped virus may be alternately higher or lower than the wastewater pH at any given point in time. As a result, it may not be useful to conceptualize surface charge for enveloped viruses in the same manner as nonenveloped viruses and bacteria. Enveloped viruses may have a constantly shifting electric net charge as well as the potential for individual structures to sorb to solids with varying levels of intensity. The varying

16
changes in net charge and potential for differing levels of sorption strength for enveloped viruses complicate the use of general rules regarding their predicted net charge relative to wastewater.
4.3 Formation of Bioaerosols
4.3.1 Background Aerosols are generally defined as small solid or liquid particles that are suspended in air. In this report, the term particle is inclusive of liquid or solid forms of aerosol particles. However, the term droplet is commonly reported in various forms in disease transmission research to describe the size, potential fate, or likely exposure characteristics of liquid particles. In contrast to the restriction imposed in some texts that droplets originate only from the human respiratory tract, the term droplet is used in this report without any limitation on its source. One use of the term droplet maintained in the report is to describe the phases of liquid particle fate after initial release of the bioaerosol (i.e., droplet to droplet nuclei). Consistent with some published descriptions of bioaerosols (e.g., Johnson et al. [2013a]), the terms droplet and droplet nuclei will be maintained to differentiate between the particle that is released immediately after aerosolization (i.e., droplet) and the particle that remains after water evaporation (i.e., droplet nuclei). The second use is the term large droplet to describe liquid droplets released to the air that are sufficiently large (e.g., approximately 10 to 20µm or greater in size) that they will exhibit shorter time durations of suspension in air and therefore have less propensity to travel distances when airborne. However, there is no generally agreed upon size classification to distinguish between droplet sizes. For example, Weber and Stilianakis (2008) proposed a 10µm size (as measured post-evaporation after droplet nuclei formation) cutoff between post-evaporation size of droplet nuclei versus large droplets. Judson et al. (2015) indicated a cutoff of 20µm size between large and small droplets, and characterized droplet nuclei as less than 20µm in size.
When aerosols contain microbiological organisms, they are termed bioaerosols. The generation of bioaerosols containing microbial pathogens during toilet use (Darlow and Bale, 1959; Barker and Jones, 2005; Johnson et al., 2013b) and during treatment of wastewater (U.S. Environmental Protection Agency, 1980, 1981; Bauer et al., 2002; Wen et al., 2009) is well documented. Bioaerosol particles can be in the form of individual microorganisms (i.e., bacterial cells, spores, or viruses), aggregates composed of multiple microorganisms, or a combination of microorganisms with other nonmicrobiological materials (Morawska, 2006). As a result, bioaerosol particle size can be considerably larger than an individual microorganism.
The generation of a viable (infective) bioaerosol is a two-part process: (1) the release of airborne particles containing microorganisms through a mechanism known to aerosolize pathogens from an aqueous medium (e.g., bubble bust mechanism), and (2) bioaerosol survival in the air environment upon release (Thomas et al., 2011). The infectivity of bioaerosols for both bacteria and viruses is significantly affected by aerosolization technique and environmental conditions (Thomas et al., 2011; Turgeon et al., 2014). A number of environmental conditions affect the viability of viral bioaerosols including temperature, relative humidity, ultraviolet light, and the medium of the aerosol (e.g., mucus from sneeze or cough that aerosolized the virus) (Turgeon et al., 2014). Thomas et al. (2011) identified a similar list for bacteria, though additional factors were included (e.g., particle size, oxidative shock).

17
Bioaerosol formation follows known mechanisms of aerosol generation. The bubble-burst mechanism is generated by the movement of air through a volume of water resulting in the bursting of a bubble through the air-water interface and release of the bioaerosol particle to the air. The bubble-burst mechanism is a relevant aerosolization mechanism for droplet nuclei formation during the toilet flush (Johnson et al., 2013a) and wastewater treatment processes (Sanchez-Monedero et al., 2008). Types of the bubble-burst mechanism can be differentiated based on the size of the bubble moving through water; the film droplet is initiated by bubbles from submicron to 20 µm sizes whereas the jet droplet is formed by bubbles approximately an order of magnitude larger in size (Johnson et al., 2013a). The jet droplet mechanism is thought to be active in the aerosols formed in surface water bodies (i.e., sea surf) (Baylor et al., 1977a; Baylor et al., 1977b) and may have general applicability to wastewater processes with large volumes of water and wave-like movement (e.g., clarifying tanks).
When evaluating the applicability of earlier bioaerosol studies to wastewater treatment, Fernando and Fedorak (2005) noted that many studies were based on observations of a single bubble as it moved upward through water to the surface. However, aeration systems in wastewater treatment processes utilize an ongoing flow of air bubbles allowing for the potential combination of air bubbles prior to reaching the water surface (Fernando and Fedorak, 2005). As a result, Fernando and Fedorak (2005) hypothesized that aerosol formation in wastewater aeration systems that simultaneously inject multiple bubbles is more likely to result from film droplets rather than jet droplets, given the lack of jet droplet formation from the larger combined bubbles. The size of the bubble is also associated with the number of film droplets, with coarse bubble aeration (i.e., larger sized bubbles) leading to a larger number of film droplets and a greater number of bioaerosolized microorganisms generated than fine aeration (Fernando and Fedorak, 2005).
One unique aspect of bioaerosols formed by the jet or film droplet processes is the potential for the concentration of microorganisms in the bioaerosol relative to the source water. The released bioaerosol is composed of bacterial or viral content distributed throughout the volume of the liquid as well as the bacteria and viruses that preferentially concentrate at the air-water interface (Slote, 1976; Blanchard and Syzdek, 1982). The presence of concentrated microorganisms at the interface is reported for enveloped hydrophobic viruses, nonenveloped hydrophilic viruses, vegetative bacteria, and spores (Baylor et al., 1977a; Hejkal et al., 1980; Falkinham III, 2003; Sobsey and Meschke, 2003). The ratio of bioaerosol concentration relative to source water exhibits a greater than 1,000-fold increase in numbers of viable mycobacteria (Falkinham III, 2003), a range of zero increase to approximately 100-fold increase in concentration for a variety of bacteria (Hejkal et al., 1980), a four-fold increase in concentration for bacterial spores (Hejkal et al., 1980), and a 100- to 200-fold or more increase for nonenveloped viruses (Baylor et al., 1977a). Concentration in the individual drops is size-dependent, with smaller drops exhibiting higher concentrations than larger drops because the smaller drops are derived from a higher relative amount of water drawn from the enriched surface layer (Hejkal et al., 1980). However, there is a hypothesized limit of bubble size below which the pathogen concentration cannot continue to increase due to accompanying reductions in the relative volume of water captured from the concentrated surface layer (Hejkal et al., 1980).
The hydrophobicity of the microorganism surface is an important factor in aerosolization of microorganisms from water (Falkinham III, 2003). Consistent with the observation on the role of hydrophobicity in promoting aerosolization, Johnson et al. (2013b) reported that the highly

18
hydrophobic bacterium, Mycobacterium tuberculosis, could be aerosolized from a relatively minor disruption of the liquid surface when contained in water. Similarly, the outer exosporium of Bacillus spores is also very hydrophobic, with noted differences in the level of hydrophobicity among individual species (Greenberg et al., 2010). Additional factors may also affect aerosolization potential even within the same bacterial species. For example, Blanchard and Syzdek (1982) report differences in bioaerosol formation based on the age of bacterial cells in Serratia marcescens.
The process of aerosolization can impart significant stress on the associated microorganism from the addition of air-to-water interface surfaces, heat, or the breakage of chemical bonds (Hatch and Wolochow, 1969). The hardiness of the outer membrane is an important determinant of the potential for a microorganism to withstand aerosolization stress and maintain viability. Bacteria exhibit susceptibility to shear stress, with the cellular outer membrane noted as a site of significant damage during aerosolization studies using Escherichia coli (Thomas et al., 2011). Damage may be expressed in the form of cell death or loss of culturability, as is reported for a group of Gram-negative bacteria (i.e., S. marcescens, Klebsiella planticola, Cytophaga allerginae) (Heidelberg et al., 1997).
Viruses exhibit significant variation in response to the stress from the aerosolization process and subsequent sampling stress from recovery and enumeration (Turgeon et al., 2014). Similar to the description of shear stress impacts on bacterial viability after aerosolization, enveloped viruses are hypothesized to lose infectivity from conditions that promote virus accumulation on the surface of aerosol droplets when accompanied by sufficient surface forces to burst the outer viral membrane (Weber and Stilianakis, 2008). The magnitude of the stress is dependent on the viral species or subtype. For example, the Phi6 bacteriophage exhibited losses of greater than 99.8% after aerosolization, and sampling stress assays confirmed that damage to the viral envelope was significant (Gendron et al., 2010). However, the MS-2 bacteriophage was reported to have losses of approximately 80% in the same study reported by Gendron et al. (2010). The MS-2 bacteriophage is reported to exhibit significant resistance to the stresses of aerosolization and sampling, as evidenced by the same order of magnitude recovery by qPCR and plaque-based assays (Turgeon et al., 2014). However, small differences in physical structure of enveloped viruses identified at the subtype level for influenza viruses may result in variable losses in infectivity after aerosolization (Verreault et al., 2015).
The evaluation of sampling stress must incorporate consideration of the specific mechanism of aerosolization. A key component in the evaluation of potential surrogate data for viable aerosol generation is that a similar mechanism for aerosolization is used to generate the surrogate data relative to the mechanism likely in place for the wastewater system environment. For bacteria, the physiology of the aerosol can be strongly associated with the aerosolization process (Thomas et al., 2011). This linkage is also true for viruses (Verreault et al., 2015), especially enveloped viruses that by the nature of their envelope may exhibit similar outcomes from shear stress as bacteria. As a result, identification of aerosolization ratios or resistance to aerosolization should be considered to be specific to the aerosolization mechanism and pathogen.
Most of the laboratory-based assessments of aerosolization of bacteria and viruses use a nebulizer to produce the aerosol. While nebulizers are not used in wastewater treatment processes, the atomization process in a nebulizer is similar to the bubble-burst mechanism that is generated by the rapid movement of air through a volume of water. However, the relative aerosolization stress imparted from a nebulizer is unknown when compared to the aerosolization stress from the toilet

19
flush or wastewater treatment processes that exhibit a bubble-burst mechanism. It is known that nebulizers exhibit a high shear stress (National Research Council, 2006), but published data to compare these two mechanisms have not been identified. If the bubble-burst mechanism imparted more stress, bacterial bioaerosol data measured from an actual wastewater treatment process may be more representative of viable bioaerosol generation than viral data developed using a nebulizer. The differential impacts of aerosolization stress may be even more pronounced if the nebulizer tests were performed under conditions of low or moderate relative humidity.
Though few studies are performed specifically for viruses, the medium from which the pathogen is aerosolized is also important to the generation of a viable bioaerosol (Turgeon et al., 2014). No published data describe aerosolization of EBOV or other enveloped viruses from the wastewater medium, which is known to contain high levels of solids and proteins that may provide protection during the process. However, Verreault et al. (2008) described the Ijaz et al. (1985) study that reported an 80% infectious virus recovery at 24 hours under conditions of mid-range relative humidity when the nonenveloped rotavirus was aerosolized from a fecal matter spray. Verreault et al. (2008) hypothesized that the organic matter and compounds present in fecal matter may serve to protect aerosolized microorganisms from desiccation and other environmental stressors.
The two most important environmental factors associated with inactivation of viral bioaerosols are relative humidity and temperature (Piercy et al., 2010). The working definition for relative humidity used in Yang and Marr (2012) will be used for this report: “ratio of the actual water pressure to the saturation vapor pressure of ambient air” (Yang and Marr, 2012). Though there are exceptions, it is generally accepted that enveloped viruses exhibit greater persistence at lower relative humidity levels, and nonenveloped viruses demonstrate greater stability at higher relative humidity levels (Verreault et al., 2008; Yang and Marr, 2012). Generally agreed upon values for higher or lower relative humidity levels are not available to assist in the placement of experimental scenarios into higher or lower relative humidity levels. However, Yang and Marr (2012) distinguished lower from higher humidity based on whether relative humidity levels were lower or higher than 50% and that definition is useful for the evaluations likely to be conducted in wastewater systems.
Relative humidity affects aerosol viability when the aerosolized particles lose water to equilibrate with airborne water levels, causing both a concentration of non-volatile components in the particle and shrinkage in particle size (Hatch and Wolochow, 1969). The equilibration happens rapidly after the aerosol particles are released, and the final particle size is dependent on the relative humidity (Verreault et al., 2008). In high relative humidity conditions, aerosol particles exhibit a high air-to-water interface that can lead to a greater inactivation of hydrophobic viruses (e.g., enveloped viruses) (Trouwborst et al., 1974). This inactivation could be sufficiently rapid after aerosolization under conditions of high relative humidity that it may preclude the measurement or detection of viable bioaerosols of enveloped viruses. For example, the enveloped Phi6 bacteriophage immediately lost infectivity when aerosolized at temperatures of 30°C and 80% relative humidity (Verreault et al., 2015). Given that many WWTP have high (percentage unspecified by cited author) relative humidity (Masclaux et al., 2014), the environmental conditions at most plants may reduce the potential for enveloped viruses to generate viable bioaerosols.
To evaluate reasons for lessened persistence by enveloped viruses at high relative humidity levels, Yang and Marr (2012) hypothesized that viruses could be separated by virtue of their pH requirements for cellular fusion with the host cell during disease. As an example, viruses that require low pH to enter host cells (e.g., avian influenza, SARS) are less stable at 50% to 90% relative

20
humidity levels (Yang and Marr, 2012). Results from recent aerosolization studies conducted with the Phi6 bacteriophage are also consistent with the generalization that enveloped viruses exhibit lesser resistance at higher relative humidity levels (Verreault et al., 2015). Interestingly, the commonly identified enveloped viral surrogate Phi6 bacteriophage is in the same host cellular fusion group identified by Yang and Marr (2012) as several emerging pathogens of likely interest for the screening process (e.g., SARS, avian influenza). As a result, the Phi6 bacteriophage and many emerging pathogens may exhibit similar behavior in the relative humidity conditions of a WWTP.
In contrast, enveloped viruses that require a neutral pH for cellular fusion exhibit greater stability at 50% to 90% relative humidity (e.g., Rous sarcoma virus, bovine rhinotracheitis virus) (Yang and Marr, 2012). Viruses that do not have specific pH requirements for fusion due to multiple pathways of cellular entry may not exhibit sensitivity to relative humidity (e.g., vaccinia virus, causative agent of smallpox) (Yang and Marr, 2012). While further data are needed to fully describe the relationship between relative humidity, aerosol viability, and virus type; the Yang and Marr (2012) hypothesis provides a mechanistic basis to identify surrogates predictive of target pathogen bioaerosol generation based on an identified relationship between viral type, relative humidity, and aerosol persistence. It also helps to explain why enveloped viruses of interest may exhibit lower aerosol stability within the range of relative humidity levels likely to be found at some WWTP. When selecting surrogate organisms to evaluate the generation of viable bioaerosols of enveloped viruses, the suitability may vary based on ambient temperatures and relative humidity. As a result, environment-specific surrogate selections should be identified, with the assumption that they may not be broadly applicable to all environmental settings.
4.3.2 Bioaerosol Generation During the Toilet Flush Darlow and Bale (1959) provided one of the earliest reports that the toilet flush could generate bioaerosols of pathogens contained in waste. The flushing of a toilet produces a bioaerosol with a range of particle sizes (Figure 4-2). Lin and Marr (2017) reported a particle size distribution for a toilet flush with one L of anaerobically digested sludge in the toilet bowl. A scanning mobility particle sizer was used for particles 14−700 nm and an aerodynamic particle size spectrometer for particles 0.5−20 µm, and the results merged to generate a distribution (Lin and Marr, 2017). Based on the measurement of two commercial autoflush mechanism toilets, a total particle number of 1.7 to 2.6 million per flush and the total volume of aerosols generated in the range of 10−9 to 10−8 mL were reported (Lin and Marr, 2017). The distribution exhibited multiple peaks over the particle size range of approximately 10 nm to 1,000 nm (i.e., 10-2 µm to 1 µm). However, a description of the size distribution across a particle size range (e.g., 1 µm to 20 µm, large droplets) of greatest interest for the screening assessment was not quantitatively described by Lin and Marr (2017).

21
Figure 4-2. Toilet flush showing aerosol and particle deposition.
Particle size is a key descriptor of the bioaerosol generated during toilet usage because the size of an aerosolized particle predicts its fate and potential exposure pathways of receptor exposure. As a result, the distribution of particle sizes is an important summary statistic that describes the relative proportion of particle sizes in the bioaerosol and thereby informs the determination of the mixture of potential exposure pathways present. The bioaerosols generated by the toilet flush are generally smaller than the threshold for respirable particle size (diameter 10 µm) with the greater portion of the mean particle sizes reported to be 5 µm or less in size based on an evaluation of commonly cited studies describing toilet bioaerosol particle sizes (Darlow and Bale, 1959; O'Toole et al., 2009; Johnson et al., 2013a). In one of the first published studies of bioaerosol particle size from the toilet flush, Darlow and Bale (1959) reported that 87% of the aerosol was less than 4 µm in size using study data collected from impingers and pre-impingers. Darlow and Bale (1959) reported the mass mean particle diameters at seat level for an open toilet lid as 2.33 µm and a closed toilet lid as 1.99 µm. O'Toole et al. (2009) also reported particle number and size for 420 mm above toilet seat level from water-efficient Australian toilets; the aerosol concentration was 44.9 aerosol particles/cm3 in the size range of 0.2 to 1 µm, 1.7 aerosol particles/cm3 were in the size range of 2 to 3 µm, and all other measurements for ranges of particle sizes up to 20 µm were below the detection limit of the aerodynamic particle sizer.
Johnson et al. (2013a) evaluated the initial droplet size 15 seconds post-flush and the resulting droplet nuclei for two modern toilets with tanks (i.e., high efficiency, pressure-assisted high efficiency) and one without a tank (i.e., flushometer) after seeding with fluorescent microspheres of varying sizes (i.e., 0.25, 0.5, 1.0, and 1.9 µm). Assessment of larger-sized aerosolized particles was

22
not part of the study design; these particles were not measured and time was permitted to allow them to settle out prior to measurement of other droplet sizes. Johnson et al. (2013a) reported that aerosol generation did not appear to be proportional to pre-flush particle concentration when comparing varying toilet types with comparable volumes of bowl and flushing water. Key findings by Johnson et al. (2013a) included that aerosolized particle numbers demonstrated an increase relative to increasing flush energy, aerosol generation was not proportional to the initial particle loading in the toilet, and droplet formation likely occurs through two mechanisms (i.e., bubble burst for the droplet nuclei and splashing for large droplets). Particles greater than 5 µm in diameter reached their maximum counts during 15 to 20 seconds post-flush and began to decline after 60 seconds (Johnson et al., 2013a). Mean droplet nuclei generation rates, with generation rate defined as droplet count per liter flushed, ranged from approximately 2,100 (high efficiency, high-volume flush) to 25,663 (flushometer). When using fluorescent particles to measure droplet nuclei generation rates, the mean droplet nuclei generation rates (i.e., droplet nuclei produced per 100 million fluorescent particles present pre-flush) were reported by trial to range from 0.072 to 0.256 (Johnson et al., 2013a). These data, in conjunction with known flush energy values by toilet type, were used to support the hypothesis that flush energy and aerosol production were associated (Johnson et al., 2013a). Considerable variability was present in individual results when comparing the averages generated by toilet type (Johnson et al., 2013a).
Differences in particle size distribution between open and closed toilet lids are reported. For example, Darlow and Bale (1959) reported that a closed toilet lid preferentially removed larger-sized S. marcescens particles and resulted in a reduced overall bioaerosol concentration. However, a higher proportion of remaining particles emitted were sufficiently small to remain airborne for potential inhalation (Darlow and Bale, 1959). Best et al. (2012) reported that the closed toilet lid resulted in an approximately 10-fold reduction in airborne Clostridium difficile, and also noted that a reduced load of aerosolized microorganisms was still being transported through gaps between the toilet lid and the bowl. However, few data sets evaluating the impact of lid placement on subsequent aerosolization allow for comparisons across toilet designs and biological groups. As a result, it is difficult to distinguish the potential impact of differences in toilet design (e.g., toilet design, lid placement) versus the innate propensity to form viable bioaerosols exhibited by the different biological groups in the studies.
The literature search identified bioaerosol measurement data from the toilet flush for nonenveloped viruses (Barker and Jones, 2005), enveloped viruses (Lin and Marr, 2017), and bacteria (Darlow and Bale, 1959; Barker and Jones, 2005) (Table 4-2). No data describing bacterial or viral bioaerosol concentrations from vomit or simulated vomit when present during the toilet flush were identified. Additional studies (Gerba et al., 1975; Wallis et al., 1985; Best et al., 2012) describe water concentration data and measurements of captured microorganisms (i.e., enteric poliovirus, MS-2 phage, bacteria, C. difficile) after flushing, but these studies do not provide air concentration data. However, these studies describe important phenomena (e.g., release during successive flushes) associated with bioaerosol formation during the toilet flush that will be reviewed later in this section.
Study designs varied in the means of introduction of microorganisms to the toilet bowl for measurement of bioaerosols in the studies summarized in Table 4-2, as well as additional identified studies that did not report a bioaerosol concentration measurement (Gerba et al., 1975; Wallis et al., 1985; Best et al., 2012). Pathogens were introduced into the toilet by direct addition to the toilet in

23
water, spiked into solids or semi-solids, and introduction of human feces with known concentrations of pathogens.
Table 4-2. Available Data for Bioaerosol Concentration of Microorganisms from Toilet Flush
Type of Material Addition
Toilet and Study Design (Microorganism)
Measured Bioaerosol Concentration* Source
Pathogen Introduction Directly to
Toilet Water
Evaluated close-coupled siphonic U.K. toilet, added to bowl water to reach concentration of approximately 4 × 10⁸ cfu/mL, with total pathogen number of 1010 cfu, immediate sample collection
(Bacteria: Serratia marcescens)
Approximately 1,300 cfu/m3
Measured 20 cm above and 30 cm in front of toilet
Barker and
Jones (2005)
Evaluated wash down closet U.K. toilet, added to bowl water to reach content between 1011 and 1012 organisms as reported by study authors, sample collection 0 to 2 minutes post-flush (Bacteria: Serratia marcescens)
Impinger measures: 321 organisms/m3 at seat level, 43 organisms/m3 at 30 cm above seat 4 organisms/m3 at 60 cm above seat Pre-impinger measures: 217 organisms/m3 at seat level, 19 organisms/m3 at 30 cm above seat 1 organisms/m3 at 60 cm above seat
Darlow and Bale
(1959)
Pathogen Associated
with Feces or Simulated
Feces
Evaluated close-coupled siphonic U.K toilet, Simulated feces, using semisolid agar carriers to reach approximately 1010 cfu for bacteria and 1010 pfu for virus, immediate sample collection (Bacteria: Serratia marcescens, Virus: MS-2 bacteriophage)
1,370 cfu/m3 (Serratia marcescens) 2,420 pfu/m3 (MS-2 bacteriophage) Both measured 20 cm above and 30 cm in front of toilet
Barker and
Jones (2005)
Evaluated commercial toilets with Zurn Aquaflush® automatic flush U.S. toilet, Feces simulated by 1 L of anaerobically digested sewage sludge spiked with 107 pfu/mL, sample collection of 20 minutes after flush at a 2 L/min flow rate (Virus: MS-2 bacteriophage, Phi6 bacteriophage)
No detection for each virus Both measured 10 cm above water level in toilet
Lin andMarr
(2017)
Pathogen Introduction or
Associated with Vomit
No data No data No data
References are found at the end of the report. cfu, colony forming units; pfu, plaque-forming units * Conversion performed from original reported units of Darlow and Bale (1959) to facilitate comparison using: 1 ft = 30.48 cm and 1 ft3 = 0.028317 m3

24
Table 4-2 summarizes the studies that report bacterial and viral bioaerosol concentration for commonly studied microorganisms and the associated study conditions. Table 4-2 identifies the toilet type(s) that was evaluated, total pathogen number, method of introduction to the toilet bowl water, and bioaerosol measurements. Reported bacterial bioaerosol concentrations ranged between 101 colony forming units (cfu)/m3 to 103 cfu/m3 for measurements between 20 to 30 cm above the seat level and up to 30 cm in front of the toilet (Darlow and Bale, 1959; Barker and Jones, 2005).
One study reported bacterial bioaerosol concentrations at seat level of 321 organisms/m3 for impinger measurements and 217 organisms/m3 for pre-impinger measurements (Darlow and Bale, 1959). The use of pre-impinger and impinger bioaerosol measurements by Darlow and Bale (1959) allowed for the reporting of bioaerosol concentration by particle size ranges (i.e., greater than 4 µm in particle size from the pre-impinger, less than 4 µm in particle size from the impinger). Barker and Jones (2005) reported a viral bioaerosol concentration of 2,420 pfu/m3 for the MS-2 bacteriophage after seeding agar to simulate feces, but no particle size data were captured. However, one study reported nondetection of viral bioaerosol as measured by pfu after the flush of an automatic toilet flush mechanism when a 1 L sludge sample was spiked to a concentration of 107 pfu/mL with MS-2 and Phi6, respectively (Lin and Marr, 2017). Lin and Marr (2017) provided particle size data from the flush, but did not quantitatively report bioaerosol concentrations in common size ranges used in exposure assessment.
The first apparent pattern exhibited in Table 4-2 is that bioaerosol concentrations appear to be highest near seat level as would be expected. When bioaerosols were detected, little difference was identified between the bacterial and viral bioaerosol concentrations. However, S. marcescens is a hardy bacterium that exhibits a low decay constant when aerosolized (Darlow and Bale, 1959), and the MS-2 bacteriophage is also recognized as being very resistant to aerosolization (Turgeon et al., 2014). As a result, the potential for generation of viable bioaerosols may be anticipated to be fairly similar between hardier bacteria (e.g., S. marcescens) and nonenveloped viruses (e.g., MS-2 bacteriophage).
Barker and Jones (2005) spiked agar to simulate pathogen-containing feces clinging to the toilet bowl wall and reported first flush airborne particles at one-minute post-flush to contain 2,420 pfu/m3 for MS-2 bacteriophage and 1,370 cfu/m3 for S. marcescens. The Wallis et al. (1985) data directly compared airborne attenuated poliovirus after release from stool collected from vaccinated infants to airborne poliovirus after release from toilet bowl water to which the virus was directly added. Wallis et al. (1985) reported that 65 pfu of poliovirus (measured as a capture and elution from filter) were generated from a toilet flush after seeding the toilet with a feces concentration of 2.4 ×10⁷ pfu and a resulting water concentration of 2,040 pfu/mL. In another round of sampling, 6 pfu of poliovirus (also measured as a capture and elution from filter) were generated from a toilet flush when 4.5 × 10⁷ pfu poliovirus in feces were introduced and a resulting water concentration of 480 pfu/mL virus was obtained (Wallis et al., 1985). For other sampling rounds with 107 total pfu in fecal samples, the virus detected in the bowl water did not rise above 180 pfu/mL and no pfu were recovered from the aerosol. In contrast, no aerosolized virus could be detected when virus was added directly to the toilet bowl water until 3 × 10⁸ pfu poliovirus levels were used (Wallis et al., 1985). The virus was gently added and stirred in the toilet water (Wallis et al., 1985) and the reported airborne measurement is reflective of the toilet flush only.
Best et al. (2012) seeded feces from elderly humans with the spore-forming bacterium C. difficile at levels of 107 cfu/mL and measured aerosolization after the toilet flush. Spores are assumed to exhibit

25
greater hardiness during aerosolization than vegetative bacteria and some viruses. As a result, the spore biological group could represent a potential worst-case scenario for high levels of aerosolization (Best et al., 2012). Best et al. (2012) did not measure aerosol concentration, but placed a rotating plate portable sampler at various heights for tests with the toilet lid closed (i.e., toilet seat height, 10 cm above the seat/handle height) and the toilet lid open (i.e., toilet seat height, 10 cm above the seat/handle height, 25 cm above seat height). For the evaluation of aerosolization, a standard wash-down toilet design commonly used in U.K. hospitals was examined. The highest levels of C. difficile (35 cfu at seat height) were identified immediately after flushing with the lid open (Best et al., 2012). Levels then exhibited an eight-fold reduction by 60 minutes and another three-fold reduction by 90 minutes (Best et al., 2012). The highest counts in the first 30 minutes were reported at seat-height, regardless of whether the lid was open or closed (Best et al., 2012).
When using a cling film over the toilet bowl to capture large droplets in the hospital ward setting, the mean number of large droplets captured was 15 and 47 for the standard wash-down design and rimless pan with raised seat toilets, respectively (Best et al., 2012). For the evaluation of droplet formation, two toilet designs were evaluated: the standard wash-down toilet used in the aerosolization assessment and a rimless pan toilet with a raised seat (Best et al., 2012). Both toilet types are in common use in the United Kingdom (Best et al., 2012). Settle plate were also used to measure the potential surface contamination levels resulting from the toilet flush. Settle plate results were also compared for toilet flushes with the lid open (mean of 1 to 3 cfu/plate, except for the left-hand side of toilet that had 0 cfu/plate) versus the lid closed when no droplets were reported (Best et al., 2012). The direction of water flow during the water flush was hypothesized to cause the lack of droplets reported on the left-hand side of the toilet (Best et al., 2012). For settle plates placed on the floor during an open lid flush, C. difficile was recovered during a 90-minute period (Best et al., 2012). However, there was no droplet recovery on settle plates when the toilet lid was closed (Best et al., 2012).
Darlow and Bale (1959) seeded toilet water with S. marcescens and made measurements using impingers at various heights from seat level (zero, one, and two feet) and slit samplers at seat level. After the toilet flush, Darlow and Bale (1959) noted that the generated bioaerosol exhibited highest concentrations in the immediate vicinity of the toilet seat but then became diluted over time from losses of gravity and inactivation. For example, the reported bioaerosol concentrations were highest at the toilet seat level during the time period from zero to two minutes post-flush, with a reported impinger measurement of 11,329 cfu/ft3. The bioaerosol concentration then rapidly decreased from seat level to 1,509 cfu/ft3 at one foot and 115 cfu/ft3 at two feet.
Using the Darlow and Bale (1959) bioaerosol data described above, Hines et al. (2014) reported an emission factor ratio that could be used to estimate bioaerosol concentration after a toilet flush. The emission factor value of 1.3E-6 (L/m3) is derived by the ratio of the bioaerosol concentration (cfu/m3) over the bacterial pathogen water concentration (cfu/L) reported for the Darlow and Bale (1959) data set. The emission factor value can be interpreted that the measured bioaerosol concentration was approximately six orders of magnitude less than the initiating water concentration for the Darlow and Bale (1959) data set. While the emission factor value should be considered to have high uncertainty (Hines et al., 2014), it does provide a general indication that relatively high levels of bacterial contamination may need to be present in the toilet for generation of a detectable bacterial bioaerosol.

26
There is also evidence that pathogens added to the toilet bowl may not be fully removed during the first flush. Darlow and Bale (1959) first noted that there were not proportionate reductions in bioaerosol concentrations after a reduction in the inoculum introduced to the toilet bowl. For example, a ten-fold reduction in total inoculum added to the bowl (ranging from approximately 109 to 1012) only resulted in an approximately one-quarter decrease in bioaerosol concentration (Darlow and Bale, 1959). The lack of proportionality was highlighted for small inocula (e.g., bowl residues) which contributed to subsequent sporadically high bioaerosol concentrations in successive flushes. Pathogens may become attached to the sidewalls and provide an ongoing source over multiple flushes (Gerba et al., 1975; Barker and Jones, 2005; Johnson et al., 2013a). Viruses may be more difficult to remove than bacteria from the toilet bowl (Gerba et al., 1975), and it has been suggested that biofilms on the surface of the bowl may contribute to viral persistence in the toilet (Johnson et al., 2013a).
It is unclear how bioaerosol generation may differ based on whether pathogens are introduced directly to the toilet bowl water as might occur in urine or are associated with solid or semi-solid material. With the exception of one of the Wallis et al. (1985) data sets and the Darlow and Bale (1959) data, contaminated feces or a simulant were added to clean toilet water in the reported studies. However, the use of agar or other carriers may affect the aerosolization potential relative to actual feces and the resulting air concentration (O'Toole et al., 2009). Wallis et al. (1985) hypothesized that the hydrophobic nature of the added fecal materials may enhance aerosolization of the included microorganisms given the relationship identified between the increased aerosolization noted for increased levels of hydrophobicity. The added materials may also increase turbulence during flushing and thereby potentially increase aerosolization (Wallis et al., 1985). Barker and Jones (2005) performed a non-statistical comparison of the bacterial bioaerosol concentration when an equivalent loading of bacteria was seeded directly to the bowl water or when bacteria were placed in agar on the sidewall to mimic contamination from diarrhea, but no apparent differences were identified (Barker and Jones, 2005).
4.3.3 Bioaerosol Generation During Wastewater Treatment 4.3.3.1 Measurement-based Bioaerosol Data
Sanchez-Monedero et al. (2008) described aerodynamic diameter particle sizes for WWTP bioaerosols as ranging from less than 1 µm to 100 µm in size. However, the expected statistical distribution of the data was not described. In general, respirable or smaller size particles are most frequently reported. Laitinen et al. (1994) reported aerodynamic diameter sizes less than 4.7 µm for 88% of detected bacterial bioaerosols in WWTP. Bauer et al. (2002) reported that 99.99% of particles were less than 6.12 µm and 99.9% were less than 2 µm for bacterial and fungal bioaerosols, but did not describe a statistical distribution associated with the reported particle distributions. Bauer et al. (2002) noted that these results were not consistent with the particle sizes reported by Brandi et al. (2000 ) where 60% to 80% of bacterial bioaerosol particles were greater in size than 2.1 µm.
Advances in instrumentation capabilities provide greater precision in measurement of particle size while also allowing for simultaneous determination of viability for bioaerosol particles. Viable bioaerosol concentrations (using an ultraviolet-aerodynamic particle sizer [UV–APS]) were reported for multiple wastewater treatment process locations in a single plant, with the highest viable particle number greater than 2 µm in size (6,533 particles/m3) identified in the sludge thickening basin (Li et al., 2016). Lower particle numbers, from largest to smallest, were reported in the biological reaction
27
basin, office building, screen room, effluent outlet, and downwind plant outdoor boundary (Li et al., 2016). For particles 2 µm or smaller in size, the highest number of viable particles were found at the biological reaction basin (1,300 to 3,867 particles/m3) and the office building (1,133 to 3,667 particles/m3) (Li et al., 2016). The potential contribution of bacteria from office workers was identified as the likely reason for the larger proportion of smaller-sized particles in the office building (Li et al., 2016). For most sampling sites, fluorescent peaks of viable particles were identified in the 3 to 4 µm range leading Li et al. (2016) to hypothesize that the particles were reflective of aggregates of fungal or bacterial material. However, Li et al. (2016) did not report measurements that described the distance between the treatment processes and sample collection.
The selected analytical methods used to measure bioaerosol concentrations may affect the level of magnitude of reported concentrations. When analyses are selected that measure a large number of bacterial families (e.g., heterotrophic plate counts, mesophilic bacteria), bacterial bioaerosol counts reach their highest levels. Medema et al. (2004) reported heterotrophic bacteria plate count measures as high as approximately 106 microorganisms/m3 from raw sewage intake screens and near tricking filters. When using mesophilic group bacterial measurements, Sanchez-Monedero et al. (2008) identified a bioaerosol concentration of approximately 1000 cfu/m3 from pretreatment processes, and Fracchia et al. (2006) reported an equivalent order of magnitude measurement (3,370 cfu/m3) from the pretreatment grit chamber. Similarly, measurements of the Gram-negative bacteria group were also within the 103 cfu/m3 order of magnitude in the pretreatment area (i.e., sewage inflow, including primary screening and the grit collection tank) (Fracchia et al., 2006). In the context of potential emerging pathogens that may be introduced to a wastewater system, individual pathogen species may exhibit loadings that are considerably less than those described by analyses that measure multiple species or families of microorganisms.
The literature is inconsistent on whether higher capacity WWTP are associated with higher bioaerosol levels. Masclaux et al. (2014) reported no statistically significant differences between plant processing capacity and adenovirus bioaerosol concentration across a range of 31 WWTP in Switzerland that receive household waste (with the highest size category serving 50,000 inhabitants or more) and use an activated sludge treatment process. In contrast, Heinonen-Tanski et al. (2009) reported that higher levels of bacterial bioaerosols were identified in pretreatment areas of large- and medium-sized plants relative to smaller plants because the larger plants must operate their pretreatment systems longer to accommodate larger volumes of wastewater. In the Heinonen-Tanski et al. (2009) evaluation, Helsinki, Finland was the largest size plant with an influent volume of up to 267,000 m3/day and total culturable bacterial bioaerosol levels of 31.1 × 10³ cfu/m3. In contrast, Siilinjärvi, Finland was the smallest size plant with an influent volume of up to 200 m3/day influent volume and reported total culturable bacterial bioaerosol levels of 4.8 × 10³ cfu/m3. Brandi et al. (2000) also described higher levels of bioaerosol generation in larger versus smaller plants.
Generation of the highest bacterial bioaerosol levels is associated with wastewater treatment processes that have rapid movement, mechanical agitation, or forced aeration of wastewater (Pascual et al., 2003; Sanchez-Monedero et al., 2008). Though exceptions are identified for some sludge management processes, bacterial bioaerosol concentrations tend to decrease as the wastewater moves through the treatment process and bacterial loads progressively decrease (Fracchia et al., 2006). The higher levels of bioaerosols associated with sludge management are generated from more aggressive processing of materials (e.g., high turbulence, movement through rotating parts) that can result in a higher bioaerosol concentration even when a lower wastewater concentration is present. High levels

28
of bioaerosols may also be generated during maintenance activities due to the use of high-pressure water to clean screens or other treatment equipment (Heinonen-Tanski et al., 2009). Bacterial bioaerosol generation may also be elevated during high pressure cleaning activities, with maximum total bacterial levels identified at 104 cfu/m3 and total coliforms reported at 103 cfu/m3 (Haas et al., 2010). Bacterial bioaerosols in the range of 101 and 102 cfu/m3 for maintenance activities (e.g., screens, cleaning of sludge centrifuge) were reported for fecal coliforms and enterococci, respectively (Heinonen-Tanski et al., 2009). Medema et al. (2004) also reported heterotrophic plate count measurements of approximately 104.5 microorganisms/m3 for belt filter press cleaning activities.
Bauer et al. (2002) hypothesized that microorganisms were primarily transported from water to air during aeration processes in wastewater treatment. As noted earlier by Blanchard and Syzdek (1982) and Slote (1976), aerosol generation by the forcing of air bubbles upward through water allows for the potential concentration of bioaerosol microorganisms relative to wastewater source concentration. The raw sewage entry point and associated pretreatment processes are commonly identified as generating high levels of bioaerosols (Brandi et al., 2000; Fracchia et al., 2006; Karra and Katsivela, 2007; Heinonen-Tanski et al., 2009). Given the potential for use of covered clarifiers at the primary stage, this stage may also exhibit greater variability than other treatment stages when considering the presence or absence of covers that limit release of aerosols (Pascual et al., 2003). Other contributors to variability in bioaerosol generation in primary treatment may include exposed surface area, indoor versus outdoor placement of equipment, environmental conditions, settings of treatment equipment (e.g., clarifier rake arm speed).
The type of aeration process used for sludge management is a key determinant in the level of measured bioaerosol (Fracchia et al., 2006). Heinonen-Tanski et al. (2009) reported a positive correlation between the number of bioaerosolized microorganisms and the rate of water aeration. Fracchia et al. (2006) determined that mechanical aeration of sludge was associated with higher levels of bioaerosols than submerged microbubble systems or fixed film reactors (e.g., Brandi et al. [2000]; Bauer et al. [2002]; Fernando and Fedorak [2005]). Consistent with Sanchez-Monedero et al. (2008), Heinonen-Tanski et al. (2009) reported that aeration performed with a brush aerator or an air stripping aerator produced greater bioaerosol concentrations than a diffused aerator. Depending on the type of bacterial analysis performed, reported values ranged from single bacterial group (i.e., enterococci) measures of approximately 10 cfu/m3 (Heinonen-Tanski et al., 2009) to a heterotrophic plate count reflective of multiple bacterial families of up to 106 microorganisms/m3 (Medema et al., 2004).
When comparing bacterial bioaerosol concentrations at a WWTP that was converted from a coarse bubble aeration to a fine bubble aeration process, a significant decrease in bioaerosol concentration was identified where reported levels were similar to a background location (Fernando and Fedorak, 2005). In studies comparing bioaerosol concentrations across types of aeration, the use of diffused or fine bubble systems was also found to generate lower bioaerosol concentrations (Heinonen-Tanski et al., 2009) due to a less vigorous forced aeration of the water. In one of the highest mean mesophilic bacterial measurements identified for sludge management, Bauer et al. (2002) reported a concentration of 1.7 × 10⁴ cfu/m3 in an activated sludge system that used paddle mixers to stir the tank continuously.
In comparison with the available bacterial bioaerosol data, few published studies describe viral bioaerosol generation from WWTP processes (Masclaux et al., 2014). Masclaux et al. (2014)

29
evaluated bioaerosols of identified nonenveloped viruses (i.e., adenovirus, norovirus) and the enveloped virus (i.e., hepatitis E) using qPCR techniques. Samples were collected from 39 WWTP at various treatment stages, including raw wastewater inflow and bubbling aeration basins. Adenovirus was found frequently (84%) in 124 samples and aerosol concentrations were as high as 22.76 × 10⁵ viral particles/m3 (Masclaux et al., 2014). Hepatitis E was not detected, but low wastewater concentrations were identified as the reason for lack of detection in the aerosols (Masclaux et al., 2014). Heinonen-Tanski et al. (2009) reported somatic and f-specific coliphage aerosol concentrations, with the highest pretreatment geometric mean measurement reported for somatic coliphage of 137.8 pfu/m3 (raw wastewater pumping) and f-specific coliphage of 13.4 pfu/m3 (aerated fine screen grit removal). Medema et al. (2004) reported average f-specific RNA-phage bioaerosol concentrations as high as approximately 104 to 105 microorganisms/m3 at the intake screen for raw sewage and trickling filter process locations. Carducci et al. (2000) reported viral bioaerosol (of unspecified virus) in various pretreatment locations at an activated sludge plant as ranging from 4.51 × 10⁻⁴ most probable number (MPN)/L to 3.92 × 10⁻³ MPN/L. Slightly higher values were reported for an anaerobic sludge plant that ranged from 20.2 × 10⁻³ MPN/L to 17.2 × 10⁻³ MPN/L (Carducci et al., 2000).
Some WWTP bioaerosol concentration studies identified operational control measures to reduce the level of bioaerosol production from identified WWTP processes. Deployment of casing or additional covering of processes associated with generation of high levels of bioaerosols has been identified to reduce bioaerosol exposure levels of workers (Fernando and Fedorak, 2005; Heinonen-Tanski et al., 2009). Actions taken to reduce formation of odors by outdoor WWTP (i.e., covering outdoor grit tanks and primary settling tanks) are associated with measured reductions of bioaerosols (Fernando and Fedorak, 2005). Based on evaluations to determine emissions of bioaerosols relative to unit volumes of wastewater, Bauer et al. (2002) recommended that reductions in the surface area of the aeration tank could reduce the flux of bioaerosol emissions. In an approach designed to effectively limit the surface area of bulk wastewater exposed to air, Hung et al. (2010) reported E. coli bioaerosol reductions between 50% and 100% when polystyrene balls with diameters sizes of 1.9 to 4.7 cm were placed at the water surface of a laboratory-scale tank.
Few studies that reported bioaerosol concentration included measurement of wastewater concentrations, either at sewage entry to the plant or at various stages of treatment. However, two studies (Bauer et al., 2002; Karra and Katsivela, 2007) measured wastewater and bioaerosol at an individual treatment stage and then calculated emission factor values for bioaerosol generation from wastewater. Bauer et al. (2002) developed an aerosolization ratio to describe the order of magnitude difference between the mesophilic bacterial concentration of wastewater and bioaerosol that was generated. After converting to a common air and treated water volume of 1 m3, a nine to 11 order of magnitude difference between wastewater and bioaerosol concentration was identified at a fixed film reactor WWTP and the aeration tank of an activated sludge WWTP (Bauer et al., 2002). A five to seven order of magnitude difference was reported for fungi using the same process and sampling locations (Bauer et al., 2002). With the assumption that the aerosolization ratio is linear, the ratio can be interpreted to indicate that fairly high levels of mesophilic bacteria must be present in wastewater (e.g., 109 cfu or greater) before measurement of mesophilic bacteria results in detectable levels. Karra and Katsivela (2007) also evaluated relationships between bacterial group wastewater concentrations (i.e., heterotrophs, total coliforms, fecal coliforms, enterococci) and found that the measured bacterial group wastewater concentrations were at least 108 times greater than the bioaerosol concentration (e.g., total coliforms data of 1.6 ×10⁴ cfu/mL compared to 127 cfu/m3).

30
Medema et al. (2004) generated emission factors (i.e., ratio of the concentration in the air over the concentration in the water) using data from five WWTP plants in the Netherlands for identified treatment and maintenance processes. Water and bioaerosol samples were collected for heterotrophic plant count, coliform, f-specific RNA phage, and sulfite-reducing Clostridium spore analyses (Medema et al., 2004). Emission factor values were calculated for processes from which there were detections in both the wastewater and air media (Medema et al., 2004). As a result, emission factors for some biological groups, such as the viral f-specific RNA phage, are available for fewer processes than analyses with more frequent detections in both media (e.g., heterotrophic plant count data). The reported emission factors range across all evaluated processes for the four groups of microorganisms evaluated was approximately 10-4 to 10-10 (Medema et al., 2004). This range can be interpreted as an approximate four to 10 orders of magnitude difference between the bioaerosol concentration relative to the wastewater concentration. The highest emission factor values for an individual process were often derived for sulfite-reducing Clostridium spores (e.g., belt filter press operation, belt filter maintenance, and screening of raw wastewater). For other processes (e.g., aeration tank mixer operation, sludge screw pump, and the diffused aeration tank), the spore-based emission factor was less consistently identified as the highest emission factor value relative to other biological groups for a given process. Calculated emission factors for cleaning and operation of sludge dewatering belt filter presses were associated with higher values (ranging from 10-4 to 10-8) for all biological groups, with cleaning activities for the belt filter press associated with the highest emission factor range (i.e., approximate value of 10-4 to 10-6) across all biological groups. The operation of the belt filter press was associated with a calculated emission factor range of approximately 10-6 and 10-8 across multiple WWTP. Emission factors were calculated for the f-specific RNA phage for aeration tanks (i.e., approximately 10-8 to 10-10), press filtrate collar (e.g., approximately 10-8), belt filter press (i.e., 10-6), and belt filter press maintenance (i.e., 10-7) (Medema et al., 2004). Lower emission factor values for all biological groups were determined for other processes including aeration tanks, covered primary clarifiers, diffused aeration tanks, and discharge sludge screw pumps (i.e., 10-8 to 10-10) (Medema et al., 2004). The published ratio values may not be directly comparable across studies because of different approaches used to calculate the emission factors (e.g., adjustment by Bauer et al. (2002) to the units of 1 m3 treated wastewater). However, the ratios do indicate that some bacterial pathogens may need to be present at relatively high levels in wastewater to generate detectable levels of pathogens in bioaerosols.
4.3.3.2 Modeled Bioaerosol Data
Models have been developed to estimate bacterial or viral bioaerosol concentrations. In the Monte Carlo simulation developed to estimate EBOV risks to sewer workers, Haas et al. (2017) fit published data for mesophilic heterotrophic bacteria to a beta distribution (parameters: alpha = 2.3281 Log10, beta = 1.96512 Log10, range of -11.46 to -5.88 Log10) for the generation of a wastewater and bioaerosol partition coefficient (pathogens per m3 sewer headspace/pathogens per m3 wastewater). Mesophilic heterotrophic bacteria were selected based on the assumption that the hydrophobicities of the bacteria and EBOV would be equivalent when bacteria were reported in units of cfu and the EBOV reported in RNA copies (Haas et al., 2017). For data sets that lacked a reported wastewater concentration associated with the bioaerosol concentration, Haas et al. (2017) assumed a range of bacterial concentration of 1010 to 1012 cfu/m3, based on wastewater data identified in Hung et al. (2010).

31
Pascual et al. (2003) developed a global linear model to predict bacterial bioaerosol concentration based on daily inflow, wind speed, treatment stage, and bacterial type parameters. Karra and Katsivela (2007) compared predictions from the Pascual et al. (2003) model with sampling data and reported a difference of one to two orders of magnitude between measured values and model predictions. Given the variability and complexity of wastewater treatment systems, this level of agreement may be reasonable for a general model.
4.3.3.3 Summary of Bioaerosol Data and Potential Levels of Inhalation Doses
Table 4-3 identifies reported high and low measured bacterial bioaerosol concentrations (arithmetic or geometric mean) by WWTP process based on a review of published data (Brandi et al., 2000; Carducci et al., 2000; Bauer et al., 2002; Medema et al., 2004; Fernando and Fedorak, 2005; Fracchia et al., 2006; Karra and Katsivela, 2007; Sanchez-Monedero et al., 2008; Heinonen-Tanski et al., 2009; Haas et al., 2010). No values derived from modeling of WWTP bacterial bioaerosol concentrations were included in the identified ranges in Table 4-3. The low values represent the lowest quantified detection identified in the reviewed data. Data were reported for bacterial bioaerosol concentrations associated with raw wastewater inflow (Medema et al., 2004; Fracchia et al., 2006; Heinonen-Tanski et al., 2009), pretreatment or primary treatment (Carducci et al., 2000; Fernando and Fedorak, 2005; Fracchia et al., 2006; Karra and Katsivela, 2007; Sanchez-Monedero et al., 2008; Heinonen-Tanski et al., 2009), tertiary treatment (Sanchez-Monedero et al., 2008), sludge management (Carducci et al., 2000; Bauer et al., 2002; Medema et al., 2004; Sanchez-Monedero et al., 2008), and maintenance activities (Heinonen-Tanski et al., 2009; Haas et al., 2010). No data were identified for secondary treatment from these sources.
Consistent with the reviewed literature, mean bacterial bioaerosol concentrations exhibited multiple orders of magnitude difference within and across wastewater system activities (Table 4-3). The overall range in mean bioaerosol concentration across all WWTP processes was approximately 101 to 106 cfu/m3 (Table 4-3). Differences between the identified high and low bioaerosol concentration values in Table 4-3 for an individual wastewater process may be reflective of variable wastewater microorganism concentrations and differing processes for a given treatment stage, environmental conditions (e.g., indoor versus outdoor temperature), and choice of analysis with regard to the biological group being sampled.
The range of reported bioaerosol concentrations for an individual treatment stage often incorporates the influence of different treatment processes on resulting bacterial bioaerosol concentrations. For example, Fernando and Fedorak (2005) described significant differences in the potential bioaerosol generation between fine versus coarse bubble aeration in sludge management processes. Lower bioaerosol generation was reported in fine bubble aeration relative to mechanical aeration of sludge or course bubble aeration (Fernando and Fedorak, 2005).

32
Table 4-3. Range of Reported Bacterial Bioaerosol Concentrations from Identified Wastewater Treatment Processes and Maintenance Activities
Wastewater Treatment Process or
Maintenance Activity*
High Bioaerosol
Concentration(cfu/m3)
Low Bioaerosol
Concentration (cfu/m3)
Sources
Raw Wastewater Pumping or Inflow
1.78E+06 5.81E+01 High: Medema et al. (2004) Low: Heinonen-Tanski et al. (2009)
Pretreatment/PrimaryTreatment
3.73E+03 2.80E+01 High: Fracchia et al. (2006) Low: Karra and Katsivela (2007)
Tertiary Treatment 2.70E+03 2.70E+03 High: Sanchez-Monedero et al. (2008)Low: Sanchez-Monedero et al. (2008)
Sludge Management 1.70E+04 2.20E+01 High: Bauer et al. (2002) Low: Sanchez-Monedero et al. (2008)
Maintenance Activities 3.16E+04 1.27E+01 High: Medema et al. (2004) Low: Heinonen-Tanski et al. (2009)
Complete references are found at the end of the report. cfu – colony-forming unit(s) * No data identified for secondary treatment.
The analysis selected to report bioaerosol concentration is also an important determinant of the level of magnitude of the bioaerosol concentration for an individual wastewater process. For example, the reporting of analyses for measurement of the mesophilic bacteria group (e.g., Sanchez-Monedero et al. [2008], Fracchia et al. [2006]; Heinonen-Tanski et al. [2009]) or total culturable bacteria (e.g., Carducci et al. [2000]) tended to be associated with bacterial bioaerosol concentrations (103 cfu/m3 or greater). Mesophilic bacteria were also typically associated with higher values in the concentration range identified for a given wastewater treatment process. Given the known diversity of bacterial species present in wastewater, measurement values based on large groups of bacterial versus individual species may exhibit higher wastewater and bioaerosol concentrations. Additionally, the ability to use these data in a predictive fashion to estimate bioaerosols may be limited by the implicit assumption that the relative ratios of individual bacteria species or groups in the measurement data remain generally consistent between the original measurement and application locations.
Table 4-4 identifies the ranges of mean nonenveloped viral bioaerosol concentrations by individual WWTP activity for measurements using culture-based assays in a review of published data (Carducci et al., 2000); Medema et al. (2004); (Heinonen-Tanski et al., 2009). No values derived from modeling of WWTP viral bioaerosol concentrations were included in the identified ranges in Table 4-4. Data were reported for raw wastewater pumping (Medema et al., 2004; Heinonen-Tanski et al., 2009), pretreatment or primary treatment (Carducci et al., 2000; Heinonen-Tanski et al., 2009), and sludge management (Carducci et al., 2000; Medema et al., 2004). No data were identified for secondary treatment, tertiary treatment, and maintenance activities from these sources. No viral bioaerosol data from measurement of enveloped viruses in a WWTP process were identified. The data in Table 4-4 are derived from culture-based assays, which are reported in units of pfu or MPN. Though not identified in Table 4-4, Masclaux et al. (2014) reported qPCR aerosol concentrations as high as 22.76 × 10⁵ viral particles/m3 for adenovirus.

33
Table 4-4. Range of Reported Viral Bioaerosol Concentrations from Identified Wastewater Treatment Processes
Wastewater Treatment Process or
Maintenance Activity*
High Bioaerosol
Concentration (pfu/m3 or MPN/m3)
Low Bioaerosol
Concentration(pfu/m3 or MPN/m3)
Sources
Raw Wastewater Pumping
3.2E+04 1.4E+02 High: Medema et al. (2004) Low: Heinonen-Tanski et al. (2009)
Pretreatment/PrimaryTreatment
1.7E+01 4.5E-01 High: Carducci et al. (2000)
Low: Carducci et al. (2000)
Sludge Management 1.0E+03 8.0E+00 High: Medema et al. (2004)
Low: Heinonen-Tanski et al.(2009)
Complete references are found at the end of the report. MPN – most probable number; pfu – plaque-forming unit(s) * No data identified for secondary treatment, tertiary treatment, and maintenance activities.
Using the reported bioaerosol concentration data for bacteria (Table 4-3) and viruses (Table 4-4), a range of potential exposure doses were calculated for a high bioaerosol concentration value (1E+06 cfu or pfu/m3) and a low bioaerosol concentration value (1E+01 cfu or pfu/m3) (Table 4-5). The reported bacterial bioaerosol data ranged from approximately 101 to approximately 106 cfu/m3 when all wastewater activities were considered (Table 4-3). The highest value in the bacterial range (106 cfu/m3) is slightly higher than the highest value for viral bioaerosol in Table 4-4. However, Masclaux et al. (2014) reported a viral bioaerosol value of 2.27 × 10⁶ adenovirus viral particles/m3
that was not included in Table 4-4 because the measurement was generated by polymerase chain reaction (PCR). A PCR-based measurement of adenovirus could be reasonably considered an upper bound estimate of bioaerosol concentration due to the hardiness of the virus and presumed reduced susceptibility to shear stress during aerosolization. As a result, the Masclaux et al. (2014) value is assumed to be equivalent to a viable virus enumeration of 2.27 × 10⁶ pfu/m3 and provides support for the identification of a potential upper range value of 106 pfu/m3 for viral bioaerosol concentration.
To estimate inhalation exposure from the hypothesized range of bacterial and viral bioaerosol concentration (i.e., 1E+06 to 1E+01), an inhalation rate (2.9E-2 m3/minute) is assumed and inhaled doses are calculated for three specified exposure durations (i.e., 10 minutes, 60 minutes, and 8 hours) (Table 4-5). Given the uncertainty in the bioaerosol concentration range values, a simplified calculation was used to calculate potential inhalation doses for and factors that may affect inhalation dose (e.g., particle size, placement of receptor of exposure relative to bioaerosol source) were not considered. The inhalation dose is calculated by multiplying the bioaerosol concentration value by the inhalation rate and exposure duration. The inhalation rate of 2.9E-2 m3/minute is identified from EPA’s Exposure Factors Handbook (U.S. Environmental Protection Agency, 2011) and is appropriate for short-term exposures of individuals 21 to <61 years of age. Calculated inhaled doses ranged from approximately 100.5 to 107 pfu for the range of exposure durations from 10 minutes to 8 hours of exposure (Table 4-5).

34
Table 4-5. Estimated Bioaerosol Concentration Range for Bacterial or Viral Wastewater Pathogens with Inhaled Doses for 10 Minutes, 60 Minutes, and 8 Hours
Bioaerosol Concentration
Range (cfu or pfu/m3)
Total Inhalation Dose
10 Minutes (cfu or pfu/m3)
Total Inhalation Dose
60 minutes (cfu or pfu/m3)
Total Inhalation Dose
8 hours (cfu or pfu/m3)
1E+06 2.90E+05 1.74E+06 1.39E+07
1E+01 2.90E+00 1.74E+01 1.39E+02
cfu – colony-forming unit(s); pfu – plaque-forming unit(s) Table 4-5 provides estimates for the potential inhalation dose from bioaerosols generated in a wastewater system. Section 4.3.3 reviewed the available data for bioaerosol generated and described significant data gaps in available data to describe bioaerosol generation in wastewater systems (e.g., lack of data for enveloped viruses, lack of data for all treatments stages, data for individual treatment processes). As a result, the estimated inhalation doses should be recognized as possessing significant qualitative uncertainty. However, the calculated doses provide an estimate of the range of order of magnitude exposure levels for individuals who may have contact with pathogens present in wastewater systems.
5 Challenges to Performance of Quantitative Microbial Exposure Assessment
The findings of the literature review highlight data gaps in two key areas: (1) viability-based pathogen shedding data from infected individuals, and (2) fate and transport data for pathogens in wastewater systems, especially for enveloped viruses. These data gaps greatly limit access to the quantitative data necessary to describe pathogen entry into the wastewater system, predict fate and transport, and calculate exposure levels.
To quantify the initial loading of pathogens into the wastewater system, pathogen shedding measurements are necessary to determine the number of viable pathogens. Most available pathogen loading data are derived from molecular-based measurements (e.g., genomic copies). Molecular-based analytical tools do not assess the presence of viable, infective pathogens; they only report the presence of genomic copies or specific genomic segments. Since the original purpose of the data was to inform medical decision-making in a clinical or hospital setting, they were not generated to be directly used in exposure assessment. The lack of pathogen shedding data that describes viable pathogen number affects the generation of multiple downstream parameter values that are necessary to perform a quantitative exposure assessment: the initial pathogen wastewater concentration, pathogen wastewater concentrations at individual unit operations of the treatment processes, and the resulting bioaerosol concentrations. As a result, the lack of initial pathogen loading has the potential to significantly affect the reliability of all elements of an exposure assessment.
It has been suggested that the use of qPCR-based measurements may provide a “conservative estimate of risk” for environmental media lacking data on pathogen loadings, with the acknowledgement that the actual level of conservatism is unknown (Viau and Peccia, 2009). One desirable feature of qPCR measurements is that they are not likely to underestimate the loading of viable and infective pathogens (Viau and Peccia, 2009). However, the magnitude of conservatism may be highly variable across pathogens and environmental scenarios. It is also important to

35
recognize that there may also be issues associated with comparability across commonly used molecular measurements. For example, there are no standardized assays in place for EBOV that would facilitate quantitative comparisons in reported viral loads generated using real-time reverse-transcription polymerase chain reaction (rRT-PCR) measurements (Vetter et al., 2017).
The difference in measurement results obtained by molecular-based approaches and viability-based approaches relative to the actual pathogen number is not well understood for current wastewater pathogens. Given the complexity of the wastewater medium and the diverse range of environmental conditions associated with wastewater systems, interactions between the medium and environment (i.e., medium-environment interactions) may have the potential to significantly affect culturability in culture-based methods and/or introduce interferences or inhibitions into molecular-based methods. In the wastewater medium, variability can be present in pathogen type and loading, general chemistry (e.g., pH), and the presence and type of solid particles. The environment in which the wastewater is present can exhibit variability in temperature, relative humidity, air flow, wastewater plant operations, and other characteristics that may affect measurements from wastewater, the surrounding air, or surfaces. Because of this variability, interactions between the medium and environment may not affect culture- and molecular-based methods in a consistent manner within or across wastewater system settings. This will likely preclude the identification of a single adjustment factor that may be universally applied to relate molecular-based method results to culture-based results for all treatment systems and media. A greater understanding of conditions that increase or decrease the likelihood of culturability relative to molecular presence must be present before generalizations can be reliably made.
The second key data gap is the lack of basic fate and transport data for pathogens and associated biological groups of interest in the wastewater system. Research on fate and transport of pathogens that enter the wastewater system focuses on bacteria and enteric viruses, though quantitative data describing persistence and fate for estimation of bioaerosol generation and concentration are scarce. The scarcity of data for enveloped viruses results from the significant analytical difficulty associated with the recovery and enumeration of enveloped viruses in the wastewater, especially when derived from fecal sources (Wigginton et al., 2015). While there are some recent advances in the development of virus recovery methods (e.g., Ye et al. [2016]) for wastewater resulting from work initiated after the 2014-2015 EVD outbreak, the current body of available data is still insufficient to perform a quantitative exposure assessment. Given that the vast majority of emerging pathogens over the past 25 years are enveloped viruses, there is a mismatch between desired quantitative data and the technical capability to rapidly generate needed data sets. As a result, the estimation of bioaerosol concentration generated from a wastewater collection or treatment process exhibits very high uncertainty for bacterial and enteric viruses. Of greatest importance, published data that quantitatively describe the basic fate and transport behavior of enveloped viruses or bacterial spores in a wastewater system are not identified.
The lack of data on viable pathogen in waste – along with the identified analytical challenges for downstream fate and transport measurements for pathogens in all relevant exposure media in the wastewater system – significantly limit the ability to perform a quantitative microbial exposure assessment. So, lacking data, any comprehensive analysis must necessarily incorporate assumptions regarding fate and transport and regarding potential exposure. As a result, a qualitative screening process is necessary to provide a robust evaluation that can incorporate quantitative data and necessary assumptions.

36
6 Overview of Screening Process
A qualitative screening process is presented to identify pathogens with the potential to pose a serious human health threat if individuals were to be exposed to them from a wastewater system. The screening process will address the following two questions:
• Does the pathogen have the potential to exhibit HCP disease transmission characteristics in a wastewater system?
• Is the HCP likely to generate VEP for individuals that contact the pathogen in the wastewater system?
Given the recognized difficulty of performance of a quantitative microbial exposure assessment for emerging pathogens, the assessment is designed with pathogens and leverages available quantitative data to inform the process.
The following subsections describe the conceptual exposure model for pathogen exposure from the wastewater system (Section 6.1) and the screening process (Section 6.2). A framework is provided to describe data used to bridge identified data gaps for key fate and transport characteristics (Section 6.2.4). Relevant considerations for fate and transport of pathogens in wastewater are also identified (Section 6.2.4). Case studies are then presented to demonstrate the use of the screening process for the EBOV (Section 7) and spore form of B. anthracis (Section 8).
6.1 Conceptual Exposure Model for Exposure in the Wastewater System
A conceptual exposure model is presented to describe pathogen fate, transport, and exposure pathways for pathogens present in the wastewater system (Figure 6-1). Complete exposure pathways are defined to include a source or source-releasing mechanism, transport if present, exposure medium, receptor, and route(s) of exposure. Sources for introduction of pathogens that enter the wastewater system are: (1) infected individuals that shed viable pathogens in bodily wastes (i.e., defined as urine, feces, vomit) that are collected in the toilet and (2) intentionally generated pathogens that enter the system from illicit activity, management of decontamination of wastewater generated during a biological agent incident, and surface runoff from contaminated surfaces into the wastewater collection system. Surface runoff with pathogens can be introduced after a wide-area biological agent incident followed by rainfall that carries pathogens into a combined sewer system or from infiltration of sewer lines. The receptors of interest are the residential individuals who use and flush the toilet and the WWTP worker that may contact wastewater treatment processes during potential maintenance activities. Exposure from the toilet can occur in residential, medical, or other facilities. There are also opportunities for exposure to the general public and WWTP workers from uncontained releases of wastewater (e.g., sewer main break).
Pathogens can be released from activities that are defined to include collection of wastewater (i.e., toilet flush for residential exposure), maintenance or overflow events during wastewater transit, and during wastewater treatment processes (i.e., pretreatment, primary treatment, secondary treatment, tertiary treatment, and sludge management). Source-releasing mechanisms include the splash or aerosolization of toilet bowl contents resulting from water movement during the toilet flush, wastewater treatment processes, overflow events, maintenance activities, and equipment malfunctions.

37
Figure 6-1. Conceptual exposure model for pathogen exposure during wastewater collection and treatment.

38
Reported particle size measurements of toilet flush and wastewater treatment bioaerosols indicate the potential for a wide range of particle sizes. Particle size is important to assessing the fate and exposure potential of bioaerosol particles. Most mean or measured particle size peaks are reported to be less than 5 µm, but reported distributions include a size range inclusive of large droplet-sized particles (Sections 4.3.2 and 4.3.3). Though there is not a universally accepted nomenclature for particle sizes, the following particle size categories have been identified: respirable particles (i.e., aerodynamic diameter < 10 µm), inhalable particles (i.e., aerodynamic diameter between 10 µm and 100 µm), and large droplets6 (i.e., aerodynamic diameter > 100 µm) (Weber and Stilianakis, 2008). Respirable-sized particles are primarily associated with respiratory transmission (also termed airborne transmission) (Weber and Stilianakis, 2008) for pathogens that exhibit obligate, preferential, or opportunistic respiratory transmission as defined by Roy and Milton (2004).
Inhalable particles are generally associated with disease transmission through inhalation, particle contact with mucous membranes, or subsequent contact with fomites (i.e., contaminated surfaces where particles land), whereas large droplets are associated with disease transmission through particle contact with mucous membranes or fomites (Weber and Stilianakis, 2008). However, all particle sizes may ultimately contribute to biological contamination of surfaces to which receptors may have exposure if the microorganism remains viable for the duration of the particle settling time through receptor exposure.
The distinguishing characteristics of the large droplet relative to respirable or inhalable particle is the relatively larger size of the droplet and an increased likelihood of rapid settling on a surface (Siegel et al., 2007). It is important to acknowledge that the settling time for a large droplet can be relatively short in stagnant air. For example, a 10µm particle has a settling time of 491 seconds over a 1.5 m height (Weber and Stilianakis, 2008). The presence of air currents in the location of particle release may facilitate longer airborne suspension times, especially in enclosed building spaces (Fernstrom and Goldblatt, 2013). As a result, there can be potentially short airborne transport distances (e.g., up to 10 feet for human respiratory droplets), though it is noted that pathogen-specific or environmental conditions (e.g., temperature, relative humidity, dispersed or aggregated states of pathogens) can be important determinants of the transport distance (Siegel et al., 2007).
Based on the identified potential exposure pathways associated with the source-releasing mechanisms of bioaerosol generation and wastewater splash identified in Sections 4.3.2 and 4.3.3, the potential routes of exposure include: inhalation of bioaerosols (including possible incidental ingestion of larger-sized inhaled particles); ocular, oral, and dermal exposure from contact with wastewater (e.g., splash or drenching); and ocular, oral, and dermal exposure from contamination of hands after touching fomites. The conceptual exposure model indicates that a complete exposure pathway to pathogens in the wastewater system will be present when at least one of the following conditions is met: (1) pathogens persist in wastewater until exposure to wastewater or surfaces contaminated by splashed wastewater, and (2) pathogens are shed in bodily waste and form viable bioaerosols from a toilet flush or remain viable in wastewater
6 The term droplet is referencing toilet bowl content- or wastewater-derived particles and is not defined to include respiratory droplets generated from the respiratory tract of an infected individual.

39
through viable bioaerosol formation that results in inhalation exposure or contact with pathogen from deposited particles on a surface.
6.2 Elements of Screening Process
The conceptual exposure model identifies the potentially complete exposure pathways for pathogens that are introduced to the wastewater system. The screening process then leverages the knowledge gained from the conceptual exposure model to determine if emerging pathogens have the disease transmission potential to be HCP and to exhibit VEP in the wastewater system. To conduct this assessment, pathogen-specific disease transmission potential (Section 6.2.1) is evaluated relative to pathogen-specific fate and transport characteristics (Sections 6.2.2 and 6.2.3) to determine the presence of complete exposure pathways in the wastewater system that may transmit disease. The fate and transport evaluation in the screening process is based on the conceptual exposure model finding that the presence of a complete exposure pathway requires at least one of the following pathogen fate and transport conditions: (1) the persistence of pathogen in wastewater or surfaces until exposure or (2) formation of viable bioaerosol from the toilet flush or wastewater system processes.
Figure 6-2 provides a flow chart to identify the sequence of screening questions and answers that are associated with determination of the presence or absence of VEP(s) for the wastewater system. The screening questions were generated from known or suspected modes of disease transmission for wastewater pathogens (Section 3) and the potential exposure pathways indicated in the conceptual exposure model (Section 6.1). The first question determines whether the pathogen exhibits characteristics that could be associated with disease transmission in a wastewater system. If disease transmission is not documented to occur from any of the routes of exposure identified in the conceptual exposure model (Figure 6-1), there can be no VEP present. Once an emerging pathogen is determined to be an HCP, the process then evaluates for the presence of complete exposure pathways associated with routes of exposure that exhibit confirmed disease transmission. The determination of a complete exposure pathways is based on the fate and transport characteristics assumed for the emerging pathogen.
There are several assumptions that were made to develop the screening process from the conceptual exposure model. Table 6-1 identifies the assumptions, the basis for each assumption, affected exposure pathways, and the uncertainty associated with the assumption. For example, the assumption that viable pathogens are shed in bodily fluids based on the molecular confirmation of the presence of detected generic material or sequences was selected as a conservative option to address the uncertainty associated with this parameter.

40
Figure 6-2. Flow chart for screening process for a high-consequence pathogen (HCP).

41
Table 6-1. Assumptions Incorporated in Screening Process
Assumption Basis for Assumption Source
Exposure Pathways Affected
Uncertainty Associated with Assumption
Shedding of viable pathogens in bodily fluid is assumed when there are culture-positive or PCR-positive measurements from bodily fluids.
Scarce data are available for culture-based measures in bodily fluids, especially in feces and vomit. The conservative assumption was selected to ensure that the assumption does not underestimate the number of infective pathogens.
Toilet flush or Wastewater collection and treatment
inhalation, incidental ingestion, and contact with ocular or oral mucous membranes and skin
PCR-positive measurements may be from non-viable or non-infective pathogens – assumption will overestimate the number of pathogens. Viable but non-culturable pathogens may provide for an underestimate of infectious pathogen numbers.
Pathogens that persist in wastewater and deposited wastewater droplet for a minimal period of time (e.g., give minutes) remain viability for exposure.
There is the potential for receptor exposure immediately after a splash, other contact with wastewater or deposited droplets.
Toilet flush or Wastewater collection and treatment
incidental ingestion and contact with ocular or oral mucous membranes and skin
Potential losses in pathogen numbers from reduced survival over time is not captured in the screening process. This may contribute to an overestimate of the potential for exposure in the screening process.
No losses in viable bioaerosol assumed in screening model if detected after aerosolization.
No losses in aerosolized bioaerosol were assumed because of the potential for receptor exposure immediately after generation of the bioaerosol.
Toilet flush or Wastewater collection and treatment
Potential losses in pathogen numbers from reduced survival over time is not captured in the screening process. This may contribute to

42
Assumption Basis for Assumption Source
Exposure Pathways Affected
Uncertainty Associated with Assumption an overestimate of the potential for exposure in the screening process.
Data for fate and transport characteristics are only necessary for the limited duration of time between wastewater collection and completion of treatment.
To ensure the utility of the screening process, detailed analyses of persistence in wastewater is not necessary. Data are sufficient that can cover time between wastewater collection and completion of treatment.
Toilet flush or Wastewater collection and treatment
inhalation, incidental ingestion, and contact with ocular or oral mucous membranes and skin
There is no uncertainty associated with this assumption as long as the total time for collection, transit, and treatment are well characterized.
6.2.1 Pathogen Disease Transmission Characteristics All three of the following disease transmission characteristics must be present to determine that a pathogen will exhibit HCP characteristics in a wastewater system:
• Shedding of viable pathogen in feces, urine, or vomit associated with infection in the human or relevant animal model, or other means of entry to the wastewater treatment systems (e.g., decontamination wastewater),
• Disease transmission from acute exposure in the human or relevant animal model for at least one of the following routes of exposure: inhalation of bioaerosol, dermal contact, incidental ingestion, ocular or oral mucous membrane contact, and
• Severe or lethal illness resulting from the routes of exposure identified in the wastewater system.
The conceptual exposure model identified the following routes of exposure for pathogens in the wastewater system: inhalation of bioaerosol; dermal contact; incidental ingestion; and ocular, oral, or other mucous membrane contact. For a pathogen to obtain an affirmative answer to the disease transmission question, only one of the identified routes of exposure needs to be present. However, exposure routes for which there are no data should be noted as potential uncertainties in the overall assessment.

43
6.2.2 Pathogen Potential to Persist in Wastewater or Deposited Droplet For a complete pathway of exposure for pathogens in wastewater, the pathogen must persist in wastewater until the time of exposure, until contact with the wastewater (in the form of bulk wastewater or splashes), or until contact with aerosols, droplets, or deposited wastewater particles on surfaces. The time between collection of pathogen-containing waste and exposure of the receptor varies and depends on where in the collection and treatment systems that the point of contact is located. The flush of the toilet is the only event where the timing from introduction to the collection system is known as it can be assumed to occur immediately after pathogen-containing waste enters the toilet. After the flush of the toilet, additional contact events for the public and WWTP workers may vary unpredictably in timing. The public and workers may be exposed to untreated wastewater (e.g., collection or pumping station repair, sewer main break), and workers may also be exposed to partially treated wastewater at later points in the wastewater system.
Wastewater typically exhibits a short transit time to the WWTP that can range from a minimum of minutes (e.g., one to 10) (Ort et al., 2010) to approximately 24 hours or less (U.S. Environmental Protection Agency, 1980). The actual transit time is dependent on the layout of the collection system (U.S. Environmental Protection Agency, 1980) and placement of the toilet within the overall system. As a result, there may be significant variability in the timing of exposure accompanied by uncertainty in the exposure duration for an individual receptor. Since the screening process is designed to evaluate potential exposures throughout the collection and treatment process, the screening process assumes that an HCP does not require extended persistence to provide a potential for exposure.
Given these conditions, the following pathogen characteristic is necessary for an HCP to exhibit persistence in wastewater or persistence when deposited on surfaces from a wastewater splash or bioaerosol:
• Data that report persistence in wastewater or after surface deposition for a minimal period of time (e.g., five minutes).
6.2.3 Pathogen Potential to Form Viable Bioaerosols The formation of a viable bioaerosol is necessary for a complete exposure pathway for inhalation of HCP from the toilet flush or wastewater treatment. For complete inhalation pathways in these scenarios, the pathogen must persist until the time of initial aerosolization and then form a viable bioaerosol. Formation of a viable bioaerosol is also a source-releasing mechanism by which wastewater can be deposited on surfaces for subsequent contact with hands and/or inoculation of oral or ocular mucous membranes.
Viable bioaerosols are defined by the presence of airborne pathogens that survive the aerosolization process and retain sufficient infectivity to allow for detection and measurement. The persistence time of the viable bioaerosol is not emphasized as a determinant of inhalation exposure because there is the potential for WWTP worker or toilet user contact with bioaerosol immediately after generation. The formation of a viable bioaerosol is a function of compatibility between the physical structure of the microorganism, the mechanism generating the aerosol, and the release environment (e.g., temperature, relative humidity). The review of published bioaerosol data in Section 4.3 documents that bioaerosols from bacterial or viral biological

44
groups can be generated by toilet and wastewater system processes. As a result, the evaluation of the potential to form viable bioaerosols focuses on pathogen-specific aspects related to the aerosolization mechanisms (e.g., bubble-burst mechanism with jet droplet formation) associated with wastewater systems.
Three simplifying assumptions have been made in the development of the screening process. The first assumption is that viable pathogens shed in bodily waste retain viability until at least the time of the toilet bowl flush. A second assumption is that detection and measurement of aerosolized pathogens is sufficient to document their potential for exposure; the screening process does not assume any decay or inactivation of pathogens after aerosolization. By definition, an HCP allows for the potential of disease transmission from pathogen exposure of short exposure durations. Therefore, the screening process has assumed that viability sufficient to allow measurement of bioaerosol formation identifies appropriate conditions for potential inhalation exposure. The third assumption is that biological group-level data may be used to describe the propensity of emerging pathogens to form viable bioaerosols from identified aerosolization mechanisms when emerging pathogen data are unavailable. A specific biological group taxonomy is not recommended for use in the screening process, instead the characteristics of the target pathogen most relevant to formation of viable bioaerosols should be considered. Examples of possible categories and rationale include mycobacteria (i.e., to reflect highly hydrophobic vegetative bacteria), Gram-negative bacteria (i.e., to reflect higher levels of hydrophobicity relative to Gram-positive bacteria), and enveloped viruses (i.e., to reflect higher levels of hydrophobicity and potential susceptibility to shear stress exposure to the envelope). The rationale for the evaluation of biological groups is that similarities in physical-chemical structure, by which the biological groups are identified, may be associated with similarities in likelihood to form viable bioaerosols. As described in Section 4.3, data describing aerosolization are scarce for many potential target pathogens, especially enveloped viruses.
The following characteristic is necessary for an HCP to be considered to form viable bioaerosols from the toilet flush or wastewater system:
• Measured bioaerosol data for the emerging pathogen or potential surrogate from wastewater or a similar medium with an aerosolization mechanism consistent with a toilet flush (e.g., bubble-burst mechanism) or wastewater treatment (e.g., aeration-associated bubble-burst mechanism).
6.2.4 Bridging Pathogen-specific Data Gaps for Fate and Transport Based on the conceptual exposure model presented in Section 6.1, key fate and transport data to estimate human exposure in the wastewater system are: (1) persistence in bulk wastewater, deposited wastewater aerosol particles, or wastewater splash deposited on surfaces present in the wastewater system (e.g., nonporous bathroom counter, nonporous work surfaces with potential for hand contact), and (2) propensity to produce viable bioaerosols during the collection or treatment process. However, these data gaps limit the ability to perform a quantitative exposure assessment for many potential emerging pathogens in the wastewater system (Section 5) and may also contribute to difficulties in performance of the screening process. To maximize utility

45
of the screening process for data-poor pathogens, a framework using customized terminology is provided to identify and transparently describe the surrogate data used to fill identified data gaps.
The evaluation of surrogate data through the screening process should consider two areas: (1) characteristics of the microorganism that may affect fate and transport relative to the target pathogen, and (2) medium and environmental characteristics of test conditions relative to conditions in the wastewater system. The evaluation assumes that key inferences on data suitability can be derived from an evaluation of the type of microorganism (e.g., enveloped versus nonenveloped virus, single- versus double-stranded RNA) and test conditions (e.g., raw iversus sterilized wastewater, temperature of wastewater).
The screening process utilizes the Sinclair et al. (2012) identification of surrogate selection considerations when evaluating environmental pathogen fate and transport, with some modification to better reflect the wastewater system. The term ‘target pathogen’ is retained as it was originally described in Sinclair et al. (2012). As shown in Table 6-1, the term “target pathogen” is used here to mean a pathogen of interest for which the ability to perform screen process or exposure assessment is limited by a lack of data regarding the fate and transport of the pathogen. The concept of environmental attributes is maintained as originally described in Sinclair et al. (2012), i.e., the common parameters of the environment which the pathogen inhabits or the engineered or natural system under study. However, the environmental attributes concept is further developed to accommodate anticipated data gaps for pathogens in the wastewater system. Three additional terms are defined for use in the screening process: surrogate, benchmark indicator, and benchmark conditions (Table 6-1).
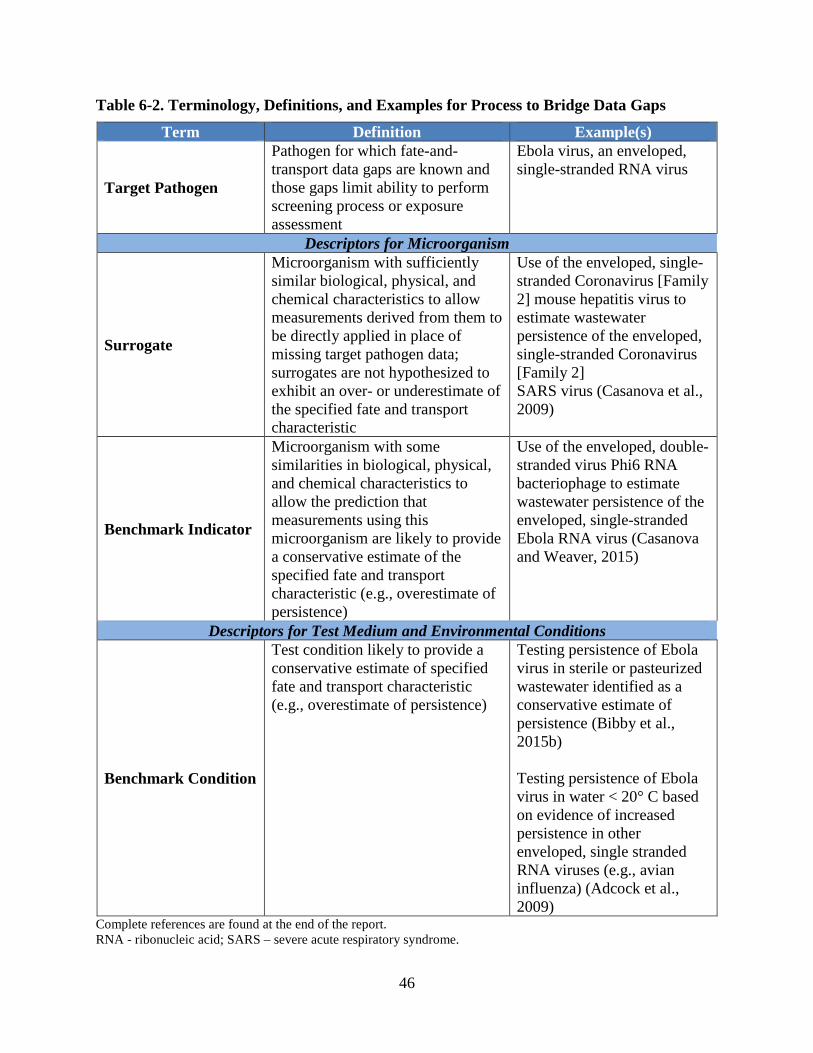
46
Table 6-2. Terminology, Definitions, and Examples for Process to Bridge Data Gaps
Term Definition Example(s)
Target Pathogen
Pathogen for which fate-and-transport data gaps are known and those gaps limit ability to perform screening process or exposure assessment
Ebola virus, an enveloped, single-stranded RNA virus
Descriptors for Microorganism
Surrogate
Microorganism with sufficiently similar biological, physical, and chemical characteristics to allow measurements derived from them to be directly applied in place of missing target pathogen data; surrogates are not hypothesized to exhibit an over- or underestimate of the specified fate and transport characteristic
Use of the enveloped, single-stranded Coronavirus [Family 2] mouse hepatitis virus to estimate wastewater persistence of the enveloped, single-stranded Coronavirus [Family 2] SARS virus (Casanova et al., 2009)
Benchmark Indicator
Microorganism with some similarities in biological, physical, and chemical characteristics to allow the prediction that measurements using this microorganism are likely to provide a conservative estimate of the specified fate and transport characteristic (e.g., overestimate of persistence)
Use of the enveloped, double-stranded virus Phi6 RNA bacteriophage to estimate wastewater persistence of the enveloped, single-stranded Ebola RNA virus (Casanova and Weaver, 2015)
Descriptors for Test Medium and Environmental Conditions
Benchmark Condition
Test condition likely to provide a conservative estimate of specified fate and transport characteristic (e.g., overestimate of persistence)
Testing persistence of Ebola virus in sterile or pasteurized wastewater identified as a conservative estimate of persistence (Bibby et al., 2015b) Testing persistence of Ebola virus in water < 20° C based on evidence of increased persistence in other enveloped, single stranded RNA viruses (e.g., avian influenza) (Adcock et al., 2009)
Complete references are found at the end of the report. RNA - ribonucleic acid; SARS – severe acute respiratory syndrome.

47
The terminology is designed to convey relevant differences between the microorganism(s) and test condition(s) associated with available data relative to the wastewater system conditions where it will be applied. As a result, the terminology describes the microorganism and environmental conditions relative to their likelihood to over- or underestimate the fate and transport characteristic. The categorization of surrogate data should also aid in clearly describing the rationale for hypothesized differences in fate and transport relative to the target pathogen. The term surrogate7 is generally defined as data that are used to fill an identified data gap during defined environmental conditions. For the screening process, a surrogate is defined as a microorganism with similar biological, physical, and chemical features that allow measurements derived from the microorganism to be directly applied in place of the missing target pathogen data under similar environmental conditions. Surrogates can be determined by matching the biological attributes relevant to fate and transport for both the surrogate microorganism and target pathogen, with the accompanying determination that there are also no known mechanisms by which the fate and transport characteristics may differ. Surrogate selection should focus on estimates that describe exposure for a limited number of days for wastewater contact or immediately after aerosolization for the toilet flush and wastewater contact. Relevant data sets do not need to estimate the longest possible persistence time or describe kinetics of persistence. The screening model incorporates the assumption that data only need to reliably describe persistence for the limited duration of time between wastewater collection and completion of treatment time.
The general approach of surrogate selection described by Sinclair et al. (2012) should be used in the screening process. Surrogates should be identified based on an evaluation of the biological attributes of the target pathogen that are relevant for fate and transport in the relevant environment (i.e., wastewater system) (Sinclair et al., 2012). Relevant biological attributes include genetics and taxonomy, fundamental morphology, hydrophobicity and isoelectric point, and preparation of organisms (Sinclair et al., 2012). However, genetic and taxonomic elements should not be overly relied upon to the exclusion of actual biological, physical, or chemical features that may have greater utility (Sinclair et al., 2012). The selection of surrogates for emerging pathogens may be associated with higher levels of uncertainty from both lack of biological group data for likely emerging pathogens (e.g., enveloped viruses) as well as general fate and transport data gaps for microorganisms in the wastewater system environment. As a result, surrogates selected for emerging pathogens may provide estimates that may differ from the target pathogen by multiple orders of magnitude.
Similar to the concept of benchmarking described by Sinclair et al. (2012), two additional terms are defined for use in the screening process. The first term, benchmark indicator, is defined as a microorganism that will provide an overestimate of the fate and transport characteristic of interest and therefore generate a more conservative estimate of exposure relative to the target pathogen. The term surrogate is reserved for only those microorganisms for which the data are directly applicable based on biological similarity to the target pathogen. It is not intended for use for microorganisms that are known to be likely to overestimate or to underestimate the fate and transport characteristic of interest. As an example, nonenveloped enteric viruses are acknowledged to exhibit greater resistance to the stresses of aerosolization than enveloped viruses. Specifically, Casanova and Weaver (2015) hypothesize that the presence of a double- 7 The term indicator or simulant is often used in the wastewater treatment community to describe a biological agent that predicts the fate and behavior of an identified pathogen.

48
stranded DNA or RNA virus enveloped virus (e.g., Phi6 bacteriophage) may be more stable in water and exhibit longer persistence than a single-stranded enveloped virus (e.g., EBOV, SARS, avian influenza). This hypothesis is supported by Decrey et al. (2016) who reported potentially lower resistance to stressors exhibited by single-stranded RNA viruses in human waste when compared to double-stranded RNA viruses and single- or double-stranded DNA viruses. However, Decrey et al. (2016) also reported observations from stored human waste that did not have the addition of gray or flush water more typical of wastewater. The Phi6 bacteriophage, identified as a conservative surrogate for enveloped viruses by Casanova and Weaver (2015), would be considered a benchmark indicator in the screening process. In contrast, the single-stranded enveloped virus murine hepatitis virus (MHV) evaluated in the persistence studies reported by Ye et al. (2016) could be considered a surrogate for enveloped viruses in the screening process with other elements of comparison remaining consistent.
The second term, benchmark condition, describes a test environment (i.e., combination of testing medium and environmental conditions) that provides a more challenging situation for the target pathogen relative to the identified fate and transport characteristic than the wastewater system environment in which the data will be applied. Sinclair et al. (2012) identified relevant environmental conditions of natural or engineered systems to include pH, temperature, relative humidity, ultraviolet, organic matter, nutrients, air or water currents, biofilm, and turbidity. For wastewater systems, additional relevant conditions could include treatment processes in place (e.g., specific wastewater treatment operation and associated mechanism of aerosolization) or other aspects of the built environment and the time duration over which the surrogate data were derived. The latter reflects the relatively finite time duration between the introduction of the pathogen into the wastewater system and completion of its flow through the treatment process. Overall, the environment in which the surrogate data are applied should be appropriately consistent with the conditions from which the surrogate data were generated.
The microbial background is also an important environmental characteristic of the wastewater system. While there are many established methods to concentrate, recover, and analyze bacteria and nonenveloped viruses in wastewater (e.g., enteric viruses including polioviruses, enteroviruses), these methods are not suitable for enveloped viruses due to incompatibility of the methods with maintenance of the viral envelope (Ye et al., 2016). As a result, much of the available data for enveloped viruses is developed using sterilized or pasteurized wastewater to reduce the impact of microbial background on the analysis. Alternatively, nonenveloped viruses are used in place of enveloped viruses because the hardier nonenveloped viruses remain viable during use of standard analytical methods. Sterile or pasteurized wastewater is commonly assumed to facilitate longer persistence times than raw wastewater for enveloped pathogens such as EBOV (Bibby et al., 2015b). In this context, sterile or pasteurized wastewater would be considered a benchmark condition because it should provide a conservative estimate of persistence (i.e., likely to overestimate).
When evaluating the use of potential benchmark conditions, care must be taken to document the rationale for identifying the presence of a conservative fate and transport environment. It is also important to recognize that there may be conflicting claims regarding the identification of conditions that facilitate target pathogen persistence. For example, Casanova and Weaver (2015) reported a comparison of study results indicating that enveloped viruses should exhibit greater persistence in sterile water relative to wastewater. However, the time to achieve a ten-fold

49
reduction for the enveloped human immunodeficiency virus (HIV) was reported to be longer for primary and secondary wastewater effluents relative to sterile water (12 versus 6 hours, respectively) at the same temperature (25°C) and generally similar pH conditions (ranges of 5 to 7.5 and 6.5 to 7) (Casson et al., 1992; Moore, 1993). Moore (1993) hypothesized that increased survival in wastewater is associated with suspended solids and other organic loadings in wastewater for enteric viruses, and that the presence of increased survival may also be true for the enveloped HIV. The potential protective role for viral aggregation with particles was also noted by Bibby et al. (2015b) for the enveloped EBOV. Given the limited and sometimes conflicting data available for emerging pathogens, the identified basis for the determination of benchmark conditions should also note potential uncertainties.
6.3 Selection of Emerging Pathogens for Two Case Study Evaluations
Two emerging pathogens were selected for case studies using the screening process. The first pathogen, EBOV, was selected because it is an emerging pathogen of significant current interest that is hypothesized to enter wastewater systems in bodily waste. The EBOV is representative of an enveloped virus for which there are significant data gaps for fate and transport measurements that are necessary to assess exposure. It is likely that there is the potential for differential persistence in the exposure media in wastewater systems. For example, Ebola may persist in wastewater throughout the period of wastewater collection and treatment, but may have limited persistence after aerosolization. Though the EBOV is hypothesized to aerosolize from mechanical means, but transmissible aerosols are not thought to be generated from human respiratory system for person-to-person transmission (Vetter et al., 2017). The EBOV is recognized for low-dose disease transmission and lethality from multiple routes of exposure, including viral contact of infectious droplets with ocular and oral mucous membranes. Concerns regarding EBOV exposure from wastewater were heightened during the most recent outbreak when U.S. citizens were brought to U.S. hospitals for treatment and recovery. Given these concerns, the EBOV was selected for a case study to apply the screening process.
The second pathogen, the spore form of B. anthracis, was selected because of its high lethality from systemic illness, exceptional persistence in a variety of environments, and a potential entry point into the WWTP if the facility were used to manage decontamination wastewater. Exposure to B. anthracis spores from inhalation, ingestion, and dermal contact with open wounds can result in lethal systemic anthrax illness (Inglesby et al., 2002). Inhalation anthrax poses the greatest concern for potential disease transmission due to illness from low-doses (i.e., value of less than 105 CFU) combined with a high degree of lethality (i.e., case fatality rate of 45% during the 2001 anthrax letter) despite appropriate medical treatment (U.S. Environmental Protection Agency, 2016). Given the recognized hardiness of the B. anthracis spore under harsh environmental conditions, there is concern that spores could remain viable at sufficient levels in wastewater and during potential aerosolization processes to provide for disease transmission. Given these concerns, the spore form of B. anthracis was selected as a case study to evaluate using the screening process.

50
7 Case Study: Ebola Virus
The EBOV is in the hemorrhagic fever virus family (Filoviridae) and has five known species: Zaire, Bundibugyo, Sudan, Reston, and Taï Forest (previously termed Cote d’Ivoire) (Vetter et al., 2017). Human pathogenicity of the species varies from no appearance of pathogenicity (e.g., EBOV- Reston) (Bausch, 2011) with asymptomatic infection (Olejnik et al., 2017) to case fatality ratios of approximately 50% in EBOV-Sudan (Borio et al., 2002) and up to 90% in EBOV-Zaire (Borio et al., 2002; Bausch, 2011). During the 2013-2016 African EVD outbreak, greater than 28,500 cases and over 11,000 deaths were reported (based on data gathered up to March 2016) (Vetter et al., 2017).
7.1 Does Pathogen Exhibit Identified Disease Transmission Characteristics?
To determine that the EBOV may exhibit HCP characteristics in a wastewater system, all disease transmission features identified below must be present:
• Shedding of viable pathogen in feces, urine, or vomit associated with infection in the human or relevant animal model,
• Disease transmission in the human or relevant animal model for at least one of the following routes of exposure identified in the conceptual exposure model: inhalation of bioaerosol, dermal contact, incidental ingestion, ocular or other mucous membrane contact, and
• Severe or lethal illness resulting from the types of exposures generated during wastewater collection and treatment and identified in the conceptual exposure model (Figure 6-1).
7.1.1 Pathogen Shedding in Feces, Urine, or Vomit There is uncertainty in the available data regarding the shedding of viable infectious EBOV in feces, urine, or vomit by infected individuals. Vetter et al. (2017) reviewed the literature describing viral shedding and associated transmission of EBOV since its discovery in 1976 through the beginning of June 2016. Feces are identified as a “major source of infection during acute disease” (Vetter et al., 2017). Vetter et al. (2017) reports that no culture-positive EBOV are reported in feces despite numerous positives for viral RNA. Vetter et al. (2017) cites known challenges in isolation and culture of virus from feces as one potential explanation for the lack of positive culture data. However, culture-positive results for EBOV are reported in urine (Vetter et al., 2017). One attempt to culture virus from human vomit is identified in the literature, and no recovery of virus is reported (Bausch, 2011; Vetter et al., 2017).
Another literature review was performed by Brainard et al. (2016) to assess data describing filovirus (specifically, EBOV and Marburg virus) presence and persistence in bodily fluids. Brainard et al. (2016) also reported the scarcity of culture-positive confirmation of viable, infectious EBOV in feces or urine samples and noted significant data gaps for all bodily fluids, except for saliva and blood. Brainard et al. (2016) identified five EBOV studies meeting their literature review requirements that measured virus in feces, with only two studies identified that reported culture data. In one study using molecular methods, Brainard et al. (2016) reported maximum viral loadings for feces from two patients in the range of 105 to 105.5 genomic copies/mL waste (Wolf et al., 2014; Schibler et al., 2015). Interestingly, the 105 to 105.5

51
copies/mL feces loadings described in the human were within an order of magnitude of the reported mean fecal swab results from five EBOV-infected non-human primate (NHP) at the time of euthanasia as reported by Prescott et al. (2015).
Citing a personal communication from Hunter (a co-author of the Brainard et al. [2016] study), the World Health Organization (2015) reported that shedding of viable EBOV occurred with low frequency in feces and urine. Filovirus RNA was detected in 8.4% of urine and 20.8% of stool samples when PCR or other molecular methods were used. From that same data set, World Health Organization (2015) reported that culture-based methods confirmed viable virus in 2.3% of urine samples and 0% of stool samples. As a result, the World Health Organization (2015) reported in May 2015 that “most of the faecal matter at Ebola care facilities did not contain any Ebola virus.” However, Brainard et al. (2016) reported “too few samples” to draw strong inferences from the available data. For example, only one patient was evaluated with both culture and reverse-transcription polymerase chain reaction (RT-PCR) testing, but with no positive results for either method (Brainard et al., 2016).
Schuit et al. (2016) evaluated recovery of infectious EBOV from feces as part of a larger evaluation of viral persistence in bodily fluid matrices on specific surfaces. Interestingly, infectious virus was not recoverable from wet or dried feces from any of the evaluated surfaces immediately after introduction, leading Schuit et al. (2016) to hypothesize that feces could have a virucidal action for EBOV. It is also possible that the feces matrix may decrease the sensitivity of the microtitration assay (Schuit et al., 2016), but the exact cause is the lack of viable EBOV and recovery is unknown. Additionally, differences in persistence may also be associated with differences in stool type. The primary type of stool typically exhibited in EVD infection is loose, extremely watery and cholera-like (Schuit et al., 2016). However, the Schuit et al. (2016) study used stool from healthy volunteers
Haas et al. (2017) generated a distribution for human EBOV bodily waste concentration as part of a Monte Carlo simulation to estimate WWTP worker exposure. Using the Towner et al. (2004) report of an approximately 4 Log10 differential in paired human blood samples when measuring both EBOV (Sudan) RNA copies versus culture-based pfu measurements, Haas et al. (2017) applied a 3 to 4 Log10 reduction to the range of viral RNA copies reported in the literature (2.8 to 7.2 Log10 viral RNA copies) to calculate a viremia concentration of viable virus particles. These data were pooled across bodily fluids (i.e., identified as sweat, urine, feces) and fit to a logistic distribution (parameters: mean [or location] of 4.38 Log10, scale of 0.61 Log10). Support for the use of the 3 to 4 Log10 reduction was noted based on consistency in the literature for reported comparisons of RNA viral copies to pfu in humans and NHP as well as pfu and TCID50 in NHP and pigs for unspecified bodily fluids and EBOV strains (Haas et al., 2017). However, the Vetter et al. (2017) review of EBOV data in bodily fluids cautions that the lack of standardized RT-PCR EBOV assays poses a challenge to comparison across assays (Vetter et al., 2017). This caveat may also be applicable to assumptions regarding similar performance of assays across bodily fluids (e.g., blood, feces).
In Bayesian belief network model generated to evaluate the risk of EBOV exposure for wastewater workers, Zabinski et al. (2017) also modeled the viral concentration of patient liquid waste. In this system, the initial EBOV concentration from an individual patient in liquid waste was assumed to range from 103 to 107 particles/mL for those with severe illness. Based on a review of published literature of hospital days when waste production of an individual patient

52
exceeded 1 L per day, severe illness was assumed to exhibit a prior probability of 33% (Zabinski et al., 2017). The prior probability term in the model reflects the base state of information that is assumed for the parameter before additional information is included in the assessment. Patients with a waste volume less than 1 L were assigned to have nonsevere illness and an initial virus concentration of up to 103 particles/mL (Zabinski et al., 2017). Two potential corrections were then identified to this value: (1) a hemorrhagic correction to reflect the model’s assumption that the sole source of EBOV in feces was from patients that exhibited clinically determined gastrointestinal hemorrhage, and (2) a PCR correction for particle viability to distinguish between “active” and “inactive” viral particles (Zabinski et al., 2017). The PCR correction was based on data reported for poliovirus and ranged from 0 to 0.1, with bin-specific probabilities assigned for discrete portions of the range in the model (Zabinski et al., 2017). The level of uncertainty associated with a PCR correction based on poliovirus is unknown as well as the assumption that gastrointestinal hemorrhage is the only source of EBOV in bodily waste.
The lack of culture-based data to document shedding of infectious virus is a major uncertainty in the evaluation of potential exposure to EBOV from wastewater systems. However, there are acknowledged analytical difficulties in recovering infectious enveloped viruses from the feces matrix that significantly impede the reliable determination of viable virus. For the screening process, the conservative assessment decision is made that the presence of EBOV RNA genomic copies is indicative of the potential presence of shedding of infectious virus particles in feces and urine. Given the presence of one single negative study assessing the presence of viable virus in vomit, the screening process will assume infectious virus to be present in vomit due to the high uncertainty in this model element also.
7.1.2 Disease Transmission and Associated Exposure Doses by Route of Exposure Judson et al. (2015) reviewed the current scientific consensus on the likelihood of EBOV transmission from contact with bodily fluids. The available epidemiology and experimental data indicate that it is “very likely” that contact between EBOV-contaminated bodily fluids and mucous membranes or broken skin may result in disease transmission, citing data that sharing needles or handing infected or deceased individuals are high risk factors for disease transmission (Judson et al., 2015). However, data that report disease transmission associated with toilet use or wastewater systems are not identified in Judson et al. (2015).
Disease transmission resulting in lethal or severe EVD is confirmed for the following routes of exposure and exposure levels for the NHP: inhalation when using a low-dose exposure level (Johnson et al., 1995), ingestion or droplet contact with oropharynx when using a low-dose exposure level or low-dose exposure medium (Jaax et al., 1996; Mire et al., 2016), and ocular or conjunctival contact using a low-dose exposure level or low-dose exposure medium (Jaax et al., 1996; Mire et al., 2016). Disease transmission from the contact of EBOV-contaminated bodily fluids with broken skin is identified as a scientific consensus finding by Judson et al. (2015). Given the potential for cuts or breaks in the skin of those that contact wastewater and hypothesized disease transmission via introduction of EBOV through these skin areas, sufficient evidence is present to identify dermal contact as a route of disease transmission for EVD in the screening process.

53
7.1.3 Is Ebola Virus a High-Consequence Pathogen? Table 7-1 summarizes the results of the assessment of EBOV disease transmission characteristics and details the determination that the EBOV is an HCP in the wastewater system. While there is uncertainty with regard to human shedding of viable EBOV in feces, the pathogen is well documented to transmit disease from routes of exposure associated with the toilet flush, wastewater collection, wastewater treatment, releases of wastewater, and maintenance activities (Table 7-1).
7.2 Does the Pathogen Persist in Wastewater or Deposited Droplet?
7.2.1 Wastewater Persistence To answer this screening element affirmatively, a HCP must have data indicating that it has the potential to persist in wastewater for a minimal period of time (e.g., five minutes). There are no published data describing EBOV persistence in raw wastewater. However, studies that evaluate the factors associated with persistence or inactivation of viruses in water or wastewater assist in the identification of potentially relevant data sets to fill the data gap. The persistence of viruses in water is multi-factorial, with dependencies identified for temperature, organic matter, and the presence of other microorganisms (Gundy et al., 2008). The general factors identified for viral persistence in water are also assumed to be relevant for EBOV in wastewater.
A recent regression model generated by Brainard et al. (2017) to describe viral persistence in wastewater also identifies relevant characteristics for categorization of potential surrogates, benchmark indicators, and benchmark condition determinations. The following characteristics were identified as predictive of viral persistence in wastewater: DNA or RNA structure, presence of an envelope, primarily transmission as fecal-oral pathogen, temperature, and relative level of waste contamination (i.e., low, medium, high) (Brainard et al., 2017). Brainard et al. (2017) defined a low level of contamination as media with no fecal or urine content and a high level of contamination as media with unclear or unknown levels of fecal content or greater than or equal to 10% fecal material. All other media that did not fit into the first two categories as a high level of contamination, except for media that was diluted to less than or equal to 1% which would result in placement in the medium category (Brainard et al., 2017).
Table 7-2 summarizes potential surrogates and benchmark indicators with potential relevance for the persistence of EBOV in wastewater reported in the literature. The literature identifies the enveloped Phi6 bacteriophage as a potential wastewater persistence surrogate for the EBOV (Bibby et al., 2015a; Bibby et al., 2015b; Casanova and Weaver, 2015; World Health Organization, 2015), avian influenza (Adcock et al., 2009), and the enveloped virus biological group (Casanova and Weaver, 2015). Bibby et al. (2015a) identified a number of potential surrogates for EBOV based on biological similarity, though some microorganisms lack published persistence data (e.g., carrot mottle virus, tobacco mosaic virus). Ye et al. (2016) identified a broader range of enveloped viruses for evaluation of fate and transport characteristics that included the Phi6 bacteriophage and MHV.

54
Table 7-1. Summary of Ebola Disease Transmission Characteristics
Pathogen Shedding and Viability
Animal Model: Documented Routes of Disease Transmission and Source
Viable EBOV detected “infrequently” in urine and feces, with infectious virus in approximately 2% of urine samples and 0% of fecal samples. World Health Organization (2015) However, numerous reports of EBOV RNA copies in urine and feces. Brainard et al. (2016) and Vetter et al. (2017) One attempt failed to culture virus from human vomit; no recovery of virus was obtained. Bausch (2011) and Vetter et al. (2017)
NHP: Inhalation Aerosol (2.6 Log10 pfu and 4.7 Log10 pfu) Johnson et al. (1995) NHP: Ingestion Droplet Administration – Oropharynx (120 pfu) Mire et al. (2016) NHP: Oral Swab to Oropharynx (5.2 Log10 pfu in 1 mL) Jaax et al. (1996) NHP: Ocular/Conjunctival Droplet Administration – Medial canthus of eye (150 pfu) (Mild illness, Survivor) Mire et al. (2016) Conjunctival (5.2 Log10 pfu in 1 mL divided into two administered doses of 0.5 mL each, with approximately three drops retained in each eye [specific drop size not identified]) Jaax et al. (1996) Human: Dermal (Anecdotal*) Judson et al. (2015)
Screening Process Determination Viable EBOV has the potential to be shed in human feces, urine, and possibly vomit. EBOV is an HCP for the following routes of exposure in the screening process:
• Inhalation • Incidental Ingestion • Dermal Contact • Ocular or Oral Mucous Membrane Contact.
It is determined that viable EBOV has the potential to be shed by infected individuals leading to exposure and illness through all routes of exposure identified in the conceptual exposure model. As a result, there is the potential for disease transmission from the flush of the toilet and from wastewater treatment processes, maintenance activities, and releases of wastewater during transit. Complete references are found at the end of the report. * Anecdotal data lack controlled study conditions or defined exposure doses. EBOV – Ebola virus(es); NHP – nonhuman primate(s); pfu – plaque-forming unit(s) Figure 7-1 identifies published data relevant to the evaluation of EBOV persistence in wastewater that reported the time for a 2-log reduction or provided sufficient data to calculate a 2-log reduction (Adcock et al., 2009; Casanova et al., 2009; Bibby et al., 2015b; Fischer et al., 2015; Ye et al., 2016). Additional persistence data that were not included in Figure 7-1 even though the data may be supportive of the analysis will be considered later in this section.

55
Table 7-2. Potential Surrogates and Benchmark Indicators for Persistence of Ebola Virus in Wastewater Target
Pathogen Surrogate or Benchmark Indicator, Basis for
Selection, and Source Available Data
Ebola Virus Enveloped
Filamentous Virus, Single-
Stranded RNA Virus
(Filoviridae)
Phi6 Bacteriophage, Benchmark Indicator: Enveloped double-stranded RNA virus, Bibby et al. (2015a); Casanova and Weaver (2015)
99.9% reduction of virus in pasteurized sewage at 22°C and 30°C of approximately six and two days, respectively Casanova and Weaver (2015)
Time to 90% reduction in raw wastewater at 10°C and 25°C of 28 and 7 hours, respectively Time to 90% reduction in pasteurized wastewater at 10°C and 25°C of 146 and 53 hours, respectively Ye et al. (2016)
Persistence in sterile, buffered distilled water for up to 180 days of evaluation at 17°C and 28°C Adcock et al. (2009)
MS-2 Bacteriophage, Benchmark Indicator: Nonenveloped single-stranded RNA virus, Bibby et al. (2015a)
Time to 90% reduction in raw wastewater at 10°C and 25°C of 175 and 121 hours, respectively Time to 90% reduction in pasteurized wastewater at 10°C and 25°C of 212 and 121 hours, respectively Ye et al. (2016)
Tobacco Mosaic Virus, Potential Surrogate: Enveloped single-stranded RNA virus, Bibby et al. (2015a)
No published persistence data identified in wastewater or water
Carrot Mottle Virus, Potential Surrogate: Enveloped single-stranded RNA virus, Bibby et al. (2015a)
No published persistence data identified in wastewater or water
Human Immunodeficiency Virus (HIV), Surrogate: Enveloped single-stranded RNA virus,
World Health Organization (2015) and Arduino (2015)
Persistence data in wastewater Casson et al. (1992) and Slade et al. (1989)
Murine Hepatitis Virus (MHV), Surrogate: Enveloped single-stranded RNA virus, Coronavirus family Ye et al. (2016)
Persistence in water at 4°C and 25° for >365 days and 9 days, respectively Persistence in settled, pasteurized sewage at 4°C and 25° for 35 days and 3 days, respectively Casanova et al. (2009)
Time to 90% reduction in raw wastewater at 10°C and 25°C of 36 and 13 hours respectively Time to 90% reduction in pasteurized wastewater at 10°C and 25°C of 149 and 19 hours, respectively Ye et al. (2016)
Transmissible Gastroenteritis Virus, Surrogate: Enveloped single-stranded RNA virus, Coronavirus that was originally identified surrogate for SARS, Casanova et al. (2009)
Persistence in water at 4°C and 25° for 110 days and 11 days, respectively Persistence in settled, pasteurized sewage at 4°C and 25° for 24 days and 4 days, respectively (Casanova et al., 2009)
Complete references are found at the end of the report. HIV - human immunodeficiency virus; MHV – murine hepatitis virus; RNA – ribonucleic acid

56
Figure 7-1. Published data describing time for a 2-log reduction of Ebola virus in wastewater and water.
The published data for EBOV persistence are reflective of a variety of potential benchmark conditions, including pasteurized or sterilized wastewater and cold water temperatures. Figure 7-1 identifies the temperature of the wastewater or water for an individual data set using blue to indicate temperatures less than 20°C, green to indicate temperatures between 20°C to 25°C, and red to indicate temperatures greater than 25°C. The longest reported persistence data were identified for EBOV surrogate or benchmark indicators at temperatures less than 20°C combined with other benchmark conditions (e.g., water medium) (Adcock et al., 2009; Casanova et al., 2009) (Figure 7-1). Accordingly, it is reasonable to consider persistence studies performed using water as the test medium and cooler temperatures as benchmark conditions when evaluating data for the screening process. In contrast, studies that utilize warmer temperatures regardless of the medium are likely to exhibit reduced persistence relative to

57
moderate or cooler temperature conditions. Decreased temperatures have been suggested to be protective for the enveloped virus influenza A due increased stability and lipid ordering of the envelope (Weber and Stilianakis, 2008). The same mechanism may be active for other enveloped viruses.
In the only data set reporting EBOV persistence in wastewater, Bibby et al. (2015b) spiked EBOV (Guinea Makona) into sterilized untreated wastewater at two titers (106 and 102 TCID50/mL) to evaluate persistence over an eight-day period under environmental conditions of 20°C and 40% relative humidity. Results indicated a rapid decrease of approximately 99% within the first day of the test, but EBOV was still detected through day eight for the 106 TCID50 /mL concentration. The 102 TCID50/mL spike was not detectable after day one. Bibby et al. (2015b) reported two time values for a 90% reduction of sterile wastewater seeded with 106 EBOV TCID50/mL held at 20°C: 2.1 days or 6.6 days depending on the modeling assumption approach used to generate the 90% reduction value (i.e., inclusion or exclusion of the time zero concentration value).
Sterilized or pasteurized wastewater is hypothesized to provide a conservative estimate of viral persistence for EBOV (Bibby et al., 2015b; Casanova and Weaver, 2015) and is evaluated as a benchmark condition for the EBOV assessment. However, Section 6.2.4 identifies conflicting evidence regarding whether sterilized or pasteurized wastewater will consistently provide a conservative estimate of persistence in the wastewater medium. In their analysis, Bibby et al. (2015b) noted that there is uncertainty in whether the mechanism of loss for the viruses was inactivation, viral particle aggregation, or adsorption to other wastewater particles that may have promoted the apparent loss of virus in their data set. When noting the increased persistence of the enveloped HIV in sterile versus primary and secondary effluents to sterile water, Moore (1993) hypothesized that increased survival in wastewater is associated with suspended solids and other organic loadings in wastewater for enteric viruses, and that the same mechanism could be present for the enveloped HIV.
The water medium is also hypothesized to promote viral persistence relative to raw, pasteurized, or sterile wastewater. However, there are conflicting data for some enveloped pathogens (e.g., HIV) (e.g., Casson et al. (1992) persistence data for water versus wastewater). The potential protective role provided by the particles in wastewater has previously been hypothesized for EBOV (Bibby et al., 2015b). However, available data generally support increased persistence for water relative to wastewater for the enveloped virus surrogate MHV (Casanova et al., 2009) and the benchmark indicator Phi6 bacteriophage (Adcock et al., 2009l) with approximately 17 to 22 days reported for a 2-log reduction at temperatures of 27 °C and 28 °C, respectively. In contrast, Fischer et al. (2015) developed a regression equation to describe EBOV persistence using study data from water at 27°C and estimated a 2-log reduction time of 2.19 days. Fischer et al. (2015) reported EBOV persistence in deionized water for the same strain as the Bibby et al. (2015b) dataset (EBOV Guinea Makona-WPGC07). The estimate for a 90% decrease in EBOV at a similar temperature was sufficiently close to the value reported by the Bibby et al. (2015b) study using sterilized wastewater, with detectable virus found up to day six at 21°C from a starting titer between 104 and 105 TCID50 /mL. However, the persistence in water was half as long at 27°C (three days) compared to 21°C (six days) (Fischer et al., 2015). Given these data, data generated from EBOV in water could be categorized as data reflective of a target pathogen in benchmark conditions.

58
Several biological characteristics are associated with water or wastewater persistence that can be used to distinguish a surrogate from a benchmark indicator. Using the hypothesis that double-stranded RNA or DNA viruses are hardier than single-stranded viruses, the Phi6 bacteriophage virus would be considered to be a benchmark indicator due to the presence of double-stranded RNA. Persistence data for the Phi6 bacteriophage are currently available for water (Adcock et al., 2009), pasteurized wastewater (Casanova and Weaver, 2015; Ye et al., 2016), and unpasteurized wastewater (Ye et al., 2016). Using Phi6 bacteriophage persistence data for pasteurized wastewater, enveloped viruses would be expected to exhibit a 6 to 7 Log10 inactivation rate over three to seven days in wastewater (Casanova and Weaver, 2015).
The MHV, a single-stranded RNA virus, could be identified as a surrogate for EBOV. Due to the increased vulnerability of single-stranded viruses, the persistence values of MHV in wastewater are similar to single-stranded emerging pathogens (e.g., EBOV, SARS, avian influenza). Ye et al. (2016) reported persistence data in the form of time for a 90% reduction for the single-stranded enveloped MHV in 25°C pasteurized and raw wastewater of 19 hours and 13 hours, respectively. At 10°C, the time for a 90% reduction in pasteurized and raw wastewater increased to 149 hours and 36 hours, respectively (Ye et al., 2016).
As noted by Arduino (2015), the HIV provides the historical example of an enveloped single-stranded RNA virus shed in bodily waste that also prompted concerns for exposure from wastewater. As such, the HIV may represent an appropriate surrogate for the EBOV (Arduino, 2015). Ansari et al. (1992) first reported the presence of HIV genetic material in raw wastewater, but did not test for infectivity. In a later study that evaluated primary and secondary wastewater treatment effluent, Palmer et al. (1995) first reported the presence of proviral and viral HIV-1 nucleic acids in wastewater, with positives identified for two unique locations. However, no infectious virus was detected (Palmer et al., 1995). To ensure the methods used were capable of recovery of viable HIV, Palmer et al. (1995) also seeded wastewater with HIV to demonstrate recovery of viable virus from wastewater. The HIV continues to share an important data gap with the emerging pathogen EBOV as there is uncertainty regarding the presence of infectious virus in feces. Studies have described the presence of HIV genomic material in feces and urine (Chakrabarti et al., 2009), but few studies have evaluated the number of infectious virus in feces and urine.
The screening process determination is that the EBOV meets the conditions for persistence in wastewater for the screening process given the documented presence of persistence beyond the five-minute time duration. Given the lack of data for EBOV persistence in wastewater, identified benchmark indicator and benchmark condition data provide sufficient evidence that the persistence time condition is met. The Bibby et al. (2015b and 2017) data set clearly indicates persistence in the timeframe of days for EBOV in the benchmark condition of sterilized wastewater. The Ye et al. (2016) data set describes persistence of MHV, a potential surrogate of EBOV, in raw wastewater that is indicative of persistence on the order of hours to days before a 90% reduction at both high and low temperatures.

59
7.2.2 Deposited Droplet Persistence For the screening process, pathogen persistence when deposited on surfaces requires data that document pathogen persistence after deposition on a surface for a minimal period of time (e.g., five minutes). Study data were not identified for wastewater persistence of enveloped viruses on surfaces that originated from either splash of wastewater or deposited aerosolized wastewater. However, EBOV persistence data for deposition on surfaces is reported for varying combinations of viral medium (e.g., tissue culture, blood) and surface type (e.g., plastic, stainless steel).
A key consideration for the assessment of pathogen persistence is uncertainty regarding the identification of benchmark conditions for aerosolization media other than wastewater. It can be assumed that tissue culture fluid provides a favorable medium for persistence on surfaces after deposition. Piercy et al. (2010) evaluated the persistence of EBOV after it was diluted in either guinea pig sera or tissue culture media and then dried on polyvinyl chloride plastic, stainless steel, and glass substrates. No EBOV could be recovered for evaluations performed at room temperature and 55% relative humidity (Piercy et al., 2010). However, low-temperature conditions were found to promote persistence leading to extended viral survival that lasted multiple weeks for some surfaces (Piercy et al., 2010). For example, samples that were dried on glass substrates were recovered at 26 and 50 days at 4°C (Piercy et al., 2010). Interestingly, no virus was recovered from a metal surface at any time for tests performed at room temperature and 4°C conditions (Piercy et al., 2010). Piercy et al. (2010) noted that several hemorrhagic viruses have also demonstrated decreased persistence on metal surfaces (e.g., 90% decrease in less than two hours). In contrast, tests performed with deposited droplets from another enveloped single-stranded RNA virus (influenza A [H1N1]) reported persistence of greater than 24 hours at 22°C and 50 to 60% relative humidity on stainless steel substrates when using a phosphate-buffered saline medium (Noyce et al., 2007).
It is unknown whether the lack of recovery from stainless steel surfaces is unique to EBOV and the hemorrhagic fever viruses or whether the suspension medium is also affecting deposited particle persistence. Enhanced inactivation on metal surfaces may be an important finding given the typical substrates that could be associated with receptor contact in a WWTP. In contrast, persistence at room temperature (temperature unspecified) was less than two days when the virus was applied to glass or plastic surfaces. Poliquin et al. (2016) reported that hospital bedrails, which were not visibly soiled, and concrete floors were areas of EBOV RNA persistence. Case reports in the United States also confirmed the presence of EBOV RNA in various body fluids, including blood, urine, vomitus, feces, endotracheal secretions and semen (Chughtai et al., 2016). For the screening process, it has been determined that EBOV can persist when deposited on surfaces, especially during very low temperature conditions. However, there may be conditions that do not favor survival (e.g., metal substrates, warm temperatures) that should be considered as potential modifiers to the determination.
7.3 Does Pathogen Form Viable Bioaerosols from a Toilet Flush or the Wastewater Treatment Process?
For the screening process, viable bioaerosols are defined by the presence of airborne pathogens that survive the aerosolization process and retain sufficient infectivity to allow for detection and measurement. Experimental data were not identified that described the formation of bioaerosols

60
from EBOV-contaminated wastewater by any aerosolization mechanism. To determine that the EBOV can form viable bioaerosols from a toilet flush or wastewater treatment process, bioaerosol data must be identified for a surrogate or benchmark indicator that was generated under relevant conditions (i.e., similar aerosolization mechanism, similar environmental conditions, microorganism with similar susceptibility to aerosolization stress).
The bioaerosol data reviewed in Sections 4.3.2 and 4.3.3 describe the mechanistic potential for aerosolization of EBOV from a toilet flush or wastewater treatment processes. One study was identified that reported bioaerosol generation data from a toilet flush for an enveloped virus. Lin and Marr (2017) reported the virus emission rates and aerosol emission volumes for 20 minutes after a single flush of an automatic toilet containing anaerobically digested sludge spiked with the nonenveloped MS-2 and enveloped Phi-6 virus, respectively. For each virus, no pfu was detected after an individual flush by collection of aerosol in gelatin filter at a flow rate of 2 L for 20 minutes (Lin and Marr, 2017).
Persistence data for aerosolized EBOV generated from a nebulizer are available. Piercy et al. (2010) reported persistence data for two EBOV strains (i.e., Zaire, Reston) that were aerosolized from a tissue culture medium using a nebulizer to form small particle aerosols (i.e., predominantly 1 to 3 µm particles). When evaluating these data, it is important to recognize that there are high levels of shear stress associated with use of the nebulizer to generate a bioaerosol (National Research Council, 2006). It is possible that that bacteria or viruses could become fragmented or lose viability during aerosolization (National Research Council, 2006) and may generate persistence estimates that are biased low relative to other processes of aerosolization in wastewater systems. An exponential decay curve was fitted to data from the 90-minute observation period, with calculated half-lives identified for EBOV-Zaire and EBOV-Reston of 15 and 24 minutes, respectively (Piercy et al., 2010). The time for a 99% loss (i.e., 2-log loss) of EBOV-Zaire and EBOV-Reston was 104 and 162 minutes, respectively (Piercy et al., 2010). However, the relative humidity (50% to 55%) of the test conditions is in the lower range of relative humidity levels identified by Yang and Marr (2012) for reduced stability of identified enveloped virus bioaerosols, including EBOV. As a result, it is not known if EBOV aerosolization in the potentially higher relative humidity levels of an indoor WWTP process may exhibit reduced viability relative to the persistence described by Piercy et al. (2010).
Verreault et al. (2008) identified the Phi6 bacteriophage as a potential surrogate for aerosolized small enveloped viruses. Using the terminology of the screening process, the Phi6 bacteriophage is most appropriately termed a benchmark indicator. Reasons for the selection of aerosolized Phi6 bacteriophage to fill enveloped virus data gaps include the common biological features of a viral envelope, small-size, and absence of a tail (unlike earlier proposed bacteriophages) (Verreault et al., 2008). Phillpotts et al. (2010) also identified the Phi6 bacteriophage as an aerosolization surrogate for Venezuelan equine encephalitis virus for generally similar reasons (i.e., size, surface structures, and lipid envelope). In an evaluation of the effects of aerosolization and sampling on the endpoint of infectivity, the Phi6 bacteriophage is also identified as an aerosolization surrogate for the enveloped influenza virus (Turgeon et al., 2014). However, the Phi6 bacteriophage is double-stranded and may exhibit greater stability in the wastewater medium than single-stranded viruses like EBOV (Casanova and Weaver, 2015).
For the screening process determination, available bioaerosol data for the benchmark indicator Phi6 bacteriophage from Piercy et al. (2010) indicate that the microorganism can be aerosolized

61
and remain sufficiently viable after aerosolization to allow for detection. It is uncertain whether the nebulizer aerosolization mechanism provides for an increased or decreased potential for formation of viable bioaerosols relative to the identified aerosolization mechanisms associated with a toilet flush (e.g., bubble-burst mechanism) or wastewater treatment (e.g., aeration-associated bubble-burst mechanism). It is also unknown how the medium used in Piercy et al. (2010) impacts the potential for viable bioaerosol generation relative to the toilet bowl water or wastewater media.
7.4 Conclusion: Could Ebola Virus Form Viable Exposure Pathways in the Wastewater System?
The EBOV was determined to be an HCP with potential disease transmission from the following routes of exposure: inhalation, incidental ingestion, dermal contact, and ocular or oral mucous membrane contact (Figure 7-2). However, there is high uncertainty in the determination that viable infectious pathogens are shed in the feces and other bodily fluids. The lack of evidence for determination of viable pathogen in feces is a result of analytical challenges associated with the medium as well as a lack of studies specifically designed to evaluate its presence. There is increasing evidence that enveloped viruses such as EBOV can survive in wastewater. For example, the Ye et al. (2016) study recently reported enveloped virus persistence in excess of one day for enveloped viruses in raw wastewater. Given the rapid transit time from wastewater collection to the treatment plant, this persistence time could allow for potential exposure to receptors if exposure occurred prior to the plant (e.g., combined sewer overflow) or during wastewater treatment. There are also sufficient data to indicate that deposited wastewater on surfaces could persist to allow for worker exposure for specific substrates and environmental conditions (e.g., low temperature with non-metal substrates). Similarly, the EBOV can form viable bioaerosols when aerosolized from a nebulizer with a potentially protective medium such as tissue culture fluid (Piercy et al., 2010). There are no bioaerosol data for enveloped viruses that originate from WWTP processes. However, there is one study that reported no aerosolization of the enveloped Phi-6 virus introduced to the toilet in simulated sewage sludge (Lin and Marr, 2017). One major uncertainty is whether the stress of aerosolization is greater under the conditions of the WWTP processes or the nebulizer. These data would be necessary to provide certainty in the appropriate identification of benchmark conditions. Figure 7-2 summarizes the potentially complete exposure pathways for EBOV in the wastewater system and the outputs of the screening process. The figure is based on Figure 6-1, but for EBOV, the residential toilet is a source of contamination whereas decontamination wastewater, illicit activity, and surface runoff are not shown as potential sources. The final determination is that the EBOV could exhibit behavior of an HCP and will result in a VEP in the wastewater system.

62
Figure 7-2. Summ
ary of Ebola virus exposure pathw
ays and screening process outputs.

63
8 Case Study: Bacillus anthracis Spores
Bacillus anthracis spores could enter the wastewater system if a WWTP is used to manage decontamination wastewater after a biological agent incident. For the evaluation of exposure, only the spore form is considered in the case study because the spore form has historically been of greatest human health concern due to its persistence in indoor or outdoor environments, demonstrated lethality if infection results from human inhalation exposure, and prior use in biological terrorism (U.S. Environmental Protection Agency, 2016). The screening process scenario does not assess how potential exposure may result from sporulation and the production of vegetative bacteria during wastewater collection and treatment.
8.1 Does Pathogen Exhibit Identified Disease Transmission Characteristics?
8.1.1 Direct Entry via Decontamination Wastewater For the B. anthracis spore case study, it is assumed that the spores enter the wastewater system directly (e.g., introduction of decontamination wastewater). In contrast to bodily fluids that enter the wastewater system through collection in the toilet, it is assumed that pretreatment of decontamination wastewater is performed prior to discharge to the collection system and/or WWTP. Pre-treatment is consistent with the management of decontamination wastewater from previous anthrax incidents (e.g., use of sodium hypochlorite solution to pre-treat decontamination wastewater generated during the 2001 anthrax letter attacks) (NACWA, 2005). Despite treatment, it is possible that residual infective spores may remain after pretreatment, providing the potential for exposure to human receptors during wastewater transit and treatment.
8.1.2 Disease Transmission and Associated Exposure Doses by Route of Exposure The four types of anthrax illness are generally differentiated based on the route of exposure associated with initiation of infection: inhalation anthrax from inhalation exposure, gastrointestinal or oro-pharyngeal anthrax from oral exposure, cutaneous anthrax from dermal exposure, and infection anthrax from injection of drugs contaminated by B. anthracis spores (U.S. Environmental Protection Agency, 2016). The spores of B. anthracis can transmit disease for all routes of exposure identified in the conceptual exposure model presented in Figure 6-1.
Human and animal model data support the potential for disease transmission and lethality of B. anthracis from the following routes of exposure: inhalation, incidental ingestion, dermal, and a special form of dermal exposure associated with the eye identified as periocular. Disease transmission and subsequent lethality from inhalation exposure is described for low-dose exposures for the NHP animal model (Lever et al., 2008) and the human (Inglesby et al., 2002). The U.S. Environmental Protection Agency (2016) reviewed animal model and human data for gastrointestinal anthrax from ingestion exposures. Animal model data indicate that relatively high exposure doses are necessary to transmit B. anthracis from ingestion and dose levels may exceed over 108 cfu for some animal models (i.e., rabbit, NHP) (U.S. Environmental Protection Agency, 2016). However, the presence of an immunocompromised state in the human receptor may generate susceptibility to anthrax infection U.S. Environmental Protection Agency, 2016. One case of gastrointestinal anthrax resulted from exposure to aerosolized spores from the use of a contaminated drum, but the exact route of exposure remains unknown (e.g., ingestion or inhalation and subsequent mucociliary transport of spores to the gastrointestinal tract) (U.S.

64
Centers for Disease Control and Prevention, 2010). Though B. anthracis data are not available for the wastewater collection or treatment setting, gastrointestinal anthrax in an occupational mill environment has been reported with the hypothesis that hand-to-mouth contact with spore-contaminated materials is a potential route of exposure that could lead to disease transmission (MacDonald, 1942). Accordingly, these data are sufficient for the screening process determination that incidental ingestion of spores is a potential exposure pathway that could result in disease transmission.
Cutaneous anthrax is the most common form of anthrax in natural settings (Inglesby et al., 2002). Though cutaneous anthrax rarely progresses to fulminant systemic anthrax illness, cutaneous anthrax is associated with reported lethality rates of 1% with antibiotic treatment and 10% to 20% without treatment (Beatty et al., 2003). Dermal exposure to B. anthracis spores can result in cutaneous anthrax, though there is uncertainty about the necessity of breaks or abrasions in the skin for disease transmission. For example, the seven-month old child who developed cutaneous anthrax during the 2001 anthrax incident did not have any known cuts or abrasions (Inglesby et al., 2002). Given the documented possibility for serious and potentially lethal systemic anthrax from dermal exposures and the potential for receptors to have breaks or cuts in the skin during exposure, dermal contact with B. anthracis spores is identified as a means of disease transmission for lethal and serious anthrax illness.
Periocular cutaneous anthrax, also termed oculocutaneous anthrax, may result from cutaneous anthrax infection of the skin in close proximity to the eyelid and/or periorbital area (David et al., 2010; Gelaw and Asaminew, 2013). Anthrax infection of the eyelids can be complicated by cicatricial ectropion, or a turning in of the eyelid toward the eye, with potential for subsequent corneal scarring or impairment of vision despite appropriate treatment (Gelaw and Asaminew, 2013). Given the documented conditions for potential disease transmission and serious illness, ocular exposure for the B. anthracis case study is defined more broadly than ocular mucous membranes to include exposures to the overall ocular region that may contribute to severe or lethal anthrax disease.
Disease transmission evidence from human incidence and animal studies indicates the potential for severe or lethal illness for the following routes of exposure: inhalation, incidental ingestion, contact with ocular or oral mucous membranes, and periocular dermal exposure. Dermal contact through cuts in the skin may also result in disease transmission. The screening process determination is that the potential for disease transmission is present for all routes of exposure identified in the conceptual exposure model.
8.1.3 Is the Spore Form of Bacillus anthracis a High-Consequence Pathogen? B. anthracis spores may act as an HCP in a wastewater system. The spore form of B. anthracis is well documented to transmit disease for all routes of exposure associated with wastewater systems after introduction of decontamination wastewater (Table 8-1).

65
Table 8-1. Summary of Bacillus anthracis Disease Transmission Characteristics
Entrance of Pathogen into Wastewater
System Animal Model: Documented Routes of Disease Transmission and Source
B. anthracis spores are assumed to enter collection system through decontamination wastewater, illicit activity, or surface water runoff.
NHP: Inhalation Lever et al. (2008) Aerosol (Geometric mean LD50 of 1.47 × 10³ cfu)
Human: Ingestion (Anecdotal) Few published animal model data sets for oral exposure to spores or vegetative bacteria, Human gastrointestinal anthrax associated with hypothesized ingestion of vegetative bacteria by Inglesby et al. (2002) and U.S. Environmental Protection Agency (2016).
Host conditions are noted to predispose some individuals to disease transmission at lower doses for incidental ingestion. U.S. Environmental Protection Agency (2016) Human: Dermal (Anecdotal*) Inglesby et al. (2002) reported no animal data identified in open source literature that did not include inoculation through a break in skin or subcutaneous dosing. Screening process assumes potential for breaks in skin of receptor to contribute to disease transmission. Human: Ocular/Conjunctival (Anecdotal*) No animal data identified in open source literature. Human cases of periocular anthrax and palpebral anthrax. David et al. (2010) and Gelaw and Asaminew (2013)
Given potential for serious complications, the screening process deems exposure to the ocular area to represent a distinct exposure hazard from cutaneous anthrax.
Screening Process Determination All routes of exposure in screening process are assumed to be associated with disease transmission based on animal model study data or anecdotal human data in an acute setting. Inhalation exposure to B. anthracis spores via aerosol is associated with lethality in animal studies. Given the potential for systemic anthrax illness from all routes of exposure or for serious complications from ocular exposure, all routes of exposure for anthrax infection are assumed to be associated with severe or lethal illness.
B. anthracis in spore form is an HCP for the following routes of exposure in the screening process: • Inhalation • Incidental Ingestion • Dermal Contact • Ocular or Oral Mucous Membrane Contact (including periorbital cutaneous contact).
It is determined that viable pathogen that has direct entry to the wastewater system has the potential to lead to exposure and illness through all routes of exposure identified in the conceptual exposure model. As a result, there is the potential for disease transmission from wastewater treatment processes, maintenance activities, and release of wastewater during transit.
Complete references are found at the end of the report. * Anecdotal data lack controlled study conditions or defined exposure doses. cfu – colony-forming unit(s), LD50 – median lethality value, NHP – nonhuman primate(s)

66
8.1 Does the Pathogen Persist in Wastewater or a Deposited Droplet?
8.1.1 Wastewater Persistence To answer this screening question affirmatively, an HCP must have data indicating the potential to persist in wastewater for a minimal period of time (e.g., five minutes). Bacillus anthracis spores are known for their overall hardiness in a variety of environmental settings and conditions. However, Sinclair et al. (2008) reviewed persistence data for B. anthracis spores and noted a lack of current experimental data on spore persistence in water or wastewater, with much of the experimental data collected in the late 1800s or early 1900s. One persistence study performed in 1894 was identified by Sinclair et al. (2008) that reported persistence of B. anthracis spores in sewage and distilled water to be 16 months and 20 months, respectively. Minett (1950) reported that viable spore survival is longer in sterilized relative to unsterilized water, but quantitative comparison data were not provided. Persistence data were also available for a tube of spores placed in a sterile pond water medium and that were then set in a shaded pond (Minett, 1950). No reduction of viable spores was identified over a two-year period (Minett, 1950).
Though it may be possible to identify additional data from potential surrogate species of spores similar to B. anthracis as noted by Sinclair et al. (2008), the available documentation is sufficient for an affirmative determination of wastewater persistence for the duration identified by the screening process of at least five minutes.
8.1.2 Deposited Droplet Persistence For the screening process, the determination that the pathogen persists when deposited on surfaces requires that data be available for persistence after deposition on a surface for a minimal period of time (e.g., five minutes). Study data were not identified that described wastewater persistence on surfaces for B. anthracis spores that were transported by either splash of wastewater or deposited aerosolized wastewater.
Given the acknowledged persistence of B. anthracis spores in general and in water-based settings, it is anticipated the spores should also exhibit sufficient persistence to allow for an affirmative answer to the question for deposited droplets. Wood et al. (2015) reported persistence times for B. anthracis spores deposited and dried on various surface types (e.g., glass, wood, unpainted concrete) and under differing conditions of ultraviolet light exposure.
Surface-dependent differences were reported in both initial recoveries and after ultraviolet light exposure (Wood et al., 2015). The impact of ultraviolet light was also surface-dependent with some surface types (e.g., concrete) thought to provide shelter from the light and promote persistence (Wood et al., 2015). Decay was reported to be bi-phasic, with a first phase of more rapid losses over the two days of exposure, than a slower phase with reduced loss rates (Wood et al., 2015). However, rates of loss were sufficiently low that B. anthracis viable spores remained over an extended period of time and persisted up to 56 days. The consideration of ultraviolet light exposure by B. anthracis spores is of greatest relevance to WWTP with outdoor equipment. For the screening process, it is therefore determined that B. anthracis can persist when deposited on surfaces.

67
8.2 Does Pathogen Form Viable Bioaerosols from the Wastewater Treatment Process?
For the screening process, viable bioaerosols are defined by the presence of airborne pathogens that survive the aerosolization process and retain sufficient infectivity to allow for detection and measurement. Data were not identified that described the formation of bioaerosols from wastewater contaminated by B. anthracis spores for any of the relevant aerosolization mechanisms.
To answer the screening question that B. anthracis spores can form viable bioaerosols from a WWTP process affirmatively, bioaerosol data must be identified for a surrogate or benchmark indicator that can be aerosolized for a wastewater treatment process. Since the spores were introduced to the wastewater system from decontamination wastewater, the generation of bioaerosols from the toilet flush is not considered in this evaluation.
The bioaerosol data reviewed in Section 4.3.3 indicate the mechanistic potential for aerosolization of B. anthracis spores from wastewater treatment processes. Early studies describing the jet drop mechanism referenced efforts that dropped B. subtilis spores in water bodies to demonstrate bioaerosolization of spore forms (Baylor et al., 1977a). Given the hydrophobic nature of the outer exosporium of Bacillus spores (Greenberg et al., 2010) and the ease of bioaerosolization of hydrophobic microorganisms when in water (Falkinham III, 2003), the B. anthracis spores could be aerosolized easily (Chattopadhyay et al, 2017). These same microorganisms are also likely to exhibit limited sensitivity to shear stress and also remain viable after aerosolization from the bubble-burst mechanism.
The nonenveloped viruses and bacterial data constitute benchmark indicator data that provide for a conservative estimate of the potential for viable bioaerosols to be generated by B. anthracis spores during wastewater treatment processes.
8.3 Conclusion: Could the Spore Form of Bacillus anthracis Form Viable Exposure Pathways in the Wastewater System?
The spore form of B. anthracis is found to exhibit HCP characteristics in a wastewater system. Disease transmission is documented to occur for all routes of exposure identified in the conceptual exposure model: inhalation, incidental ingestion, dermal contact, and ocular or oral mucous membrane contact. There is low uncertainty in the identified routes of exposure that may contribute to disease transmission. The case study evaluated the introduction of B. anthracis spores introduced to the system through the management of decontamination wastewater. All potentially complete exposure pathways identified in the conceptual exposure model for wastewater systems were VEP for B. anthracis spores. There is low uncertainty that B. anthracis spores can persist in wastewater and deposited droplets for time durations relevant to wastewater system exposure. Figure 8-1 summarizes screening process outputs. Figure 8-1 includes the conceptual exposure model, which is identical to Figure 6-1, with the exclusion of the residential toilet as one of the sources. The final determination is that the spore form of B. anthracis could exhibit the behavior of an HCP and will result in VEP in the wastewater system for all identified pathways and associated routes of exposure.

68
Figure 8-1. Summ
ary of Bacillus anthracis spore exposure pathw
ays and screening process outputs.

69
9 Data Gaps and Suggested Research to Further Refine Screening Process
The review of available literature and development of the screening process highlighted data gaps that could be bridged with future research to increase the reliability of screening process evaluations. Five key areas were identified for future research:
• Development of analytical techniques for counting enveloped viruses in wastewater and bioaerosols with known levels of recovery, which would support quantitative microbial exposure assessment. Current technologies allow for infectious virus recovery from liquid and aerosol media with live virus assay readouts and molecular methods (e.g. qPCR and next-generation sequencing approaches) that analyze genetic material recovery in background and spiked matrices. While these methods exist, they are typically used for qualitative or relative assessments. As a result, the methods will need to be tested and validated using studies exposing several surrogate agents to typical conditions and evaluating recovery. Methods should incorporate testing in the presence of background material, both abiotic and biotic, to ensure that recoveries are consistent with those expected in specific matrices and media. Multiple surrogates should be evaluated to identify appropriate surrogates for diverse pathogens and their recovery in each system. For example, multiple enveloped viruses may be used to compare enveloped virus emerging pathogens known for increased stability (e.g., alphaviruses) versus those with decreased stability (e.g., filoviruses). Surrogates may need to span multiple virus families to appropriately determine quantitative microbial exposure. Data will define surrogate agents with known recovery that can then be used for quantitative fate and transport evaluations and microbial exposure assessment.
• Development of data sets to better understand the driving mechanisms and quantitative relationship between culture-based and molecular-based approaches for biological groups in matrices of interest (e.g., human feces, wastewater, bioaerosols). Currently, each culture-based approach must be linked with a specific molecular method, often independent of other related methods. In addition, molecular methods are often specific to each pathogen, and commercial-off-the shelf methods are often focused for biodefense or diagnostic applications. With the large number of molecular and protein-based methods available for pathogen detection (e.g., enzyme linked immunosorbent assay [ELISA], PCR, immunofluorescence), the most appropriate in-use methods should be evaluated in direct comparison between microorganisms spiked into WWTP matrices (e.g., feces, wastewater, bioaerosols) and processed in parallel for generation of data to quantitatively compare culture-based and molecular approaches. The ultimate goal would be the development of viability-corrected measures suitable for use in the matrices of interest (e.g., Desneux et al. [2016], developed for evaluation of animal manure).
• Development of data sets that describe type and magnitude of exposure relative to the use of toilet and the range of potential technologies used in each treatment unit processes (e.g., primary, secondary treatment, sludge management). The results of the literature review indicate the existence of significant data gaps for experimentally derived exposure data associated with individual elements (e.g., toilet flush, treatment processes) in wastewater systems. Data are not currently available for enveloped viruses, a biological group that is identified as more likely to contribute to emerging pathogens than other biological

70
groups. Exposure monitoring data should be developed to confirm the presence and potential magnitude of hypothesized exposure pathways in the wastewater system.
Given the diversity of WWTP processes, exposure data should be developed that reflects the breadth of treatment technologies in common use. Data should capture processes and generate concurrent measurements for multiple media (e.g., wastewater, bioaerosol, deposited wastewater on surfaces). Additionally, individual bioassessment data could also be captured (e.g., wipe of hands, breathing zone air measurement) to better estimate exposures. Given the inability to generate data for emerging pathogens of greatest current interest, surrogates should be selected based on the most relevant fate and transport characteristics of the process of interest.
• Evaluate aggregate exposure of individual WWTP workers based on contact with multiple unit processes during typically defined job descriptions. Data on typical job tasks, work locations, and associated time durations for workers across the range of typical WWTP sizes would add to the available data to quantify worker exposures to pathogens during the work day. Ideally, a survey vehicle (i.e., methodology) could be designed to capture data describing the size of the plant, treatment systems, region of county, seasonal variation, indoor/outdoor environmental conditions (e.g., temperature, relative humidity), and process-specific location exposure during the work day.
• Performance of studies for persistence and other measures in environmental conditions (e.g., high humidity, winter temperature conditions) typical for WWTP in indoor and outdoor settings to generate data suitable for assessment across the United States. Studies evaluating pathogen persistence in different environments may require an initial evaluation of indoor and outdoor microbial load and environmental conditions. Pathogen- or surrogate-spiked samples, in both liquid and aerosol forms, should be exposed to typical indoor WWTP environments and exposures that WWTP workers encounter, including appropriate background biotic material. Persistence data can be gathered in conjunction with live agent recovery methods (e.g., culture-based) or molecular-based methods that are correlated with infectious agent recovery. These data might enable quantitative risk assessment for WWTP worker exposure to infectious aerosols and water for a wide variety of emerging pathogens.

71
10 Glossary
bioaerosol: Bioaerosols are small solid or liquid particles that contain microbiological organisms. complete exposure pathway: An exposure pathway that includes a source of contamination, an environmental media and transport mechanism, a point of exposure, a route of exposure, and a receptor population. conceptual exposure model: Model to describe the source, source-releasing mechanism, exposure medium/media, and route(s) of exposure for all exposure pathways associated with the wastewater exposure scenario. droplet: Wastewater particle that is too large to be suspended in air for an extended period of time or to be transported by air for distance (e.g., 5 to 10 meters) under still air conditions. The term can be used to describe the phases of a released bioaerosol particle (i.e., droplet to droplet nuclei after initial evaporation of water from the particle) or to distinguish between particles that can be aerosolized versus large droplets that will stay airborne a short period of time (e.g., splash). In the context of the wastewater assessment, the droplets are released from the toilet bowl contents or wastewater. In contrast to specific use of the terms droplet or droplet transmission in human disease transmission studies, the term droplet does not imply that the source is the human respiratory tract of an infected individual that then must land on mucous membranes for disease transmission (e.g., see definition of droplet transmission in Siegel et al. [2007]). exposure: Contact of a microorganism with the outer boundary of a receptor and available for absorption or intake. Exposure can be evaluated qualitatively (i.e., the presence/absence of a complete exposure pathway for a specified route of exposure) or quantitatively (i.e., a measure of the agent available at the outer boundary). Modified from U.S. Environmental Protection Agency (2012). exposure scenario: An exposure scenario is the set of conditions or assumptions about sources, exposure pathways, amounts or concentrations of microorganisms, and the characteristics of the exposed individual, population, or population that constitute one or more exposures. Source: U.S. Environmental Protection Agency (2012). exposure pathway: The course a microorganism (also termed biological agent) takes from a source to an exposed receptor. Each complete exposure pathway includes a source or release from a source, an exposure point (such as water, air, or a surface), an exposure route, and a receptor. If the exposure point differs from the source, a transport/exposure medium (e.g., air) or media (in cases of intermedia transfer) also is included. Modified from U.S. Environmental Protection Agency (1989). high-consequence pathogen: A pathogen that exhibits disease transmission potential in a wastewater system as described by: (1) shedding of viable pathogen in feces, urine, or vomit described in the human or relevant animal model or other means of entry to the wastewater system, (2) documented disease transmission from acute exposure in the human or relevant animal model for at least one of the following routes of exposure: inhalation of bioaerosol, dermal contact, incidental ingestion, ocular or oral mucous membrane contact, and (3) severe or

72
lethal illness documented to result from infection from routes of exposure associated with disease transmission. receptor: Humans who may have potential or actual exposure to microorganism. Source: U.S. Environmental Protection Agency (2014). route of exposure: Describes how the pathogen comes in contact with the vulnerable host receptor cells that support intake and subsequent infection (e.g., inhalation, dermal contact, oral). Source: U.S. Environmental Protection Agency (2014). source: The entity (or entities) that supply microorganisms to an identified exposure pathway. In the context of the wastewater assessment, potential sources include the infected individual who sheds viable pathogen in defined bodily fluids (i.e., feces, urine, vomit) or intentionally produced pathogens directly added to wastewater system. Modified from: U.S. Environmental Protection Agency (2014). viable exposure pathway: A complete exposure pathway for a microorganism that includes routes of exposure with documented disease transmission potential. wastewater system: The toilet, collection system, and wastewater treatment plant treatment processes.

73
11 References
Adcock, N. J., E. W. Rice, M. Sivaganesan, J. D. Brown, D. E. Stallknecht and D. E. Swayne (2009). The Use of Bacteriophages of the Family Cystoviridae as Surrogates for H5N1 Highly Pathogenic Avian Influenza Viruses in Persistence and Inactivation Studies. Journal of Environmental Science and Health, Part A 44(13): 1362-1366.
Ansari, S. A., S. R. Farrah and G. R. Chaudhry (1992). Presence of Human Immunodeficiency Virus Nucleic Acids in Wastewater and Their Detection by Polymerase Chain Reaction. Applied and Environmental Microbiology 58(12): 3984-3990.
Arduino, M. J. (2015). Ebola and Other Emerging Health Threats in Sewage and Wastewater: Protecting Workers from Potential Exposures. The National Association of Clean Water Agencies National Pretreatment and Pollution Prevention Workshop and Training Hyatt Regency Greenville, Greenville South Carolina, May 12-15, 2015.
Arena, C., J. P. Amoros, V. Vaillant, K. Balay, R. Chikhi-Brachet, L. Varesi, J. Arrighi, T. Blanchon, F. Carrat, T. Hanslik and A. Falchi (2012). Simultaneous Investigation of Influenza and Enteric Viruses in the Stools of Adult Patients Consulting in General Practice for Acute Diarrhea. Virology Journal 9: 116.
Barker, J. and M. V. Jones (2005). The Potential Spread of Infection Caused by Aerosol Contamination of Surfaces after Flushing a Domestic Toilet. Journal of Applied Microbiology 99(2): 339-347.
Bauer, H., M. Fuerhacker, F. Zibuschka, H. Schmid and H. Puxbaum (2002). Bacteria and Fungi in Aerosols Generated by Two Different Types of Wastewater Treatment Plants. Water Research 36(16): 3965-3970.
Bausch, D. G. (2011). Ebola Virus as a Foodborne Pathogen? Cause for Consideration, but Not Panic. Journal of Infectious Diseases 204(2): 179-181.
Baylor, E. R., M. B. Baylor, D. C. Blanchard, L. D. Syzdek and C. Appel (1977a). Virus Transfer from Surf to Wind. Science 198(4317): 575-580.
Baylor, E. R., V. Peters and M. B. Baylor (1977b). Water-to-Air Transfer of Virus. Science 197(4305): 763-764.
Beatty, M. E., D. A. Ashford, P. M. Griffin, R. V. Tauxe and J. Sobel (2003). Gastrointestinal Anthrax: Review of the Literature. Archives of Internal Medicine 163(20): 2527-2531.
Best, E. L., J. A. T. Sandoe and M. H. Wilcox (2012). Potential for Aerosolization of Clostridium difficile after Flushing Toilets: The Role of Toilet Lids in Reducing Environmental Contamination Risk. Journal of Hospital Infection 80(1): 1-5.
Bibby, K., N. A. de Carvalho and K. Wigginton (2017). Research Needs for Wastewater Handling in Virus Outbreak Response. Environmental Science & Technology 51: 2534-2535.
Bibby, K., L. W. Casson, E. Stachler and C. N. Haas (2015a). Ebola Virus Persistence in the Environment: State of the Knowledge and Research Needs. Environmental Science & Technology Letters 2(1): 2-6.
Bibby, K., R. J. Fischer, L. W. Casson, E. Stachler, C. N. Haas and V. J. Munster (2015b). Persistence of Ebola Virus in Sterilized Wastewater. Environmental Science & Technology Letters 2(9): 245-249.

74
Bibby, K. and J. Peccia (2013). Identification of Viral Pathogen Diversity in Sewage Sludge by Metagenome Analysis. Environmental Science & Technology 47(4): 1945-1951.
Blanchard, D. C. and L. D. Syzdek (1982). Water-to-Air Transfer and Enrichment of Bacteria in Drops from Bursting Bubbles. Applied and Environmental Microbiology 43(5): 1001-1005.
Borio, L., T. Inglesby, C. J. Peters, A. L. Schmaljohn, J. M. Hughes, P. B. Jahrling, T. Ksiaszek, K. M. Johnson, A. Meyerhoff, T. O'Toole, M. S. Ascher, J. Bartlett, J. G. Breman, E. M. Eitzen Jr, M. Hamberg, J. Hauer, D. A. Henderson, R. T. Johnson, G. Kwik, M. Layton, S. Lillibridge, G. J. Nabel, M. T. Osterholm, T. M. Perl, P. Russell, K. Tonat and For the Working Group on Civilian Biodefense (2002). Hemorrhagic Fever Viruses: Medical and Public Health Management. JAMA : Journal of the American Medical Association 287(18): 2391-2405.
Brainard, J., K. Pond, L. Hooper, K. Edmunds and P. Hunter (2016). Presence and Persistence of Ebola or Marburg Virus in Patients and Survivors: A Rapid Systematic Review. PLoS Neglected Tropical Diseases 10(2): e0004475.
Brainard, J., K. Pond and P. R. Hunter (2017). Censored Regression Modeling to Predict Virus Inactivation in Wastewaters. Environmental Science & Technology 51(3): 1795-1801.
Brandi, G., M. Sisti and G. Amagliani (2000). Evaluation of the Environmental Impact of Microbial Aerosols Generated by Wastewater Treatment Plants Utilizing Different Aeration Systems. Journal of Applied Microbiology 88(5): 845-852.
Breiman, R. F. (1996). Impact of Technology on the Emergence of Infectious Diseases. Epidemiologic Reviews 18(1): 4-9.
Broadhurst, M. J., T. J. G. Brooks and N. R. Pollock (2016). Diagnosis of Ebola Virus Disease: Past, Present, and Future. Clinical Microbiology Reviews 29(4): 773-793.
Carducci, A., E. Tozzi, E. Rubulotta, B. Casini, L. Cantiani, E. Rovini, M. Muscillo and R. Pacini (2000). Assessing Airborne Biological Hazard from Urban Wastewater Treatment. Water Research 34(4): 1173-1178.
Casanova, L., W. A. Rutala, D. J. Weber and M. D. Sobsey (2009). Survival of Surrogate Coronaviruses in Water. Water Research 43(7): 1893-1898.
Casanova, L. M. and S. R. Weaver (2015). Inactivation of an Enveloped Surrogate Virus in Human Sewage. Environmental Science & Technology Letters 2(3): 76-78.
Casson, L. W., C. A. Sorber, R. H. Palmer, A. Enrico and P. Gupta (1992). HIV Survivability in Wastewater. Water Environment Research 64(3): 213-215.
Chakrabarti, A. K., L. Caruso, M. Ding, C. Shen, W. Buchanan, P. Gupta, C. R. Rinaldo and Y. Chen (2009). Detection of HIV-1 RNA/DNA and Cd4 mRNA in Feces and Urine from Chronic HIV-1 Infected Subjects with and without Anti-Retroviral Therapy. AIDS Research and Therapy 6: 20.
Chattopadhyay, S., and R. W. Puls. (1999) Adsorption of Bacteriophages on Clay Minerals. Environmental Science & Technology 33(20): 3609-3614.
Chattopadhyay, D., S. Chattopadhyay, W. G. Lyon, and J. T. Wilson. (2002) Effect of Surfactants on the Survival and Sorption of Viruses. Environmental Science & Technology 36(19): 4017-4024.

75
Chattopadhyay, S., S. D. Perkins, M. Shaw and T. L. Nichols. (2017). Evaluation of Exposure to Brevundimonas diminuta and Pseudomonas aeruginosa During Showering. Journal of Aerosol Science 114:77-93.
Chughtai, A. A., M. Barnes and C. R. Macintyre (2016). Persistence of Ebola Virus in Various Body Fluids During Convalescence: Evidence and Implications for Disease Transmission and Control. Epidemiology and Infection 144(8): 1652-1660.
Clark, C. S., A. B. Bjornson, G. M. Schiff, J. P. Phair, G. L. Van Meer and P. S. Gartside (1977). Sewage Worker's Syndrome. Lancet 309(8019): 1009.
Darlow, H. M. and W. R. Bale (1959). Infective Hazards of Water-Closets. The Lancet 1(7084): 1196-1200.
David, S., J. Peter, R. Raju, P. Padmaja and P. Mohanraj (2010). Oculocutaneous Anthrax: Detection and Treatment. Clinical Ophthalmology 4: 713-716.
Decrey, L., S. Kazama and T. Kohn (2016). Ammonia as an In-situ Sanitizer: Influence of Virus Genome Type on Inactivation. Applied and Environmental Microbiology 82(16): 4909-4920.
Desneux, J., A. Biscuit, S. Picard and A.-M. Pourcher (2016). Fate of Viable but Non-Culturable Listeria Monocytogenes in Pig Manure Microcosms. Frontiers in Microbiology 7: 245.
Dias, E., J. Ebdon and H. Taylor (2015). The Application of Removal Coefficients for Viruses in Different Wastewater Treatment Processes Calculated Using Stochastic Modelling. Water Science and Technology 71(9): 1382-1388.
Falkinham III, J. O. (2003). Mycobacterial Aerosol and Respiratory Disease. Emerging Infectious Diseases 9(7): 763-767.
Feachem, R. G., D. J. Bradley, H. Garelick and D. D. Mara (1983). Sanitation and Disease: Health Aspects of Excreta and Wastewater Management. Series: World Bank Studies in Water Supply and Sanitation 3. New York: John Wiley & Sons.
Fernando, N. L. and P. M. Fedorak (2005). Changes at an Activated Sludge Sewage Treatment Plant Alter the Numbers of Airborne Aerobic Microorganisms. Water Research 39(19): 4597-4608.
Fernstrom, A. and M. Goldblatt (2013). Aerobiology and Its Role in the Transmission of Infectious Diseases. Journal of Pathogens 2013: 493960.
Fischer, R., S. Judson, K. Miazgowicz, T. Bushmaker, J. Prescott and V. J. Munster (2015). Ebola Virus Stability on Surfaces and in Fluids in Simulated Outbreak Environments. Emerging Infectious Disease 21(7): 1243-1246.
Fischer, W. A. and D. A. Wohl (2016). Responding to the Global Threat of High-Consequence Pathogens: Protecting Health Care Workers and Caring for Patients. Ann. Am. Thoracic Soc. 13(5): 584–585.
Fracchia, L., S. Pietronave, M. Rinaldi and M. Giovanna Martinotti (2006). Site-Related Airborne Biological Hazard and Seasonal Variations in Two Wastewater Treatment Plants. Water Research 40(10): 1985-1994.
Gelaw, Y. and T. Asaminew (2013). Periocular Cutaneous Anthrax in Jimma Zone, Southwest Ethiopia: A Case Series. BMC Research Notes 6: 313.

76
Gendron, L., D. Verreault, M. Veillette, S. Moineau and C. Duchaine (2010). Evaluation of Filters for the Sampling and Quantification of RNA Phage Aerosols. Aerosol Science and Technology 44(10): 893-901.
Gerba, C. P., C. Wallis and J. L. Melnick (1975). Microbiological Hazards of Household Toilets: Droplet Production and the Fate of Residual Organisms. Applied Microbiology 30(2): 229-237.
Greenberg, D. L., J. D. Busch, P. Keim and D. M. Wagner (2010). Identifying Experimental Surrogates for Bacillus anthracis Spores: A Review. Investigative Genetics 1: 4.
Gundy, P. M., C. P. Gerba and I. L. Pepper (2008). Survival of Coronaviruses in Water and Wastewater. Food and Environmental Virology 1(1): 10-14.
Haas, C. N., T. Rycroft, K. Bibby and L. Casson (2017). Risks from Ebolavirus Discharge from Hospitals to Sewer Workers. Water Environment Research 89(4): 357-368.
Haas, D., M. Unteregger, J. Habib, H. Galler, E. Marth and F. F. Reinthaler (2010). Exposure to Bioaerosol from Sewage Systems. Water, Air, and Soil Pollution 207(1): 49-56.
Hatch, M. T. and H. Wolochow (1969). Bacterial Survival: Consequences of the Airborne State. In: An Introduction to Experimental Aerobiology. R. L. Dimmick and A. B. Akers. (pp. 267-295). New York: John Wiley and Sons.
Heidelberg, J. F., M. Shahamat, M. Levin, I. Rahman, G. Stelma, C. Grim and R. R. Colwell (1997). Effect of Aerosolization on Culturability and Viability of Gram-Negative Bacteria. Applied and Environmental Microbiology 63(9): 3585-3588.
Heinonen-Tanski, H., T. Reponen and J. Koivunen (2009). Airborne Enteric Coliphages and Bacteria in Sewage Treatment Plants. Water Research 43(9): 2558-2566.
Hejkal, T. W., P. A. LaRock and J. W. Winchester (1980). Water-to-Air Fractionalization of Bacteria. Applied and Environmental Microbiology 39(2): 335-338.
Hejkal, T. W., F. M. Wellings, A. L. Lewis and P. A. LaRock (1981). Distribution of Viruses Associated with Particles in Waste Water. Applied and Environmental Microbiology 41(3): 628-634.
Hines, S. A., D. J. Chappie, R. A. Lordo, B. D. Miller, R. J. Janke, H. A. Lindquist, K. R. Fox, H. S. Ernst and S. C. Taft (2014). Assessment of Relative Potential for Legionella Species or Surrogates Inhalation Exposure from Common Water Uses. Water Research 56: 203-213.
Hovi, T., M. Stenvik, H. Partanen and A. Kangas (2001). Poliovirus Surveillance by Examining Sewage Specimens. Quantitative Recovery of Virus after Introduction into Sewerage at Remote Upstream Location. Epidemiology and Infection 127(1): 101-106.
Hung, H. F., Y. M. Kuo, C. C. Chien and C. C. Chen (2010). Use of Floating Balls for Reducing Bacterial Aerosol Emissions from Aeration in Wastewater Treatment Processes. Journal of Hazardous Materials 175(1-3): 866-871.
Ijaz, M. K., A. H. Brunner, S. A. Sattar, R. C. Nair and C. M. Johnson-Lussenburg (1985). Survival Characteristics of Airborne Human Coronavirus 229E. Journal of General Virology 66 (Pt 12): 2743-2748.
Inglesby, T. V., T. O'Toole, D. A. Henderson, J. G. Bartlett, M. S. Ascher, E. Eitzen, A. M. Friedlander, J. Gerberding, J. Hauer, J. Hughes, J. McDade, M. T. Osterholm, G. Parker,

77
T. M. Perl, P. K. Russell, K. Tonat and for the Working Group on Civilian Biodefense (2002). Anthrax as a Biological Weapon, 2002. Updated Recommendations for Management. JAMA: Journal of the American Medical Association 287(17): 2236-2252.
Jaax, N. K., K. J. Davis, T. J. Geisbert, P. Vogel, G. P. Jaax, M. Topper and P. B. Jahrling (1996). Lethal Experimental Infection of Rhesus Monkeys with Ebola-Zaire (Mayinga) Virus by the Oral and Conjunctival Route of Exposure. Archives of Pathology and Laboratory Medicine 120(2): 140-155.
Johnson, D., R. Lynch, C. Marshall, K. Mead and D. Hirst (2013a). Aerosol Generation by Modern Flush Toilets. Aerosol Science and Technology: the Journal of the American Association for Aerosol Research 47(9): 1047-1057.
Johnson, D. L., K. R. Mead, R. A. Lynch and D. V. Hirst (2013b). Lifting the Lid on Toilet Plume Aerosol: A Literature Review with Suggestions for Future Research. American Journal of Infection Control 41(3): 254-258.
Johnson, E., N. Jaax, J. White and P. Jahrling (1995). Lethal Experimental Infections of Rhesus Monkeys by Aerosolized Ebola Virus. International Journal of Experimental Pathology 76(4): 227-236.
Judson, S., J. Prescott and V. Munster (2015). Understanding Ebola Virus Transmission. Viruses 7(2): 511-521.
Karra, S. and E. Katsivela (2007). Microorganisms in Bioaerosol Emissions from Wastewater Treatment Plants During Summer at a Mediterranean Site. Water Research 41(6): 1355-1365.
Khuder, S. A., T. Arthur, M. S. Bisesi and E. A. Schaub (1998). Prevalence of Infectious Diseases and Associated Symptoms in Wastewater Treatment Workers. American Journal of Industrial Medicine 33(6): 571-577.
Koonin L. M., D. J. Jamieson, J. A. Jernigan, C. A. Van Beneden, C. Kosmos, M. C. Harvey, H. Pietz, J. Bertolli, J. F. Perz, C. G. Whitney, et al. (2015) Systems for rapidly detecting and treating persons with Ebola virus disease: United States. Available online at http://www.cdc.gov/mmwr/preview/mmwrhtml/mm6408a5.htm (accessed February 26, 2018).
Laitinen, S., J. Kangas, M. Kotimaa, J. Liesivuori, P. J. Martikainen, A. Nevalainen, R. Sarantila and K. Husman (1994). Workers' Exposure to Airborne Bacteria and Endotoxins at Industrial Wastewater Treatment Plants. American Industrial Hygiene Association Journal 55(11): 1055-1060.
Lever, M. S., A. J. Stagg, M. Nelson, P. Pearce, D. J. Stevens, E. A. M. Scott, A. J. H. Simpson and M. J. Fulop (2008). Experimental Respiratory Anthrax Infection in the Common Marmoset (Callithrix jacchus). International Journal of Experimental Pathology 89(3): 171-179.
Li, J., L. Zhou, X. Zhang, C. Xu, L. Dong and M. Yao (2016). Bioaerosol Emissions and Detection of Airborne Antibiotic Resistance Genes from a Wastewater Treatment Plant. Atmospheric Environment 124, Part B: 404-412.
Lin, K. and L. C. Marr (2017). Aerosolization of Ebola Virus Surrogates in Wastewater Systems. Environmental Science & Technology 51(5): 2669-2675.

78
Lodder, W. J., A. M. Buisman, S. A. Rutjes, J. C. Heijne, P. F. Teunis and A. M. de Roda Husman (2012). Feasibility of Quantitative Environmental Surveillance in Poliovirus Eradication Strategies. Applied and Environmental Microbiology 78(11): 3800-3805.
Lowe, J. J., S. G. Gibbs, S. S. Schwedhelm, J. Nguyen and P. W. Smith (2014). Nebraska Biocontainment Unit Perspective on Disposal of Ebola Medical Waste. American Journal of Infection Control 42(12): 1256-1257.
MacDonald, W. D. (1942). Anthrax: Report of a Fatal Case Involving the Cutaneous and Gastrointestinal Systems. The New England Journal of Medicine 226(24): 949-951.
Masclaux, F. G., P. Hotz, D. Gashi, D. Savova-Bianchi and A. Oppliger (2014). Assessment of Airborne Virus Contamination in Wastewater Treatment Plants. Environmental Research 133: 260-265.
Medema, G., B. Wullings, P. Roeleveld and D. van der Kooij (2004). Risk Assessment of Legionella and Enteric Pathogens in Sewage Treatment Works. Water Science and Technology: Water Supply 4(2): 125-132.
Michen, B. and T. Graule (2010). Isoelectric Point of Viruses. Journal of Applied Microbiology, 109(2): 388-397.
Minett, F. C. (1950). Sporulation and Viability of B. anthracis in Relation to Environmental Temperature and Humidity. Journal of Comparative Pathology 60(3): 161-176.
Minodier, L., R. N. Charrel, P. E. Ceccaldi, S. van der Werf, T. Blanchon, T. Hanslik and A. Falchi (2015). Prevalence of Gastrointestinal Symptoms in Patients with Influenza, Clinical Significance, and Pathophysiology of Human Influenza Viruses in Faecal Samples: What Do We Know? Virology Journal 12: 215. DOI 210.1186/s12985-12015-10448-12984
Mire, C. E., J. B. Geisbert, K. N. Agans, D. J. Deer, K. A. Fenton and T. W. Geisbert (2016). Oral and Conjunctival Exposure of Nonhuman Primates to Low Doses of Ebola Makona Virus. Journal of Infectious Diseases 214(Supplement 3): S263-S267.
Moore, B. E. (1993). Survival of Human Immunodeficiency Virus (HIV), HIV-Infected Lymphocytes, and Poliovirus in Water. Applied and Environmental Microbiology 59(5): 1437-1443.
Morawska, L. (2006). Droplet Fate in Indoor Environments, or Can We Prevent the Spread of Infection? Indoor Air 16(5): 335-347.
NACWA (National Association of Clean Water Agencies). (2005). "Planning for Decontamination Wastewater: A Guide for Utilities." Washington DC NACWA. Available online at http://www.ecoresourcegroup.com/pdf/Planning%20for%20Decontamination%20Wastewater%202005-10decon.pdf (accessed February 13, 2017).
NASEMSO (National Association of State EMS Officials). (2018). “Enhancing the Ability of EMS to Transport Patients with Confirmed or Suspected Ebola and other High Consequence Infectious Diseases. Available online at https://www.nasemso.org/Councils/Health-Medical-Preparedness/documents/NASEMSO-HCID-Presentation.pdf (accessed February 26, 2018).

79
National Research Council (2006). Chapter 3: Generation and Characterization of Aerosolized Agents. Overcoming Challenges to Develop Countermeasures against Aerosolized Bioterrorism Agents: Appropriate Use of Animal Models. (pp. 21-28). Washington DC: National Academies Press.
Noyce, J. O., H. Michels and C. W. Keevil (2007). Inactivation of Influenza A Virus on Copper Versus Stainless Steel Surfaces. Applied and Environmental Microbiology 73(8): 2748-2750.
O'Toole, J., M. Keywood, M. Sinclair and K. Leder (2009). Risk in the Mist? Deriving Data to Quantify Microbial Health Risks Associated with Aerosol Generation by Water-Efficient Devices During Typical Domestic Water-Using Activities. Water Science and Technology 60(11): 2913-2920.
Olejnik, J., A. Forero, L. R. Deflubé, A. J. Hume, W. A. Manhart, A. Nishida, A. Marzi, M. G. Katze, H. Ebihara, A. L. Rasmussen and E. Mühlberger (2017). Ebolaviruses Associated with Differential Pathogenicity Induce Distinct Host Responses in Human Macrophages. Journal of Virology 91(11): e00179-17.
Ort, C., M. G. Lawrence, J. Rieckermann and A. Joss (2010). Sampling for Pharmaceuticals and Personal Care Products (PPCPs) and Illicit Drugs in Wastewater Systems: Are Your Conclusions Valid? A Critical Review. Environmental Science & Technology 44(16): 6024-6035.
Palmer, C. J., M. H. Lee, G. F. Bonilla, B. J. Javier, E. B. Siwak and Y. L. Tsai (1995). Analysis of Sewage Effluent for Human Immunodeficiency Virus (HIV) Using Infectivity Assay and Reverse Transcriptase Polymerase Chain Reaction. Canadian Journal of Microbiology 41(9): 809-815.
Pascual, L., S. Pérez-Luz, M. A. Yáñez, A. Santamaría, K. Gibert, M. Salgot, D. Apraiz and V. Catalán (2003). Bioaerosol Emission from Wastewater Treatment Plants. Aerobiologia 19(3-4): 261-270.
Phillpotts, R. J., R. J. Thomas, R. J. Beedham, S. D. Platt and C. A. Vale (2010). The Cystovirus Phi6 as a Simulant for Venezuelan Equine Encephalitis Virus. Aerobiologia 26(4): 301-309.
Piercy, T. J., S. J. Smither, J. A. Steward, L. Eastaugh and M. S. Lever (2010). The Survival of Filoviruses in Liquids, on Solid Substrates and in a Dynamic Aerosol. Journal of Applied Microbiology 109(5): 1531-1539.
Poliquin PG, Vogt F, Kasztura M, A. Leaung, Y. Deschambault, R. Van den Bergh, C. Dorion, P. Maes, A. Kamara, G. Kobinger, A. Sprecher and J. E. Strong (2016). Environmental Contamination and Persistence of Ebola Virus RNA in an Ebola Treatment Center. J. Infect. Dis. 214:145–52.
Prescott, J., T. Bushmaker, R. Fischer, K. Miazgowicz, S. Judson and V. J. Munster (2015). Postmortem Stability of Ebola Virus. Emerging Infectious Diseases 21(5): 856-859.
Public Health England. (2018). Global high consequence infectious disease events. Emerging Infections and Zoonoses Section. PHE Publications gateway number: 2017794.
Rose, C., A. Parker, B. Jefferson and E. Cartmell (2015). The Characterization of Feces and Urine: A Review of the Literature to Inform Advanced Treatment Technology. Critical Reviews in Environmental Science & Technology 45(17): 1827-1879.

80
Roy, C. J. and D. K. Milton (2004). Airborne Transmission of Communicable Infection - The Elusive Pathway. The New England Journal of Medicine 350(17): 1710-1712.
Roy, C. J., D. S. Reed and J. A. Hutt (2010). Aerobiology and Inhalation Exposure to Biological Select Agents and Toxins. Veterinary Pathology 47(5): 779-789.
Rylander, R., K. Andersson, L. Belin, G. Berglund, R. Bergstrom, L. A. Hanson, M. Lundholm and I. Mattsby (1976). Sewage Worker's Syndrome. Lancet 308(7983): 478-479.
Sanchez-Monedero, M. A., M. I. Aguilar, R. Fenoll and A. Roig (2008). Effect of the Aeration System on the Levels of Airborne Microorganisms Generated at Wastewater Treatment Plants. Water Research 42(14): 3739-3744.
Schibler, M., P. Vetter, P. Cherpillod, T. J. Petty, S. Cordey, G. Vieille, S. Yerly, C. A. Siegrist, K. Samii, J. A. Dayer, M. Docquier, E. M. Zdobnov, A. J. Simpson, P. S. Rees, F. B. Sarria, Y. Gasche, F. Chappuis, A. Iten, D. Pittet, J. Pugin and L. Kaiser (2015). Clinical Features and Viral Kinetics in a Rapidly Cured Patient with Ebola Virus Disease: A Case Report. The Lancet. Infectious Diseases 15(9): 1034-1040.
Schuit, M., D. M. Miller, M. S. Reddick-Elick, C. B. Wlazlowski, C. M. Filone, A. Herzog, L. A. Colf, V. Wahl-Jensen, M. Hevey and J. W. Noah (2016). Differences in the Comparative Stability of Ebola Virus Makona-C05 and Yambuku-Mayinga in Blood. PLoS One 11(2): e0148476.
Siegel J. D., E. Rhinehart, M. Jackson, L. Chiarello and the Healthcare Infection Control Practices Advisory Committee (2007). Guideline for Isolation Precautions: Preventing Transmission of Infectious Agents in Healthcare Settings 2007. Available online from https://www.cdc.gov/infectioncontrol/pdf/guidelines/isolation-guidelines.pdf (accessed February 15, 2018).
Sinclair, R., S. A. Boone, D. Greenberg, P. Keim and C. P. Gerba (2008). Persistence of Category A Select Agents in the Environment. Applied and Environmental Microbiology 74(3): 555-563.
Sinclair, R. G., J. B. Rose, S. A. Hashsham, C. P. Gerba and C. N. Haas (2012). Criteria for Selection of Surrogates Used to Study the Fate and Control of Pathogens in the Environment. Applied and Environmental Microbiology 78(6): 1969-1977.
Slade, J. S., E. B. Pike, R. P. Eglin, J. S. Colbourne and J. B. Kurtz (1989). The Survival of Human Immunodeficiency Virus in Water, Sewage and Sea Water. Water Science and Technology 21(3): 55-59.
Slote, L. (1976). Viral Aerosols - a Potential Occupationally Related Health Threat in Aerated Wastewater Treatment Systems. Journal of Environmental Health 38(5): 310-314.
Sobsey, M. D. and J. S. Meschke (2003). Virus Survival in the Environment with Special Attention to Survival in Sewage Droplets and Other Environmental Media of Fecal or Respiratory Origin. (Draft). World Health Organization International SARS Symposium, Rome, Italy, August 21, 2003, available from http://www.unc.edu/courses/2008spring/envr/421/001/WHO_VirusSurvivalReport_21Aug2003.pdf (accessed November 2, 2017).
Tang, J. W., Y. Li, I. Eames, P. K. S. Chan and G. L. Ridgway (2006). Factors Involved in the Aerosol Transmission of Infection and Control of Ventilation in Healthcare Premises. Journal of Hospital Infection 64(2): 100-114.

81
Thomas, R. J., D. Webber, R. Hopkins, A. Frost, T. Laws, P. N. Jayasekera and T. Atkins (2011). The Cell Membrane as a Major Site of Damage During Aerosolization of Escherichia coli. Applied and Environmental Microbiology 77(3): 920-925.
Titcombe Lee, M., A. Pruden and L. C. Marr (2016). Partitioning of Viruses in Wastewater Systems and Potential for Aerosolization. Environmental Science & Technology Letters 3(5): 210-215.
Towner, J. S., P. E. Rollin, D. G. Bausch, A. Sanchez, S. M. Crary, M. Vincent, W. F. Lee, C. F. Spiropoulou, T. G. Ksiazek, M. Lukwiya, F. Kaducu, R. Downing and S. T. Nichol (2004). Rapid Diagnosis of Ebola Hemorrhagic Fever by Reverse Transcription-PCR in an Outbreak Setting and Assessment of Patient Viral Load as a Predictor of Outcome. Journal of Virology 78(8): 4330-4341.
Trouwborst, T., S. Kuyper, J. C. de Jong and A. D. Plantinga (1974). Inactivation of Some Bacterial and Animal Viruses by Exposure to Liquid-Air Interfaces. Journal of General Virology 24(1): 155-165.
Turgeon, N., M. J. Toulouse, B. Martel, S. Moineau and C. Duchaine (2014). Comparison of Five Bacteriophages as Models for Viral Aerosol Studies. Applied and Environmental Microbiology 80(14): 4242-4250.
U.S. Centers for Disease Control and Prevention (2010). Gastrointestinal Anthrax after an Animal-Hide Drumming Event - New Hampshire and Massachusetts, 2009. MMWR. Morbidity and Mortality Weekly Report 59(28): 872-877.
U.S. Environmental Protection Agency (1980). Wastewater Aerosols and Disease. Cincinnati, OH: Health Effects Research Laboratory, U.S. Environmental Protection Agency. EPA 600/9-80/028.
U.S. Environmental Protection Agency (1981). Potential Health Effects from Viable Emissions and Toxins Associated with Wastewater Treatment Plants and Land Application Sites. Cincinnati, OH: Health Effects Research Laboratory, U.S. Environmental Protection Agency. EPA 600/S1-81/006.
U.S. Environmental Protection Agency (1989). Risk Assessment Guidance for Superfund, Volume I, Human Health Evaluation Manual (Part A) Interim Final. Washington, DC: Office of Emergency and Remedial Response, U.S. Environmental Protection Agency. Available from http://www.epa.gov/oswer/riskassessment/ragsa/index.htm (accessed November 2, 2017). EPA/540/1-89/002.
U.S. Environmental Protection Agency (2011). Exposure Factors Handbook: 2011 Edition. Washington, DC: Office of Research and Development, U.S. Environmental Protection Agency. EPA/600/R-09/052F.
U.S. Environmental Protection Agency (2012). Microbial Risk Assessment Guideline: Pathogenic Microorganisms with Focus on Food and Water. Interagency Microbiological Risk Assessment Guideline Workgroup. EPA/100/J-12/001 and USDA/FSIS/2012-001.
U.S. Environmental Protection Agency (2014). Microbiological Risk Assessment (MRA) Tools, Methods, and Approaches for Water Media. Washington DC: Office of Science and Technology, Office of Water, U.S. Environmental Protection Agency. EPA-820-R-14-009.

82
U.S. Environmental Protection Agency (2016). Review of Bacillus anthracis Dose-Response Data for Human Health Risk Assessment. Cincinnati, OH: National Homeland Security Center Threat and Consequence Assessment Division, , U.S. Environmental Protection Agency. EPA/600/R-16/147.
Verreault, D., M. Marcoux-Voiselle, N. Turgeon, S. Moineau and C. Duchaine (2015). Resistance of Aerosolized Bacterial Viruses to Relative Humidity and Temperature. Applied and Environmental Microbiology 81(20): 7305-7311.
Verreault, D., S. Moineau and C. Duchaine (2008). Methods for Sampling of Airborne Viruses. Microbiology and Molecular Biology Reviews 72(3): 413-444.
Vetter, P., W. A. Fischer, 2nd, M. Schibler, M. Jacobs, D. G. Bausch and L. Kaiser (2017). Ebola Virus Shedding and Transmission: Review of Current Evidence The Journal of Infectious Diseases 214 (Suppl 3): S177-S184.
Viau, E. and J. Peccia (2009). Survey of Wastewater Indicators and Human Pathogen Genomes in Biosolids Produced by Class A and Class B Stabilization Treatments. Applied and Environmental Microbiology 75(1): 164-174.
Wallis, C., J. L. Melnick, V. C. Rao and T. E. Sox (1985). Method for Detecting Viruses in Aerosols. Applied and Environmental Microbiology 50(5): 1181-1186.
Weber, T. P. and N. I. Stilianakis (2008). Inactivation of Influenza A Viruses in the Environment and Modes of Transmission: A Critical Review. Journal of Infection 57: 361-373.
Wen, Q., C. Tutuka, A. Keegan and B. Jin (2009). Fate of Pathogenic Microorganisms and Indicators in Secondary Activated Sludge Wastewater Treatment Plants. Journal of Environmental Management 90(3): 1442-1447.
White, C. P., J. Popovici, D. A. Lytle, N. J. Adcock and E. W. Rice (2012). Effect of pH on the Electrophoretic Mobility of Spores of Bacillus anthracis and Its Surrogates in Aqueous Solutions. Applied and Environmental Microbiology 78(23): 8470-8473.
Wigginton, K. R., Y. Ye and R. M. Ellenberg (2015). Emerging Investigators Series: The Source and Fate of Pandemic Viruses in the Urban Water Cycle. Environmental Science: Water Research & Technology 1(6): 735-746.
Wolf, T., G. Kann, S. Becker, C. Stephan, H.-R. Brodt, P. de Leuw, T. Grünewald, T. Vogl, V. A. J. Kempf, O. T. Keppler and K. Zacharowski (2014). Severe Ebola Virus Disease with Vascular Leakage and Multiorgan Failure: Treatment of a Patient in Intensive Care. The Lancet 385(9976): 1428-1435.
Wood, J. P., K. M. Meyer, T. J. Kelly, Y. W. Choi, J. V. Rogers, K. B. Riggs and Z. J. Willenberg (2015). Environmental Persistence of Bacillus anthracis and Bacillus subtilis Spores. PLoS One 10(9): e0138083.
Woolhouse, M. and E. Gaunt (2007). Ecological Origins of Novel Human Pathogens. Critical Reviews in Microbiology 33(4): 231-242.
World Health Organization (2007). Review of the Latest Available Evidence on Potential Transmission of Avian Influenza (H5N1) through Water and Sewage and Ways to Reduce the Risks to Human Health (Last Updated 10/10/2007). Geneva, Switzerland: Water Sanitation and Health, World Health Organization. WHO/SDE/WSH/06.1 from

83
http://www.who.int/water_sanitation_health/emerging/h5n1background.pdf (accessed November 2, 2017).
World Health Organization (2015). Rapid Guidance on Decommissioning of Ebola Care Facilities. World Health Organization WHO/EVD/Guidance/Strategy/15.1 from http://www.who.int/iris/handle/10665/160198#sthash.iwHtOvDA.dpuf (accessed November 2, 2017).
World Health Organization (2017). Guidelines for Drinking-Water Quality (Fourth Edition, Incorporating the First Addendum). Geneva, Switzerland. ISBN 978-92-4-154995-0.
Yang, W. and L. C. Marr (2012). Mechanisms by Which Ambient Humidity May Affect Viruses in Aerosols. Applied and Environmental Microbiology 78(19): 6781-6788.
Ye, Y., R. M. Ellenberg, K. E. Graham and K. R. Wigginton (2016). Survivability, Partitioning, and Recovery of Enveloped Viruses in Untreated Municipal Wastewater. Environmental & Science Technology 50(10): 5077-5085.
Yu, I. T., H. Qiu, L. A. Tse and T. W. Wong (2014). Severe Acute Respiratory Syndrome Beyond Amoy Gardens: Completing the Incomplete Legacy. Clinical Infectious Diseases 58(5): 683-686.
Zabinski, J. W., K. J. Pieper and J. M. Gibson (2017). A Bayesian Belief Network Model Assessing the Risk to Wastewater Workers of Contracting Ebola Virus Disease During an Outbreak. Risk Analysis Epub Ahead of Print doi: 10.1111/risa.12827.

PRESORTED STANDARD POSTAGE & FEES PAID
EPA PERMIT NO. G-35
Office of Research and Development (8101R) Washington, DC 20460
Official Business Penalty for Private Use $300