exports, services and value added - a national, international - fiw
TRANSCRIPT

FIW, a collaboration of WIFO (www.wifo.ac.at), wiiw (www.wiiw.ac.at) and WSR (www.wsr.ac.at)
Exports, Services and Value Added -
A National, International and Regional Analysis for Austria
Bayerl, N., Fritz, O., Hierländer, R., Streicher, G.
FIW Research Report N° 008 / Export of Services & Competitiveness
June 2008
Austrian business cycles are strongly dependent on the development of foreign exports. The paper deals with two important issues in this context: What is the impact of foreign exports on total growth in the Austrian economy? A more and more globalized economy implies that the share of foreign imports in the production of export commodities increases. This suggests that the contribution of foreign exports to domestic growth will diminish over time – this hypothesis will be tested in the paper. In addition, the results for Austria will be compared with those for other countries in the EU as well as the OECD. Export activities are not evenly distributed over space: While some regions are more specialized in the production of commodities for the domestic market, other regions are much more dependent on foreign exports. In the paper, the regional economic consequences of the value-added impacts of foreign exports will be analysed. The paper will make use of national input-output tables for the years 1995, 2000 and 2003 as well as input-output tables for OECD countries to examine the national economic impacts of foreign exports and an international comparison. Furthermore, a multiregional model for Austria (“MultiREG”) will be applied for estimating the corresponding regional impacts.
Abstract
The FIW Research Reports show the results of the three thematic work packages ‘Export of Services’, ‘Foreign Direct Investment’ and ‘Competitiveness’, that were commissioned by the Austrian Federal Ministry of Economics and Labour (BMWA) within the framework of the ‘Research Centre International Economics” in November 2006.
FIW Studien – FIW Research Reports
Exports, Services and Value Added A National, International and Regional Analysis for Austria
Oliver Fritz, Robert Hierländer (WIFO), Nikolaus Bayerl (ST.AT), Gerhard Streicher (Joanneum Research)
Projektkoordination: Yvonne Wolfmayr, Irene Langer
März 2008
ÖSTERREICHISCHES INSTITUT FÜR WIRTSCHAFTSFORSCHUNG
A-1103 WIEN, POSTFACH 91
TEL. 798 26 01 • FAX 798 93 86

Exports, Services and Value Added A National, International and Regional Analysis for Austria
Oliver Fritz, Robert Hierländer (WIFO), Nikolaus Bayerl (ST.AT), Gerhard Streicher (Joanneum Research)
Studie im Rahmen des Leitprojekts "Forschungsschwerpunkt Internationale Wirtschaft (FIW)" des Österreichischen Instituts für Wirtschaftsforschung im Auftrag des Bundesministeriums für Wirtschaft und Arbeit
Arbeitspaket N°1 Dienstleistungsexport: Modul 4 Arbeitspaket N°3 Wettbewerbsfähigkeit: Modul 3
Begutachtung: Kurt Kratena Projektkoordination: Yvonne Wolfmayr, Irene Langer
März 2008
E-Mail-Adressen: [email protected], [email protected] 2008/065/A/2806
Exports, Services and Value Added A National, International and Regional Analysis for Austria
Table of contents
Tables III
Figures IV
1. Introduction 1
2. International trade and domestic growth revisited – the “bazaar”- hypothesis 7
2.1 Introduction 7 2.2 Theoretical background 8 2.3 Some critical points 10
3. An empirical analysis of exports at the national level 13 3.1 Data base and methods applied 13 3.2 Some stylized facts about foreign trade in Austria 15 3.3 First empirical evidence on the validity of “bazaar”-hypothesis for Austria 18 3.4 Results of the input-output multiplier analysis 23 3.5 Summary 34
4. An international analysis of export induced value added effects 35 4.1 Introduction and empirical facts 35 4.2 Value added effects of exports at an aggregate level 40 4.3 Value added effects of exports at a disaggregate level 46 4.4 Summary 56
5. An analysis of export-induced regional value added effects 59 5.1 Introduction 59 5.2 Regional exports 59 5.3 MultiREG 63
5.3.1 Inter-regional trade 65 5.3.2 Inter-regional trade patterns 66
- II -
5.4 Simulation of the regional value added effects of exports 70 5.4.1 National export structure 71 5.4.2 Regional export structure 73 5.4.3 Foreign Tourism 74
5.5 Summary 75
6. Summary and conclusions 77
7. References 81
8. Appendix 83
- III -
Tables
Table 3.1: Value added multipliers of exports 24
Table 3.2: Value added multipliers of domestic exports 24
Table 3.3a: Decomposition of value added multipliers of exports 28
Table 3.3b: Decomposition of value added multipliers of domestic exports 28
Table 3.3c: Decomposition of value added multipliers of manufacturing exports 28
Table 3.3d: Decomposition of value added multipliers of domestic manufacturing exports 28
Table 3.3e: Decomposition of value added multipliers of service exports 28
Table 3.4: Decomposition of value added multipliers of total exports by value added categories 30
Table 3.5: Decomposition of employment multiplier of total exports (full time equivalents, employee) 32
Table 3.6: Shares of export-induced employment by level of education 32
Table 4.1: Sectoral shares in total exports in %, selected countries, 2000 36
Table 4.2: Sectors with the highest export intensity by country, 2000 39
Table 4.3: Decomposition of value added generated by total exports, sectoral shares in %, 2000 40
Table 4.4: Decomposition of value added generated by uniform exports, indirect effects only, sectoral
shares in %, 2000 42
Table 4.5: Decomposition of value added generated by total exports, indirect effects only, sectoral shares
in %, 2000 43
Table 4.6: Decomposition of value added generated by exports from the service sector, sectoral shares
in %, 2000 44
Table 4.7: Decomposition of value added generated by exports from the manufacturing sector, sectoral
shares in %, 2000 45
Table 5.1: Regional total exports and regional foreign tourism, 2003 59
Table 5.2: Regional export structures 61
Table 5.3: Development of regional manufacturing exports, nominal values, 1995=100 62
Table 5.4: The importance of foreign tourism 75
Table A: Composition of the "old" EU-15 and OECD-23 samples used in the international analysis 83
Table B: Industry classification and concordance with ISIC Rev. 3 84
- IV -
Figures
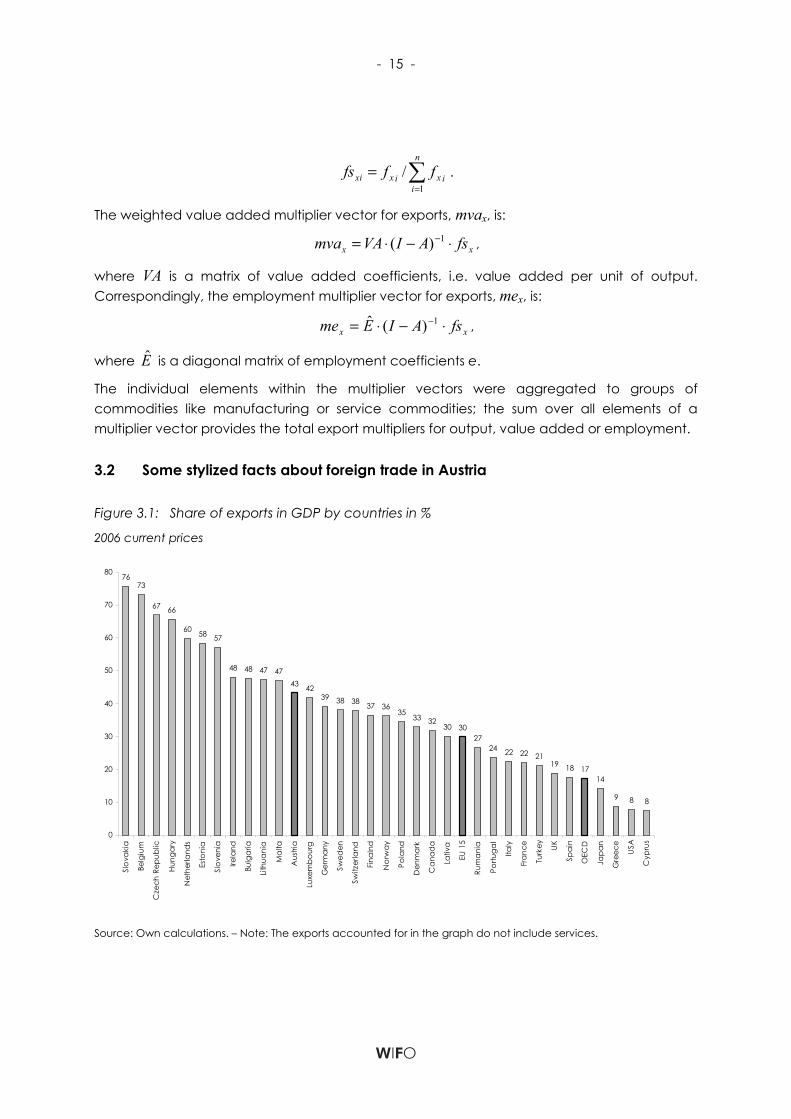
Figure 3.1: Share of exports in GDP by countries in % 15
Figure 3.2: Share of exports in total production in %, 2000, current prices 16
Figure 3.3: Real growth of exports, imports and GDP (1976=100) 17
Figure 3.4: Production depth – share of value added in total production for manufacturing in % 19
Figure 3.5: Production depth – sectoral shares of value added in total production in % 20
Figure 3.6: Share of value added of manufacturing in GDP in % 20
Figure 3.7: Sectoral shares of value added in GDP in % 21
Figure 3.8: Net investment quota in % 22
Figure 3.9: Share of value added, domestic and imported inputs in total manufacturing production in % 22
Figure 3.10: Decomposition of value added multipliers of domestic exports 26
Figure 3.11: Decomposition of value added multipliers of domestic exports – indirect effects 26
Figure 3.12: Decomposition of total value added effects of domestic exports 27
Figure 3.13: Decomposition of indirect value added effects of domestic exports 27
Figure 3.14: Decomposition of value added multipliers of exports and other final demand 30
Figure 3.15: Share of induced value-added in total value-added by final demand categories 32
Figure 3.16: Decomposition of employment multipliers of total exports, 2003 33
Figure 3.17: Share of induced employment in total employment by final demand categories 33
Figure 4.1: Sectoral shares in total exports in percent, Austria and OECD-23, 2000 37
Figure 4.2: Decomposition of value added generated by total exports, sectoral shares in %, 2000 41
Figure 4.3: Decomposition of value added generated by exports from the service sector, sectoral shares
in %, 2000 44
Figure 4.4: Decomposition of value added generated by exports from the manufacturing sector, sectoral
shares in %, 2000 46
Figure 4.5: Decomposition of value added generated by total exports, sectoral shares in %, 2000 47
Figure 4.6: Decomposition of value added generated by exports from the service sector, sectoral shares
in %, 2000 49
Figure 4.7: Decomposition of value added generated by exports from the manufacturing sector, sectoral
shares in %, 2000 50
- V -
Figure 4.8: Decomposition of value added generated by exports from sector 34 (motor vechicles, bodies,
parts, accessories), sectoral shares in %, 2000 52
Figure 4.9: Decomposition of value added generated by exports from sector 34 (motor vechicles, bodies,
parts, accessories), sectoral shares in %, 2000 52
Figure 4.10: Decomposition of value added generated by exports from sector 32 (Radion, television and
communication equipment), sectoral shares in % , 2000 53
Figure 4.11: Decomposition of value added generated by exports from sector 32 (Radion, television and
communication equipment), indirect effects only, sectoral shares in %, 2000 53
Figure 4.12: Decomposition of value added generated by exports from sector 55 (hotels and restaurantes),
sectoral shares in %, 2000 55
Figure 4.13: Decomposition of value added generated by exports from sector 55 (hotels and restaurantes),
indirect effects only, sectoral shares in %, 2000 55
Figure 5.1: The structure of MultiREG 64
Figure 5.2: Balancing of trade 66
Figure 5.3: Regional trade in manufactured goods 67
Figure 5.4: Regional trade in market services 68
Figure 5.5: Regional trade in other goods and non-market services 69
Figure 5.6: Effects of exports on own region and the rest of Austria 71
Figure 5.7: Effects of regional exports on Austrian sectors 72
Figure 5.8: Effects of exports on own region and the rest of Austria 73
Figure 5.9: Effects of regional exports on Austrian sectors 74

Exports, Services and Value Added A National, International and Regional Analysis for Austria
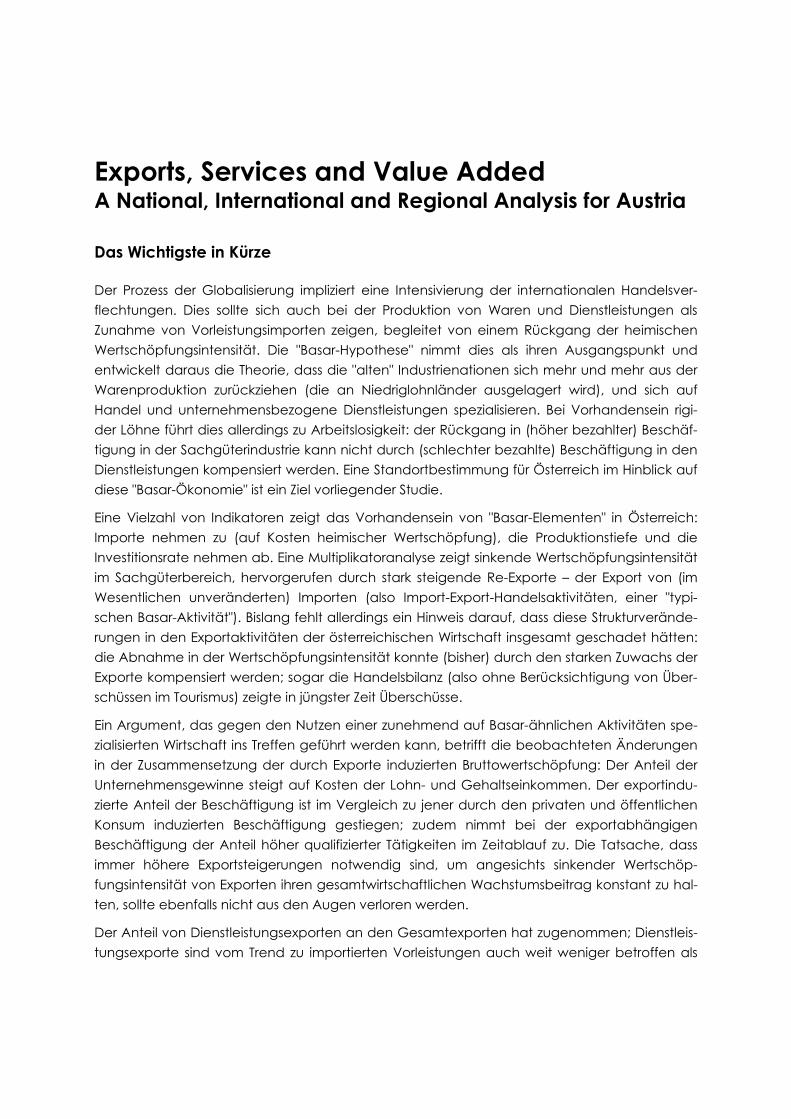
Das Wichtigste in Kürze
Der Prozess der Globalisierung impliziert eine Intensivierung der internationalen Handelsver-flechtungen. Dies sollte sich auch bei der Produktion von Waren und Dienstleistungen als Zunahme von Vorleistungsimporten zeigen, begleitet von einem Rückgang der heimischen Wertschöpfungsintensität. Die "Basar-Hypothese" nimmt dies als ihren Ausgangspunkt und entwickelt daraus die Theorie, dass die "alten" Industrienationen sich mehr und mehr aus der Warenproduktion zurückziehen (die an Niedriglohnländer ausgelagert wird), und sich auf Handel und unternehmensbezogene Dienstleistungen spezialisieren. Bei Vorhandensein rigi-der Löhne führt dies allerdings zu Arbeitslosigkeit: der Rückgang in (höher bezahlter) Beschäf-tigung in der Sachgüterindustrie kann nicht durch (schlechter bezahlte) Beschäftigung in den Dienstleistungen kompensiert werden. Eine Standortbestimmung für Österreich im Hinblick auf diese "Basar-Ökonomie" ist ein Ziel vorliegender Studie.
Eine Vielzahl von Indikatoren zeigt das Vorhandensein von "Basar-Elementen" in Österreich: Importe nehmen zu (auf Kosten heimischer Wertschöpfung), die Produktionstiefe und die Investitionsrate nehmen ab. Eine Multiplikatoranalyse zeigt sinkende Wertschöpfungsintensität im Sachgüterbereich, hervorgerufen durch stark steigende Re-Exporte – der Export von (im Wesentlichen unveränderten) Importen (also Import-Export-Handelsaktivitäten, einer "typi-schen Basar-Aktivität"). Bislang fehlt allerdings ein Hinweis darauf, dass diese Strukturverände-rungen in den Exportaktivitäten der österreichischen Wirtschaft insgesamt geschadet hätten: die Abnahme in der Wertschöpfungsintensität konnte (bisher) durch den starken Zuwachs der Exporte kompensiert werden; sogar die Handelsbilanz (also ohne Berücksichtigung von Über-schüssen im Tourismus) zeigte in jüngster Zeit Überschüsse.
Ein Argument, das gegen den Nutzen einer zunehmend auf Basar-ähnlichen Aktivitäten spe-zialisierten Wirtschaft ins Treffen geführt werden kann, betrifft die beobachteten Änderungen in der Zusammensetzung der durch Exporte induzierten Bruttowertschöpfung: Der Anteil der Unternehmensgewinne steigt auf Kosten der Lohn- und Gehaltseinkommen. Der exportindu-zierte Anteil der Beschäftigung ist im Vergleich zu jener durch den privaten und öffentlichen Konsum induzierten Beschäftigung gestiegen; zudem nimmt bei der exportabhängigen Beschäftigung der Anteil höher qualifizierter Tätigkeiten im Zeitablauf zu. Die Tatsache, dass immer höhere Exportsteigerungen notwendig sind, um angesichts sinkender Wertschöp-fungsintensität von Exporten ihren gesamtwirtschaftlichen Wachstumsbeitrag konstant zu hal-ten, sollte ebenfalls nicht aus den Augen verloren werden.
Der Anteil von Dienstleistungsexporten an den Gesamtexporten hat zugenommen; Dienstleis-tungsexporte sind vom Trend zu importierten Vorleistungen auch weit weniger betroffen als

- 2 -
Warenexporte; ihre Wertschöpfungsintensität ist daher im Gegensatz zu jener von Sachgü-terexporten im Zeitablauf stabil geblieben bzw. hat sich sogar leicht erhöht. Dienstleistungen profitieren über Zulieferungen auch stärker von Warenexporten als dies in der Vergangenheit der Fall war. Im Gegensatz dazu ist der Anteil der Sachgütererzeugung an der gesamten exportinduzierten Wertschöpfung gesunken. Setzt sich der Trend zu einem höheren Anteil an Dienstleistungsexporten fort, könnte dies die Erosion der durch Exporte ausgelösten Wert-schöpfung kompensieren.
Ein direkter Vergleich von Multiplikatoren verschiedener Länder ist nicht möglich bzw. sinnvoll, da die Höhe des Multiplikators stark mit der Größe eines Landes korreliert: Kleinere Volkswirt-schaften sind stärker vom internationalen Handel abhängig, weshalb ihre Multiplikatoren auch kleiner sind. Ein Ländervergleich der sektoralen Anteile an den Multiplikatoren, die von der absoluten Größe des Multiplikators unabhängig sind, ergibt, dass in Österreich die Export-wirkungen auf den Sachgüterbereich überdurchschnittlich hoch ausfallen, während die Wir-kungen auf den Dienstleistungssektor etwas hinter jenen anderer Länder zurückfallen. Ein Grund dafür dürfte bei der in Österreich stärker ausgeprägten vertikalen Integration der Sachgüterindustrie liegen, d. h. Dienstleistungen werden in Österreich in einem relativ hohen Ausmaß firmenintern zur Verfügung gestellt. Trotz ihres niedrigeren Anteils an den Gesamt-exporten profitieren Dienstleistungen allerdings von Exporten über indirekte Effekte mehr als andere Sektoren.
Die Ergebnisse der nationalen und internationalen Analysen, die im Rahmen dieses Projekts durchgeführt wurden, erbrachten einige für die Wirtschaftspolitik interessante Erkenntnisse: In einer zunehmend "Basar"-ähnlichen Wirtschaft dürfte die Sachgüterproduktion an Bedeutung verlieren und zum Teil durch wissens- und daher qualifikationsintensive Dienstleistungen ersetzt werden. Diese Dienstleistungen sind auch immer stärker dem internationalen Wettbewerb ausgesetzt, was auch steigende Exportchancen mit sich bringt. Dienstleistungen sind zudem nicht nur ein wichtiger Wettbewerbsfaktor für die traditionellen Sachgüterexporte, der Erfolg in der Sachgüterindustrie hängt in zunehmendem Maße von der Qualität der im Produktions-prozess benötigten Dienstleistungen ab. Die Wettbewerbsfähigkeit von Dienstleistungsunter-nehmen sollte daher ein wichtiges Anliegen der Wirtschaftspolitik sein.
Exporte spielen regional eine recht heterogene Rolle: im Verhältnis zum Bruttoregionalprodukt (BRP) betrugen sie im Jahr 2003 zwischen 29% in Wien und 62% in Vorarlberg (der österreichi-sche Durchschnitt liegt bei 42%). Wenn Ausgaben durch ausländische Touristen mitgerechnet werden (die auch einen "Export" darstellen), liegt dieses Verhältnis zwischen 31% (Wien) und 77% (Tirol). Diese Touristenausgaben sind extrem ungleich verteilt: 45% der Nächtigungen von Ausländern entfallen auf Tirol (der Anteil Tirols an den Tourismusausgaben ist sogar noch etwas höher), Salzburg und Kärnten folgen mit Anteilen von 19 und 10%. Eine Modell-simulation zeigt, dass mehr als ein Fünftel des Tiroler BRP direkt oder indirekt mit dem Tourismus zusammenhängen (und dabei sind die Inlandstouristen noch nicht mitgerechnet). Auf natio-naler Ebene beträgt dieser Anteil etwa 7%.
- 3 -
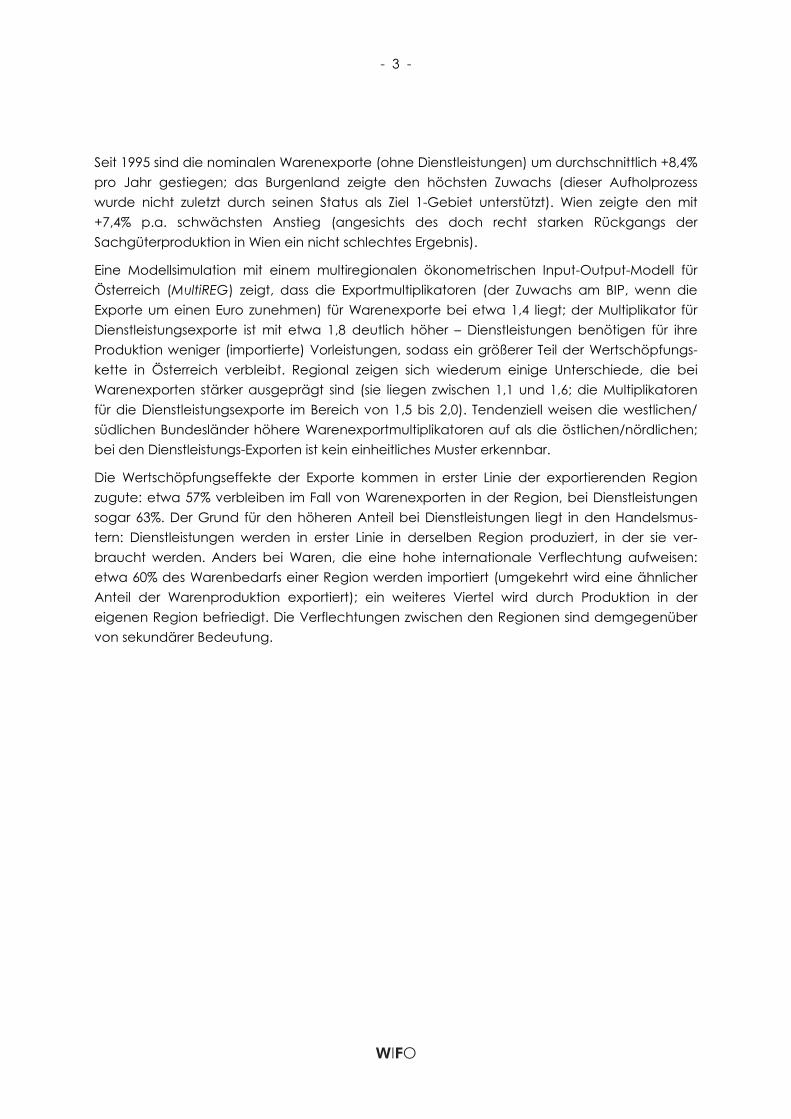
Seit 1995 sind die nominalen Warenexporte (ohne Dienstleistungen) um durchschnittlich +8,4% pro Jahr gestiegen; das Burgenland zeigte den höchsten Zuwachs (dieser Aufholprozess wurde nicht zuletzt durch seinen Status als Ziel 1-Gebiet unterstützt). Wien zeigte den mit +7,4% p.a. schwächsten Anstieg (angesichts des doch recht starken Rückgangs der Sachgüterproduktion in Wien ein nicht schlechtes Ergebnis).
Eine Modellsimulation mit einem multiregionalen ökonometrischen Input-Output-Modell für Österreich (MultiREG) zeigt, dass die Exportmultiplikatoren (der Zuwachs am BIP, wenn die Exporte um einen Euro zunehmen) für Warenexporte bei etwa 1,4 liegt; der Multiplikator für Dienstleistungsexporte ist mit etwa 1,8 deutlich höher – Dienstleistungen benötigen für ihre Produktion weniger (importierte) Vorleistungen, sodass ein größerer Teil der Wertschöpfungs-kette in Österreich verbleibt. Regional zeigen sich wiederum einige Unterschiede, die bei Warenexporten stärker ausgeprägt sind (sie liegen zwischen 1,1 und 1,6; die Multiplikatoren für die Dienstleistungsexporte im Bereich von 1,5 bis 2,0). Tendenziell weisen die westlichen/ südlichen Bundesländer höhere Warenexportmultiplikatoren auf als die östlichen/nördlichen; bei den Dienstleistungs-Exporten ist kein einheitliches Muster erkennbar.
Die Wertschöpfungseffekte der Exporte kommen in erster Linie der exportierenden Region zugute: etwa 57% verbleiben im Fall von Warenexporten in der Region, bei Dienstleistungen sogar 63%. Der Grund für den höheren Anteil bei Dienstleistungen liegt in den Handelsmus-tern: Dienstleistungen werden in erster Linie in derselben Region produziert, in der sie ver-braucht werden. Anders bei Waren, die eine hohe internationale Verflechtung aufweisen: etwa 60% des Warenbedarfs einer Region werden importiert (umgekehrt wird eine ähnlicher Anteil der Warenproduktion exportiert); ein weiteres Viertel wird durch Produktion in der eigenen Region befriedigt. Die Verflechtungen zwischen den Regionen sind demgegenüber von sekundärer Bedeutung.


- 5 -
1. Introduction
It is the purpose of this paper to shed light on the role of foreign exports in the Austrian economy. Specifically, the following issues are to be addressed:
• How important are exports for the growth performance of the Austrian economy? Globalization entails more intensive trade relationships; this brings new opportunities for exporters, but may also imply that an increasing share of inputs in the production of exports is imported; the contribution of export growth to the growth of domestic value added and employment is therefore uncertain and may well decrease over time.
• While manufacturing commodities still dominate export activities in most countries, service exports have become increasingly important. Considering the growth contribution of exports, it is therefore interesting to examine if exports of services are different from exports of other products, especially manufacturing commodities.
• Services are responsible for an increasing share of value added in most developed economies; they have also become an important input to manufacturing production. Since exports are at issue, we analyze to which extent exports spur the growth in the supply of services.
• The analysis of the Austrian export performance should also be put into an international context. The issue is how the value added effects of exports in Austria compare with exports in other countries.
• Finally, the regional dimension of export activities in Austria is also considered; it is to be analyzed, to what extent the impacts of exports are different across Austrian regions.
A discussion that has become known as the “bazaar”-hypothesis in the economic literature is closely linked to these issues. This hypothesis claims that highly developed countries produce less and less real assets and increasingly concentrate on international trading activities and export-related services. Export commodities sold under the label of the home country consist in large parts of inputs imported from foreign countries.
The question to what extent exports still contribute to Austria’s growth in GDP and employment is also addressed in the light of this hypothesis. Specifically, based on earlier work, we discuss the theoretical arguments underlying this hypothesis and the development of export-induced value added that can be expected in an economy becoming increasingly “bazaar”-like. We then look at empirical evidence to see if these expectations are met in the Austrian case and thus Austria is in fact on the way towards a “bazaar”-type economy.
- 6 -
The methods applied in this paper are twofold:
For the first part of the empirical analysis, in which Austrian national exports are in the centre of interest, the national input-output tables for the years 1995, 2000 and 2003 released by Statistics Austria are used. We carry out a multiplier analysis based on the open input-output model: The level of value added and employment that is associated with exports is calculated per Euro of exports and compared with production induced by other final demand categories (i.e. private and public consumption, investment). The change in multipliers over time, i.e. between 1995, 2000 and 2003, is of particular interest. In order to understand the sectoral dimension of export growth we further distinguish between different groups of commodities, mainly manufacturing commodities and services, both for exports and for the induced production / value added / employment.
For the international comparison of export impacts, we conduct a cross-country analysis using input-output tables provided by the OECD for the year 2000. Since economies of very different size are part of the OECD, a direct comparison of multipliers, whose values are positively correlated with country size, is not useful. Instead we concentrate on the sectoral shares of these multipliers, i.e. attempt to show which sectors / commodities benefit more (directly and indirectly) from export activities.
For the regional analysis we apply a Multiregional econometric input-output model for Austria, MultiREG. This model includes all nine Austrian states (“Bundesländer”) and covers their foreign as well as their inter-regional trade activities, so that economic spillovers between states, resulting from the production of foreign export commodities, can be estimated. While the analysis at the national and international level relies on the open input-output model and is thus restricted to measuring direct and indirect effects of exports, the regional analysis with MultiREG also includes induced effects, i.e. the link between income and demand from private and public consumption and the business sector (investment, inputs).
The course of the paper is as follows: After this short introduction the “bazaar”-hypothesis is discussed in some detail. Thereafter stylized facts about Austrian foreign exports as well as “bazaar”-type characteristics of the Austrian economy are presented, before the Austrian input-output tables are applied to carry out a multiplier analysis. The results of the international comparison and the regional simulations of export-induced value added are depicted in the following sections; finally some first conclusions are drawn.
- 7 -
2. International trade and domestic growth revisited – the “bazaar”- hypothesis
2.1 Introduction
In his speech on the German economy in autumn 2003, Hans-Werner Sinn, president of the Ifo-Institute for Economic Research at the University of Munich, for the first time used the term “bazaar”-economy to describe the German economic development after the fall of the iron curtain. Since then a controversial debate on Germany’s performance in a globalized world has been going on. After that speech he published a book in which he presented his opinion and what he meant in detail by the term “bazaar”-economy. Sinn starts with Germany’s curious economic situation of being vice world champion when it comes to exports, while being bottom of the league with respect to growth in GDP. He called this situation the “German riddle“.
In general the term “bazaar”-economy describes a country in which nothing is produced and which concentrates heavily on trading activities. The country is nothing else than a centre for trade between other countries. A high share of inputs is imported, used for assembling a new product that is sold to consumers both at home and abroad. Besides that, large amounts of final products are imported, which are re-sold without any further processing or further use in the domestic production process.
Before selling the commodities the traders put on the label “Made in the home country” so that the consumers inside and outside the home country become victim of false labeling. They believe they have bought a product of the home country but really get products that contain only a very small part of domestic inputs, value-added and labor. Consequently, the production of domestic final goods has a low impact on value-added because of the strong rise of imported inputs used in the production processes.
Sinn uses as a prominent example the Porsche Cayenne, which is a well-known German export product. Most components of that car come from a Volkswagen plant in Bratislava and only the final construction takes place in Stuttgart. After that it is bought by German consumers or exported under the label “Made in Germany”. But according to Sinn the Porsche Cayenne is really a Volkswagen which is produced in Bratislava.
The growth of intermediate imported inputs and the decrease of domestic value-added and labor is a consequence of heavy outsourcing and off-shoring activities by domestic entrepreneurs. These activities, according to Sinn, are a result of wages that are too high and too rigid in the “bazaar”-economy. The domestic entrepreneurs remain competitive because they are able to get rid of the now non-competitive domestic labor. By fragmenting the value-added chain in favor of foreign countries the profits and losses of the participation in a

- 8 -
globalized world are not distributed equitably between labor and capital. Whereas the entrepreneurs win by sharing labor internationally domestic labor is used less and less per unit of domestically produced goods.
After opening up, the capital-rich country concentrates more and more on the production of capital intensive goods and less of labor intensive goods, a process leading to horizontal concentration. In the capital intensive sectors the labor intensive parts are offshored, resulting in vertical concentration. These two processes lead to unemployment if the production of capital intensive goods only rises proportionally to the decrease of labor intensive goods because in the rest of the economy not enough new jobs are created.
A “bazaar”-economy is characterized by a high import share. In the home country, only the final assembly takes place. This development and the low level of further industrial processing result in a low value added per unit of output. However, if demand for industrial products grows sufficiently total value added and employment for the whole economy can be high. Even the share of value added of the manufacturing industry in the GDP can reach a high and stable level. The development to a “bazaar”-economy does not mean that the proportion of value added of the manufacturing industry or of the bazaars as a whole declines. By outsourcing and off-shoring of the labor-intensive parts in the chain of value-added of the production process the entrepreneurs exhibit a rational reaction to changes in the economic environment.
For an economy to qualify as “bazaar”-economy it is decisive if the increase in export volumes is much higher than the decrease of value-added effects per item. The increase over time of the share of value-added induced by export production in total value-added is due to a concentration on export production. It is more important to look at the total net effects of increases in value-added and employment because of a rise in export demand and decreases in value-added and employment after the rise in the use of imported inputs, in outsourcing and in off-shoring.
2.2 Theoretical background
The theoretical background of the “bazaar”-hypothesis presented here is taken from Sinn (2005). The “bazaar”-hypothesis is based on a 2-country-Heckscher-Ohlin-model with identical technological knowledge but different endowment on the production factors labor and capital. Before opening up the economy the wage in the capital-rich country is higher and the price for capital is lower; the reverse is the case in the capital-poor country. Under the condition of price flexibility for the production factors, capital and labor, the opening of the capital-rich economy leads to a higher relative price and rising production of the capital-intensive good, accompanied by a decrease in the production of the labor-intensive good. The labor-rich country specializes in the production of the labor-intensive good, resulting in higher wages in that country. In the capital-rich country the prices for labor and capital decrease relative to the real wage in terms of both types of goods. As a consequence both
- 9 -
sectors in the capital-rich country do not produce in an overly capital-intensive way. In the capital-poor country the opposite takes place. In the new trade equilibrium relative prices of both goods are identical in both countries; even the real factor prices are identical. Both countries are better off by trading with each other because a part of its demand can be satisfied more cheaply by imports instead of domestic production.
But this development is not found if in the capital-rich country the wages and, implicitly, the price for capital is fixed. By that fixation the forces leading to factor price equalization are disturbed. The relative price of the capital-intensive good is lower than under the condition of flexibility of factor prices and the capital-poor country specializes more in the production of the labor-intensive good. The volume of and the profits from trade are higher in the capital-poor country. To be able to satisfy the demand for trade the capital rich country has to concentrate more on the production of the capital-intensive good and less on the production of the labor-intensive good. The boom in exports due to fixed wages in the capital-rich country is accompanied by an adaptation of unemployment: According to the Rybczynski-theorem an adequate contraction of the labor-intensive, importing sectors and an adequate growth of the capital-intensive, exporting sectors can be achieved by a decrease in employment. In the end the rigidity of wages leads to unemployment and a boom in exports in the capital-rich country as well as higher profits for the capital-poor country. Welfare in the capital-rich country is lower than in a situation without trade, because the relation in the prices of goods does not change whereas the transformation curve moves in because of unemployment. By defending high wages against the forces of factor price equalization the capital-rich country experiences losses in welfare because of its participation in trade with the other country.
It should be emphasized here that the outcome of an inward shift of the transformation curve even compared to the base case without trade is an extreme (‘pathological’) case. This outcome depends on (i) the shape of the transformation curve as well as (ii) full downward inflexibility of wages. The second argument can at least be questioned for industrial countries, if we regard the medium term perspective of the last two decades, which might be comparable with the comparative-static view of the H-O model. Breuss (2007 ??) has shown that the wage share in GDP has declined during the last decade in most industrialized countries and derived that from a H-O model of trade. For not extreme, ‘intermediate’ cases of the model therefore the crucial question is, if the additional movement towards a more capital- and export-intensive economy is accompanied by the generation of domestic value added and employment. This is essentially an empirical question, which is analyzed here.
If the above development is split up into the different vertically chained stages of production this picture gets even more intensive. Under the assumption that the upstream activities distant from the customers are more labor-intensive and the customer-oriented downstream activities are more capital-intensive the capital-rich country specializes in these final stages of production. Besides the horizontal concentration on the capital-intensive sectors the capital-
- 10 -
rich country specializes vertically on the capital-intensive final stages of production where more capital is used and more value-added is created. To produce goods domestically more and more imported inputs are channeled through that country. Because of that piggy-back process the volume of exports rises stronger than the export-induced value-added. The fixation of wages leads to a pathological increase of the value-added and an even pathological stronger increase in the volume of exports.
2.3 Some critical points
As already stated above there has been and there is still some controversial debate about this thesis. Especially the views of German and Austrian economists should be stressed.
For Hickel (2004) Sinn neglects the importance of productive networks. Because of an intensified international share of labor the inter-industrial linkages and with that the production of domestic inputs to produce the rising volume in export goods the German economy takes part in globalization not only by trade but also by the production of real assets. For him the positive surplus in balance of trade is a proof that in Germany there is more value-added created then imported. Moreover according to Hickel (2004) Sinn doesn’t look at the broad range of products. It’s more important for him to strengthen the domestic value-added by modern production structures, efficient conditions of compensation and labor and an infrastructure of high quality. (Hickel, 2004)
The horizontal and vertical concentration on the capital-intensive sectors by a capital-rich country like Germany after opening the economy leads to that decrease in the value-added per item and that described increase in the use of imported inputs. But this doesn’t say anything about the effects on total value-added and employment. (Brenken, Schwarz, 2004)
Destatis (2004) says that the share of value-added induced by exports in total GDP has grown and that more than the half of employed persons work directly and indirectly for the production of exports. For the whole economy the positive employment effects through the export boom exceed the negative. For Sauernheimer (2006) the “bazaar”-hypothesis describes nothing else than an increasing openness of economies. According to Piper (2006) the development to a “bazaar”-economy can also be an evidence for a successful integration of a country in the international share of labor. For Bofinger (2006) the fact that the domestic part of export goods is by far higher than 50% shows that Sinn’s hypothesis can’t be true for Germany. Moreover especially the sectors with high and rising import shares had an increasing importance for the development of employment.
For Helmenstein (2006) it is important to emphasize that by outsourcing and off-shoring certain core competences were not only saved but also enlarged continuously. Another proof of not being on the way to a “bazaar”-economy is the increase in trade surplus for Austria and Germany. Breuss (2006) highlights the low share of the service sector’s value-added in GDP and its employment in Austria and in Germany. In a “bazaar”-economy which is
- 11 -
characterized by a high level of “bazaar”-activities the service sector would be much more important. For the Austrian Institute of Economic Research WIFO (2006) the rising outsourcing activities increase productivity and lead to higher sales in the home country as well as in foreign countries. According to Marterbauer (2007) the rising surpluses in Germany’s foreign trade are a result of a slow growth of imports because of the weak domestic demand. For him Sinn neglects the high quality of the domestic products.
In the following chapter it will be examined if there are any indications that Austria may be transforming into a “bazaar”-type economy based on the reasoning given in Sinn (2005). In particular the development of value-added and employment linked to exports will be in the centre of interest.

- 13 -
3. An empirical analysis of exports at the national level
3.1 Data base and methods applied
The empirical analysis of Austria’s export performance in a macroeconomic perspective is based both on data from national accounts and national input-output tables.
For measuring the contribution of a specific sector or final demand to total production or valued added in an economy, input-output analysis is an appropriate tool. The compilation of input-output tables, however, is a very data-intensive and thus time-consuming endeavor. Therefore, in most countries such tables have not been released on an annual basis. For Austria tables were usually compiled for those years for which full industry surveys were available: 1976, 1983, 1990 and 1995. The analysis of structural changes over time by the use of input-output tables was therefore hampered by the lack of a consistent time series of such tables. The situation improved considerably when Eurostat required statistical offices of the countries of the European Union to compile Supply/Use tables on an annual basis. For Austria such annual tables are now available starting in 1999, the latest table was released for 2003.
For the analysis of the economic impact of Austrian foreign exports the Supply/Use tables for 1995, 2000 and 2003 as published by Statistics Austria were used. All tables are in nominal terms; changes in relative prices may therefore influence the results and have to be taken into account when drawing any conclusions.
Statistics Austria constructs a complete make-use-system of tables. This system comprises the production of commodities by activities (sectors) on the make side and the use of domestically produced or imported commodities either as intermediate inputs by activities or by final demand categories. In addition, value added by activities is included as well. For 1995 and 2000 these tables were then transformed into commodity-by-commodity tables, based on the commodity-technology assumption.1 The application of this technology assumption usually results in a certain number of negative input-output coefficients which require additional interventions by the compilers. Due to lack of information about these interventions it is not possible for mere users to derive consistent tables for the other years using the commodity-technology assumption. Therefore, in order to avoid the problem of
1) For the transformation of make and use tables into an activity-by-activity table or a commodity-by-commodity table either an industry-technology, a commodity-technology or a combination of these two technology assumptions have to be applied.
- 14 -
negative coefficients and to obtain a consistent set of tables for 1995, 2000 and 2003 the industry-technology assumption was applied to generate commodity-by-commodity tables. These tables comprise of 57 commodities (55 for the 1995 table), 12 final demand categories and 6 value added categories (7 for 1995).
Another problem that frequently occurs when input-output tables for different points in time are used in a comparative analysis concerns changes in compilation methods and conceptual principles. The analyst must always be careful not to argue for structural changes when differences in simulation results are actually due to conceptual changes or changes in compilation methods.
In the case of the Austrian tables the most prominent conceptual change is related to the imputed use of banking services (FISIM)2). In 1995 and 2000 only total use of such services was estimated. In 2003 total use was allocated among commodities (intermediate use) and final demand categories (final use of imputed banking services). Therefore, in order to have a more or less consistent set of tables, it was assumed that imputed banking services in 1995 and 2000 were completely used up by the banking sector itself, i.e. intermediate use of banking services by the banking sector was increased by the amount of imputed banking services. In order to balance the tables, the banking sector’s value added had to be reduced correspondingly. As a result of this assumption, the multipliers are somewhat biased: The value added contribution of the banking sector is underestimated, while value added is overestimated for all the other sectors (whose use of banking services is too low).
Based on these tables for 1995, 2000 and 2003 a multiplier analysis was carried out. This analysis was based on the traditional open input-output model based on commodity-by-commodity tables:
fAIq ⋅−= −1)(
Here q is a vector of total output by commodities, I is an identity matrix, A the matrix of domestic technology coefficients and f the vector of domestic final demand by commodities. The weighted output multiplier vector for exports, mqx, can be written as:
xx fsAImq ⋅−= −1)( ,
where fsx is the vector of export shares of commodities i whose elements are defined as:
2) Financial Intermediation Services Indirectly Measured
- 15 -
∑=
=n
iixixxi fffs
1/ .
The weighted value added multiplier vector for exports, mvax, is:
xx fsAIVAmva ⋅−⋅= −1)( ,
where VA is a matrix of value added coefficients, i.e. value added per unit of output. Correspondingly, the employment multiplier vector for exports, mex, is:
xx fsAIEme ⋅−⋅= −1)(ˆ ,
where E is a diagonal matrix of employment coefficients e.
The individual elements within the multiplier vectors were aggregated to groups of commodities like manufacturing or service commodities; the sum over all elements of a multiplier vector provides the total export multipliers for output, value added or employment.
3.2 Some stylized facts about foreign trade in Austria
Figure 3.1: Share of exports in GDP by countries in %
2006 current prices
7673
67 66
60 58 57
48 48 47 4743 42
39 38 38 37 3635
33 3230 30
2724 22 22 21
19 18 1714
9 8 8
0
10
20
30
40
50
60
70
80
Slo
vaki
a
Belg
ium
Cze
ch R
epub
lic
Hun
ga
ry
Net
herla
nds
Esto
nia
Slo
veni
a
Irela
nd
Bulg
aria
Lith
uani
a
Ma
lta
Aus
tria
Luxe
mb
our
g
Ger
ma
ny
Swed
en
Switz
erla
nd
Fina
lnd
No
rwa
y
Pola
nd
Den
ma
rk
Ca
nad
a
Lativ
a
EU 1
5
Rum
ani
a
Portu
ga
l
Italy
Fra
nce
Turk
ey UK
Spa
in
OEC
D
Jap
an
Gre
ece
USA
Cyp
rus
Source: Own calculations. – Note: The exports accounted for in the graph do not include services.

- 16 -
For Austria as a small and open economy exports are of significant economic importance. The share of exports in GDP is 43% and thus much higher than the average for the EU 27 which stands at 31% (see figure 3.1). When exports are related to the total amount of goods and services that are produced in an economy, the corresponding share (which is only available for the year 2000) is 26% for Austria compared to 21% for an average of 26 OECD countries and 24% for the EU 15 (see figure 3.1).
Figure 3.2: Share of exports in total production in %, 2000, current prices
45
40
3634
29 28 27 26 2625 24 24 23 22 21
1917 16 16 16 16 15 15 14 14
1310
7 6 6
0
5
10
15
20
25
30
35
40
45
50
Irela
nd
Belg
ium
Net
herla
nds
Hun
ga
ry
Slo
vaki
a
Den
ma
rk
No
rwa
y
Aus
tria
Cze
ch
Swed
en
Switz
erla
nd
EU 1
5
Ca
nad
a
Finl
and
OEC
D 2
8
Ger
ma
ny
Spa
in
Isra
el
Turk
ey
Portu
ga
l
Fra
nce
Italy
Pola
nd
New
Zea
land U
K
Gre
ece
Aus
tralia
Arg
entin
ia
Jap
an
USA
Source: Own calculations, OECD database.
Looking at the changes in exports and imports over time (in real terms, see figure 3.3) one can observe a steady growth in foreign trade which accelerated in the mid of the 1990s, possibly as a result of Austria’s accession to the European Union and its larger market area and the economic integration of Central and East European countries. Both exports and imports increased faster than GDP, the growth in exports exceeded import growth, which led to an improvement in the foreign account. While Austria experienced trade deficits in most years before its integration into the European Union, after 1998 the foreign account shows a steadily growing surplus.
Consequently, exports and imports make up an increasing share in GDP: While in 1976 exports (including service exports and expenditures by non-residents) accounted for about 24% of real GDP, this share increased to almost 58% in 2006. The share of real imports (including expenditures of residents made abroad) evolved in a similar manner: It increased from 27% to 52%. The contributions of private and public consumption as well as investments to GDP, on

- 17 -
the other hand, fell during the same time period. Recent data by the OECD (De Backer, Yamano, 2007) suggest a similar trend for the OECD, where export shares (expressed as total exports of goods and services divided by total supply of goods and services) have risen between 1995 and 2000 in nearly all OECD countries.
Figure 3.3: Real growth of exports, imports and GDP (1976=100)
Source: Own calculations.
Between 1995 and 2003, based on the corresponding input-output tables, nominal exports grew by 8.5% annually. Growth was considerably higher in the second half of the 1990’s (10.6%) than in the first years after the turn of the century (5.2%), when Austria like many other European countries went through a recessionary period. Imports increased somewhat less than exports at an annual rate of 6.9% (1995 – 2003).
When looking at the sectoral structure of Austrian exports it is obvious and not surprising that manufacturing commodities dominate. In 2003 77% of exports originated in the manufacturing sector, 20% were services. However, a shift from manufacturing commodities towards services is evident: In 1995, manufacturing was responsible for 80% of exports, services for 17%.
Three sectors, machinery, motor vehicles and chemical production, together make up almost 30% of total exports and nearly 40% of manufacturing exports (both in nominal terms for the
GDP
exports
imports
0
50
100
150
200
250
300
350
400
450
1976
1978
1980
1982
1984
1986
1988
1990
1992
1994
1996
1998
2000
2002
2004
2006
- 18 -
year 2003). In the case of service exports, the sectoral concentration is higher: Wholesale trade, land transport, financial intermediation and other business activities together account for about 75% of total service exports. Financial intermediation exports have increased their share from 6% in 1995 to 14% in 2003.
According to the input-output data, the overall import share for intermediates has increased from 25.3% in 1995 to 29.5% in 2000, but went down again to 27.9% in 2003. Statistics Austria suggested that this pattern might be also linked to changes in the calculation of re-exports, which was carried out at a much higher level of disaggregation after the year 2000. For this reason imports might have been shifted from intermediate inputs and final demand categories to exports. On the other hand, re-exports have also increased in the course of the intensified economic integration with the New Member states in Eastern Europe. Since Austria is home of numerous headquarters and wholesale traders specialized in Eastern Europe, trading activities have flourished. Commodities are imported by these entities and then exported again without any production or assembly in between; only whole sales margins contribute to domestic value added.
In fact, the import share of exports has risen from mere 3.2% in 1995 to 6.1% in 2000 and 11.5% in 2003, while that on final demand (without exports) has – similar to intermediate imports – first increased and then fallen after 2000. Almost half of the absolute growth in exports between 2000 and 2003 was due to re-exports. While total exports grew by 5.2% in that period annually, total domestic exports grew only by 3.1%, re-exports by 30.1%. Re-exports (with a few and very minor exceptions) only exist for manufacturing products and are concentrated on a few sectors; ten manufacturing sectors make up more than 90% of all re-exports; chemicals, transport equipment and radio / television equipment are among the sectors with the highest share of re-exports.
3.3 First empirical evidence on the validity of “bazaar”-hypothesis for Austria
This part uses Austrian data of national accounts to create “bazaar”-indicators used by Sinn (2005) in his analysis of the German economy.
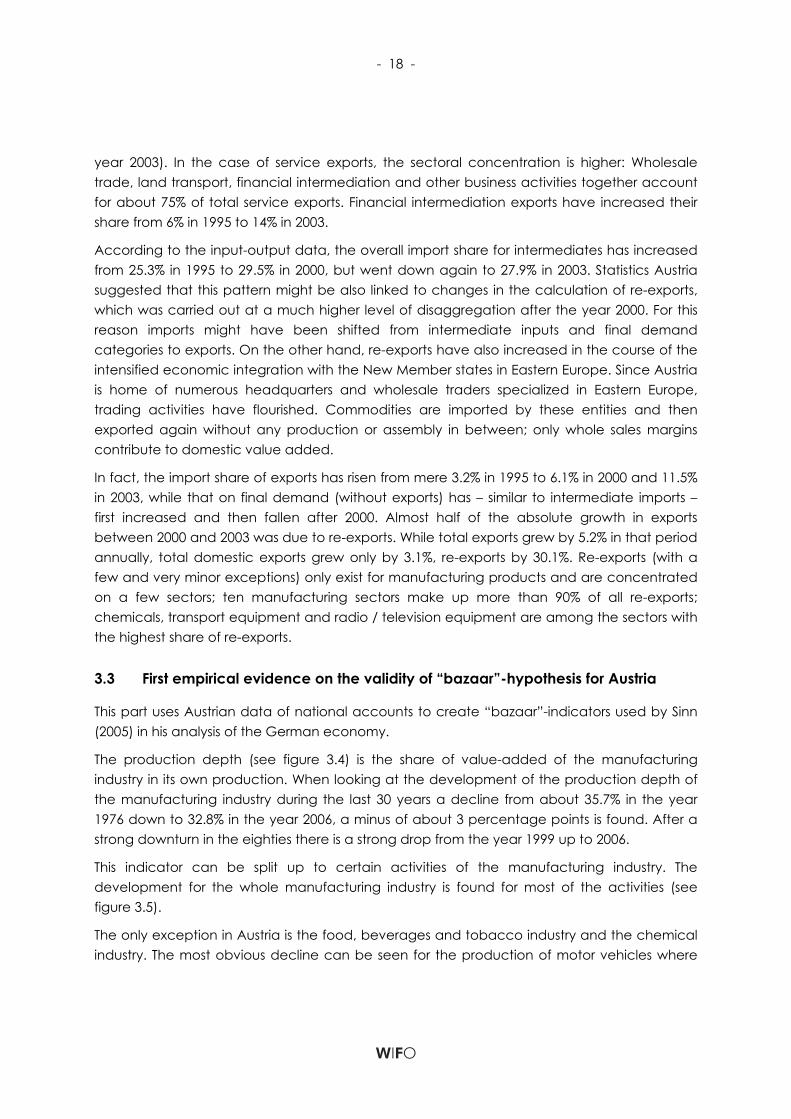
The production depth (see figure 3.4) is the share of value-added of the manufacturing industry in its own production. When looking at the development of the production depth of the manufacturing industry during the last 30 years a decline from about 35.7% in the year 1976 down to 32.8% in the year 2006, a minus of about 3 percentage points is found. After a strong downturn in the eighties there is a strong drop from the year 1999 up to 2006.
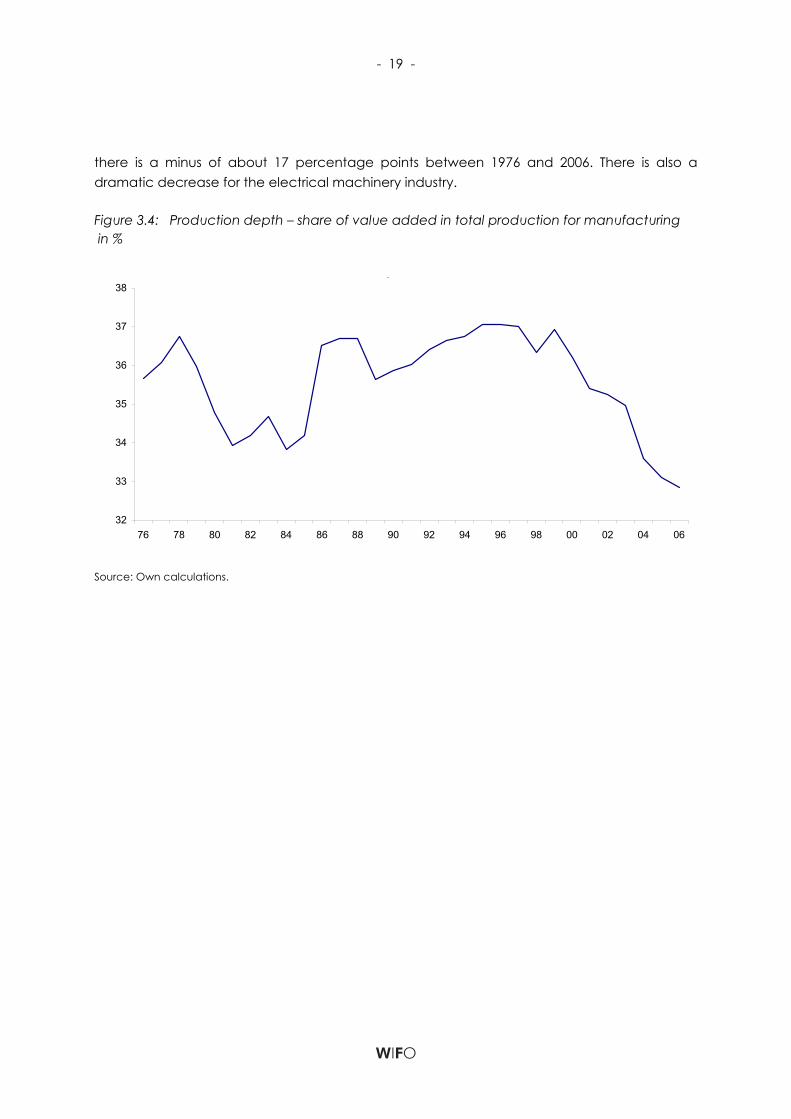
This indicator can be split up to certain activities of the manufacturing industry. The development for the whole manufacturing industry is found for most of the activities (see figure 3.5).
The only exception in Austria is the food, beverages and tobacco industry and the chemical industry. The most obvious decline can be seen for the production of motor vehicles where
- 19 -
there is a minus of about 17 percentage points between 1976 and 2006. There is also a dramatic decrease for the electrical machinery industry.
Figure 3.4: Production depth – share of value added in total production for manufacturing in %
Austria
32
33
34
35
36
37
38
76 78 80 82 84 86 88 90 92 94 96 98 00 02 04 06
Source: Own calculations.
- 20 -
Figure 3.5: Production depth – sectoral shares of value added in total production in %
20
24
28
32
36
40
44
48
52
76 78 80 82 84 86 88 90 92 94 96 98 00 02 04 06
Electrical machinery
Machinery
Basic metals, metal
Chemicals
Motor vehicles
Food, beverages, tobacco
Source: Own calculations.
Figure 3.6: Share of value added of manufacturing in GDP in %
Austria
16
17
18
19
20
21
22
23
76 78 80 82 84 86 88 90 92 94 96 98 00 02 04 06
Source: Own calculations.
- 21 -
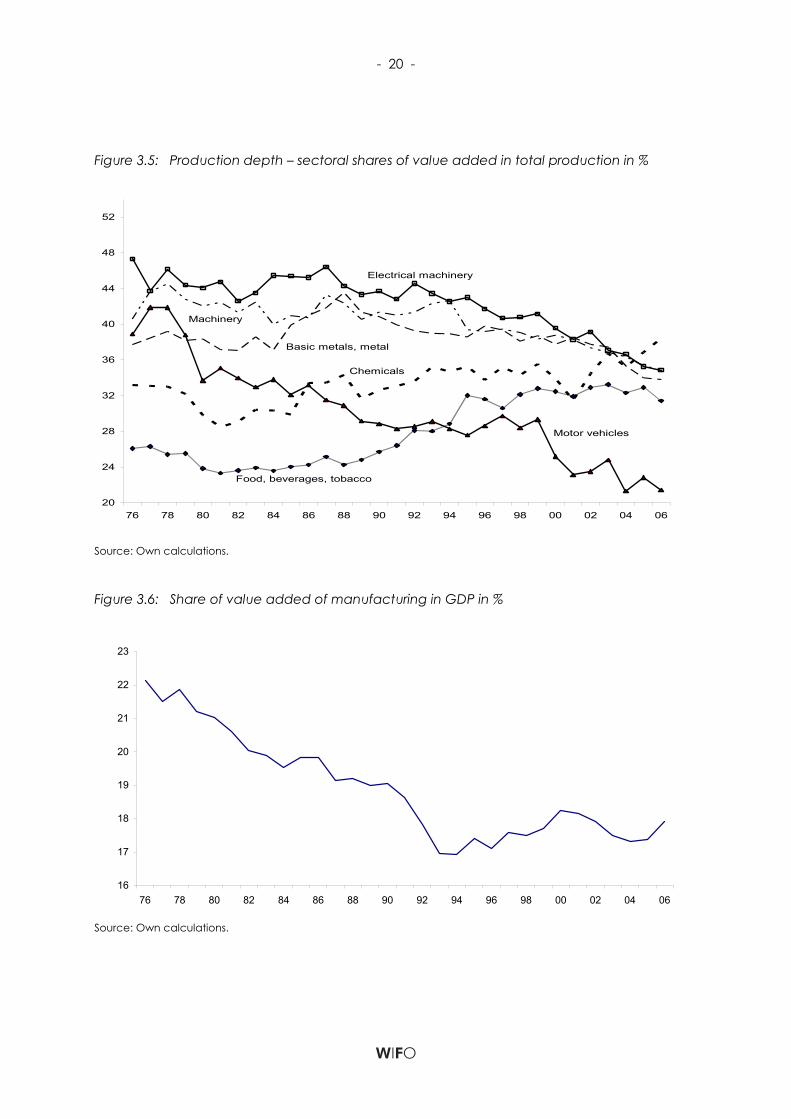
Figure 3.7: Sectoral shares of value added in GDP in %
0.5
1.0
1.5
2.0
2.5
3.0
3.5
4.0
4.5
5.0
5.5
76 78 80 82 84 86 88 90 92 94 96 98 00 02 04 06
Basic metals, metal products
Electrical machineryFood, beverages, tobacco
Machinery
Chemicals
Motor vehicles
Source: Own calculations.
Another important indicator for the development to a “bazaar”-economy is the share of value-added of the manufacturing industry in GDP (see figure 3.6). This indicator provides an impression of the importance of the manufacturing industry for the development of the whole GDP.
Whereas there is a drop from 22.1% in 1976 to 17.9% in 2006 especially from the period after the fall of the iron curtain during the beginning nineties this indicator stabilizes. This could be a sign of a right reaction by the entrepreneurs to changes in the economic environment.
This indicator can also be split up into certain industries (see figure 3.7). For the most industries the above mentioned development is confirmed. An interesting detail is found for the motor vehicles and the machinery industry which could enlarge their shares. Other industries like the chemical and the electrical machinery were able to reach nearly the same share as in 1976.
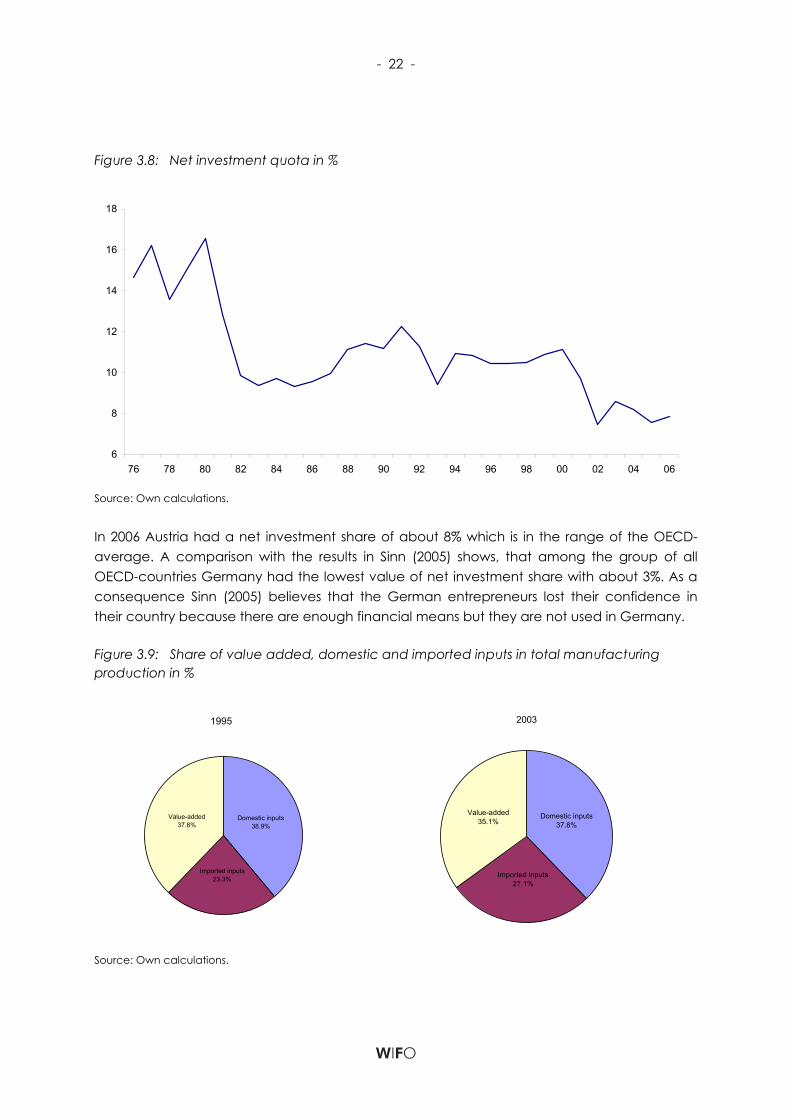
Moreover a look at a rising or falling net investment quota, which is gross investments minus depreciation in relation to the GDP minus depreciation (see figure 3.8), gives an impression about the confidence of entrepreneurs in a certain economy.
- 22 -
Figure 3.8: Net investment quota in %
Austria
6
8
10
12
14
16
18
76 78 80 82 84 86 88 90 92 94 96 98 00 02 04 06
Source: Own calculations.
In 2006 Austria had a net investment share of about 8% which is in the range of the OECD-average. A comparison with the results in Sinn (2005) shows, that among the group of all OECD-countries Germany had the lowest value of net investment share with about 3%. As a consequence Sinn (2005) believes that the German entrepreneurs lost their confidence in their country because there are enough financial means but they are not used in Germany.
Figure 3.9: Share of value added, domestic and imported inputs in total manufacturing production in %
1995
Domestic inputs38.9%
Imported inputs23.3%
Value-added37.8%
2003
Domestic inputs37.8%
Imported inputs27.1%
Value-added35.1%
Source: Own calculations.
- 23 -
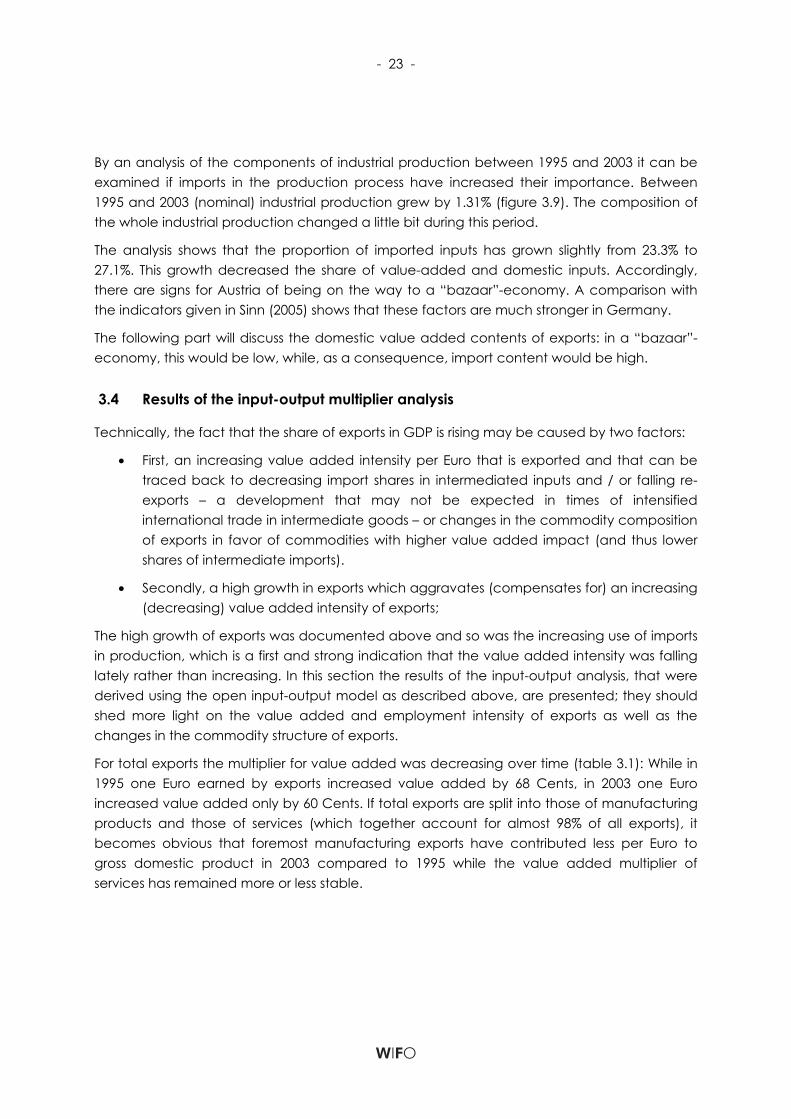
By an analysis of the components of industrial production between 1995 and 2003 it can be examined if imports in the production process have increased their importance. Between 1995 and 2003 (nominal) industrial production grew by 1.31% (figure 3.9). The composition of the whole industrial production changed a little bit during this period.
The analysis shows that the proportion of imported inputs has grown slightly from 23.3% to 27.1%. This growth decreased the share of value-added and domestic inputs. Accordingly, there are signs for Austria of being on the way to a “bazaar”-economy. A comparison with the indicators given in Sinn (2005) shows that these factors are much stronger in Germany.
The following part will discuss the domestic value added contents of exports: in a “bazaar”-economy, this would be low, while, as a consequence, import content would be high.
3.4 Results of the input-output multiplier analysis
Technically, the fact that the share of exports in GDP is rising may be caused by two factors:
• First, an increasing value added intensity per Euro that is exported and that can be traced back to decreasing import shares in intermediated inputs and / or falling re-exports – a development that may not be expected in times of intensified international trade in intermediate goods – or changes in the commodity composition of exports in favor of commodities with higher value added impact (and thus lower shares of intermediate imports).
• Secondly, a high growth in exports which aggravates (compensates for) an increasing (decreasing) value added intensity of exports;
The high growth of exports was documented above and so was the increasing use of imports in production, which is a first and strong indication that the value added intensity was falling lately rather than increasing. In this section the results of the input-output analysis, that were derived using the open input-output model as described above, are presented; they should shed more light on the value added and employment intensity of exports as well as the changes in the commodity structure of exports.
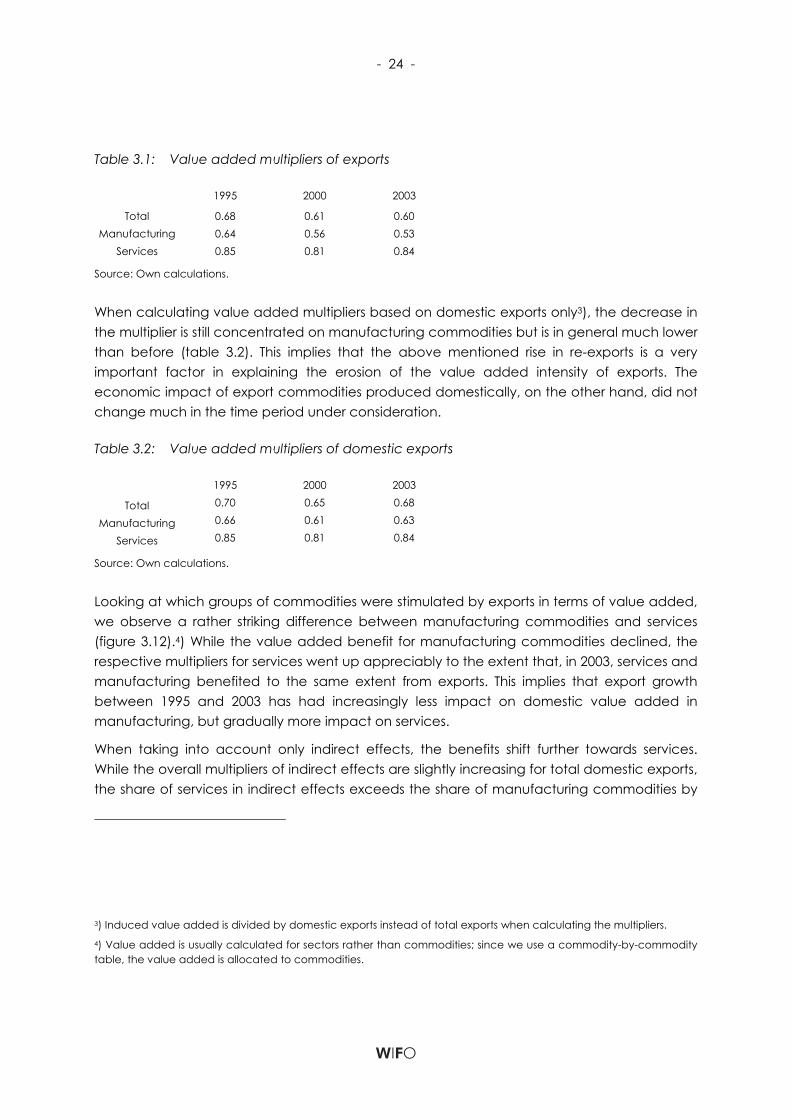
For total exports the multiplier for value added was decreasing over time (table 3.1): While in 1995 one Euro earned by exports increased value added by 68 Cents, in 2003 one Euro increased value added only by 60 Cents. If total exports are split into those of manufacturing products and those of services (which together account for almost 98% of all exports), it becomes obvious that foremost manufacturing exports have contributed less per Euro to gross domestic product in 2003 compared to 1995 while the value added multiplier of services has remained more or less stable.
- 24 -
Table 3.1: Value added multipliers of exports
1995 2000 2003
Total 0.68 0.61 0.60 Manufacturing 0.64 0.56 0.53
Services 0.85 0.81 0.84
Source: Own calculations.
When calculating value added multipliers based on domestic exports only3), the decrease in the multiplier is still concentrated on manufacturing commodities but is in general much lower than before (table 3.2). This implies that the above mentioned rise in re-exports is a very important factor in explaining the erosion of the value added intensity of exports. The economic impact of export commodities produced domestically, on the other hand, did not change much in the time period under consideration.
Table 3.2: Value added multipliers of domestic exports
1995 2000 2003
Total 0.70 0.65 0.68
Manufacturing 0.66 0.61 0.63
Services 0.85 0.81 0.84
Source: Own calculations.
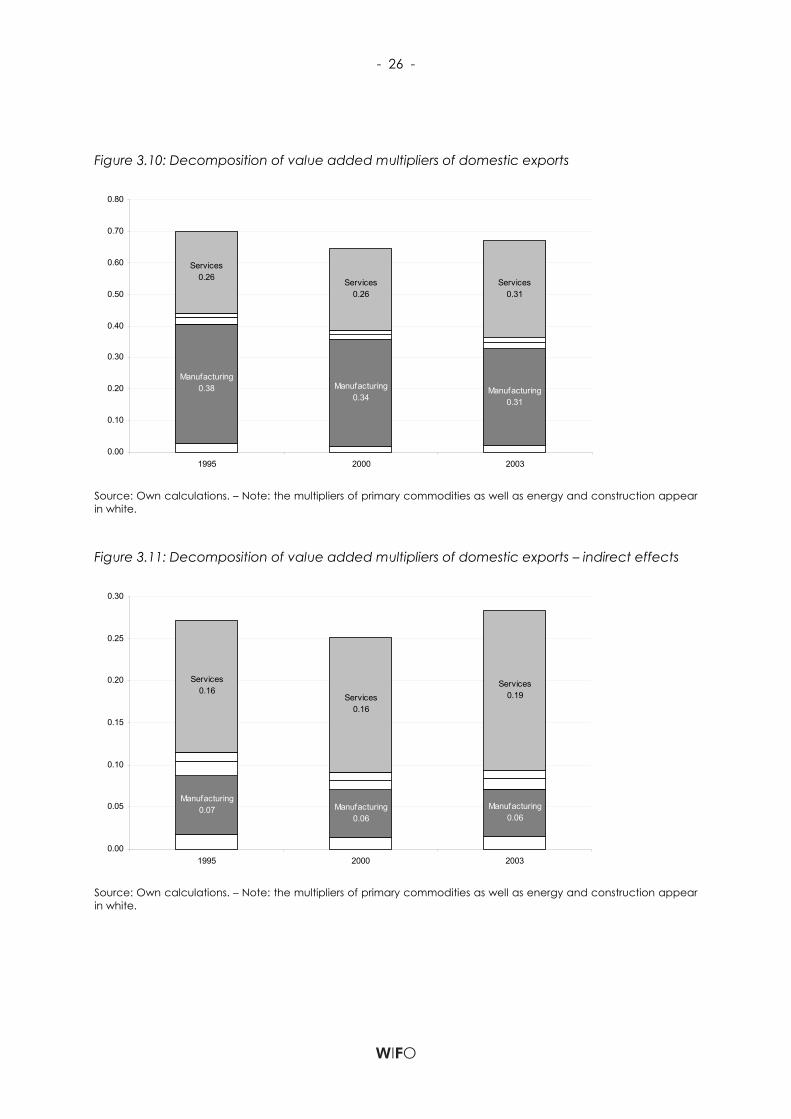
Looking at which groups of commodities were stimulated by exports in terms of value added, we observe a rather striking difference between manufacturing commodities and services (figure 3.12).4) While the value added benefit for manufacturing commodities declined, the respective multipliers for services went up appreciably to the extent that, in 2003, services and manufacturing benefited to the same extent from exports. This implies that export growth between 1995 and 2003 has had increasingly less impact on domestic value added in manufacturing, but gradually more impact on services.
When taking into account only indirect effects, the benefits shift further towards services. While the overall multipliers of indirect effects are slightly increasing for total domestic exports, the share of services in indirect effects exceeds the share of manufacturing commodities by
3) Induced value added is divided by domestic exports instead of total exports when calculating the multipliers. 4) Value added is usually calculated for sectors rather than commodities; since we use a commodity-by-commodity table, the value added is allocated to commodities.
- 25 -
large (see Figure 3.13). This fact points to a rather small amount of domestic manufacturing products that serve as inputs in the production of export commodities.
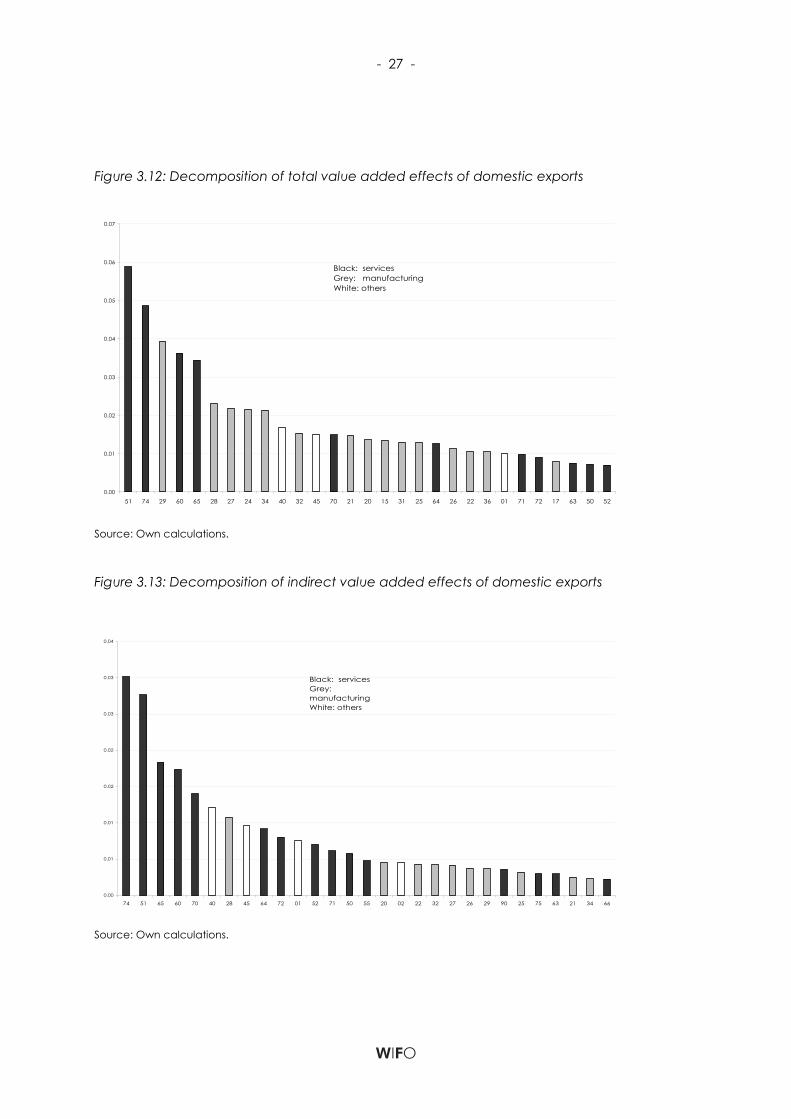
Figure 3.14 shows the value added effects of domestic exports for different commodities, i.e. the directly and indirectly generated value added for a certain commodity per Euro of total domestic exports. Among services wholesale trade, business services, transportation and banking benefit the most from total export activities; among manufacturing commodities it is machinery, automobiles, metals and chemicals. All these commodities account for the largest shares in exports as well, so the direct effects seem to dominate. Taking out these direct effects the ranking of commodities with respect to the size of the multipliers changes somewhat (figures 3.15): For services, the commodities with high total multipliers are also the ones with high indirect effects. Out of manufacturing commodities only metals show significant indirect effects. Energy, construction and products from agriculture and forestry also rank among the commodities for which indirect effects are highest. These findings imply a rather low level of domestic linkages with respect to export-oriented manufacturing in Austria. The production of manufacturing commodities bound for export thus relies to a high extent on foreign bought inputs.
A comparison of manufacturing and service exports reveals that services benefit from exports of manufacturing products to a considerable and an increasing extent, while manufacturing receives hardly any impulses from service exports (table 3.3a to 3.3e – actual exports). Moreover, the decline in the manufacturing multipliers can be traced back to the manufacturing commodities that are used up in the producing process. The increase in re-exports plays a major role in this development: As is shown in table 3.3c and 3.3d the actual multipliers of domestic manufacturing exports decline less than those of total manufacturing exports.
- 26 -
Figure 3.10: Decomposition of value added multipliers of domestic exports
Manufacturing0.31
Manufacturing0.34
Manufacturing0.38
Services0.31
Services0.26
Services0.26
0.00
0.10
0.20
0.30
0.40
0.50
0.60
0.70
0.80
1995 2000 2003
Source: Own calculations. – Note: the multipliers of primary commodities as well as energy and construction appear in white.
Figure 3.11: Decomposition of value added multipliers of domestic exports – indirect effects
Manufacturing0.07 Manufacturing
0.06Manufacturing
0.06
Services0.16
Services0.16
Services0.19
0.00
0.05
0.10
0.15
0.20
0.25
0.30
1995 2000 2003
Source: Own calculations. – Note: the multipliers of primary commodities as well as energy and construction appear in white.
- 27 -
Figure 3.12: Decomposition of total value added effects of domestic exports
0.00
0.01
0.02
0.03
0.04
0.05
0.06
0.07
51 74 29 60 65 28 27 24 34 40 32 45 70 21 20 15 31 25 64 26 22 36 01 71 72 17 63 50 52
Black: servicesGrey: manufacturingWhite: others
Source: Own calculations.
Figure 3.13: Decomposition of indirect value added effects of domestic exports
0.00
0.01
0.01
0.02
0.02
0.03
0.03
0.04
74 51 65 60 70 40 28 45 64 72 01 52 71 50 55 20 02 22 32 27 26 29 90 25 75 63 21 34 66
Black: servicesGrey: manufacturingWhite: others
Source: Own calculations.
- 28 -
Table 3.3a: Decomposition of value added multipliers of exports
Actual exports Exports 1995 1995 2000 2003 1995 2000 2003
Total 0.68 0.61 0.60 0.68 0.63 0.65 Manufacturing 0.36 0.32 0.27 0.36 0.34 0.32
Services 0.25 0.25 0.28 0.25 0.25 0.28
Table 3.3b: Decomposition of value added multipliers of domestic exports
Actual exports Exports 1995 1995 2000 2003 1995 2000 2003
Total 0.70 0.65 0.68 0.70 0.65 0.67 Manufacturing 0.38 0.34 0.31 0.38 0.35 0.34
Services 0.26 0.26 0.31 0.26 0.25 0.29
Table 3.3c: Decomposition of value added multipliers of manufacturing exports
Actual exports Exports 1995 1995 2000 2003 1995 2000 2003
Total 0.64 0.56 0.53 0.64 0.59 0.61 Manufacturing 0.44 0.39 0.34 0.44 0.41 0.39
Services 0.15 0.14 0.16 0.15 0.15 0.18
Table 3.3d: Decomposition of value added multipliers of domestic manufacturing exports
Actual exports Exports 1995 1995 2000 2003 1995 2000 2003
Total 0.66 0.61 0.63 0.66 0.61 0.63 Manufacturing 0.46 0.42 0.40 0.46 0.42 0.41
Services 0.16 0.15 0.19 0.16 0.15 0.19
Table 3.3e: Decomposition of value added multipliers of service exports
Actual exports Exports 1995 1995 2000 2003 1995 2000 2003
Total 0.85 0.81 0.84 0.85 0.81 0.83 Manufacturing 0.06 0.06 0.05 0.06 0.06 0.05
Services 0.75 0.73 0.76 0.75 0.73 0.75
Source for all tables: Own calculations.
- 29 -
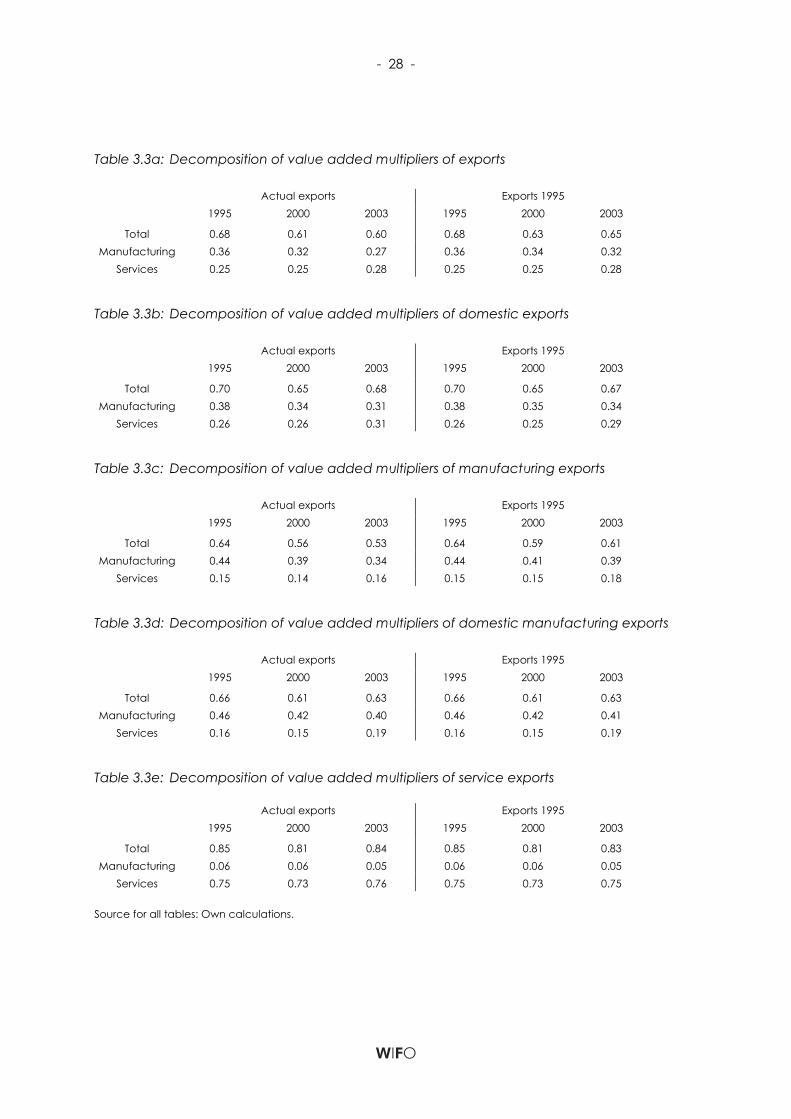
The value added contribution of services is slightly increasing. The multiplier of service exports is rather stable over time; since there are basically no re-exports of services, the multipliers of total service exports and those of domestic service exports are almost identical (and the latter are therefore not shown).
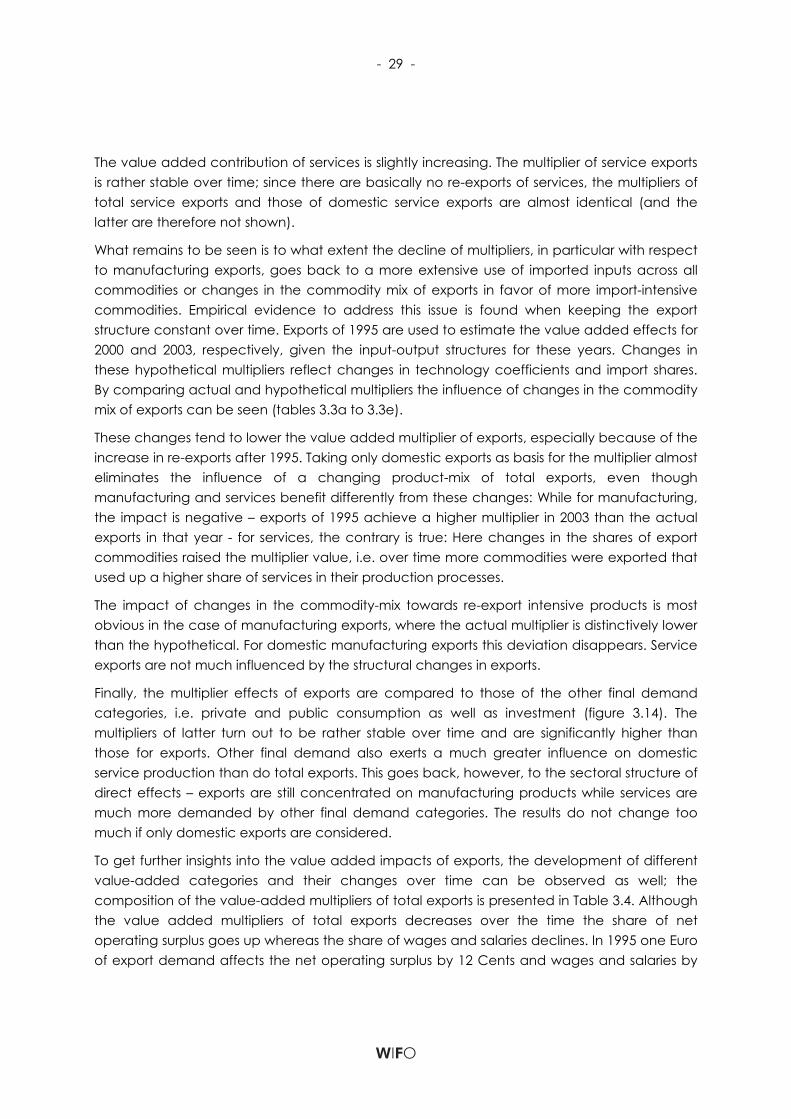
What remains to be seen is to what extent the decline of multipliers, in particular with respect to manufacturing exports, goes back to a more extensive use of imported inputs across all commodities or changes in the commodity mix of exports in favor of more import-intensive commodities. Empirical evidence to address this issue is found when keeping the export structure constant over time. Exports of 1995 are used to estimate the value added effects for 2000 and 2003, respectively, given the input-output structures for these years. Changes in these hypothetical multipliers reflect changes in technology coefficients and import shares. By comparing actual and hypothetical multipliers the influence of changes in the commodity mix of exports can be seen (tables 3.3a to 3.3e).
These changes tend to lower the value added multiplier of exports, especially because of the increase in re-exports after 1995. Taking only domestic exports as basis for the multiplier almost eliminates the influence of a changing product-mix of total exports, even though manufacturing and services benefit differently from these changes: While for manufacturing, the impact is negative – exports of 1995 achieve a higher multiplier in 2003 than the actual exports in that year - for services, the contrary is true: Here changes in the shares of export commodities raised the multiplier value, i.e. over time more commodities were exported that used up a higher share of services in their production processes.
The impact of changes in the commodity-mix towards re-export intensive products is most obvious in the case of manufacturing exports, where the actual multiplier is distinctively lower than the hypothetical. For domestic manufacturing exports this deviation disappears. Service exports are not much influenced by the structural changes in exports.
Finally, the multiplier effects of exports are compared to those of the other final demand categories, i.e. private and public consumption as well as investment (figure 3.14). The multipliers of latter turn out to be rather stable over time and are significantly higher than those for exports. Other final demand also exerts a much greater influence on domestic service production than do total exports. This goes back, however, to the sectoral structure of direct effects – exports are still concentrated on manufacturing products while services are much more demanded by other final demand categories. The results do not change too much if only domestic exports are considered.
To get further insights into the value added impacts of exports, the development of different value-added categories and their changes over time can be observed as well; the composition of the value-added multipliers of total exports is presented in Table 3.4. Although the value added multipliers of total exports decreases over the time the share of net operating surplus goes up whereas the share of wages and salaries declines. In 1995 one Euro of export demand affects the net operating surplus by 12 Cents and wages and salaries by
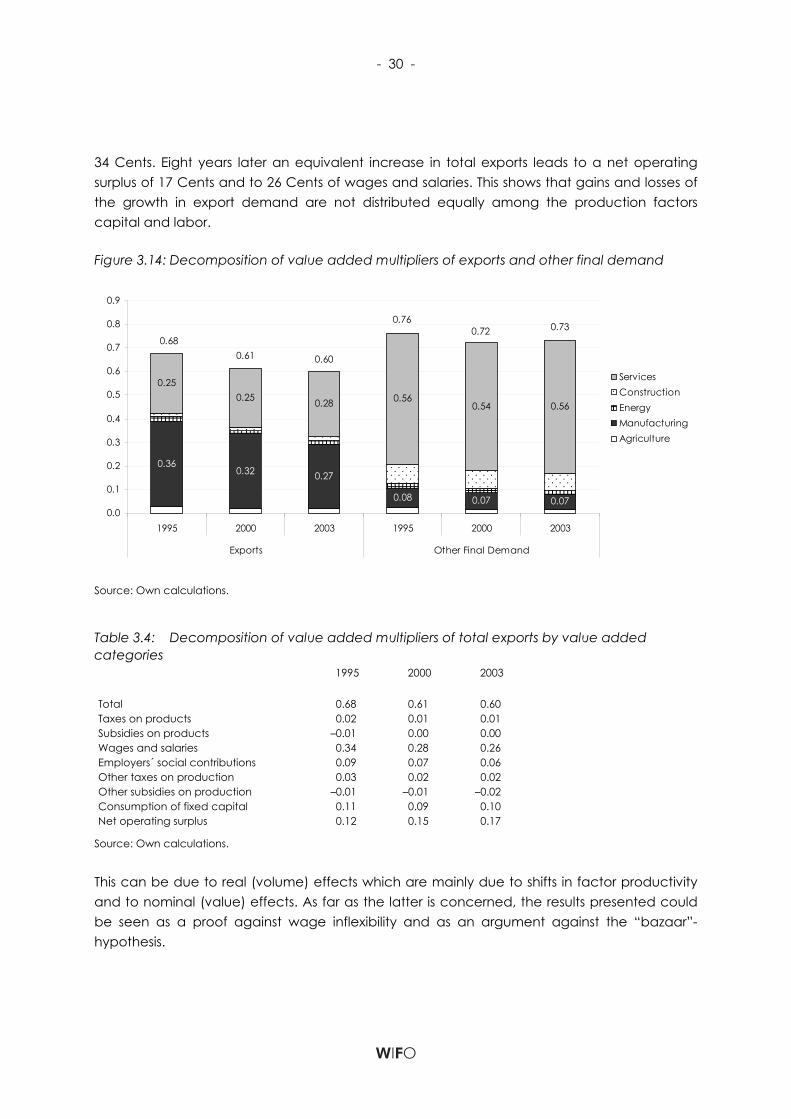
- 30 -
34 Cents. Eight years later an equivalent increase in total exports leads to a net operating surplus of 17 Cents and to 26 Cents of wages and salaries. This shows that gains and losses of the growth in export demand are not distributed equally among the production factors capital and labor.
Figure 3.14: Decomposition of value added multipliers of exports and other final demand
0.360.32 0.27
0.08 0.07 0.07
0.250.25 0.28 0.56
0.54 0.56
0.0
0.1
0.2
0.3
0.4
0.5
0.6
0.7
0.8
0.9
1995 2000 2003 1995 2000 2003
Exports Other Final Demand
ServicesConstructionEnergyManufacturingAgriculture
0.680.61 0.60
0.760.72 0.73
Source: Own calculations.
Table 3.4: Decomposition of value added multipliers of total exports by value added categories
1995 2000 2003
Total 0.68 0.61 0.60 Taxes on products 0.02 0.01 0.01 Subsidies on products –0.01 0.00 0.00 Wages and salaries 0.34 0.28 0.26 Employers´ social contributions 0.09 0.07 0.06 Other taxes on production 0.03 0.02 0.02 Other subsidies on production –0.01 –0.01 –0.02 Consumption of fixed capital 0.11 0.09 0.10 Net operating surplus 0.12 0.15 0.17
Source: Own calculations.
This can be due to real (volume) effects which are mainly due to shifts in factor productivity and to nominal (value) effects. As far as the latter is concerned, the results presented could be seen as a proof against wage inflexibility and as an argument against the “bazaar”-hypothesis.

- 31 -
The effects of a decreasing value added multiplier of exports, as has been already argued above based on a rising export to GDP ratio, must have been compensated by the observed high growth in exports. More evidence for this can be found if the total value added impact of exports and of other final demand categories are compared (figure 3.15). Exports were the only final demand category which could increase its share of induced value-added in total value-added between 1995 and 2003. In 2003 about 28% of total value-added resulted from the export industry which underlines the importance of exports as the driving force for GDP-growth. As alreadyy mentioned the net operating surplus gained more from the increase of export demand than wages and salaries. Whereas the net operating surplus induced by exports reached a share of about 3.8% in total value-added in 1995 it could enlarge its share up to 7.9% in 2003.
The analysis of value-added multipliers of exports showed substantial decreases in value-added effects per unit. A similar picture is found for employment effects of exports using the employment category full-time equivalent employees. For the most export goods the employment multiplier is decreasing over time (table 3.5). While in 1995 export production of 1 Mio. Euro was associated with about 12 jobs, the employment effects declined to about 8 jobs in 2003. A distinction between the export of manufacturing goods and services shows higher effects for services; however, the employment multiplier of total service exports is nevertheless decreasing as well.
The employment multiplier of total exports can also be shown for certain export commodities (figure 3.16). The highest multipliers are found for services. In 2003, export demand of 1 Mio. Euro for good 93 (other services) had employment effects of about 23 jobs (full time equivalents).
Similarly to value-added effects the share of induced employment by different final demand categories in total employment is calculated to get a picture of the importance of exports for the development of employment in Austria (figure 3.17). Although the multiplier declines over time the share of employment induced by exports has risen. This underlines the important role of exports for employment. In 2003, more than 25% of total employment was induced by export activities.
Changes in value added induced by exports are not equal across all commodities / sectors and the same is true for employment effects. Since different sectors have different employment structures with respect to education levels, first insights into the impacts of exports on educational groups can be gained as well. For this sectoral employment is multiplied by typical employment shares by education levels which were calculated based on information contained in social security data. Table 3.6 describes the expected changes in employment by education levels over time.

- 32 -
Figure 3.15: Share of induced value-added in total value-added by final demand categories
-0.05
0.00
0.05
0.10
0.15
0.20
0.25
0.30
0.35
0.40
0.45
Final consumptionexpenditure by
households
Final consumptionexpenditure by
government
Exports Final consumptionexpenditure by
households
Final consumptionexpenditure by
government
Exports Final consumptionexpenditure by
households
Final consumptionexpenditure by
government
Exports
1995 2000 2003
Taxes on products Subsidies on products Wages and salaries Employers´ social contributionsOther taxes on production Other subsidies on production Consumption of fixed capital Operating surplus, net
Source: Own calculations.
Table 3.5: Decomposition of employment multiplier of total exports (full time equivalent employees per 1Mio. €)
1995 2000 2003
Total 12 9 7 Manufacturing 11 8 7 Services 15 13 10
Source: Own calculations.
Table 3.6: Shares of export-induced employment by level of education in % 1995 2000 2003
Compulsory 18.6 17.7 17.6
Apprentice Training 44.0 43.3 42.9
Intermediate Technical and Vocational 14.2 13.6 13.7
Academic Secondary 4.3 4.8 4.9
Higher Technical and Vocational College 10.2 10.8 10.7
Post-secondary Course 0.4 0.5 0.5
Post-secondary College 0.7 0.7 0.7
University, Fachhochschule 7.6 8.6 9.0
Source: Own calculations.

- 33 -
Figure 3.16: Decomposition of employment multipliers of total exports, 2003
0.000
0.005
0.010
0.015
0.020
0.025
93 75 60 18 92 45 05 74 20 26 64 25 17 14 63 66 32 61 27 02 16 30 35 34 62 23
Source: Own calculations.
Figure 3.17: Share of induced employment in total employment by final demand categories
0.00
0.05
0.10
0.15
0.20
0.25
0.30
0.35
0.40
Final consumption expenditure by households
Final consumption expenditure by government
Exports
1995 2000 2003
Source: Own calculations.
Neglecting any shifts in education levels within sectors, the results show that value added benefits from exports are biased towards sectors which demand higher skills and training
- 34 -
related to their workforce. The three lowest levels of education have lost employment shares between 1995 and 2003, while shares of employees with training at the academic secondary level and above have all increased. Nevertheless, as is typical for the manufacturing industry in Austria, employees with lower level education, foremost with formal apprenticeship training, still dominate. What is left for future research is an investigation of the question, if companies with export activities, regardless of the sector they are classified in, have higher requirements on the training of their workforce than companies that concentrate on the domestic market.
3.5 Summary
Is Austria on the way to a “bazaar”-economy? Many indicators suggest it is: Not only are imports on the rise, at the cost of value added, but the production depth is falling as is the net investment quota. At the same time the multiplier analysis implies falling value added intensity in the manufacturing sector due to rising re-exports. Export growth is concentrating to a considerable extent on “bazaar”-type activities, namely import-export trading. But there is no evidence from this investigation that this development has hurt the Austrian economy: Export growth has been sufficiently strong to counterweight the declining value added intensity so that the share of export-induced value added in total GDP has gone up; the trade balance (when expenditures of foreigner in Austria are included in exports) has been positive and increasing. The value added generated by exports has, however, been distributed in favor of profits and to a lesser extent to wages and salaries, even though exports have also increased their share in total employment compared to private and public consumption; export employment is also becoming more skill-intensive. Lower multipliers nevertheless imply that for exports to contribute equally to domestic growth their growth has to be higher than in the past.
Service exports, which are less prone to a “bazaar”-type economy, have increased their share in total exports. Their value added contribution has been rather stable or slightly increasing. Services also benefit from exports more than in the past: the value added share of services has increased at the cost of manufacturing products.
- 35 -
4. An international analysis of export induced value added effects
4.1 Introduction and empirical facts
The analysis on the value added effects of exports that was carried out for Austria in the previous section is now being put into an international context. The economic significance of exports for a home country is analyzed by means of a value added multiplier comparison across countries. However, since a comparison of total multipliers between countries is meaningless because of the dependence of the multiplier values on the size of the respective economies and their degree of openness, we restrict our analysis to a sectoral decomposition of the value added multipliers. Thus only the differences between countries with respect to the extent that certain sectors benefit from exports are analysed.
A cross-section analysis is conducted using input-output tables provided by the OECD for the year 2000. Tables for 22 OECD countries and Brazil, in the following simply named OECD-23, were used for the international analysis. The OECD countries Mexico, South Korea, Iceland, Luxembourg, Japan, Australia, Czech Republic and Switzerland are not included because of conceptual deviations of their tables. All tables are valued in nominal terms and based on producer’s prices. The analysis is now based on tables set up on a sector-by-sector basis, distinguishing 48 economic activities which are classified according to the International Standard Industrial Classification, third revision (ISIC rev.3). An overview of all 48 sectors is found in the Appendix. However, in almost all countries some of these sectors are aggregated with others, depending on the information that was available and the sector size. In order to ensure comparability across all countries we apply the sectoral aggregation scheme of the Austrian table for all other countries as well. This implied the following changes to the OECD classification system:
• sector 2423 (pharmaceuticals) is now included in sector 24 (chemicals);
• manufacturing and casting of iron steel (sector 271,2731) and manufacturing and casting of non-ferrous metals (sectors 272,2732) are re-included in sector 27 (basic metals);
• sectors 351(building and repairing of ships and boats), 353 (Aircraft and Spacecraft) and 352,359 (railroad equipment and other transport equipment) are not treated separately in the analysis, which distinguishes only the aggregate sector 35 (aircraft, railroad, ships);
• neither are the energy sub-sectors 401 (Electricity) 402 (gas) and 403 (steam and hot water) separated as is the case in the original OECD tables.
Unfortunately countries do not follow the same methodological approach when compiling input-output tables. In particular, while some countries use the domestic concept (e.g.
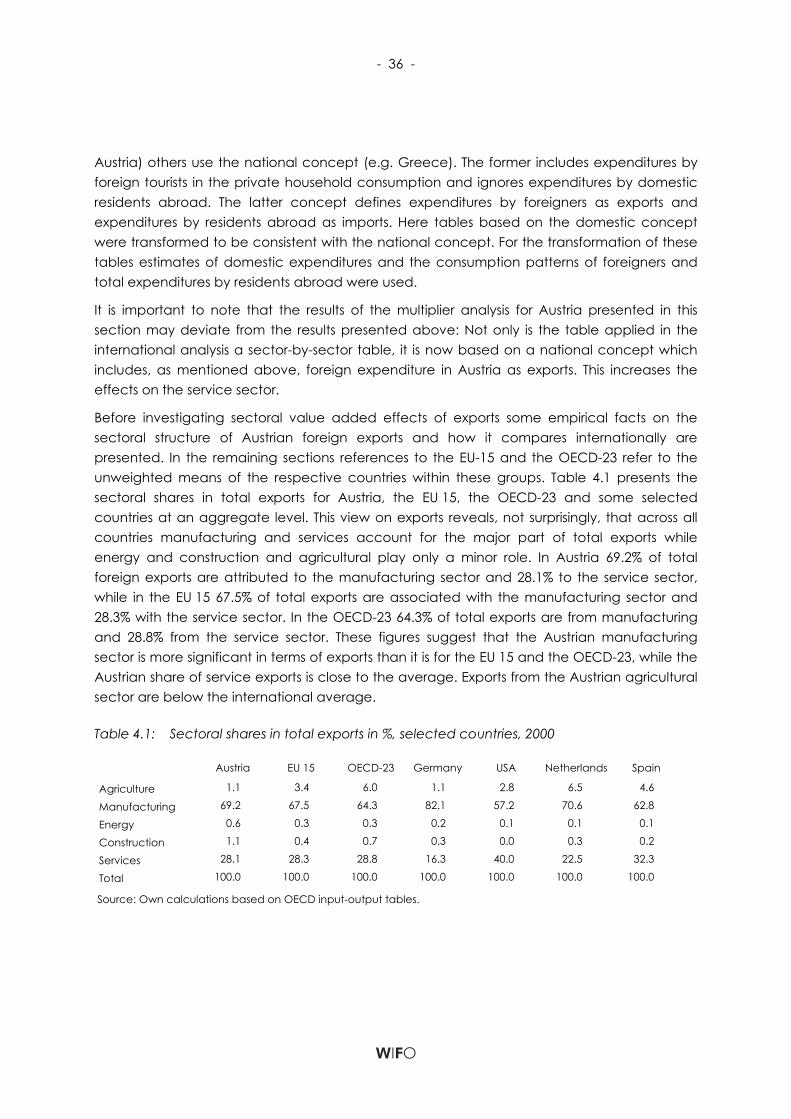
- 36 -
Austria) others use the national concept (e.g. Greece). The former includes expenditures by foreign tourists in the private household consumption and ignores expenditures by domestic residents abroad. The latter concept defines expenditures by foreigners as exports and expenditures by residents abroad as imports. Here tables based on the domestic concept were transformed to be consistent with the national concept. For the transformation of these tables estimates of domestic expenditures and the consumption patterns of foreigners and total expenditures by residents abroad were used.
It is important to note that the results of the multiplier analysis for Austria presented in this section may deviate from the results presented above: Not only is the table applied in the international analysis a sector-by-sector table, it is now based on a national concept which includes, as mentioned above, foreign expenditure in Austria as exports. This increases the effects on the service sector.
Before investigating sectoral value added effects of exports some empirical facts on the sectoral structure of Austrian foreign exports and how it compares internationally are presented. In the remaining sections references to the EU-15 and the OECD-23 refer to the unweighted means of the respective countries within these groups. Table 4.1 presents the sectoral shares in total exports for Austria, the EU 15, the OECD-23 and some selected countries at an aggregate level. This view on exports reveals, not surprisingly, that across all countries manufacturing and services account for the major part of total exports while energy and construction and agricultural play only a minor role. In Austria 69.2% of total foreign exports are attributed to the manufacturing sector and 28.1% to the service sector, while in the EU 15 67.5% of total exports are associated with the manufacturing sector and 28.3% with the service sector. In the OECD-23 64.3% of total exports are from manufacturing and 28.8% from the service sector. These figures suggest that the Austrian manufacturing sector is more significant in terms of exports than it is for the EU 15 and the OECD-23, while the Austrian share of service exports is close to the average. Exports from the Austrian agricultural sector are below the international average.
Table 4.1: Sectoral shares in total exports in %, selected countries, 2000
Austria EU 15 OECD-23 Germany USA Netherlands Spain
Agriculture 1.1 3.4 6.0 1.1 2.8 6.5 4.6
Manufacturing 69.2 67.5 64.3 82.1 57.2 70.6 62.8
Energy 0.6 0.3 0.3 0.2 0.1 0.1 0.1
Construction 1.1 0.4 0.7 0.3 0.0 0.3 0.2
Services 28.1 28.3 28.8 16.3 40.0 22.5 32.3
Total 100.0 100.0 100.0 100.0 100.0 100.0 100.0
Source: Own calculations based on OECD input-output tables.

- 37 -
Figure 4.1: Sectoral shares in total exports in percent, Austria and OECD-23, 2000
0
2
4
6
8
10
12
1-2-
510
-11-
1213
-14
15-1
617
-18-
19 2021
-22 23 24 25 26 27 28 29 30 31 32 33 34 35
36-3
7 40 41 4550
-51-
52 55 60 61 62 63 6465
-66-
67 70 71 72 73 74 75 80 8590
-91-
92-9
395
-99
OECD 23 Austria
Source: Own calculations based on OECD input-output tables.
Figure 4.1 shows the sectoral shares in total exports at a disaggregate level for Austria and the OECD-23. In Austria the manufacturing sectors 20 (wood, wood products), 22, (paper und pulp), 27 (manufacturing and casting of basic metals), 28 (fabricated metal products except machinery and equipment), 29 (machinery and equipment), and 34 (motor vehicles; bodies, parts accessories for motor vehicles) have above average shares in total export compared to the OECD-23. On the other hand the manufacturing sectors 15-16 (food products, beverages and tobacco), 23 (coke, refined petroleum products and nuclear fuel), 24 (chemicals) and 30 (office and accounting machinery) are below average in their shares in total exports in Austria compared to the OECD-23. Looking at the Austrian service sector the share in total exports of sector 55 (hotels and restaurants) and sector 60 (Land transport) is remarkably higher while the shares of sectors 61 (water transport) and 72 (computer and related activities) are significantly lower than in the OECD-23. All primary sectors, namely the 1-2-5 (agriculture, hunting, forestry and fishing), 10-11-12 (mining, energy) and 13-14 (mining, non-energy) have lower export-shares in Austria.
Table 4.2 depicts the seven most export-intensive sectors with respect to their share in total exports by countries. In sum the seven listed sectors account for approximately 50% of total exports. This is true for all countries as well as for the EU 15 and the OECD-23 average. For the EU 15 and the OECD-23 the sectors with the highest contribution to total exports are sectors 34 (motor vehicles, parts) with a share of 7.2% and 7.6%, respectively, 50-51-52 (wholesale, retail sale) with a share of 6.4% and 7.2%, respectively, 24 (chemicals) with a share of 8.9% and 6.9% and 29 (machinery and equipment) with a share of 6.7% and 5.7%. Other important sectors in terms of their share in total exports in the international samples are sectors 15-16 (food products, beverages tobacco), 55 (hotels and restaurants) and 32 (radio, television, communication products). For Austria sector 34 (motor vehicles, parts) has the highest share in total exports (10%), followed by sector 29 (machinery and equipment) with 9%, sector 55

- 38 -
(hotels and restaurants) with 7.6 %, sector 50, 51, 52 (wholesale, retail sale) with 6.4 %, and sectors 24 (chemicals), 32 (radio, television, communication products) and 27 (basic metals), each with a share in total exports of slightly above 5%.
Comparing the seven Austrian sectors with the highest export shares to the respective sectors of the EU 15 and the OECD-23 we notice that sector 34 (motor vehicles, parts) ranks top. Sectors 55 (hotels and restaurants) and 29 (machinery and equipment) are among the three sectors with the highest export shares in Austria, while they are not that important in the EU 15 and OECD-23 relative to other sectors. On the other hand sector 24 (chemicals) plays a less important role in Austria and sector 15-16 (food products, beverages, tobacco) does not appear at all among the seven most export-intensive Austrian sectors while it does in the EU 15 and the OECD-23 average.
It is necessary to point out the outstanding role of the sector 50-51-52 (wholesale, retail sale, trade) and the transport sectors 60 (land transport), 61 (water transport), 62 (air transport), These play a major role concerning both the share in total exports as well as the value added effects of exports, as will be depicted later on. Usually each purchaser, whether buying intermediate inputs or final demand products, incurs the producer’s price plus wholesale, retail sale, trade and transportation margins and excise taxes which add up to the purchaser price. However, most tables are valued in producer’s prices with the margins re-distributed to the trade and transport sectors.
Concluding we can say that at the aggregate level the manufacturing sector contributes most to total exports in all countries of the sample. With 69.2% the Austrian manufacturing sector has a higher share in total exports when compared to the EU 15 and the OECD-23 average while the share of the Austrian service sector in total exports lies very close to the average. At a more disaggregated level, the structure of Austrian exports is quite different from the EU 15 and the OECD-23. Sector 34 (motor vehicles and parts) has the highest share in exports both in Austria as well as the OECD and the EU. The sectors 29 (machinery and equipment) and 55 (hotels and restaurants) are the second and third largest contributors to total exports in Austria, while they play a less important role in the EU 15 and the OECD-23 relative to other sectors.
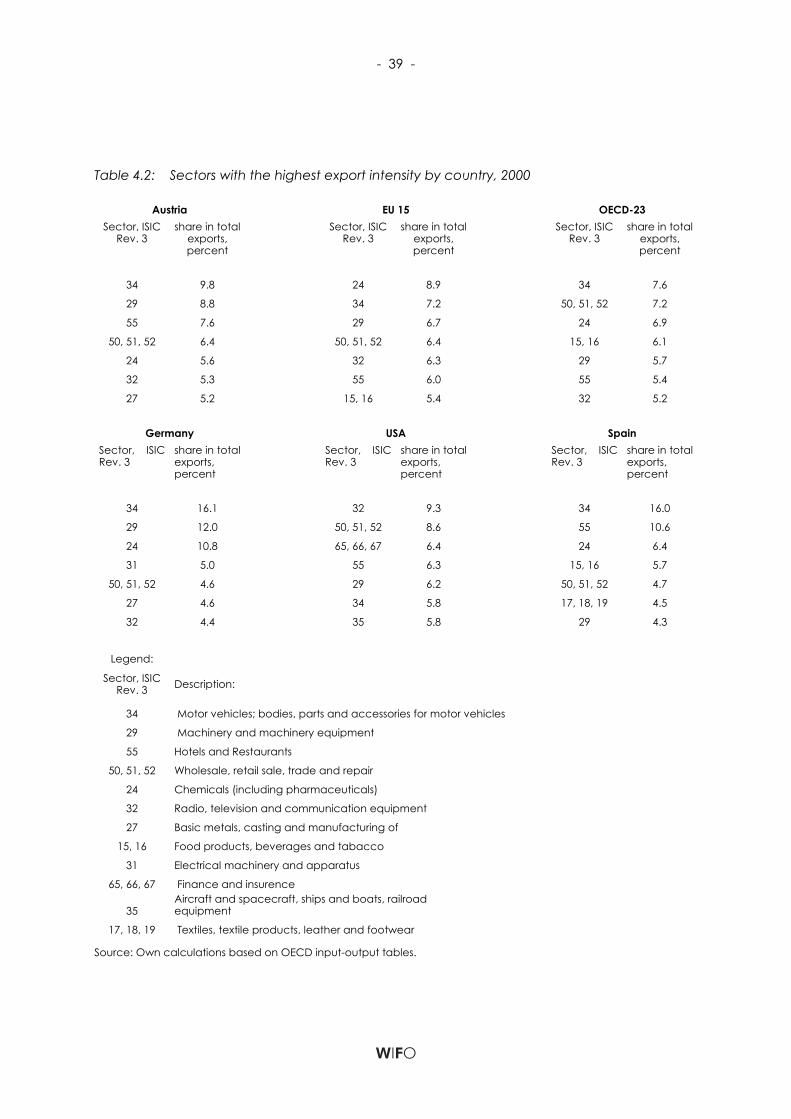
- 39 -
Table 4.2: Sectors with the highest export intensity by country, 2000
Austria EU 15 OECD-23 Sector, ISIC
Rev. 3 share in total
exports, percent
Sector, ISIC Rev. 3
share in total exports, percent
Sector, ISIC Rev. 3
share in total exports, percent
34 9.8 24 8.9 34 7.6
29 8.8 34 7.2 50, 51, 52 7.2
55 7.6 29 6.7 24 6.9
50, 51, 52 6.4 50, 51, 52 6.4 15, 16 6.1
24 5.6 32 6.3 29 5.7
32 5.3 55 6.0 55 5.4
27 5.2 15, 16 5.4 32 5.2
Germany USA Spain Sector, ISIC Rev. 3
share in total exports, percent
Sector, ISIC Rev. 3
share in total exports, percent
Sector, ISIC Rev. 3
share in total exports, percent
34 16.1 32 9.3 34 16.0
29 12.0 50, 51, 52 8.6 55 10.6
24 10.8 65, 66, 67 6.4 24 6.4
31 5.0 55 6.3 15, 16 5.7
50, 51, 52 4.6 29 6.2 50, 51, 52 4.7
27 4.6 34 5.8 17, 18, 19 4.5
32 4.4 35 5.8 29 4.3
Legend:
Sector, ISIC Rev. 3 Description:
34 Motor vehicles; bodies, parts and accessories for motor vehicles
29 Machinery and machinery equipment
55 Hotels and Restaurants
50, 51, 52 Wholesale, retail sale, trade and repair
24 Chemicals (including pharmaceuticals)
32 Radio, television and communication equipment
27 Basic metals, casting and manufacturing of
15, 16 Food products, beverages and tabacco
31 Electrical machinery and apparatus
65, 66, 67 Finance and insurence
35 Aircraft and spacecraft, ships and boats, railroad equipment
17, 18, 19 Textiles, textile products, leather and footwear
Source: Own calculations based on OECD input-output tables.
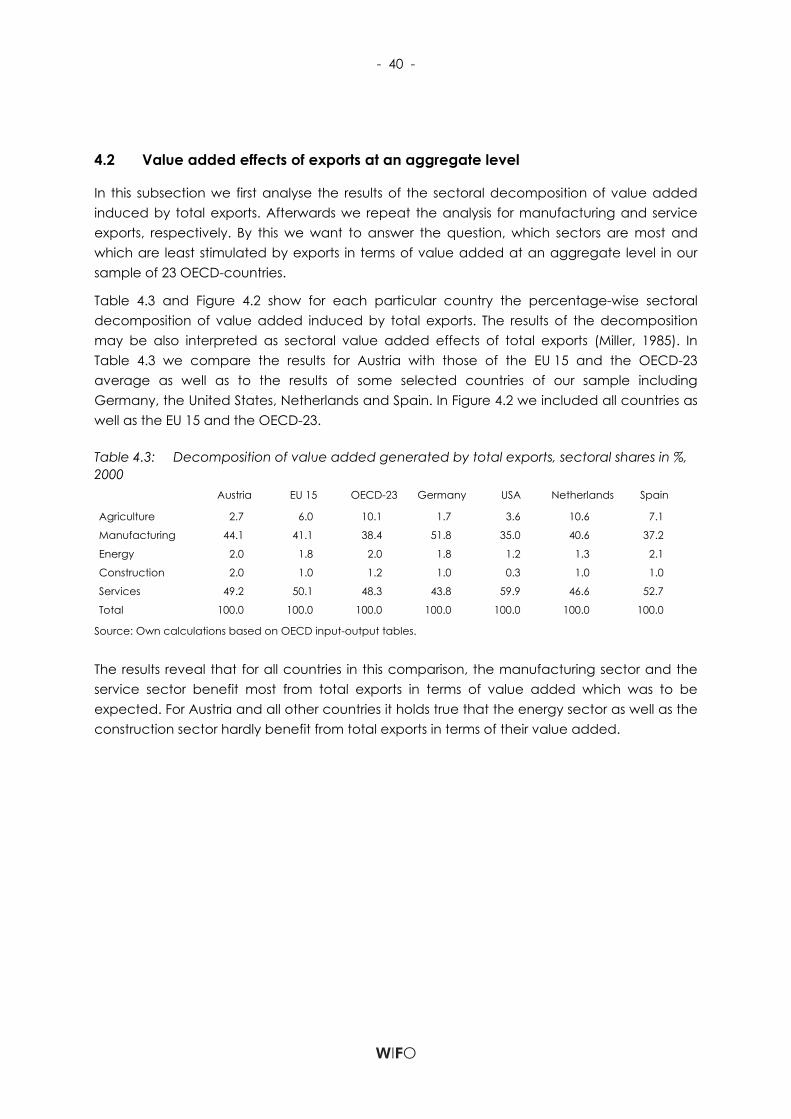
- 40 -
4.2 Value added effects of exports at an aggregate level
In this subsection we first analyse the results of the sectoral decomposition of value added induced by total exports. Afterwards we repeat the analysis for manufacturing and service exports, respectively. By this we want to answer the question, which sectors are most and which are least stimulated by exports in terms of value added at an aggregate level in our sample of 23 OECD-countries.
Table 4.3 and Figure 4.2 show for each particular country the percentage-wise sectoral decomposition of value added induced by total exports. The results of the decomposition may be also interpreted as sectoral value added effects of total exports (Miller, 1985). In Table 4.3 we compare the results for Austria with those of the EU 15 and the OECD-23 average as well as to the results of some selected countries of our sample including Germany, the United States, Netherlands and Spain. In Figure 4.2 we included all countries as well as the EU 15 and the OECD-23.
Table 4.3: Decomposition of value added generated by total exports, sectoral shares in %, 2000 Austria EU 15 OECD-23 Germany USA Netherlands Spain
Agriculture 2.7 6.0 10.1 1.7 3.6 10.6 7.1
Manufacturing 44.1 41.1 38.4 51.8 35.0 40.6 37.2
Energy 2.0 1.8 2.0 1.8 1.2 1.3 2.1
Construction 2.0 1.0 1.2 1.0 0.3 1.0 1.0
Services 49.2 50.1 48.3 43.8 59.9 46.6 52.7
Total 100.0 100.0 100.0 100.0 100.0 100.0 100.0
Source: Own calculations based on OECD input-output tables.
The results reveal that for all countries in this comparison, the manufacturing sector and the service sector benefit most from total exports in terms of value added which was to be expected. For Austria and all other countries it holds true that the energy sector as well as the construction sector hardly benefit from total exports in terms of their value added.
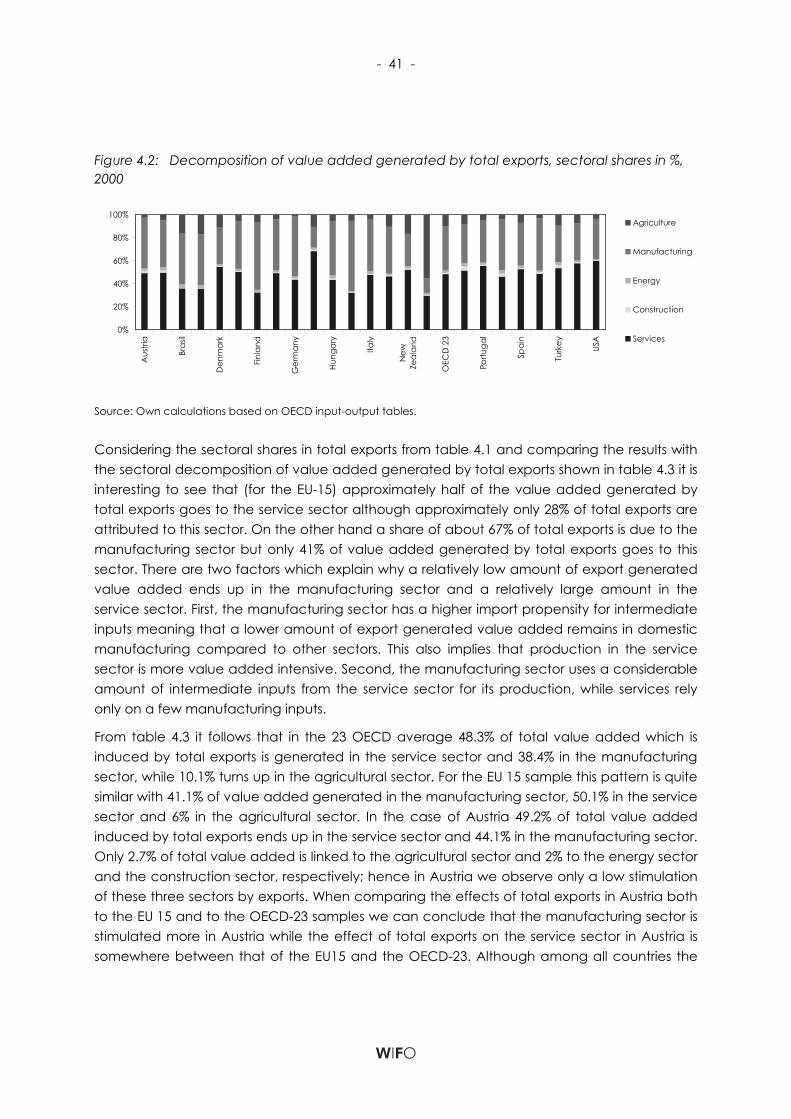
- 41 -
Figure 4.2: Decomposition of value added generated by total exports, sectoral shares in %, 2000
0%
20%
40%
60%
80%
100%
Aus
tria
Bra
sil
Den
ma
rk
Finl
and
Ger
ma
ny
Hun
gary
Italy
New
Zea
land
OEC
D 2
3
Portu
gal
Spai
n
Turk
ey USA
Agriculture
Manufacturing
Energy
Construction
Services
Source: Own calculations based on OECD input-output tables.
Considering the sectoral shares in total exports from table 4.1 and comparing the results with the sectoral decomposition of value added generated by total exports shown in table 4.3 it is interesting to see that (for the EU-15) approximately half of the value added generated by total exports goes to the service sector although approximately only 28% of total exports are attributed to this sector. On the other hand a share of about 67% of total exports is due to the manufacturing sector but only 41% of value added generated by total exports goes to this sector. There are two factors which explain why a relatively low amount of export generated value added ends up in the manufacturing sector and a relatively large amount in the service sector. First, the manufacturing sector has a higher import propensity for intermediate inputs meaning that a lower amount of export generated value added remains in domestic manufacturing compared to other sectors. This also implies that production in the service sector is more value added intensive. Second, the manufacturing sector uses a considerable amount of intermediate inputs from the service sector for its production, while services rely only on a few manufacturing inputs.
From table 4.3 it follows that in the 23 OECD average 48.3% of total value added which is induced by total exports is generated in the service sector and 38.4% in the manufacturing sector, while 10.1% turns up in the agricultural sector. For the EU 15 sample this pattern is quite similar with 41.1% of value added generated in the manufacturing sector, 50.1% in the service sector and 6% in the agricultural sector. In the case of Austria 49.2% of total value added induced by total exports ends up in the service sector and 44.1% in the manufacturing sector. Only 2.7% of total value added is linked to the agricultural sector and 2% to the energy sector and the construction sector, respectively; hence in Austria we observe only a low stimulation of these three sectors by exports. When comparing the effects of total exports in Austria both to the EU 15 and to the OECD-23 samples we can conclude that the manufacturing sector is stimulated more in Austria while the effect of total exports on the service sector in Austria is somewhere between that of the EU15 and the OECD-23. Although among all countries the
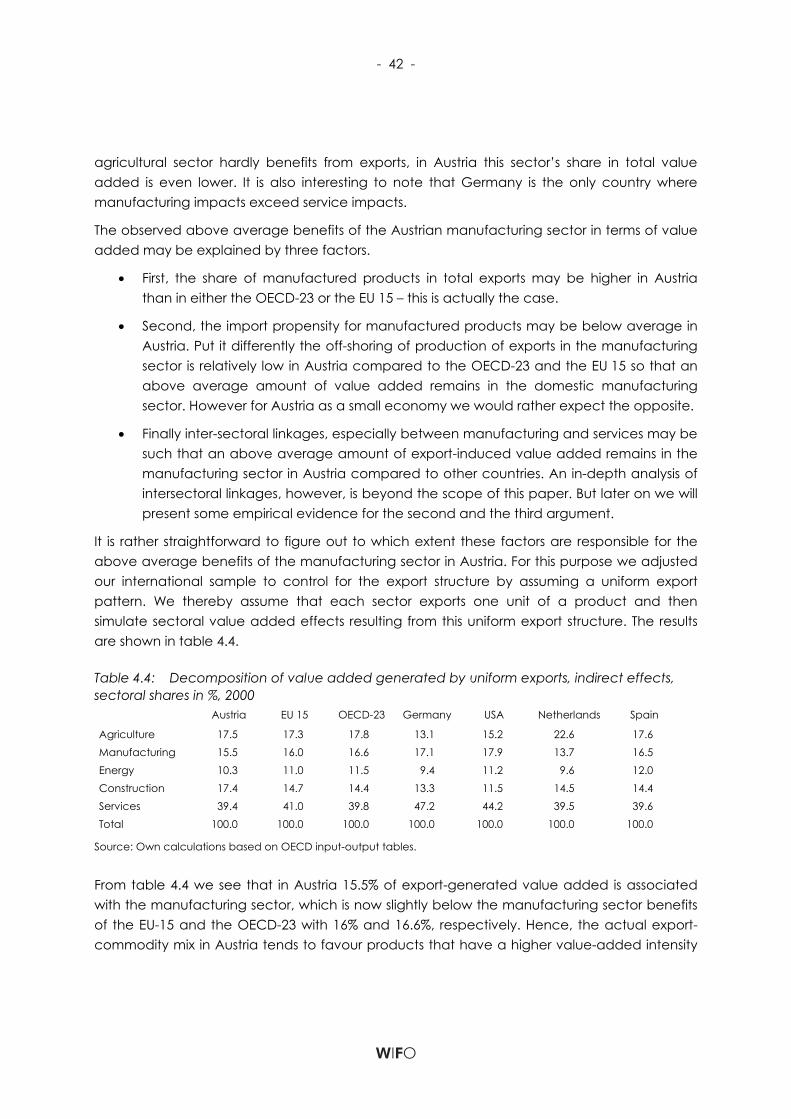
- 42 -
agricultural sector hardly benefits from exports, in Austria this sector’s share in total value added is even lower. It is also interesting to note that Germany is the only country where manufacturing impacts exceed service impacts.
The observed above average benefits of the Austrian manufacturing sector in terms of value added may be explained by three factors.
• First, the share of manufactured products in total exports may be higher in Austria than in either the OECD-23 or the EU 15 – this is actually the case.
• Second, the import propensity for manufactured products may be below average in Austria. Put it differently the off-shoring of production of exports in the manufacturing sector is relatively low in Austria compared to the OECD-23 and the EU 15 so that an above average amount of value added remains in the domestic manufacturing sector. However for Austria as a small economy we would rather expect the opposite.
• Finally inter-sectoral linkages, especially between manufacturing and services may be such that an above average amount of export-induced value added remains in the manufacturing sector in Austria compared to other countries. An in-depth analysis of intersectoral linkages, however, is beyond the scope of this paper. But later on we will present some empirical evidence for the second and the third argument.
It is rather straightforward to figure out to which extent these factors are responsible for the above average benefits of the manufacturing sector in Austria. For this purpose we adjusted our international sample to control for the export structure by assuming a uniform export pattern. We thereby assume that each sector exports one unit of a product and then simulate sectoral value added effects resulting from this uniform export structure. The results are shown in table 4.4.
Table 4.4: Decomposition of value added generated by uniform exports, indirect effects, sectoral shares in %, 2000
Austria EU 15 OECD-23 Germany USA Netherlands Spain
Agriculture 17.5 17.3 17.8 13.1 15.2 22.6 17.6 Manufacturing 15.5 16.0 16.6 17.1 17.9 13.7 16.5 Energy 10.3 11.0 11.5 9.4 11.2 9.6 12.0 Construction 17.4 14.7 14.4 13.3 11.5 14.5 14.4 Services 39.4 41.0 39.8 47.2 44.2 39.5 39.6 Total 100.0 100.0 100.0 100.0 100.0 100.0 100.0
Source: Own calculations based on OECD input-output tables.
From table 4.4 we see that in Austria 15.5% of export-generated value added is associated with the manufacturing sector, which is now slightly below the manufacturing sector benefits of the EU-15 and the OECD-23 with 16% and 16.6%, respectively. Hence, the actual export-commodity mix in Austria tends to favour products that have a higher value-added intensity
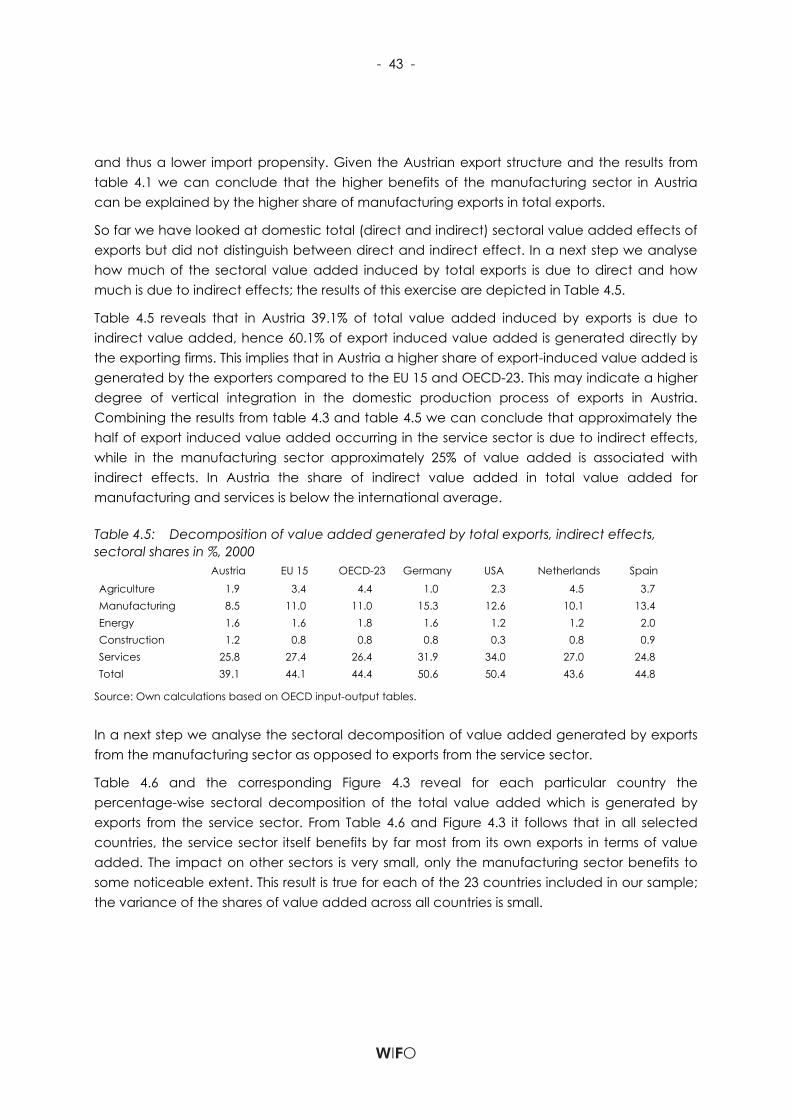
- 43 -
and thus a lower import propensity. Given the Austrian export structure and the results from table 4.1 we can conclude that the higher benefits of the manufacturing sector in Austria can be explained by the higher share of manufacturing exports in total exports.
So far we have looked at domestic total (direct and indirect) sectoral value added effects of exports but did not distinguish between direct and indirect effect. In a next step we analyse how much of the sectoral value added induced by total exports is due to direct and how much is due to indirect effects; the results of this exercise are depicted in Table 4.5.
Table 4.5 reveals that in Austria 39.1% of total value added induced by exports is due to indirect value added, hence 60.1% of export induced value added is generated directly by the exporting firms. This implies that in Austria a higher share of export-induced value added is generated by the exporters compared to the EU 15 and OECD-23. This may indicate a higher degree of vertical integration in the domestic production process of exports in Austria. Combining the results from table 4.3 and table 4.5 we can conclude that approximately the half of export induced value added occurring in the service sector is due to indirect effects, while in the manufacturing sector approximately 25% of value added is associated with indirect effects. In Austria the share of indirect value added in total value added for manufacturing and services is below the international average.
Table 4.5: Decomposition of value added generated by total exports, indirect effects, sectoral shares in %, 2000
Austria EU 15 OECD-23 Germany USA Netherlands Spain
Agriculture 1.9 3.4 4.4 1.0 2.3 4.5 3.7 Manufacturing 8.5 11.0 11.0 15.3 12.6 10.1 13.4 Energy 1.6 1.6 1.8 1.6 1.2 1.2 2.0 Construction 1.2 0.8 0.8 0.8 0.3 0.8 0.9 Services 25.8 27.4 26.4 31.9 34.0 27.0 24.8 Total 39.1 44.1 44.4 50.6 50.4 43.6 44.8
Source: Own calculations based on OECD input-output tables.
In a next step we analyse the sectoral decomposition of value added generated by exports from the manufacturing sector as opposed to exports from the service sector.
Table 4.6 and the corresponding Figure 4.3 reveal for each particular country the percentage-wise sectoral decomposition of the total value added which is generated by exports from the service sector. From Table 4.6 and Figure 4.3 it follows that in all selected countries, the service sector itself benefits by far most from its own exports in terms of value added. The impact on other sectors is very small, only the manufacturing sector benefits to some noticeable extent. This result is true for each of the 23 countries included in our sample; the variance of the shares of value added across all countries is small.

- 44 -
Table 4.6: Decomposition of value added generated by exports from the service sector, sectoral shares in %, 2000
Austria EU 15 OECD-23 Germany USA Netherlands Spain
Agriculture 1.2 1.3 1.9 0.5 1.2 0.8 2.1 Manufacturing 4.4 4.3 5.1 4.2 5.2 3.1 5.4 Energy 1.2 1.0 1.2 1.0 0.9 0.6 1.2 Construction 1.4 0.9 0.9 0.8 0.4 0.9 0.9 Services 91.8 92.5 91.0 93.5 92.4 94.5 90.4 Total 100.0 100.0 100.0 100.0 100.0 100.0 100.0
Source: Own calculations based on OECD input-output tables.
Figure 4.3: Decomposition of value added generated by exports from the service sector, sectoral shares in %, 2000
70%
75%
80%
85%
90%
95%
100%
Aus
tria
EU 1
5
OEC
D 2
3
Ger
man
y
USA
Net
herla
nds
Spa
in
Agriculture
Manufacturing
Energy
Construction
Services
Source: Own calculations based on OECD input-output tables.
In the overall sample of the 23 OECD countries 91% of value added which is induced by exports from the service sector ends up in the same sector, 5.1% of generated value added ends goes to the manufacturing sector. Only 3.9% of generated value added is allocated to the remaining three sectors. For the EU 15 sample the picture is almost identical with 92.5% in the manufacturing sector, 4.3% in the service sector and 3.2% in the other three sectors. The results for Austria are very similar, in fact 91.8% of total value added generated by exports from the service sector remains in the service sector, 4.4% of total value added goes to the manufacturing sector. With a share of 3.8% the remaining three sectors are hardly stimulated by service exports at all. When comparing the effects on the manufacturing and the service sector we find Austria inconspicuously between the EU 15 and the OECD-23 results. The intuition behind these results is the following: Products which are exported from the service sector hardly require any intermediate inputs from other sectors, but rely mostly on intermediate inputs from the service sector itself. Additionally, service inputs are less often
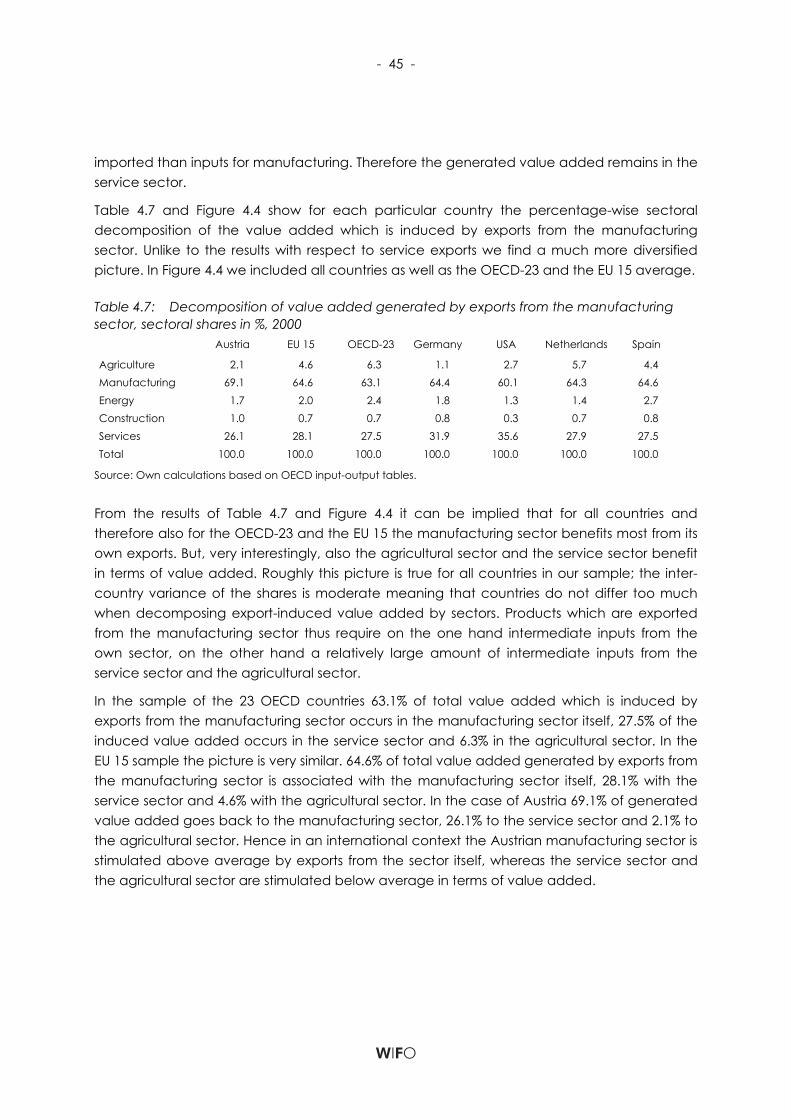
- 45 -
imported than inputs for manufacturing. Therefore the generated value added remains in the service sector.
Table 4.7 and Figure 4.4 show for each particular country the percentage-wise sectoral decomposition of the value added which is induced by exports from the manufacturing sector. Unlike to the results with respect to service exports we find a much more diversified picture. In Figure 4.4 we included all countries as well as the OECD-23 and the EU 15 average.
Table 4.7: Decomposition of value added generated by exports from the manufacturing sector, sectoral shares in %, 2000 Austria EU 15 OECD-23 Germany USA Netherlands Spain
Agriculture 2.1 4.6 6.3 1.1 2.7 5.7 4.4 Manufacturing 69.1 64.6 63.1 64.4 60.1 64.3 64.6 Energy 1.7 2.0 2.4 1.8 1.3 1.4 2.7 Construction 1.0 0.7 0.7 0.8 0.3 0.7 0.8 Services 26.1 28.1 27.5 31.9 35.6 27.9 27.5 Total 100.0 100.0 100.0 100.0 100.0 100.0 100.0
Source: Own calculations based on OECD input-output tables.
From the results of Table 4.7 and Figure 4.4 it can be implied that for all countries and therefore also for the OECD-23 and the EU 15 the manufacturing sector benefits most from its own exports. But, very interestingly, also the agricultural sector and the service sector benefit in terms of value added. Roughly this picture is true for all countries in our sample; the inter-country variance of the shares is moderate meaning that countries do not differ too much when decomposing export-induced value added by sectors. Products which are exported from the manufacturing sector thus require on the one hand intermediate inputs from the own sector, on the other hand a relatively large amount of intermediate inputs from the service sector and the agricultural sector.
In the sample of the 23 OECD countries 63.1% of total value added which is induced by exports from the manufacturing sector occurs in the manufacturing sector itself, 27.5% of the induced value added occurs in the service sector and 6.3% in the agricultural sector. In the EU 15 sample the picture is very similar. 64.6% of total value added generated by exports from the manufacturing sector is associated with the manufacturing sector itself, 28.1% with the service sector and 4.6% with the agricultural sector. In the case of Austria 69.1% of generated value added goes back to the manufacturing sector, 26.1% to the service sector and 2.1% to the agricultural sector. Hence in an international context the Austrian manufacturing sector is stimulated above average by exports from the sector itself, whereas the service sector and the agricultural sector are stimulated below average in terms of value added.
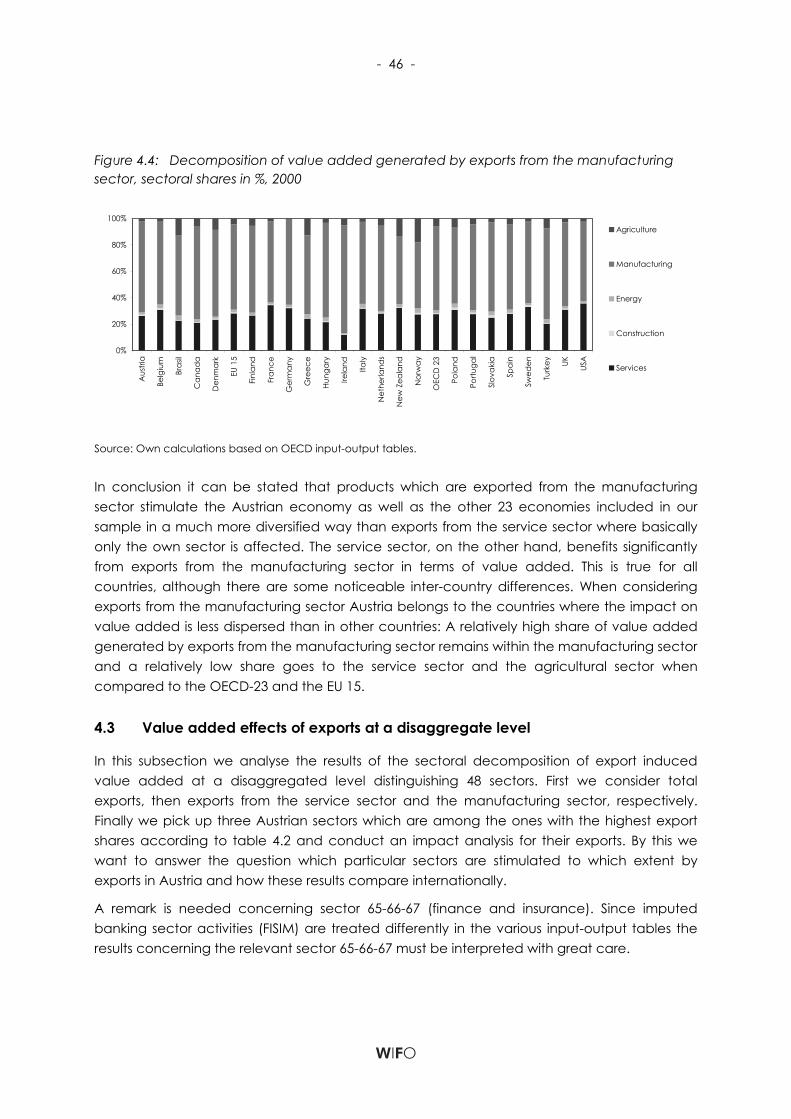
- 46 -
Figure 4.4: Decomposition of value added generated by exports from the manufacturing sector, sectoral shares in %, 2000
0%
20%
40%
60%
80%
100%
Aus
tria
Belg
ium
Bras
il
Ca
nad
a
Den
ma
rk
EU 1
5
Finla
nd
Fra
nce
Ger
ma
ny
Gre
ece
Hun
gary
Irela
nd Italy
Net
herla
nds
New
Zea
land
Nor
wa
y
OEC
D 2
3
Pola
nd
Portu
gal
Slov
aki
a
Spa
in
Swed
en
Turk
ey UK USA
Agriculture
Manufacturing
Energy
Construction
Services
Source: Own calculations based on OECD input-output tables.
In conclusion it can be stated that products which are exported from the manufacturing sector stimulate the Austrian economy as well as the other 23 economies included in our sample in a much more diversified way than exports from the service sector where basically only the own sector is affected. The service sector, on the other hand, benefits significantly from exports from the manufacturing sector in terms of value added. This is true for all countries, although there are some noticeable inter-country differences. When considering exports from the manufacturing sector Austria belongs to the countries where the impact on value added is less dispersed than in other countries: A relatively high share of value added generated by exports from the manufacturing sector remains within the manufacturing sector and a relatively low share goes to the service sector and the agricultural sector when compared to the OECD-23 and the EU 15.
4.3 Value added effects of exports at a disaggregate level
In this subsection we analyse the results of the sectoral decomposition of export induced value added at a disaggregated level distinguishing 48 sectors. First we consider total exports, then exports from the service sector and the manufacturing sector, respectively. Finally we pick up three Austrian sectors which are among the ones with the highest export shares according to table 4.2 and conduct an impact analysis for their exports. By this we want to answer the question which particular sectors are stimulated to which extent by exports in Austria and how these results compare internationally.
A remark is needed concerning sector 65-66-67 (finance and insurance). Since imputed banking sector activities (FISIM) are treated differently in the various input-output tables the results concerning the relevant sector 65-66-67 must be interpreted with great care.

- 47 -
Figure 4.5 shows the percentage-wise sectoral decomposition of value added generated by total exports at a 48 sector level. In figure 4.5 and in the following figures we indicate how much of sectoral value added induced by total exports is due to direct and indirect effects. For a particular sector the entire column indicates the total domestic value added (direct and indirect) effects. The lower part of the column shows the amount of domestic value added due to direct effects while the upper part indicates the amount of domestic value added due to indirect effects.
The following results are drawn from figure 4.5: In Austria a share of 10.4% of export-generated value added is attributed to sector 50-51-52 (wholesale, retail sale, trade); this sector benefits most from total exports in terms of value added. With a share of 11.4% of export-generated value added this sector also benefits most from exports in the OECD-23; the benefits in the OECD-23 are slightly higher than in Austria. Furthermore sector 65-66-67 (Finance and insurance) with a share of 7.3%, 55 (hotels and restaurants) with a share of 7.1%, 74 (other business services) with a share of 6.9% and the manufacturing sector 29 (machinery and equipment) with a share of 5.6% in export generated value added benefit most from total exports in terms of value added in Austria.
Figure 4.5: Decomposition of value added generated by total exports, sectoral shares in %, 2000
0
2
4
6
8
10
12
1-2-
5
10-1
1-12
13-1
4
15-1
6
17-1
8-19 20
21-2
2 23 24 25 26 27 28 29 30 31 32 33 34 35
36-3
7 40 41 45
50-5
1-52 55 60 61 62 63 64
65-6
6-67 70 71 72 73 74 75 80 85
90-9
1-92
-93
95-9
9
OECD 23, direct OECD 23, indirect
Austria, direct Austria, indirect
Source: Own calculations based on OECD input-output tables.
In the OECD-23 the service sectors 74 (other business services) with a share of 7.5%, 65-66-67 (Finance and insurance) with a share of 5.2%, 55 (hotels and restaurants) with a share of 4.6% and the agricultural sector 1-2-5 (agriculture, hunting, forestry, fishing) with a share of 4.8% benefit most from exports in terms of value added. In contrast to Austria in the OECD-23 there is no manufacturing sector among the five sectors which account for the highest share in export induced value added.
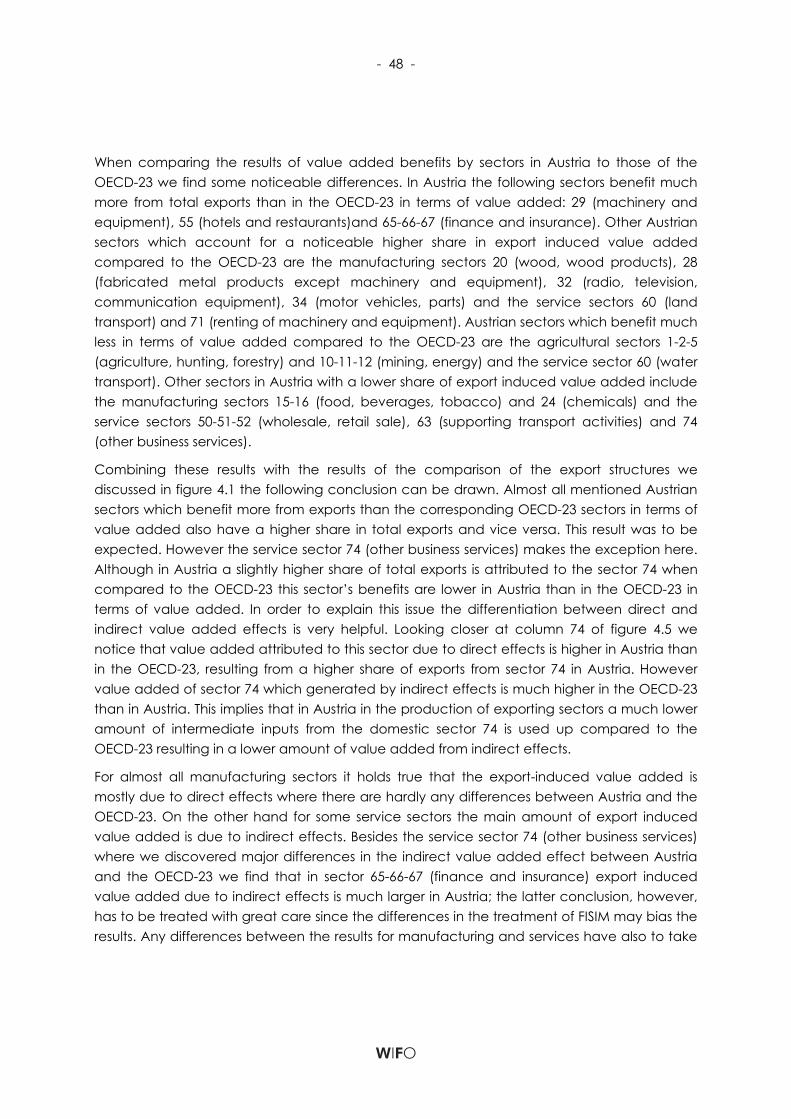
- 48 -
When comparing the results of value added benefits by sectors in Austria to those of the OECD-23 we find some noticeable differences. In Austria the following sectors benefit much more from total exports than in the OECD-23 in terms of value added: 29 (machinery and equipment), 55 (hotels and restaurants)and 65-66-67 (finance and insurance). Other Austrian sectors which account for a noticeable higher share in export induced value added compared to the OECD-23 are the manufacturing sectors 20 (wood, wood products), 28 (fabricated metal products except machinery and equipment), 32 (radio, television, communication equipment), 34 (motor vehicles, parts) and the service sectors 60 (land transport) and 71 (renting of machinery and equipment). Austrian sectors which benefit much less in terms of value added compared to the OECD-23 are the agricultural sectors 1-2-5 (agriculture, hunting, forestry) and 10-11-12 (mining, energy) and the service sector 60 (water transport). Other sectors in Austria with a lower share of export induced value added include the manufacturing sectors 15-16 (food, beverages, tobacco) and 24 (chemicals) and the service sectors 50-51-52 (wholesale, retail sale), 63 (supporting transport activities) and 74 (other business services).
Combining these results with the results of the comparison of the export structures we discussed in figure 4.1 the following conclusion can be drawn. Almost all mentioned Austrian sectors which benefit more from exports than the corresponding OECD-23 sectors in terms of value added also have a higher share in total exports and vice versa. This result was to be expected. However the service sector 74 (other business services) makes the exception here. Although in Austria a slightly higher share of total exports is attributed to the sector 74 when compared to the OECD-23 this sector’s benefits are lower in Austria than in the OECD-23 in terms of value added. In order to explain this issue the differentiation between direct and indirect value added effects is very helpful. Looking closer at column 74 of figure 4.5 we notice that value added attributed to this sector due to direct effects is higher in Austria than in the OECD-23, resulting from a higher share of exports from sector 74 in Austria. However value added of sector 74 which generated by indirect effects is much higher in the OECD-23 than in Austria. This implies that in Austria in the production of exporting sectors a much lower amount of intermediate inputs from the domestic sector 74 is used up compared to the OECD-23 resulting in a lower amount of value added from indirect effects.
For almost all manufacturing sectors it holds true that the export-induced value added is mostly due to direct effects where there are hardly any differences between Austria and the OECD-23. On the other hand for some service sectors the main amount of export induced value added is due to indirect effects. Besides the service sector 74 (other business services) where we discovered major differences in the indirect value added effect between Austria and the OECD-23 we find that in sector 65-66-67 (finance and insurance) export induced value added due to indirect effects is much larger in Austria; the latter conclusion, however, has to be treated with great care since the differences in the treatment of FISIM may bias the results. Any differences between the results for manufacturing and services have also to take

- 49 -
into account that imported inputs are much more relevant for manufacturing than for services.
Next we turn to an impact analysis of exports from the service sector only. The results of the sectoral decomposition of value added induced by exports from the service sector is shown in figure 4.6. As already derived in subsection 4.2 figure 4.3 shows that the service sector itself is the one which benefits by far most from its own exports, the manufacturing sector is hardly stimulated at all. In Austria the following five sectors benefit most from exports from the service sector: 55 (hotels and restaurants) with a share of 19.0%, 50-51-52 (wholesale and retail sale) with a share of 18.7%, 74 (other business services) with a share of 11.4%, 65-66-67 (finance and insurance) with a share of 11.4% and 60 (land transport) with a share of 9.4% in service sector exports generated value added.
Figure 4.6: Decomposition of value added generated by exports from the service sector, sectoral shares in %, 2000
0
5
10
15
20
25
1-2-
5
10-1
1-12
13-1
4
15-1
6
17-1
8-19 20
21-2
2 23 24 25 26 27 28 29 30 31 32 33 34 35
36-3
7 40 41 45
50-5
1-52 55 60 61 62 63 64
65-6
6-67 70 71 72 73 74 75 80 85
90-9
1-92
-93
95-9
9
OECD 23, direct OECD 23, indirect Austria, direct Austria, indirect
Source: Own calculations based on OECD input-output tables.
In the OECD-23 the following five sectors benefit most from exports form the service sector: 50-51-52 (wholesale, retail sale) with a share of 20.2%, 74 (other business services) with a share of 13.1%, 55 (hotels and restaurants) with a share of 10.6%, 65-66-67 with a share of 7.9% and 60 (land transport) with a share of 7.9% in service sector exports induced value added. Compared the OECD-23, the Austrian sector 55 (hotels and restaurants) benefits much more (due to a strong tourism industry) and is the Austrian sector for which the export-induces value added effect is the highest. Furthermore the sectors 60 (land transport), 65-66-67 (finance and insurance) and 71 (renting of machinery and equipment) account for a higher share in service sectors’ exports generated value added. By contrast the sectors 61(water transport), 63 (supporting transport activities), 64 (post, telecommunication), 72 (computer related activities) and 74 (other business activities) benefit less form exports from the service sector in Austria when compared to the OECD-23.
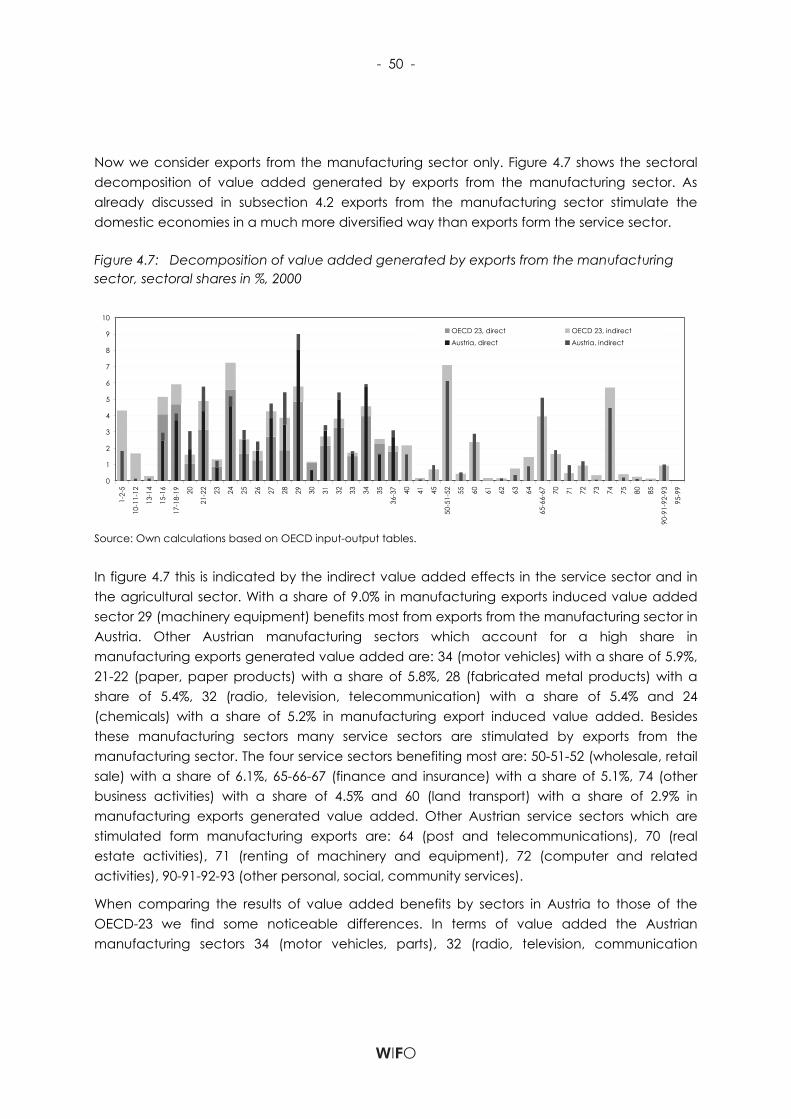
- 50 -
Now we consider exports from the manufacturing sector only. Figure 4.7 shows the sectoral decomposition of value added generated by exports from the manufacturing sector. As already discussed in subsection 4.2 exports from the manufacturing sector stimulate the domestic economies in a much more diversified way than exports form the service sector.
Figure 4.7: Decomposition of value added generated by exports from the manufacturing sector, sectoral shares in %, 2000
0
1
2
3
4
5
6
7
8
9
10
1-2-
5
10-1
1-12
13-1
4
15-1
6
17-1
8-19 20
21-2
2 23 24 25 26 27 28 29 30 31 32 33 34 35
36-3
7 40 41 45
50-5
1-52 55 60 61 62 63 64
65-6
6-67 70 71 72 73 74 75 80 85
90-9
1-92
-93
95-9
9
OECD 23, direct OECD 23, indirect
Austria, direct Austria, indirect
Source: Own calculations based on OECD input-output tables.
In figure 4.7 this is indicated by the indirect value added effects in the service sector and in the agricultural sector. With a share of 9.0% in manufacturing exports induced value added sector 29 (machinery equipment) benefits most from exports from the manufacturing sector in Austria. Other Austrian manufacturing sectors which account for a high share in manufacturing exports generated value added are: 34 (motor vehicles) with a share of 5.9%, 21-22 (paper, paper products) with a share of 5.8%, 28 (fabricated metal products) with a share of 5.4%, 32 (radio, television, telecommunication) with a share of 5.4% and 24 (chemicals) with a share of 5.2% in manufacturing export induced value added. Besides these manufacturing sectors many service sectors are stimulated by exports from the manufacturing sector. The four service sectors benefiting most are: 50-51-52 (wholesale, retail sale) with a share of 6.1%, 65-66-67 (finance and insurance) with a share of 5.1%, 74 (other business activities) with a share of 4.5% and 60 (land transport) with a share of 2.9% in manufacturing exports generated value added. Other Austrian service sectors which are stimulated form manufacturing exports are: 64 (post and telecommunications), 70 (real estate activities), 71 (renting of machinery and equipment), 72 (computer and related activities), 90-91-92-93 (other personal, social, community services).
When comparing the results of value added benefits by sectors in Austria to those of the OECD-23 we find some noticeable differences. In terms of value added the Austrian manufacturing sectors 34 (motor vehicles, parts), 32 (radio, television, communication

- 51 -
products), 29 (machinery and equipment), 28 (fabricated metal products except machinery and equipment), 20 (wood, wood products) benefit much more, while the Austrian manufacturing sectors 21-22 (paper, paper products), 25 (rubber and plastic products), 26 (other non-metallic mineral products), 27 (basic metals), 31 (electrical machinery and apparatus), benefit somewhat more from exports from the manufacturing sector when compared to the OECD-23. On the other hand the manufacturing sectors 15-16 (food, beverages, tobacco), 17-18-19 (textile, leather, footwear products), 24 (chemicals) benefit much less, the manufacturing sectors 30 (office, accounting, computing machinery) and 35 (ships, aircraft, railroad equipment) benefit less from exports from the manufacturing sector in Austria when compared to the OECD-23.
Comparing the benefits of the service sector between Austria and the OECD-23 leads to the following conclusions: In Austria a higher share of manufacturing exports induced value added goes to the sectors 60 (land transport), 65-66-67 (finance and insurance), 71 (renting of machinery and equipment) while a lower share remains in the sectors 50-51-52 (wholesale, retail sale), 64 (post and telecommunications) and 74 (other business activities).
In the following we pick three Austrian sectors which are among the sectors with the highest export shares according to table 4.2, namely the manufacturing sectors 34 (motor vehicles, parts) and 32 (radio, television, communication products) and the service sector 55 (hotels and restaurants). For each of these sectors’ exports we conduct impact analysis by assuming exports from each of these sectors only. The results for Austria are then compared to the results of the OECD-23.
First we analyze the effects of exports from sector 34 (motor vehicles), which is the sector with the highest share in total exports in Austria as well as in the OECD-23. While figure 4.8 accounts for direct and indirect value added effects, figure 4.9 shows value added due to indirect effects only. Not very surprisingly, in Austria and in the OECD-23 sector 34 benefits most from its own exports; in Austria, however, a much larger amount of value added remains in the own sector than in the OECD-23. This can be explained by the direct effects.
Figure 4.9 reveals that in Austria exports from sector 34 have the most significant indirect effects on the sectors 50-51-52 (wholesale, retail sale), 65-66-67 (finance and insurance) and 74 (other business activities) - this is consistent with the OECD-23. These three sectors are also the most important service sectors for manufacturing exports as a whole. Comparing Austria to the OECD-23 one notices that beside the exporting sector 34 almost all other manufacturing sectors in the OECD-23 benefit more in terms of value added while Austria is ahead only with respect to the manufacturing sector 29. Considering the effects on the service sectors we see that in the OECD-23 more value added is generated in the service sectors 50-51-52 (wholesale and retail sale) and 74 (other business services) when compared to Austria; on the other hand in Austria sector 65-66-67 (finance and insurance) accounts for a higher share in value added than in the OECD – the before mentioned caveat concerning the treatment of FISIM should, however, not be forgotten.
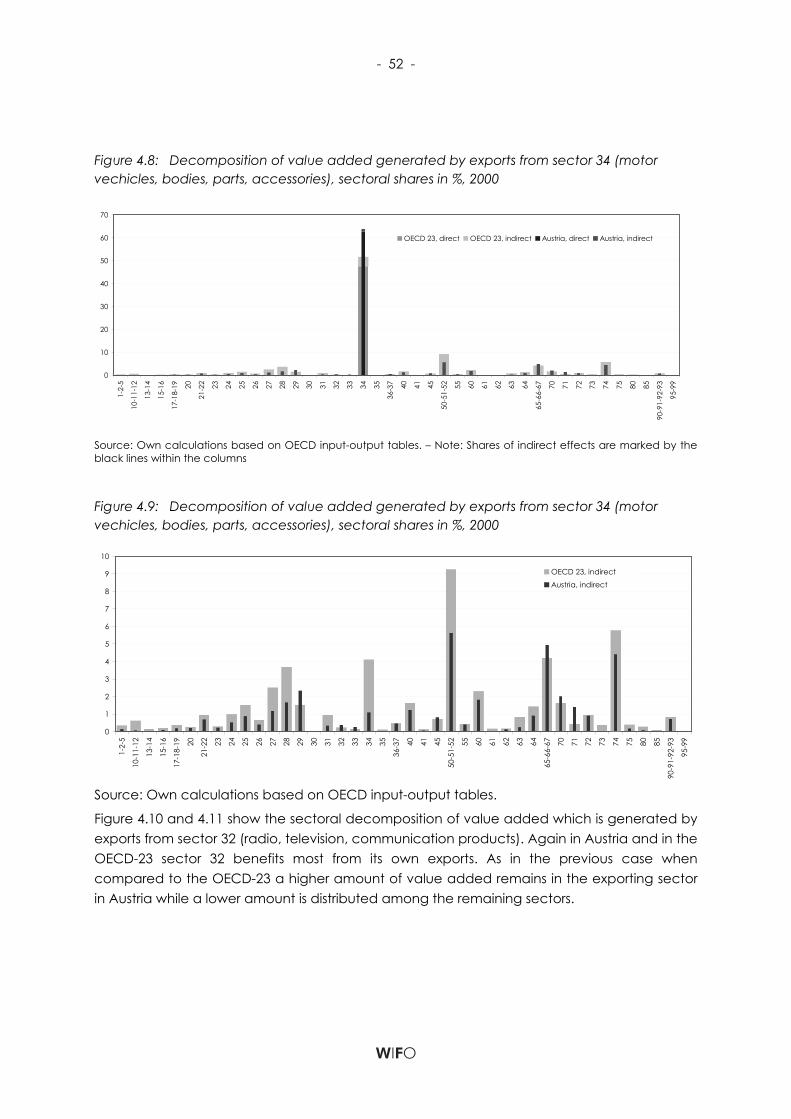
- 52 -
Figure 4.8: Decomposition of value added generated by exports from sector 34 (motor vechicles, bodies, parts, accessories), sectoral shares in %, 2000
0
10
20
30
40
50
60
70
1-2-
5
10-1
1-12
13-1
4
15-1
6
17-1
8-19 20
21-2
2 23 24 25 26 27 28 29 30 31 32 33 34 35
36-3
7 40 41 45
50-5
1-52 55 60 61 62 63 64
65-6
6-67 70 71 72 73 74 75 80 85
90-9
1-92
-93
95-9
9
OECD 23, direct OECD 23, indirect Austria, direct Austria, indirect
Source: Own calculations based on OECD input-output tables. – Note: Shares of indirect effects are marked by the black lines within the columns
Figure 4.9: Decomposition of value added generated by exports from sector 34 (motor vechicles, bodies, parts, accessories), sectoral shares in %, 2000
0
1
2
3
4
5
6
7
8
9
10
1-2-
5
10-1
1-12
13-1
4
15-1
6
17-1
8-19 20
21-2
2 23 24 25 26 27 28 29 30 31 32 33 34 35
36-3
7 40 41 45
50-5
1-52 55 60 61 62 63 64
65-6
6-67 70 71 72 73 74 75 80 85
90-9
1-92
-93
95-9
9
OECD 23, indirect
Austria, indirect
Source: Own calculations based on OECD input-output tables.
Figure 4.10 and 4.11 show the sectoral decomposition of value added which is generated by exports from sector 32 (radio, television, communication products). Again in Austria and in the OECD-23 sector 32 benefits most from its own exports. As in the previous case when compared to the OECD-23 a higher amount of value added remains in the exporting sector in Austria while a lower amount is distributed among the remaining sectors.
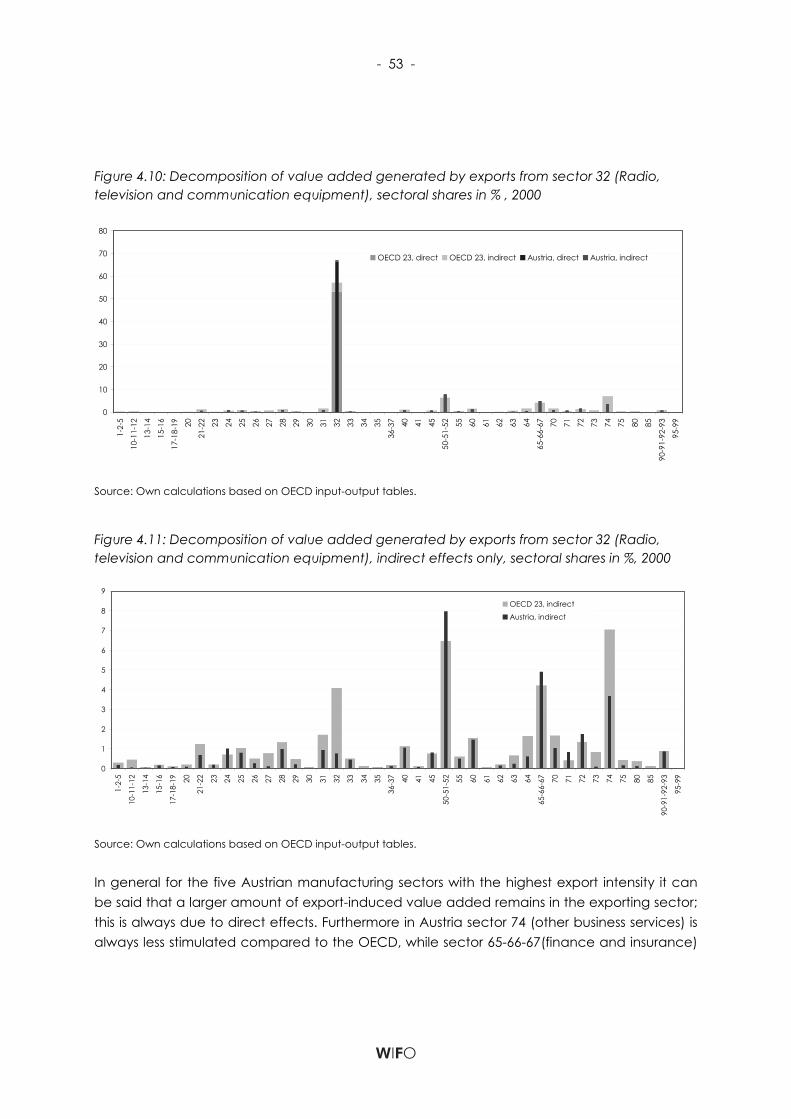
- 53 -
Figure 4.10: Decomposition of value added generated by exports from sector 32 (Radio, television and communication equipment), sectoral shares in % , 2000
0
10
20
30
40
50
60
70
80
1-2-
5
10-1
1-12
13-1
4
15-1
6
17-1
8-19 20
21-2
2 23 24 25 26 27 28 29 30 31 32 33 34 35
36-3
7 40 41 45
50-5
1-52 55 60 61 62 63 64
65-6
6-67 70 71 72 73 74 75 80 85
90-9
1-92
-93
95-9
9
OECD 23, direct OECD 23, indirect Austria, direct Austria, indirect
Source: Own calculations based on OECD input-output tables.
Figure 4.11: Decomposition of value added generated by exports from sector 32 (Radio, television and communication equipment), indirect effects only, sectoral shares in %, 2000
0
1
2
3
4
5
6
7
8
9
1-2-
5
10-1
1-12
13-1
4
15-1
6
17-1
8-19 20
21-2
2 23 24 25 26 27 28 29 30 31 32 33 34 35
36-3
7 40 41 45
50-5
1-52 55 60 61 62 63 64
65-6
6-67 70 71 72 73 74 75 80 85
90-9
1-92
-93
95-9
9
OECD 23, indirect
Austria, indirect
Source: Own calculations based on OECD input-output tables.
In general for the five Austrian manufacturing sectors with the highest export intensity it can be said that a larger amount of export-induced value added remains in the exporting sector; this is always due to direct effects. Furthermore in Austria sector 74 (other business services) is always less stimulated compared to the OECD, while sector 65-66-67(finance and insurance)
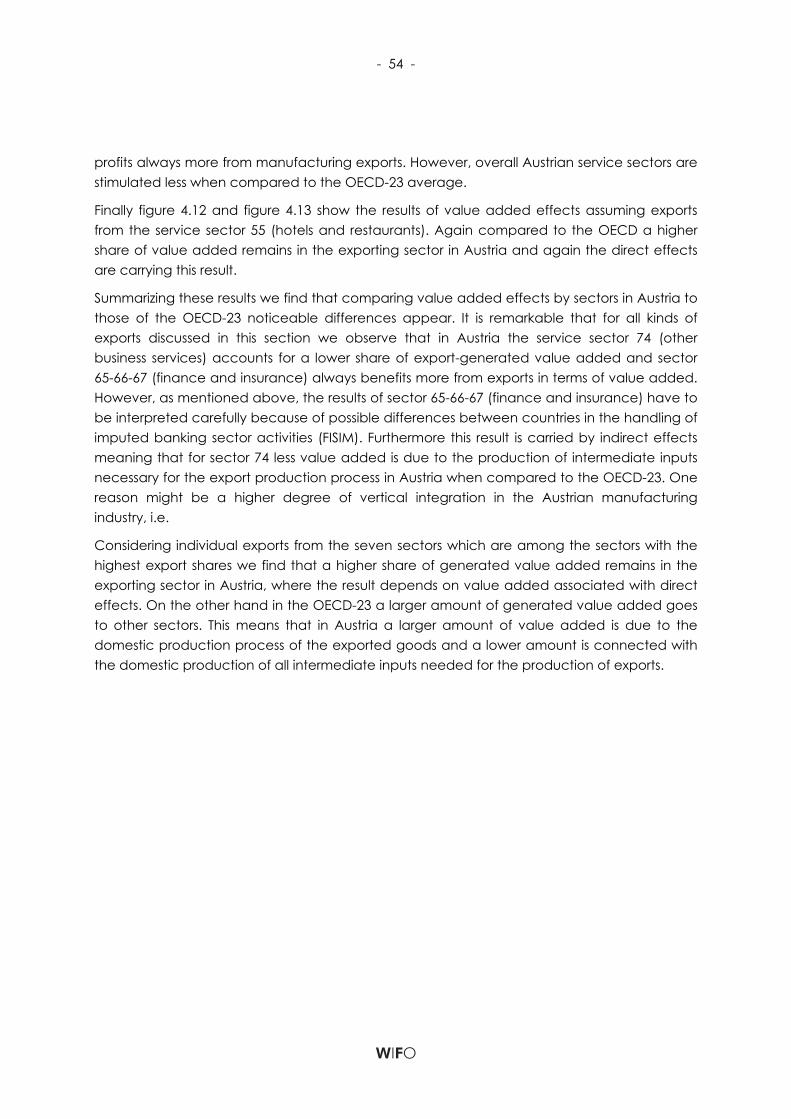
- 54 -
profits always more from manufacturing exports. However, overall Austrian service sectors are stimulated less when compared to the OECD-23 average.
Finally figure 4.12 and figure 4.13 show the results of value added effects assuming exports from the service sector 55 (hotels and restaurants). Again compared to the OECD a higher share of value added remains in the exporting sector in Austria and again the direct effects are carrying this result.
Summarizing these results we find that comparing value added effects by sectors in Austria to those of the OECD-23 noticeable differences appear. It is remarkable that for all kinds of exports discussed in this section we observe that in Austria the service sector 74 (other business services) accounts for a lower share of export-generated value added and sector 65-66-67 (finance and insurance) always benefits more from exports in terms of value added. However, as mentioned above, the results of sector 65-66-67 (finance and insurance) have to be interpreted carefully because of possible differences between countries in the handling of imputed banking sector activities (FISIM). Furthermore this result is carried by indirect effects meaning that for sector 74 less value added is due to the production of intermediate inputs necessary for the export production process in Austria when compared to the OECD-23. One reason might be a higher degree of vertical integration in the Austrian manufacturing industry, i.e.
Considering individual exports from the seven sectors which are among the sectors with the highest export shares we find that a higher share of generated value added remains in the exporting sector in Austria, where the result depends on value added associated with direct effects. On the other hand in the OECD-23 a larger amount of generated value added goes to other sectors. This means that in Austria a larger amount of value added is due to the domestic production process of the exported goods and a lower amount is connected with the domestic production of all intermediate inputs needed for the production of exports.
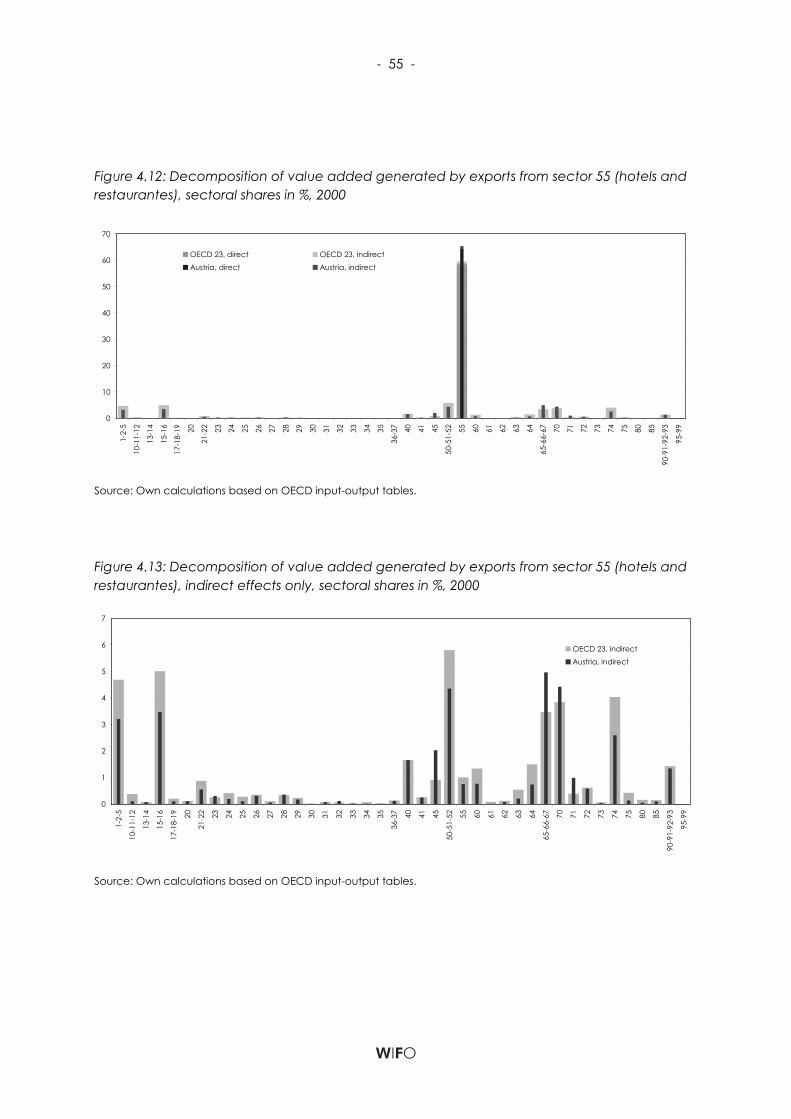
- 55 -
Figure 4.12: Decomposition of value added generated by exports from sector 55 (hotels and restaurantes), sectoral shares in %, 2000
0
10
20
30
40
50
60
70
1-2-
5
10-1
1-12
13-1
4
15-1
6
17-1
8-19 20
21-2
2 23 24 25 26 27 28 29 30 31 32 33 34 35
36-3
7 40 41 45
50-5
1-52 55 60 61 62 63 64
65-6
6-67 70 71 72 73 74 75 80 85
90-9
1-92
-93
95-9
9
OECD 23, direct OECD 23, indirect
Austria, direct Austria, indirect
Source: Own calculations based on OECD input-output tables.
Figure 4.13: Decomposition of value added generated by exports from sector 55 (hotels and restaurantes), indirect effects only, sectoral shares in %, 2000
0
1
2
3
4
5
6
7
1-2-
5
10-1
1-12
13-1
4
15-1
6
17-1
8-19 20
21-2
2 23 24 25 26 27 28 29 30 31 32 33 34 35
36-3
7 40 41 45
50-5
1-52 55 60 61 62 63 64
65-6
6-67 70 71 72 73 74 75 80 85
90-9
1-92
-93
95-9
9
OECD 23, indirect
Austria, indirect
Source: Own calculations based on OECD input-output tables.
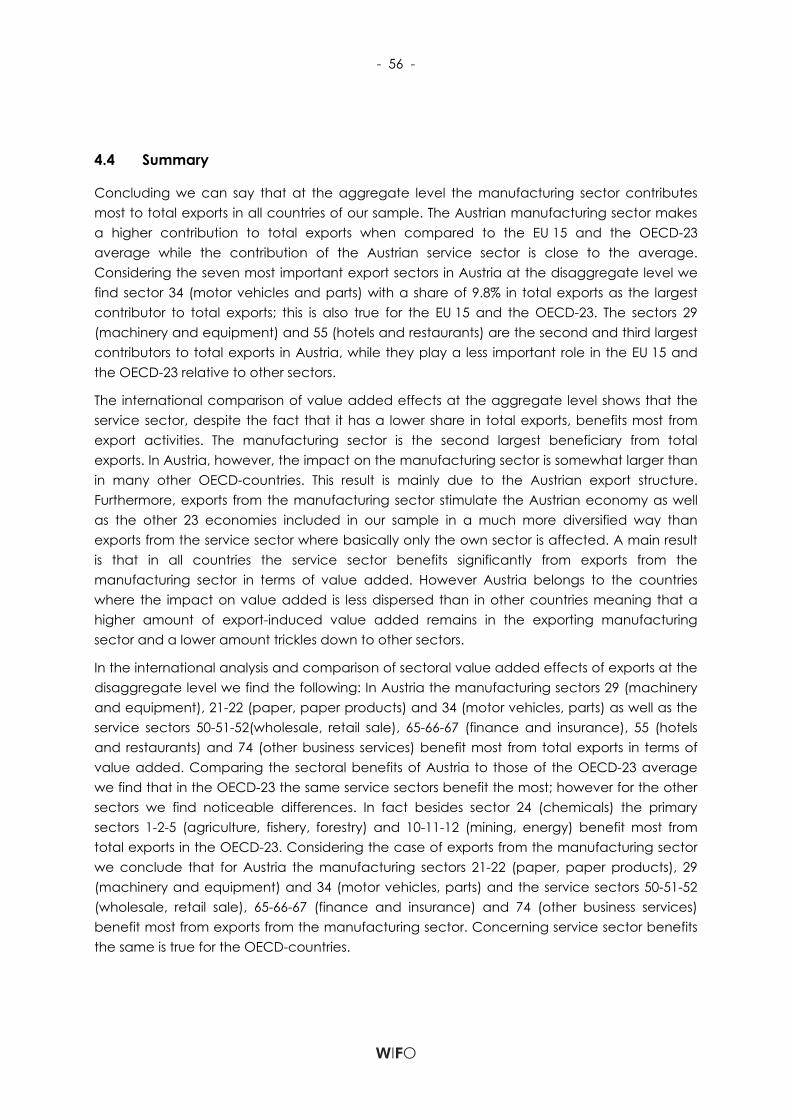
- 56 -
4.4 Summary
Concluding we can say that at the aggregate level the manufacturing sector contributes most to total exports in all countries of our sample. The Austrian manufacturing sector makes a higher contribution to total exports when compared to the EU 15 and the OECD-23 average while the contribution of the Austrian service sector is close to the average. Considering the seven most important export sectors in Austria at the disaggregate level we find sector 34 (motor vehicles and parts) with a share of 9.8% in total exports as the largest contributor to total exports; this is also true for the EU 15 and the OECD-23. The sectors 29 (machinery and equipment) and 55 (hotels and restaurants) are the second and third largest contributors to total exports in Austria, while they play a less important role in the EU 15 and the OECD-23 relative to other sectors.
The international comparison of value added effects at the aggregate level shows that the service sector, despite the fact that it has a lower share in total exports, benefits most from export activities. The manufacturing sector is the second largest beneficiary from total exports. In Austria, however, the impact on the manufacturing sector is somewhat larger than in many other OECD-countries. This result is mainly due to the Austrian export structure. Furthermore, exports from the manufacturing sector stimulate the Austrian economy as well as the other 23 economies included in our sample in a much more diversified way than exports from the service sector where basically only the own sector is affected. A main result is that in all countries the service sector benefits significantly from exports from the manufacturing sector in terms of value added. However Austria belongs to the countries where the impact on value added is less dispersed than in other countries meaning that a higher amount of export-induced value added remains in the exporting manufacturing sector and a lower amount trickles down to other sectors.
In the international analysis and comparison of sectoral value added effects of exports at the disaggregate level we find the following: In Austria the manufacturing sectors 29 (machinery and equipment), 21-22 (paper, paper products) and 34 (motor vehicles, parts) as well as the service sectors 50-51-52(wholesale, retail sale), 65-66-67 (finance and insurance), 55 (hotels and restaurants) and 74 (other business services) benefit most from total exports in terms of value added. Comparing the sectoral benefits of Austria to those of the OECD-23 average we find that in the OECD-23 the same service sectors benefit the most; however for the other sectors we find noticeable differences. In fact besides sector 24 (chemicals) the primary sectors 1-2-5 (agriculture, fishery, forestry) and 10-11-12 (mining, energy) benefit most from total exports in the OECD-23. Considering the case of exports from the manufacturing sector we conclude that for Austria the manufacturing sectors 21-22 (paper, paper products), 29 (machinery and equipment) and 34 (motor vehicles, parts) and the service sectors 50-51-52 (wholesale, retail sale), 65-66-67 (finance and insurance) and 74 (other business services) benefit most from exports from the manufacturing sector. Concerning service sector benefits the same is true for the OECD-countries.

- 57 -
The impact analysis of the Austrian manufacturing sectors with the highest shares in total exports implies another important result. Beside the exporting manufacturing sectors in Austria three service sectors benefit most from exports, namely sector 50-51-52 (wholesale, retail sale), 74(other business activities) and 65-66-67 (finance and insurance). With respect to the seven Austrian sector with the highest shares in total exports the service sector 74 (other business services) benefits partly by far less from each of these sectors’ exports in Austria when compared to the OECD-23; on the other hand sector 65-66-67 (finance and insurance) benefits always more in Austria. This result is also observed when considering exports from the entire manufacturing sector and the entire service sector as well as for individual exports from the service sector 55 (hotels and restaurants). However overall Austrian service sectors are stimulated less when compared to the OECD-23 average.
In Austria export induced value added remains to a higher degree in the exporting sector when compared to the EU 15 and OECD-23 average. This result holds for all seven Austrian sectors with the highest contribution to total exports. Furthermore at the aggregate level this result holds for the impact analysis of exports from the manufacturing sector as a whole. This means that in Austria other sectors besides the exporting sector itself are less stimulated in terms of value added. Especially service sectors do benefit less when considering considering exports from the manufacturing sector. This result indicates a lower degree of inter-sectoral linkages associated with manufacturing production processes in Austria.
Moreover we find that a larger amount of export-induced value added is due to direct effects in Austria when compared internationally, meaning that a larger amount of value added remains in the domestic production process of products to be exported and less value added goes to domestic producers providing intermediate inputs for the production process of products to be exported. This result might indicate a higher degree of vertical integration in the domestic production process of exports in Austria.5 This higher degree of vertical integration is linked to the lower degree of inter-sectoral linkages mentioned before.
These results suggest a lag in structural change when considering Austrian exports and their impacts on the economy in an international context. During the last years the international
5 In the entire analysis we do not take into account the import propensity of the production process of exports. It might be that the Austrian production process of exports relies on a larger amount of imports such that a relatively lower amount of export generated value added which is distributed domestically goes to domestic producers of intermediate inputs as we find it in our results. However when Austria is opposed to the EU-15 average we find qualitatively the same results as for the OECD 23 comparison. Since many other European economies are comparable to the Austrian in terms of their size, we can assume similar import propensities for the production of exports. Hence the conclusion of a higher degree of vertical integration in the Austrian domestic production process of exports is allowed to a certain degree.
- 58 -
trend goes towards vertical disintegration of domestic production and therefore a higher degree of inter-sectoral linkages in production processes. Vertical disintegration is based on lower fixed cost in the production processes. On the other hand the dependency on suppliers of intermediate inputs increases which bears a higher risk of possible shortfalls in supply, since the final producer has limited control over the performance of the supplier of intermediate inputs. In the medium and long run the performance of Austrian exports may suffer due to the higher degree of vertical integration in the domestic production process. The higher fixed costs associated with it could make Austrian exports relatively more expensive and hence unattractive in the world market. Policy makers should be aware of this fact. The challenge is to raise the exporting firm’s awareness for outsourcing.
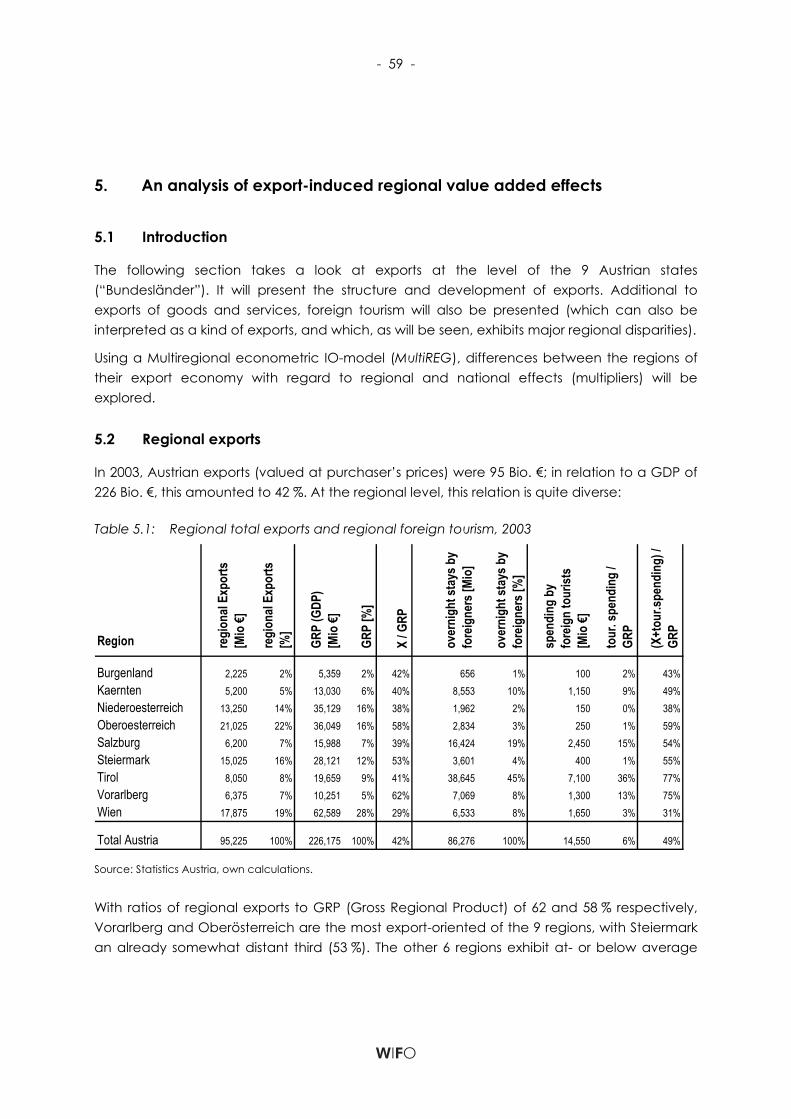
- 59 -
5. An analysis of export-induced regional value added effects
5.1 Introduction
The following section takes a look at exports at the level of the 9 Austrian states (“Bundesländer”). It will present the structure and development of exports. Additional to exports of goods and services, foreign tourism will also be presented (which can also be interpreted as a kind of exports, and which, as will be seen, exhibits major regional disparities).
Using a Multiregional econometric IO-model (MultiREG), differences between the regions of their export economy with regard to regional and national effects (multipliers) will be explored.
5.2 Regional exports
In 2003, Austrian exports (valued at purchaser’s prices) were 95 Bio. €; in relation to a GDP of 226 Bio. €, this amounted to 42 %. At the regional level, this relation is quite diverse:
Table 5.1: Regional total exports and regional foreign tourism, 2003
Region regi
onal
Expo
rts
[Mio
€]
regi
onal
Expo
rts
[%]
GRP
(GDP
) [M
io €]
GRP
[%]
X / G
RP
over
nigh
t sta
ys b
y fo
reig
ners
[Mio
]
over
nigh
t sta
ys b
y fo
reig
ners
[%]
spen
ding
by
fore
ign
tour
ists
[Mio
€]
tour
. spe
ndin
g /
GRP
(X+t
our.s
pend
ing)
/ GR
PBurgenland 2,225 2% 5,359 2% 42% 656 1% 100 2% 43%Kaernten 5,200 5% 13,030 6% 40% 8,553 10% 1,150 9% 49%Niederoesterreich 13,250 14% 35,129 16% 38% 1,962 2% 150 0% 38%Oberoesterreich 21,025 22% 36,049 16% 58% 2,834 3% 250 1% 59%Salzburg 6,200 7% 15,988 7% 39% 16,424 19% 2,450 15% 54%Steiermark 15,025 16% 28,121 12% 53% 3,601 4% 400 1% 55%Tirol 8,050 8% 19,659 9% 41% 38,645 45% 7,100 36% 77%Vorarlberg 6,375 7% 10,251 5% 62% 7,069 8% 1,300 13% 75%Wien 17,875 19% 62,589 28% 29% 6,533 8% 1,650 3% 31%
Total Austria 95,225 100% 226,175 100% 42% 86,276 100% 14,550 6% 49%
Source: Statistics Austria, own calculations.
With ratios of regional exports to GRP (Gross Regional Product) of 62 and 58 % respectively, Vorarlberg and Oberösterreich are the most export-oriented of the 9 regions, with Steiermark an already somewhat distant third (53 %). The other 6 regions exhibit at- or below average
- 60 -
export shares; at 29 %, Vienna has the lowest export-GRP ratio by far. This is not surprising: the metropolitan economy of Vienna is very service-oriented; as the political capital, it provides the bulk of public administration, it teaches the majority of university students. For (multi)national firms, it provides headquarter functions. Manufacturing, on the other hand, has decreased substantially in the last decades. As a result, in Vienna manufactured goods make up only 66 % of total exports, which– though still substantial – is far lower than in the other regions (81 % on average; see Table below).
With respect to foreign tourists, Tirol boasts almost half of all overnight stays (45 %), followed by Salzburg (19 %). With respect to (estimates of) spending by foreign tourists, Tirol’s share is even slightly higher (49 %). The result is that the ratio of spending by foreign tourists to GRP is 36 %. Combined exports and spending by foreign tourists amounts to a staggering 77 % in Tirol, which, however, is not far ahead of Vorarlberg’s 75 % (although in Vorarlberg, exports are much more important than in Tirol). On average, these “extended exports” (exports + spending by foreign tourists) amounts to 49 % of GDP.
Because of its size, Vienna’s 8 % share of overnight stays by foreign tourists translates into spending by foreign tourists amounting to some 3 % of GRP only; adding exports, their combined share is 31 %, the lowest of all Austrian regions by far.

- 61 -
Table 5.2: Regional export structures
commodity group (CPA-numbers) B K N O S ST T V W A
01-05 1% 1% 1% 0% 0% 1% 1% 0% 1% 1%10-14 0% 3% 0% 0% 0% 1% 0% 0% 0% 0%15-16 9% 4% 4% 4% 14% 2% 3% 9% 4% 5%17-19 2% 5% 9% 3% 3% 4% 4% 13% 0% 4%
20 2% 7% 4% 2% 7% 3% 8% 1% 0% 3%21 2% 3% 3% 4% 7% 9% 1% 2% 2% 4%22 8% 0% 2% 1% 7% 1% 3% 1% 1% 2%
23-24 4% 6% 16% 8% 1% 2% 17% 4% 10% 8%25 11% 2% 5% 4% 3% 1% 2% 4% 2% 3%26 0% 4% 2% 1% 1% 1% 8% 1% 2% 2%
27-28 4% 6% 12% 14% 5% 13% 9% 14% 1% 10%29 2% 21% 18% 13% 7% 13% 12% 11% 4% 11%
30-33 26% 21% 6% 6% 10% 13% 8% 12% 22% 12%34-35 10% 2% 3% 28% 11% 14% 6% 3% 16% 14%36-37 1% 2% 6% 4% 5% 1% 1% 6% 1% 3%40-41 0% 0% 0% 0% 2% 0% 3% 6% 4% 2%
45 2% 1% 0% 1% 1% 1% 2% 2% 1% 1%50-52 2% 2% 2% 1% 3% 1% 2% 1% 4% 2%
55 0% 0% 0% 0% 0% 0% 0% 0% 0% 0%60 12% 3% 3% 4% 3% 3% 4% 2% 1% 3%
61-62 0% 0% 0% 0% 0% 0% 0% 0% 1% 0%63 0% 1% 1% 1% 3% 1% 1% 2% 2% 1%64 0% 0% 0% 0% 0% 0% 1% 1% 3% 1%
65-67 1% 3% 1% 1% 2% 1% 2% 1% 12% 3%70-71 0% 0% 1% 0% 1% 0% 0% 0% 1% 1%
72 0% 0% 0% 0% 0% 0% 0% 0% 0% 0%73-74 0% 3% 1% 2% 3% 15% 1% 1% 3% 4%
75 0% 0% 0% 0% 0% 0% 0% 0% 0% 0%80 0% 0% 0% 0% 0% 0% 0% 0% 0% 0%85 0% 0% 0% 0% 0% 0% 0% 0% 0% 0%
90-91 0% 0% 0% 0% 0% 0% 0% 0% 0% 0%92-95 0% 0% 0% 0% 0% 1% 0% 0% 1% 0%
manufactured goods 81% 83% 90% 89% 81% 77% 83% 82% 66% 81%market services 16% 11% 9% 9% 16% 21% 11% 9% 28% 15%other goods & non-market services 3% 6% 1% 1% 3% 2% 6% 9% 6% 4%
Source: Statistics Austria, own calculations.
Vienna is clearly ahead of other regions as far as market services are concerned: 28 % of its exports fall in this category, as opposed to 15 % on average. Steiermark’s 21 % come a surprise, as Steiermark is normally regarded as one of the two “manufacturing regions” (beside Upper Austria). However, 15 % of Steiermark’s exports consist of commodities 73&74 (R&D, business-related services), a large share of which consists of automotive-oriented R&D .
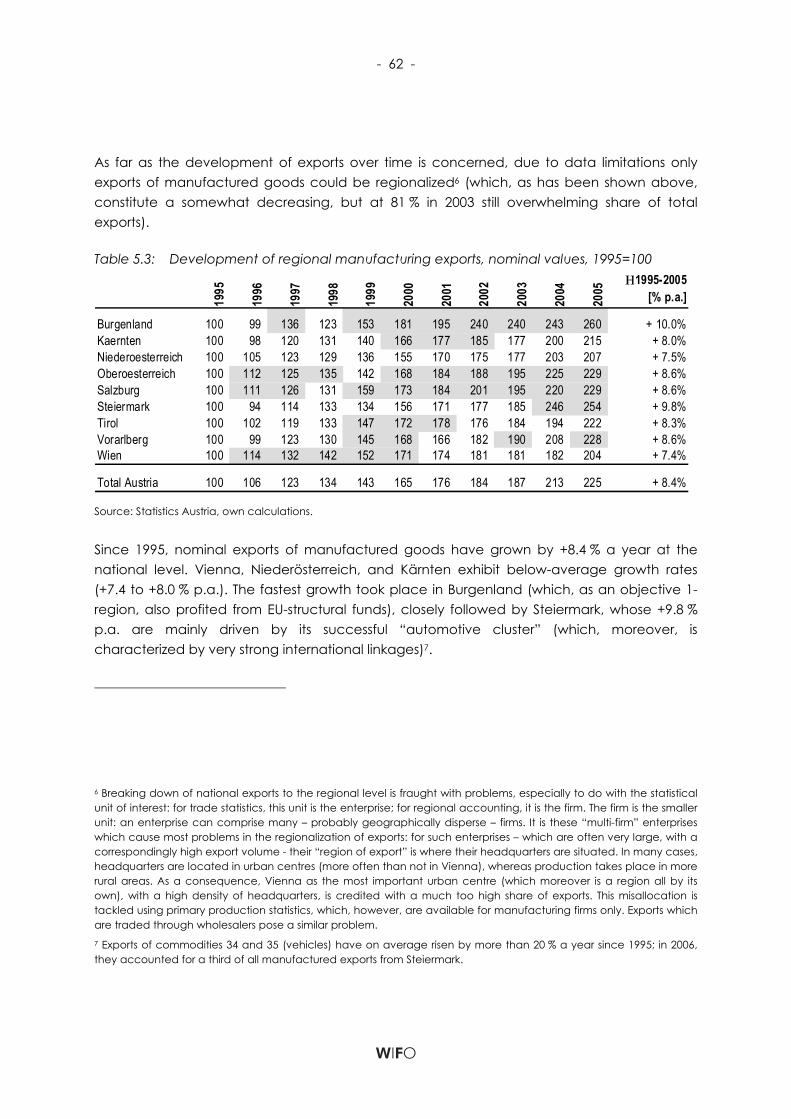
- 62 -
As far as the development of exports over time is concerned, due to data limitations only exports of manufactured goods could be regionalized6 (which, as has been shown above, constitute a somewhat decreasing, but at 81 % in 2003 still overwhelming share of total exports).
Table 5.3: Development of regional manufacturing exports, nominal values, 1995=100
1995
1996
1997
1998
1999
2000
2001
2002
2003
2004
2005
Η 1995-2005 [% p.a.]
Burgenland 100 99 136 123 153 181 195 240 240 243 260 + 10.0%Kaernten 100 98 120 131 140 166 177 185 177 200 215 + 8.0%Niederoesterreich 100 105 123 129 136 155 170 175 177 203 207 + 7.5%Oberoesterreich 100 112 125 135 142 168 184 188 195 225 229 + 8.6%Salzburg 100 111 126 131 159 173 184 201 195 220 229 + 8.6%Steiermark 100 94 114 133 134 156 171 177 185 246 254 + 9.8%Tirol 100 102 119 133 147 172 178 176 184 194 222 + 8.3%Vorarlberg 100 99 123 130 145 168 166 182 190 208 228 + 8.6%Wien 100 114 132 142 152 171 174 181 181 182 204 + 7.4%
Total Austria 100 106 123 134 143 165 176 184 187 213 225 + 8.4%
Source: Statistics Austria, own calculations.
Since 1995, nominal exports of manufactured goods have grown by +8.4 % a year at the national level. Vienna, Niederösterreich, and Kärnten exhibit below-average growth rates (+7.4 to +8.0 % p.a.). The fastest growth took place in Burgenland (which, as an objective 1-region, also profited from EU-structural funds), closely followed by Steiermark, whose +9.8 % p.a. are mainly driven by its successful “automotive cluster” (which, moreover, is characterized by very strong international linkages)7.
6 Breaking down of national exports to the regional level is fraught with problems, especially to do with the statistical unit of interest: for trade statistics, this unit is the enterprise; for regional accounting, it is the firm. The firm is the smaller unit: an enterprise can comprise many – probably geographically disperse – firms. It is these “multi-firm” enterprises which cause most problems in the regionalization of exports: for such enterprises – which are often very large, with a correspondingly high export volume - their “region of export” is where their headquarters are situated. In many cases, headquarters are located in urban centres (more often than not in Vienna), whereas production takes place in more rural areas. As a consequence, Vienna as the most important urban centre (which moreover is a region all by its own), with a high density of headquarters, is credited with a much too high share of exports. This misallocation is tackled using primary production statistics, which, however, are available for manufacturing firms only. Exports which are traded through wholesalers pose a similar problem. 7 Exports of commodities 34 and 35 (vehicles) have on average risen by more than 20 % a year since 1995; in 2006, they accounted for a third of all manufactured exports from Steiermark.
- 63 -
The next section introduces MultiREG, a multiregional econometric input-output model which is used to calculate regional export multipliers.
5.3 MultiREG
Since Austria is a rather small country and its economy thus very open, attempts to move from the national to a regional level of macroeconomic modeling are not only hampered by severe data restrictions but also by the fact that Austrian regions are characterized by an extremely high degree of openness. This limits the usefulness of single region models since economic impacts from changes in economic policy or public investment projects mostly emerge not within the region where these policies or projects are implemented but in other Austrian regions. In addition single region models are often top-down-type models where changes in regional economic activity (employment, output, consumption etc.) are derived from changes in the corresponding national variables. In modeling larger regions, e.g. the metropolitan region of Vienna, which accounts for almost 20% of the Austrian population, simultaneity thus becomes more and more problematic. Therefore, after having completed two single region models for the provinces of Styria and Upper Austria (Fritz et al., 2001; Zakarias et al., 2002), an attempt to bring all nine Austrian provinces into one Multiregional model was undertaken.
MultiREG integrates two model types, econometric models and input-output models, at the multiregional scale; a first and preliminary version has just been completed and is now undergoing extensive testing. The aim of building an integrated model is to benefit from the advantages of either model type and remedy their respective shortcomings. Integrating econometric and input-output models draws its motivation both from theoretical as well as practical aspects (Rey, 2000): for instance, instead of applying the linear production technology assumption of the standard input-output model, more flexible production functions may be estimated and included in integrated models. Similarly, instead of assuming final demand to be exogenous as is often the case in a pure input-output framework a more theoretically sound treatment of private consumption, investment etc. can be achieved when an econometric modeling approach is applied. A high degree of industrial disaggregation (MultiREG comprises 32 industries, see also the Appendix), on the other hand, is often put forward as one of the main advantages of input-output models; this becomes especially important when the model is to be applied for impact analysis.
While the single-region models for Styria and Upper Austria were built very much in the tradition of Conway’s integrated regional econometric input-output model (Conway, 1990), the modeling approach taken in MultiREG is closer to the one implemented in MULTIMAC (Kratena, 1994; Kratena and Zakarias, 2001), which in turn was developed along the lines of the INFORUM model family (Almon, 1991) and the European Multiregional model E3ME (Barker et al., 1999). This implies that compared to its predecessors MultiREG not only replaces the single-region framework with a Multiregional setting but relies to a much greater extent on
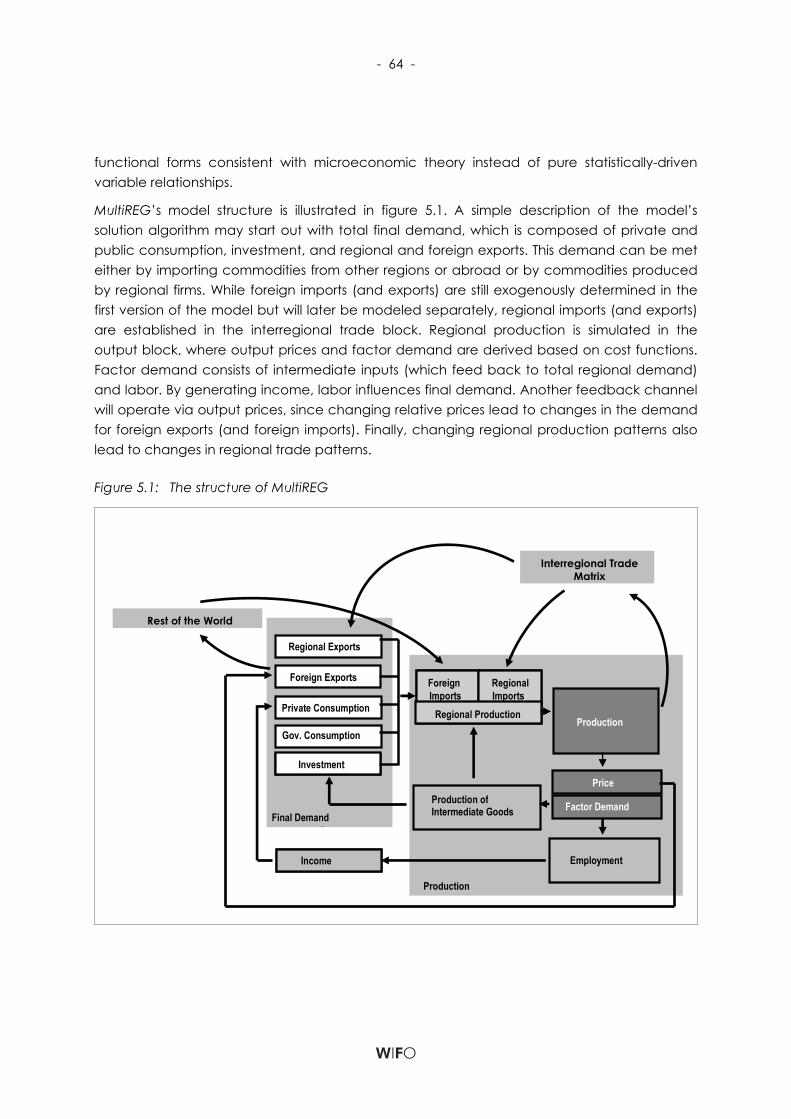
- 64 -
functional forms consistent with microeconomic theory instead of pure statistically-driven variable relationships.
MultiREG’s model structure is illustrated in figure 5.1. A simple description of the model’s solution algorithm may start out with total final demand, which is composed of private and public consumption, investment, and regional and foreign exports. This demand can be met either by importing commodities from other regions or abroad or by commodities produced by regional firms. While foreign imports (and exports) are still exogenously determined in the first version of the model but will later be modeled separately, regional imports (and exports) are established in the interregional trade block. Regional production is simulated in the output block, where output prices and factor demand are derived based on cost functions. Factor demand consists of intermediate inputs (which feed back to total regional demand) and labor. By generating income, labor influences final demand. Another feedback channel will operate via output prices, since changing relative prices lead to changes in the demand for foreign exports (and foreign imports). Finally, changing regional production patterns also lead to changes in regional trade patterns.
Figure 5.1: The structure of MultiREG
Production
Factor Demand
Price
Production
Production ofIntermediate Goods
Employment EinkommenIncome
Auslandsexporte
Privater Konsum
Öffentl . Konsum
InvestitionenInvestitionen
Endnachfrage
Regionalexporte
Regional Exports
Private Consumption
Gov. Consumption
InvestitionenInvestment
Final Demand
Foreign Exports Auslands-importe
Regional-importe
Regionale Produktion
ForeignImports
RegionalImports
Regional Production
Rest of the World
Interregional Trade Matrix
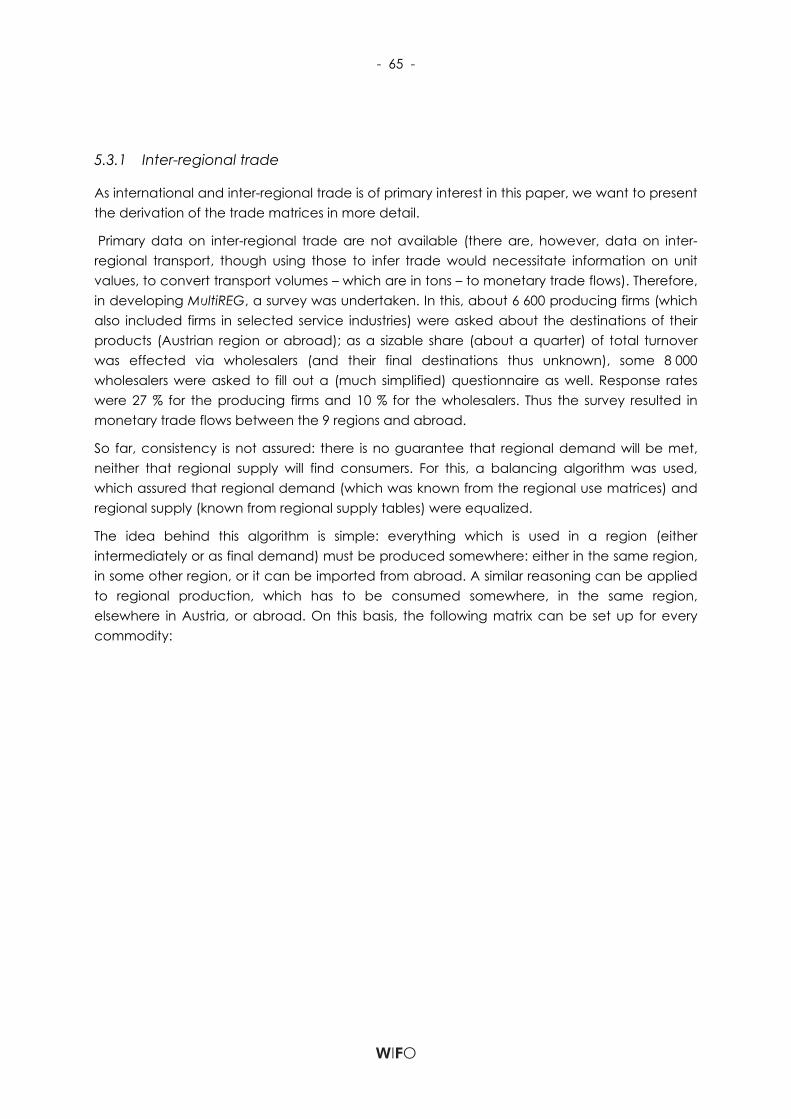
- 65 -
5.3.1 Inter-regional trade
As international and inter-regional trade is of primary interest in this paper, we want to present the derivation of the trade matrices in more detail.
Primary data on inter-regional trade are not available (there are, however, data on inter-regional transport, though using those to infer trade would necessitate information on unit values, to convert transport volumes – which are in tons – to monetary trade flows). Therefore, in developing MultiREG, a survey was undertaken. In this, about 6 600 producing firms (which also included firms in selected service industries) were asked about the destinations of their products (Austrian region or abroad); as a sizable share (about a quarter) of total turnover was effected via wholesalers (and their final destinations thus unknown), some 8 000 wholesalers were asked to fill out a (much simplified) questionnaire as well. Response rates were 27 % for the producing firms and 10 % for the wholesalers. Thus the survey resulted in monetary trade flows between the 9 regions and abroad.
So far, consistency is not assured: there is no guarantee that regional demand will be met, neither that regional supply will find consumers. For this, a balancing algorithm was used, which assured that regional demand (which was known from the regional use matrices) and regional supply (known from regional supply tables) were equalized.
The idea behind this algorithm is simple: everything which is used in a region (either intermediately or as final demand) must be produced somewhere: either in the same region, in some other region, or it can be imported from abroad. A similar reasoning can be applied to regional production, which has to be consumed somewhere, in the same region, elsewhere in Austria, or abroad. On this basis, the following matrix can be set up for every commodity:
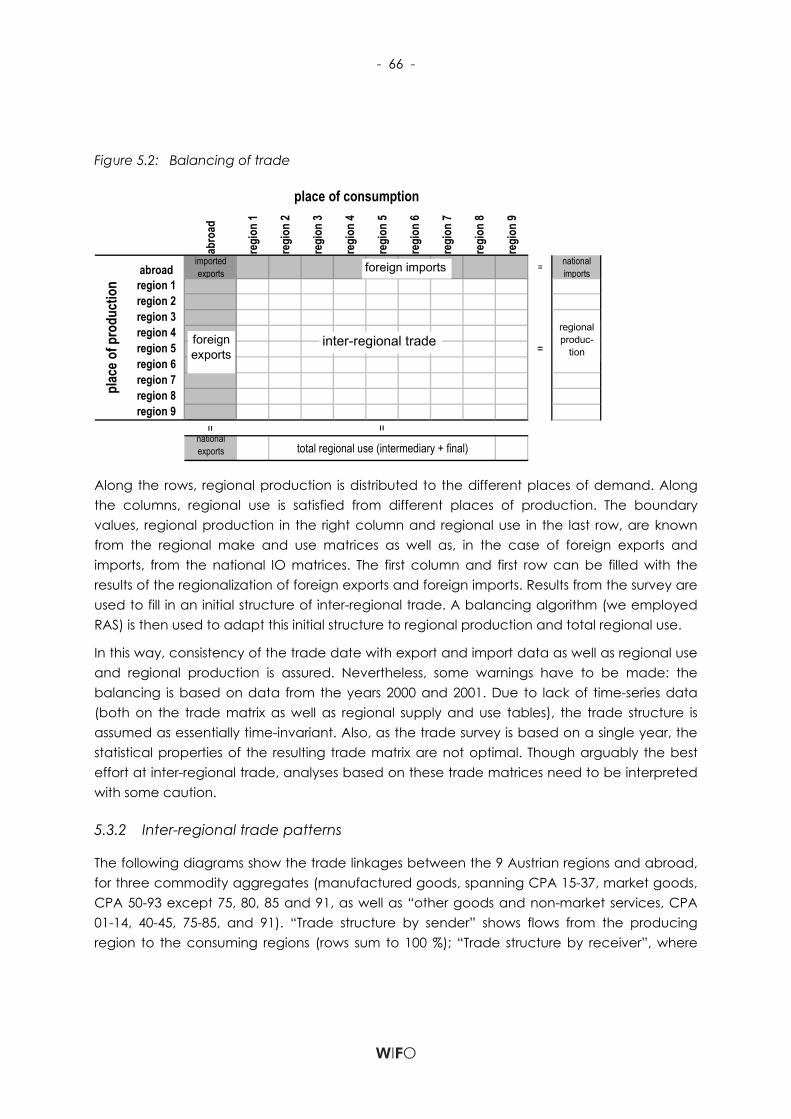
- 66 -
Figure 5.2: Balancing of trade
abro
ad
regi
on 1
regi
on 2
regi
on 3
regi
on 4
regi
on 5
regi
on 6
regi
on 7
regi
on 8
regi
on 9
abroadimported exports = national
importsregion 1region 2region 3region 4region 5region 6region 7region 8region 9
=
national exports total regional use (intermediary + final)
plac
e of p
rodu
ctio
n
place of consumption
=
=inter-regional tradeforeign exports
foreign imports
regional produc-
tion
Along the rows, regional production is distributed to the different places of demand. Along the columns, regional use is satisfied from different places of production. The boundary values, regional production in the right column and regional use in the last row, are known from the regional make and use matrices as well as, in the case of foreign exports and imports, from the national IO matrices. The first column and first row can be filled with the results of the regionalization of foreign exports and foreign imports. Results from the survey are used to fill in an initial structure of inter-regional trade. A balancing algorithm (we employed RAS) is then used to adapt this initial structure to regional production and total regional use.
In this way, consistency of the trade date with export and import data as well as regional use and regional production is assured. Nevertheless, some warnings have to be made: the balancing is based on data from the years 2000 and 2001. Due to lack of time-series data (both on the trade matrix as well as regional supply and use tables), the trade structure is assumed as essentially time-invariant. Also, as the trade survey is based on a single year, the statistical properties of the resulting trade matrix are not optimal. Though arguably the best effort at inter-regional trade, analyses based on these trade matrices need to be interpreted with some caution.
5.3.2 Inter-regional trade patterns
The following diagrams show the trade linkages between the 9 Austrian regions and abroad, for three commodity aggregates (manufactured goods, spanning CPA 15-37, market goods, CPA 50-93 except 75, 80, 85 and 91, as well as “other goods and non-market services, CPA 01-14, 40-45, 75-85, and 91). “Trade structure by sender” shows flows from the producing region to the consuming regions (rows sum to 100 %); “Trade structure by receiver”, where
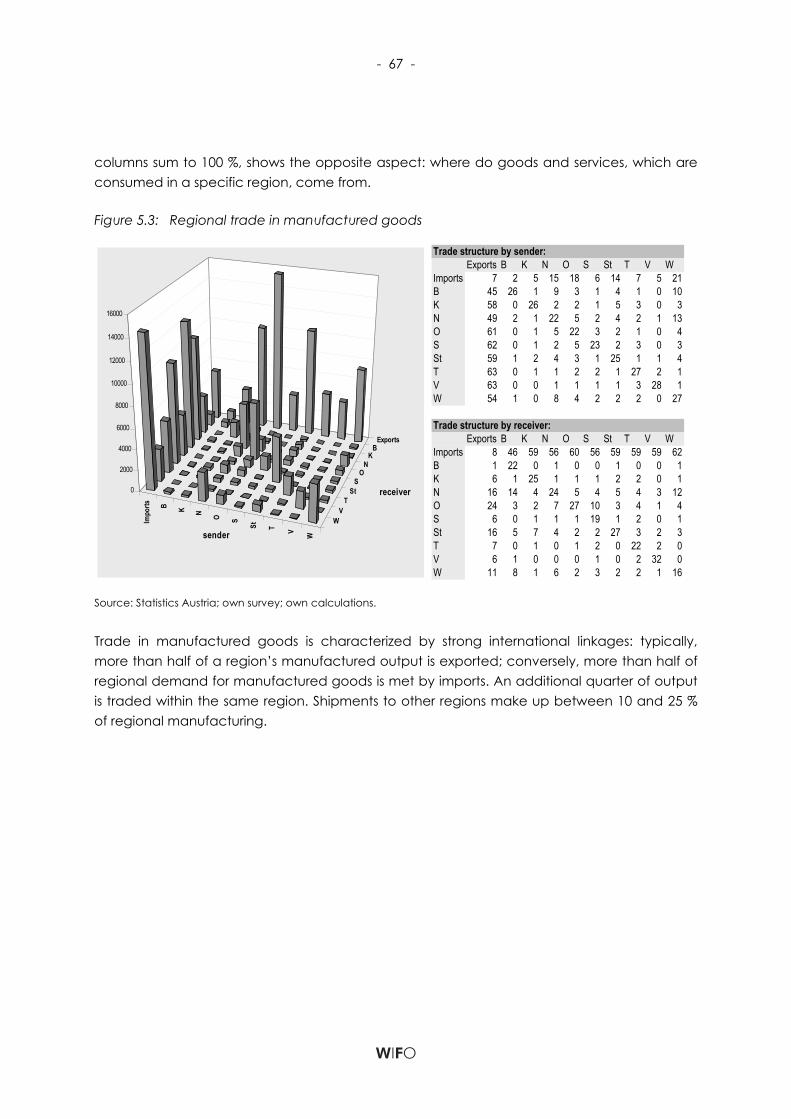
- 67 -
columns sum to 100 %, shows the opposite aspect: where do goods and services, which are consumed in a specific region, come from.
Figure 5.3: Regional trade in manufactured goods
Impo
rts B K N O S
St T V W
ExportsB
KN
OS
StT
VW
0
2000
4000
6000
8000
10000
12000
14000
16000
sender
receiver
Trade structure by sender:Exports B K N O S St T V W
Imports 7 2 5 15 18 6 14 7 5 21B 45 26 1 9 3 1 4 1 0 10K 58 0 26 2 2 1 5 3 0 3N 49 2 1 22 5 2 4 2 1 13O 61 0 1 5 22 3 2 1 0 4S 62 0 1 2 5 23 2 3 0 3St 59 1 2 4 3 1 25 1 1 4T 63 0 1 1 2 2 1 27 2 1V 63 0 0 1 1 1 1 3 28 1W 54 1 0 8 4 2 2 2 0 27
Trade structure by receiver:Exports B K N O S St T V W
Imports 8 46 59 56 60 56 59 59 59 62B 1 22 0 1 0 0 1 0 0 1K 6 1 25 1 1 1 2 2 0 1N 16 14 4 24 5 4 5 4 3 12O 24 3 2 7 27 10 3 4 1 4S 6 0 1 1 1 19 1 2 0 1St 16 5 7 4 2 2 27 3 2 3T 7 0 1 0 1 2 0 22 2 0V 6 1 0 0 0 1 0 2 32 0W 11 8 1 6 2 3 2 2 1 16
Source: Statistics Austria; own survey; own calculations.
Trade in manufactured goods is characterized by strong international linkages: typically, more than half of a region’s manufactured output is exported; conversely, more than half of regional demand for manufactured goods is met by imports. An additional quarter of output is traded within the same region. Shipments to other regions make up between 10 and 25 % of regional manufacturing.
- 68 -
Figure 5.4: Regional trade in market services Im
ports B K N O S
St T V W
ExportsB
KN
OS
StT
VW
0
5000
10000
15000
20000
25000
30000
sender
receiver
Trade structure by sender:Exports B K N O S St T V W
Imports 0 1 3 14 11 8 7 8 3 45B 13 38 3 11 4 3 9 4 2 12K 11 1 51 5 4 4 10 7 1 6N 9 2 3 56 6 3 4 3 1 13O 10 1 2 7 61 5 5 3 1 5S 10 1 4 5 9 48 6 6 1 8St 8 1 3 5 4 3 63 4 1 8T 12 1 4 4 4 5 4 56 3 6V 12 1 2 3 3 2 2 13 58 4W 12 2 3 10 8 4 6 4 2 49
Trade structure by receiver:Exports B K N O S St T V W
Imports 0 2 3 5 5 6 3 5 4 10B 2 31 1 1 1 1 1 1 1 1K 5 2 46 2 2 3 4 4 2 1N 12 14 8 54 6 5 5 5 5 7O 12 4 4 6 55 9 5 4 4 3S 8 5 5 3 5 50 4 5 3 3St 7 6 6 3 3 3 54 4 4 3T 10 4 6 3 3 6 3 52 7 2V 4 1 1 1 1 1 1 5 54 1W 39 31 20 23 21 16 19 15 17 69
Source: Statistics Austria; own survey; own calculations.
Not surprisingly, international trade in market services is much less important: only about 7 % of domestic demand is met by imported services. The export share is higher: on average, about 12 % of market services are exported. This trade surplus in market services compensates the deficits in manufactured goods as well as in other goods and services.
All in all, market services are much localized: between 40 and 60 % of regional demand is provided locally. As far as inter-regional trade is concerned, a strong “Vienna-bias” can be observed: between 15 % and a quarter of regional demand for market services is provided by firms located in Vienna.
These results, however, have to be taken with some caution: whereas the trade linkages manufactured goods can be viewed as reasonably well supported by data, trade linkages for services are more dependent on assumptions – apart from the fact that by definition, some services cannot be traded at all (like retail sales, which are recorded at the seller’s region), which has implications mainly for the derivation of regional make and use matrices, but also for their inter-regional exchange. Less contentious are their inter-national linkages, as national values for imports and exports can be extracted from the official make-use tables for Austria.
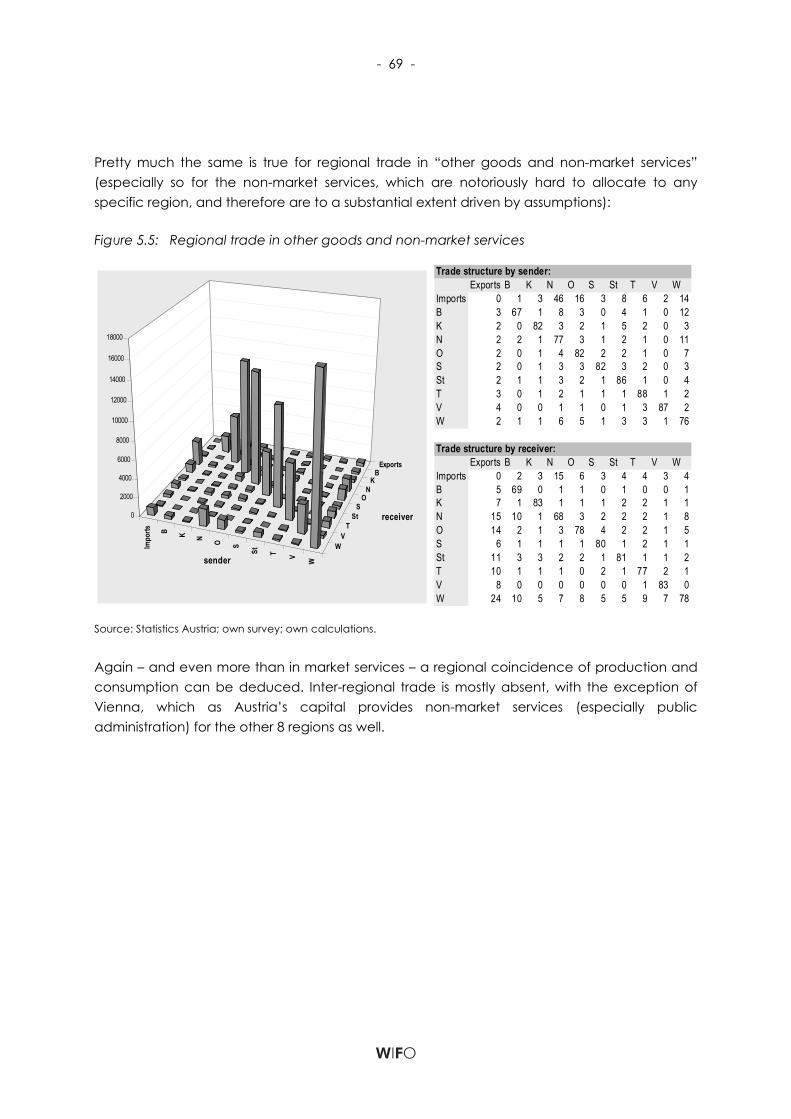
- 69 -
Pretty much the same is true for regional trade in “other goods and non-market services” (especially so for the non-market services, which are notoriously hard to allocate to any specific region, and therefore are to a substantial extent driven by assumptions):
Figure 5.5: Regional trade in other goods and non-market services
Impo
rts B K N O S
St T V W
ExportsB
KN
OS
StT
VW
0
2000
4000
6000
8000
10000
12000
14000
16000
18000
sender
receiver
Trade structure by sender:Exports B K N O S St T V W
Imports 0 1 3 46 16 3 8 6 2 14B 3 67 1 8 3 0 4 1 0 12K 2 0 82 3 2 1 5 2 0 3N 2 2 1 77 3 1 2 1 0 11O 2 0 1 4 82 2 2 1 0 7S 2 0 1 3 3 82 3 2 0 3St 2 1 1 3 2 1 86 1 0 4T 3 0 1 2 1 1 1 88 1 2V 4 0 0 1 1 0 1 3 87 2W 2 1 1 6 5 1 3 3 1 76
Trade structure by receiver:Exports B K N O S St T V W
Imports 0 2 3 15 6 3 4 4 3 4B 5 69 0 1 1 0 1 0 0 1K 7 1 83 1 1 1 2 2 1 1N 15 10 1 68 3 2 2 2 1 8O 14 2 1 3 78 4 2 2 1 5S 6 1 1 1 1 80 1 2 1 1St 11 3 3 2 2 1 81 1 1 2T 10 1 1 1 0 2 1 77 2 1V 8 0 0 0 0 0 0 1 83 0W 24 10 5 7 8 5 5 9 7 78
Source: Statistics Austria; own survey; own calculations.
Again – and even more than in market services – a regional coincidence of production and consumption can be deduced. Inter-regional trade is mostly absent, with the exception of Vienna, which as Austria’s capital provides non-market services (especially public administration) for the other 8 regions as well.
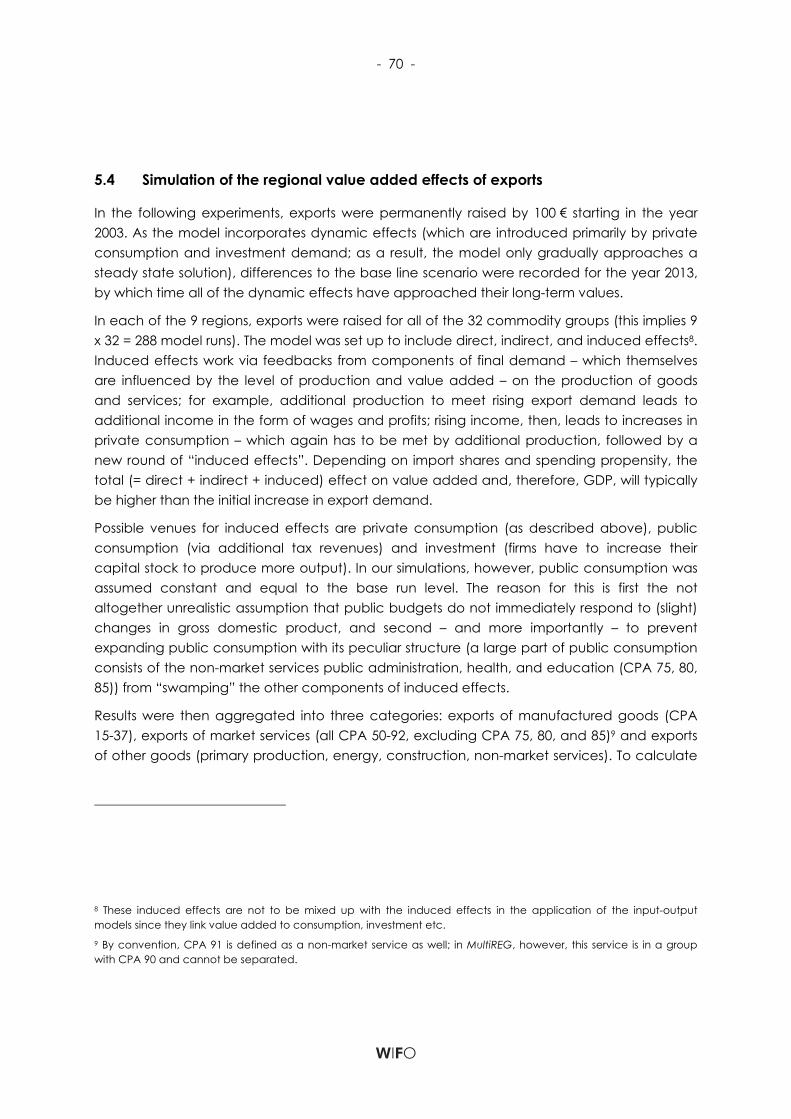
- 70 -
5.4 Simulation of the regional value added effects of exports
In the following experiments, exports were permanently raised by 100 € starting in the year 2003. As the model incorporates dynamic effects (which are introduced primarily by private consumption and investment demand; as a result, the model only gradually approaches a steady state solution), differences to the base line scenario were recorded for the year 2013, by which time all of the dynamic effects have approached their long-term values.
In each of the 9 regions, exports were raised for all of the 32 commodity groups (this implies 9 x 32 = 288 model runs). The model was set up to include direct, indirect, and induced effects8. Induced effects work via feedbacks from components of final demand – which themselves are influenced by the level of production and value added – on the production of goods and services; for example, additional production to meet rising export demand leads to additional income in the form of wages and profits; rising income, then, leads to increases in private consumption – which again has to be met by additional production, followed by a new round of “induced effects”. Depending on import shares and spending propensity, the total (= direct + indirect + induced) effect on value added and, therefore, GDP, will typically be higher than the initial increase in export demand.
Possible venues for induced effects are private consumption (as described above), public consumption (via additional tax revenues) and investment (firms have to increase their capital stock to produce more output). In our simulations, however, public consumption was assumed constant and equal to the base run level. The reason for this is first the not altogether unrealistic assumption that public budgets do not immediately respond to (slight) changes in gross domestic product, and second – and more importantly – to prevent expanding public consumption with its peculiar structure (a large part of public consumption consists of the non-market services public administration, health, and education (CPA 75, 80, 85)) from “swamping” the other components of induced effects.
Results were then aggregated into three categories: exports of manufactured goods (CPA 15-37), exports of market services (all CPA 50-92, excluding CPA 75, 80, and 85)9 and exports of other goods (primary production, energy, construction, non-market services). To calculate
8 These induced effects are not to be mixed up with the induced effects in the application of the input-output models since they link value added to consumption, investment etc. 9 By convention, CPA 91 is defined as a non-market service as well; in MultiREG, however, this service is in a group with CPA 90 and cannot be separated.
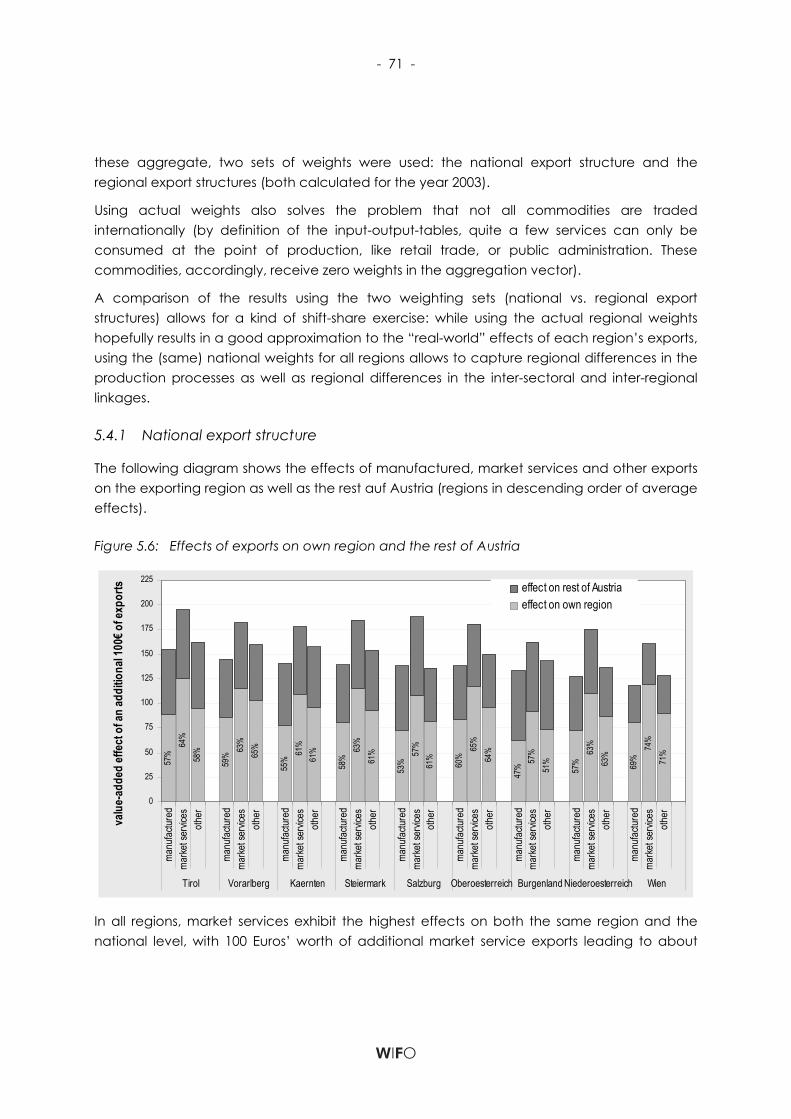
- 71 -
these aggregate, two sets of weights were used: the national export structure and the regional export structures (both calculated for the year 2003).
Using actual weights also solves the problem that not all commodities are traded internationally (by definition of the input-output-tables, quite a few services can only be consumed at the point of production, like retail trade, or public administration. These commodities, accordingly, receive zero weights in the aggregation vector).
A comparison of the results using the two weighting sets (national vs. regional export structures) allows for a kind of shift-share exercise: while using the actual regional weights hopefully results in a good approximation to the “real-world” effects of each region’s exports, using the (same) national weights for all regions allows to capture regional differences in the production processes as well as regional differences in the inter-sectoral and inter-regional linkages.
5.4.1 National export structure
The following diagram shows the effects of manufactured, market services and other exports on the exporting region as well as the rest auf Austria (regions in descending order of average effects).
Figure 5.6: Effects of exports on own region and the rest of Austria
57%
64%
58%
59%
63%
65%
55%
61%
61%
58%
63%
61%
53%
57%
61%
60%
65%
64%
47%
57%
51%
57%
63%
63%
69%
74%
71%
0
25
50
75
100
125
150
175
200
225
manu
factur
edma
rket s
ervic
esoth
er
manu
factur
edma
rket s
ervic
esoth
er
manu
factur
edma
rket s
ervic
esoth
er
manu
factur
edma
rket s
ervic
esoth
er
manu
factur
edma
rket s
ervic
esoth
er
manu
factur
edma
rket s
ervic
esoth
er
manu
factur
edma
rket s
ervic
esoth
er
manu
factur
edma
rket s
ervic
esoth
er
manu
factur
edma
rket s
ervic
esoth
er
Tirol Vorarlberg Kaernten Steiermark Salzburg Oberoesterreich Burgenland Niederoesterreich Wien
valu
e-ad
ded
effe
ct o
f an
addi
tiona
l 100
€ of e
xpor
ts effect on rest of Austriaeffect on own region
In all regions, market services exhibit the highest effects on both the same region and the national level, with 100 Euros’ worth of additional market service exports leading to about
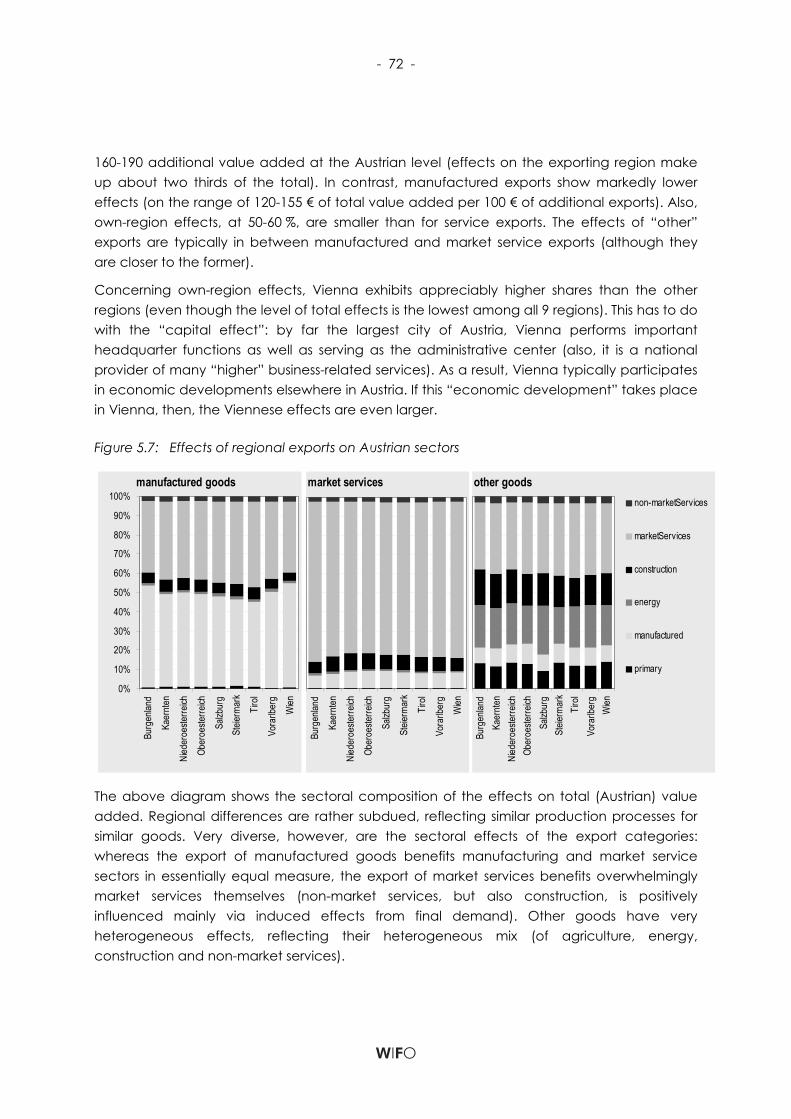
- 72 -
160-190 additional value added at the Austrian level (effects on the exporting region make up about two thirds of the total). In contrast, manufactured exports show markedly lower effects (on the range of 120-155 € of total value added per 100 € of additional exports). Also, own-region effects, at 50-60 %, are smaller than for service exports. The effects of “other” exports are typically in between manufactured and market service exports (although they are closer to the former).
Concerning own-region effects, Vienna exhibits appreciably higher shares than the other regions (even though the level of total effects is the lowest among all 9 regions). This has to do with the “capital effect”: by far the largest city of Austria, Vienna performs important headquarter functions as well as serving as the administrative center (also, it is a national provider of many “higher” business-related services). As a result, Vienna typically participates in economic developments elsewhere in Austria. If this “economic development” takes place in Vienna, then, the Viennese effects are even larger.
Figure 5.7: Effects of regional exports on Austrian sectors
manufactured goods
0%
10%
20%
30%
40%
50%
60%
70%
80%
90%
100%
Burg
enlan
d
Kaer
nten
Nied
eroe
sterre
ich
Ober
oeste
rreich
Salzb
urg
Steie
rmar
k
Tirol
Vora
rlber
g
Wien
other goodsBu
rgen
land
Kaer
nten
Nied
eroe
sterre
ichOb
eroe
sterre
ichSa
lzbur
gSt
eierm
ark
Tirol
Vora
rlber
gW
ien
non-marketServices
marketServices
construction
energy
manufactured
primary
market services
Burg
enlan
d
Kaer
nten
Nied
eroe
sterre
ich
Ober
oeste
rreich
Salzb
urg
Steie
rmar
k
Tirol
Vora
rlber
g
Wien
The above diagram shows the sectoral composition of the effects on total (Austrian) value added. Regional differences are rather subdued, reflecting similar production processes for similar goods. Very diverse, however, are the sectoral effects of the export categories: whereas the export of manufactured goods benefits manufacturing and market service sectors in essentially equal measure, the export of market services benefits overwhelmingly market services themselves (non-market services, but also construction, is positively influenced mainly via induced effects from final demand). Other goods have very heterogeneous effects, reflecting their heterogeneous mix (of agriculture, energy, construction and non-market services).
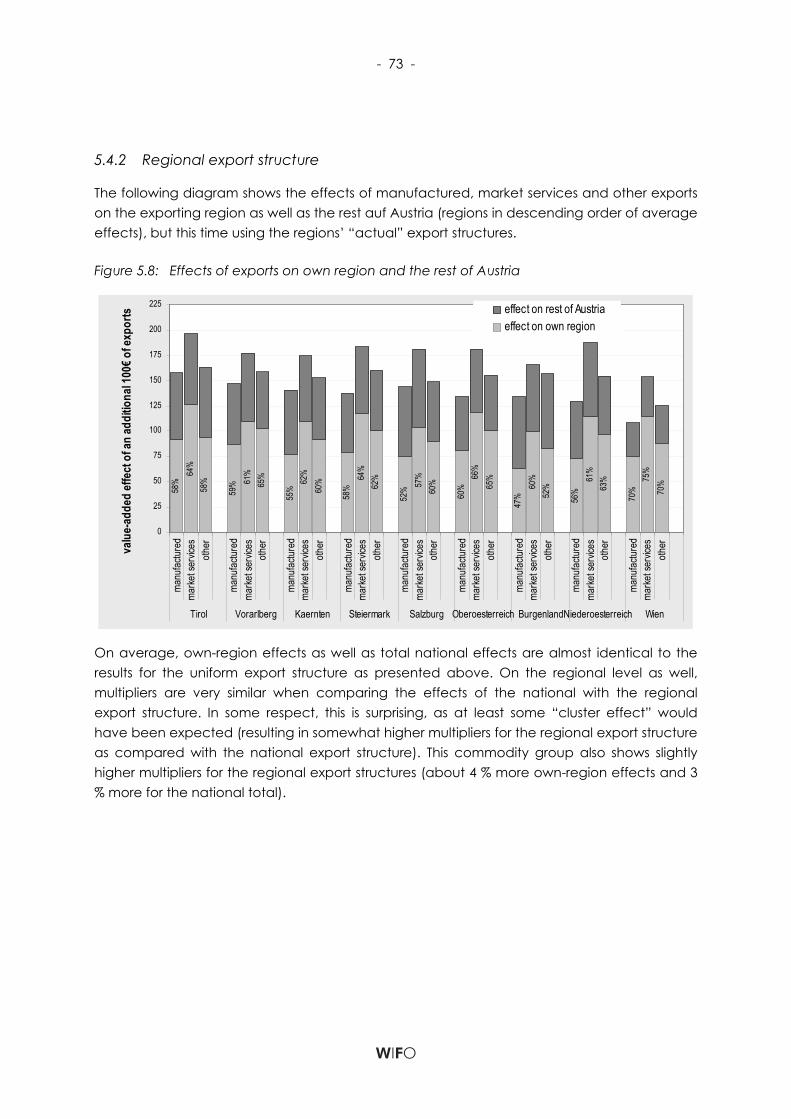
- 73 -
5.4.2 Regional export structure
The following diagram shows the effects of manufactured, market services and other exports on the exporting region as well as the rest auf Austria (regions in descending order of average effects), but this time using the regions’ “actual” export structures.
Figure 5.8: Effects of exports on own region and the rest of Austria
58%
64%
58%
59% 61
%65
%
55%
62%
60%
58%
64%
62%
52% 57
%60
%
60%
66%
65%
47%
60%
52%
56%
61%
63%
70%
75%
70%
0
25
50
75
100
125
150
175
200
225
manu
factu
red
marke
t ser
vices
other
manu
factu
red
marke
t ser
vices
other
manu
factu
red
marke
t ser
vices
other
manu
factu
red
marke
t ser
vices
other
manu
factu
red
marke
t ser
vices
other
manu
factu
red
marke
t ser
vices
other
manu
factu
red
marke
t ser
vices
other
manu
factu
red
marke
t ser
vices
other
manu
factu
red
marke
t ser
vices
other
Tirol Vorarlberg Kaernten Steiermark Salzburg Oberoesterreich BurgenlandNiederoesterreich Wien
valu
e-ad
ded
effe
ct o
f an
addi
tiona
l 100
€ of e
xpor
ts effect on rest of Austriaeffect on own region
On average, own-region effects as well as total national effects are almost identical to the results for the uniform export structure as presented above. On the regional level as well, multipliers are very similar when comparing the effects of the national with the regional export structure. In some respect, this is surprising, as at least some “cluster effect” would have been expected (resulting in somewhat higher multipliers for the regional export structure as compared with the national export structure). This commodity group also shows slightly higher multipliers for the regional export structures (about 4 % more own-region effects and 3 % more for the national total).

- 74 -
Figure 5.9: Effects of regional exports on Austrian sectors
manufactured goods
0%
10%
20%
30%
40%
50%
60%
70%
80%
90%
100%
Burg
enlan
d
Kaer
nten
Nied
eroe
sterre
ich
Ober
oeste
rreich
Salzb
urg
Steie
rmar
k
Tirol
Vora
rlber
g
Wien
other goods
Burg
enlan
dKa
ernte
nNi
eder
oeste
rreich
Ober
oeste
rreich
Salzb
urg
Steie
rmar
kTir
olVo
rarlb
erg
Wien
non-marketServices
marketServices
construction
energy
manufactured
primary
market services
Burg
enlan
d
Kaer
nten
Nied
eroe
sterre
ich
Ober
oeste
rreich
Salzb
urg
Steie
rmar
k
Tirol
Vora
rlber
g
Wien
The largest differences between the effects of the regional and the national export structure can be observed in “other goods and services”, which is not surprising as this is a very heterogeneous group (where regional differences are more pronounced).
5.4.3 Foreign Tourism
In Chapter 4 foreign tourism was presented alongside exports. According to Statistics Austria, foreign tourists spent 14.55 Bio. € in 2003, equivalent to 11 % of total private consumption in Austria (129.20 Bio €), and 5.27 Bio. € more than Austrian tourists spent abroad (9.28 Bio. €). In the following exercise, the regional effects of these “exports” were simulated. In the simulation, only spending by foreign tourists was changed; all other relevant components of final demand were held constant at their respective base-run levels. Specifically, these include:
• domestic tourism;
• “outbound foreign tourism” from Austrians;
• exports of goods and services;
• public spending.
The simulation, therefore, includes direct and indirect effects as well as the effects on private consumption and investment as components of induced effects. The results are presented in the following table.

- 75 -
Table 5.4: The importance of foreign tourism
Region over
nigh
t sta
ys b
y fo
reig
ners
[Mio
]
over
nigh
t sta
ys b
y fo
reig
ners
[%]
spen
ding
by
fore
ign
tour
ists
[M
io €]
tour
. spe
ndin
g /
GRP
◊ G
RP
Burgenland 656 1% 100 2% -4%Kaernten 8,553 10% 1,150 9% -11%Niederoesterreich 1,962 2% 150 0% -3%Oberoesterreich 2,834 3% 250 1% -1%Salzburg 16,424 19% 2,450 15% -10%Steiermark 3,601 4% 400 1% -3%Tirol 38,645 45% 7,100 36% -21%Vorarlberg 7,069 8% 1,300 13% -12%Wien 6,533 8% 1,650 3% -4%
Total Austria 86,276 100% 14,550 6% -7%
Source: Own calculations.
The largest effects are estimated for Tirol, whose simulated GRP would be some 21 % lower without foreign tourists, with Vorarlberg and Kärnten (12 and 11 % respectively) as already distant followers. On average, according to the simulation, Austrian GDP would be about 7 % lower.10 This is quite substantial, especially as public consumption was held constant and the simulation, therefore, did not include repercussions from lower tax revenues.
5.5 Summary
Exports play remarkably different roles for the Austrian regions: relative to Gross Regional Product (GRP), their level in 2003 ranged between 29 % (Vienna) and 62 % (Vorarlberg); the average is about 42 %. Adding spending by foreign tourists, which also can be defined as “exports”, this ratio rises to between 31% for Vienna and 77 % for Tirol. Foreign tourism,
10 Such „sector-wide“ exercises („what would the Austrian economy without the construction sector, the tourism sector etc. look like” always have to be interpreted with great care: of course, the complete absence of some important sector – as is foreign tourism – would lead to an economy which would be quite different from the one MultiREG tries to simulate; in this respect, rather than interpreted literally (“the Austrian GDP would be 7 % lower without foreign tourists”), the results should be seen more along the line of “some 7 % of Austrian GDP are produced by sectors which are directly or indirectly associated with foreign tourists”:

- 76 -
however, is even more unequally distributed than exports of goods and services: Tirol alone accounts for 45 % of all overnight stays by foreigners (and even a bit more in terms of spending), followed by Salzburg and Kärnten (19 and 10 %). A simulation exercise shows that in Tirol, more than a fifth of total GRP is – directly or indirectly – associated with foreign tourists (not even counting domestic tourists); the Austrian average is about 7 %.
Since 1995, nominal exports of manufactured goods have risen by +8.4 % a year on average; Burgenland, at +10.0 %, shows the highest growth rates (this catching-up process was aided by the region’s status as objective 1-region); slowest growth was experienced by Vienna (+7.4 % p.a. despite a decline in its manufacturing industries’ relative importance).
A simulation using a multiregional IO model (MultiREG) shows that the effect on GDP of regional manufactured exports (its – closed - multiplier) is about 1.40: one Euro of additional exports leads to an expansion of Austrian GDP by about € 1.40. Multipliers for services exports are higher (1.80), as services use fewer (imported) inputs – as a result, more of the value-added chain set off by service exports remains within the country. Regional differences in these multipliers are more pronounced for manufactured goods (1.1-1.6) than for services (1.5-2.0); as a tendency, the manufacturing multipliers are higher for western/southern regions than for the eastern/northern area regions (no clear pattern emerges for services exports).
Exports from any one region benefit mainly the exporting region itself: own-region benefits typically amount to some 57 % of total effects for manufactured exports. For services exports, this share is even higher (63 %). The main reason for this can be found in the fact that services are overwhelmingly traded within the same region, whereas manufactured goods to a large extent are traded internationally (some 60 % of regional demand for manufactured goods is imported; a similarly large share of regional production is shipped abroad). About a quarter of regional demand for manufactured goods is met by local production.
- 77 -
6. Summary and conclusions
Globalization implies an intensification of international trade; from this we also expect that in the production of exports more and more imported commodities are used. An increasing share of imports, however, must go hand in hand with a diminished share in domestic value added. The “bazaar”-hypothesis starts off from this observation and claims that industrialized countries progressively withdraw from production activities, which are transferred to lower-wage countries, and specialize in trading activities and other business services. If wages are not flexible enough, however, this structural change may go too far: industrialized countries may lose more manufacturing than needed while at the same time an insufficient number of jobs are created in the service sector, so that unemployment will rise. It was one aim of this research to collect evidence on Austria’s position on its way towards a “bazaar”-economy.
Many indicators suggest, not surprisingly, that “bazaar”-characteristics are evident in the Austrian economy: Not only are imports on the rise, at the cost of value added, but the production depth is falling as is the net investment rate. At the same time the multiplier analysis implies falling value added intensity in the manufacturing sector due to rising re-exports. Export growth is concentrating to a considerable extent on “bazaar”-type activities, namely import-export trading. But there is no evidence from this investigation that this development has hurt the Austrian economy so far: Export growth has been sufficiently strong to compensate the declining value added intensity so that the share of export-induced value added in total GDP has gone up; even the trade balance (not including expenditures of foreigners in Austria) has become positive.
One fact that can be put forward against the benefits of the “bazaaring” of Austria’s economy concerns quite significant changes in the composition of value added linked to exports: Profits have increased their share in value added to the disadvantage of wages and salaries. At the same time, however, exports have increased their share in total employment compared to private and public consumption and export employment is also becoming more skill-intensive over time. What policy makers should also keep in mind is that lower multipliers imply that for exports to contribute to the same extent to domestic growth as it happened in the past, their growth has to be higher than before to compensate for the lower value added per Euro of exports.
Service exports, which are less prone to a “bazaar”-type economy, have increased their share in total exports. Their value added contribution has been quite stable or slightly increasing. Services also benefit from exports more than in the past: the value added share of services has increased at the cost of manufacturing products. If services continue to gain weight in total exports, the possible erosion of value added can be compensated to some extent.
- 78 -
Multipliers cannot be compared directly across countries, as the size of a country and of its multiplier are correlated: smaller countries are typically more open and, therefore, have smaller multipliers. A comparison of sectoral shares in multipliers shows, however, that in Austria, the impact of exports on the manufacturing sector is somewhat larger than in most other OECD countries. The impact on the service sector in Austria is below the international average, possibly because of a higher degree of vertical integration in manufacturing. However, despite its lower share in total exports, the service sector benefits most from total export activity.
The results of the national and international analyses point to services as the key sector policy makers should pay attention to. In a “bazaar”-type economy manufacturing production may lose ground and may be replaced by high quality service activities which become increasingly export-oriented themselves. Services also play a key role in complementing manufacturing exports. Furthermore, manufacturing production in general critically depends on the quality of services they can rely on. Economic policies should therefore pay special attention to the international competitiveness of service sector companies.
Exports activities are not evenly distributed across space and neither are the benefits from exports. We observe that exports play remarkably different roles for the Austrian regions: While Vienna is found to be the region least dependent on exports, Vorarlberg’s economy is highly export-oriented. This regional pattern becomes even more uneven if foreign tourism is taken into account as well: A simulation exercise shows, for instance, that in Tirol more than a fifth of total GRP is – directly or indirectly – associated with foreign tourists (not even including domestic tourists); the Austrian average is about 7 %.
Growth in exports has not been the same in all regions either: While in Austria nominal exports of manufactured goods have risen by +8.4 % a year on average since 1995, Burgenland shows the highest growth rate (+10 %) while Vienna experienced the slowest growth (+7.4 % p.a.). Any judgment about Vienna’s export performance, however, has to take into account that the urban region is losing manufacturing activities at a very fast pace, as is typical for many large cities around Europe.
A simulation using a multiregional IO model (MultiREG) shows that the effect on GDP of regional manufactured exports (its – closed - multiplier) is about 1.40: one Euro of additional exports leads to an expansion of Austrian GDP by about € 1.40. Multipliers for service exports are higher (1.80), as services use fewer (imported) inputs – as a result, more of the value-added chain set off by service exports remains within the country. Regional differences in these multipliers are more pronounced for manufactured goods (than for services; as a tendency, the manufacturing multipliers are higher for western/southern regions than for the eastern/northern area regions (no clear pattern emerges for service exports).
Exports from any one region benefit mainly the exporting region itself: own-region benefits typically amount to some 57 % of total effects for manufactured exports. For services exports, this share is even higher (63 %). The main reason for this can be found in the fact that services
- 79 -
are overwhelmingly traded within the same region, whereas manufactured goods to a large extent are traded internationally (some 60 % of regional demand for manufactured goods is imported; a similarly large share of regional production is shipped abroad). About a quarter of regional demand for manufactures goods is met by local production.

- 81 -
7. References
Almon, C. (1991), The Inforum Approach to Interindustry Modeling, Economic Systems Research, 3, pp. 1-7.
Austrian Institute for Economic Research WIFO, WIFO-Weißbuch: Mehr Beschäftigung durch Wachstum auf Basis von Innovation und Qualifikation, Zusammenfassung, 2006, Wien
Barker, T., Gardiner, B. Chao-Dong, H., Jennings, N., Schurich, C. (1999), E3ME Version 2.2, User's Manual, Cambridge Econometrics.
Bayerl, N. (2008), Spezialisierungsmuster und Wertschöpfungsintensität der öserreichischen Exportwirtschaft, Materialien zu Wirtschaft und Gesellschaft Nr. 105, AK Wien, Wien.
Bofinger, P. (2006), Wir sind besser, als wir glauben. Wohlstand für alle, Rowohlt Verlag, 2006, Reinbek
Brenken, A., Schwarz, M. (2004), Wettbewerbsfähigkeit der deutschen Exportindustrie und die Theorie der Basarökonomie, KfW-Research Nr. 15, Kfw Bankengruppe, November 2004, Frankfurt
Breuss, F. (2007), Globalization, EU Enlargement and Income Distribution, WIFO-Working Papers, No. 296, 2007, Wien
Breuss, F. (2006), Warum wächst die Wirtschaft in Österreich rascher als in Deutschland?, WIFO-Working Papers, No. 280, 2006, Wien
Conway, R. S. (1990), The Washington Projection and Simulation Model: A Regional Interindustry Econometric Model, International Regional Science Review, 13, pp. 141-165.
De Backer, K., Yamano, N. (2007), Globalisation measurement using international input-output tables. Paper presented at the International input-outputMeetings, July 2007, Istanbul.
Destatis, Statistisches Bundesamt Wiesbaden, Importabhängigkeit der deutschen Exporte 1991, 1995, 1998 bis 2000 und 2002, 2004, Wiesbaden
Fritz, O., Streicher, G., Zakarias, G. (2005), MultiREG – A Multiregional Econometric Input Output Model for Austria, in WIFO-Monatsberichte 8, Vienna.
Fritz, O., Kurzmann, R., Pointner, W., Streicher, G. and Zakarias, G. (2001), Modeling the Regional Economy: A Regional Econometric input-outputApproach. In: Neck, R. (ed.), Modeling and Control of Economic Systems, Elsevier, Oxford.
Hickel, R. (2004), Deutschland-keine Basarökonomie, Kommentar für die Blätter für deutsche und internationale Politik 12/2004, 2004, Bremen
Kratena, K. (1994), MULTIMAC I - das gesamtwirtschaftliche input-outputModell des WIFO, WIFO Monatsberichte, 67, Austrian Institute of Economic Research (WIFO), Vienna.
Kratena, K. and Zakarias, G. (2001), MULTIMAC IV: A disaggregated Econometric Model for the Austrian Economy, Working Paper, 160, Austrian Institute of Economic Research (WIFO), Vienna.
Marterbauer M. (2007), Wem gehört der Wohlstand? Perspektiven für eine neue österreichische Wirtschaftspolitik, Zsolnay Verlag, 2006, Wien
Piper N. (2006), Der Exportboom ist nicht pathologisch, ifo Schnelldienst 1/2006, Sonderausgabe, München, 2006
Sauernheimer, K. (2006), Pathologischer Exportboom und Basar-Ökonomie, ifo Schnelldienst 1/2006, Sonderausgabe, 2006, München
Sinn, H.-W. (2005), Die Basar-Ökonomie. Deutschland: Exportweltmeister oder Schlusslicht? Econ Verlag, 2005, Berlin
Zakarias, G., Fritz, O., Kurzmann, R. and Streicher,G. (2002), Comparing Regional Structural Change – An Application of Economic input-outputModels, InTeReg Working Paper Series, 18, Graz-Vienna.

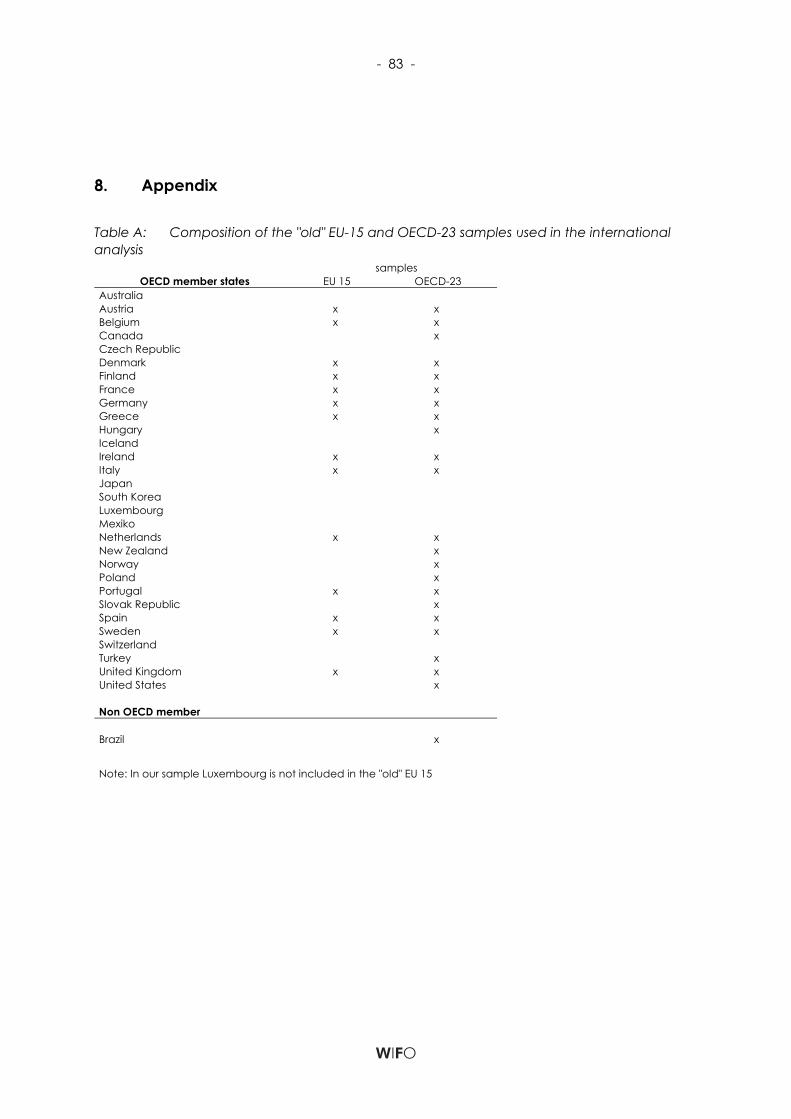
- 83 -
8. Appendix
Table A: Composition of the "old" EU-15 and OECD-23 samples used in the international analysis samples
OECD member states EU 15 OECD-23 Australia Austria x x Belgium x x Canada x Czech Republic Denmark x x Finland x x France x x Germany x x Greece x x Hungary x Iceland Ireland x x Italy x x Japan South Korea Luxembourg Mexiko Netherlands x x New Zealand x Norway x Poland x Portugal x x Slovak Republic x Spain x x Sweden x x Switzerland Turkey x United Kingdom x x United States x Non OECD member Brazil x
Note: In our sample Luxembourg is not included in the "old" EU 15
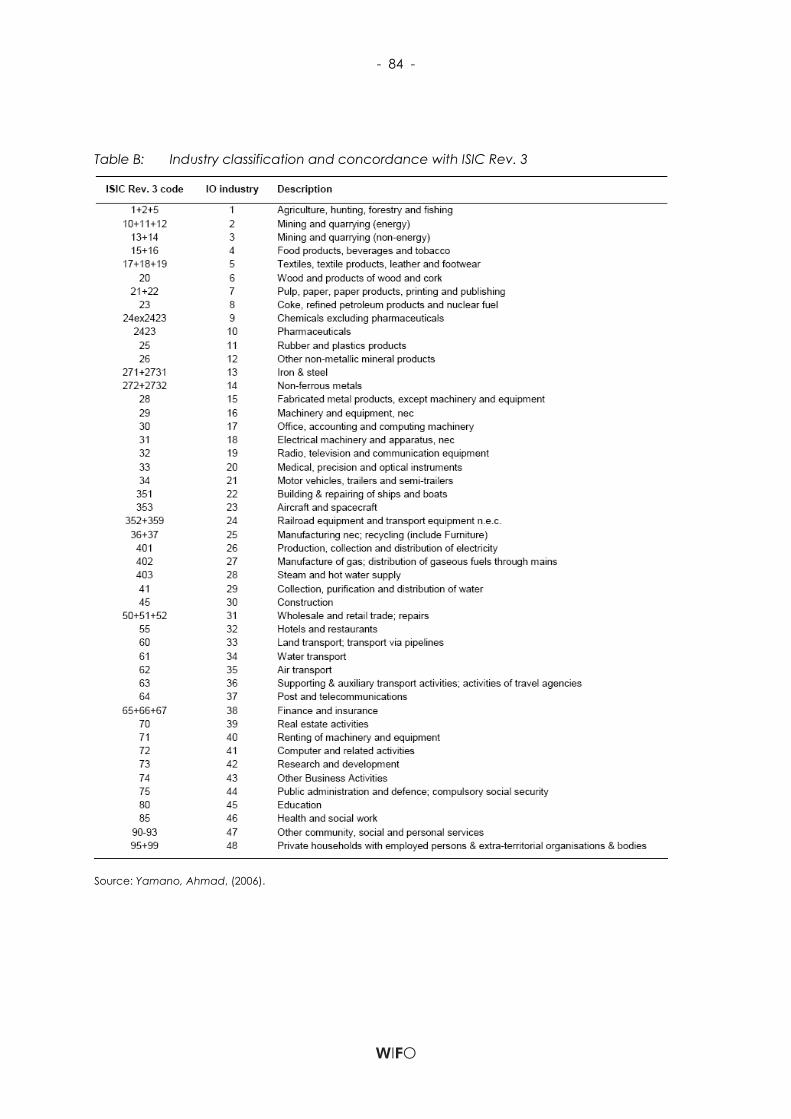
- 84 -
Table B: Industry classification and concordance with ISIC Rev. 3
Source: Yamano, Ahmad, (2006).