exports and profitability – first evidence for german
TRANSCRIPT

Exports and Profitability –
First Evidence for German Business Services
Enterprises
University of Lüneburg Working Paper Series in Economics
No. 129
May 2009
www.leuphana.de/vwl/papers
ISSN 1860 - 5508
by Alexander Vogel and Joachim Wagner

Exports and Profitability – First Evidence for German Business Services Enterprises
Alexander Vogel and Joachim Wagner
[This version: May 27, 2009]
Abstract:
We use the unique recently released German business services statistics panel to conduct
the first comprehensive empirical study on the relationship between exports and profitability
for the business services sector. We document a negative profitability differential of services
exporters compared to non-exporters that is statistically significant, though rather small,
when observed firm characteristics and unobserved firm specific effects are controlled for.
We find that export-starters in services are less profitable than non-starters, even two years
before they begin to export, pointing to self-selection of less profitable firms into export
markets. We use a recently developed continuous treatment approach to investigate the
causal impact of exports on profits. The estimated dose-response function shows an
s-shaped relationship between profitability in 2005 and firms’ export-sales ratio in 2004.
Enterprises with a very small share of exports in total sales have a lower rate of profit than
non-exporting firms. Then, with an increase in export intensity the rate of profit increases,
too. However, even at the maximum the average profitability of the exporters is not, or only
slightly, higher than the average rate of profit of the non-exporting firms. Given that Germany
is one of the leading actors on the world market for services, the evidence provided here is
interesting on its own. Furthermore, it can serve as a benchmark for future studies using
comparable data for firms from services industries in other countries.
Keywords: Exports, profitability, business services enterprises, Germany
JEL classification: F14, D21, L80 Acknowledgements: All computations were performed inside the Research Data Centre of the Statistical Office of Berlin/ Brandenburg using Stata 10. For details regarding data access see Zühlke et al. (2004). To facilitate replication all do-files are available from the first author on request. Many thanks go to Alexander Eickelpasch for helpful comments as well as Ramona Voshage and Anja Malchin for running the do-files in the Research Data Centre. Dipl.-Ökonom Alexander Vogel Prof. Dr. Joachim Wagner Leuphana University Lueneburg Leuphana University Lueneburg Institute of Economics Institute of Economics PO Box 2440, 21314 Lueneburg, Germany PO Box 2440, 21314 Lueneburg, Germany e-mail: [email protected] e-mail: [email protected]

2
1. Motivation
For manufacturing firms, a huge and emerging literature on the micro-econometrics
of international trade provides evidence for a number of stylized facts: Exporting firms
are more productive than otherwise identical firms that sell on the national market
only.1 Exporting firms have to bear extra costs due to, among others, market
research in foreign countries, adaptation of products to local regulations, or transport
costs. These extra costs are one reason for a self-selection of the more productive
firms on international markets. Furthermore, exporting firms tend to pay higher wages
than non-exporting firms.2
While this empirical evidence for manufacturing firms is widely known for some
time now, comparable information for firms from services is scarce and of a more
recent vintage. Vogel (2009a) finds that in Germany – that ranked as number three
on the world market for services exports in 2007 (Bundesministerium für Wirtschaft
und Technologie (2009)) - exporting firms from the business services sector have a
significantly and substantially higher productivity than non-exporting firms, and pay
significantly and substantially higher wages, after controlling for firm size and
industry.
Does the productivity advantage found for exporting firms lead to a profitability
advantage, or is it compensated by the extra costs facing exporters and by higher
wages paid? Research in this topic has only recently started in a paper by Fryges
1 See Bernard et al. (2007) for the U.S., Mayer and Ottaviano (2007) for European countries, Wagner
(2007) for a survey of studies from countries all over the world, and The International Study Group on
Exports and Productivity (2008) for strictly comparable results from 14 countries.
2 See Schank, Schnabel and Wagner (2007) for a survey.

3
and Wagner (2008a).3 For German manufacturing enterprises they document that the
positive profitability differential of exporters compared to non-exporters is statistically
significant, though rather small, when observed firm characteristics and unobserved
firm specific effects are controlled for. In contrast to nearly all empirical studies on the
relationship between productivity and exports Fryges and Wagner do not find any
evidence for self-selection of more profitable firms into export markets. However,
they show that exporting improves the profitability almost over the whole range of the
export-sales ratio. Only firms that generate 90 percent and more of their total sales
abroad do not benefit from exporting in terms of an increased rate of profit. This
means, that the usually observed higher productivity of exporters is not completely
absorbed by the extra costs of exporting or by higher wages paid by internationally
active firms from manufacturing industries.
Comparable evidence for firms from services is lacking. This paper contributes
to the literature by using the unique recently released German business services
statistics panel to conduct the first comprehensive empirical study on the relationship
between exports and profitability for the business services sector. Unless otherwise
stated, business services are defined in this paper as NACE divisions 72 (computers
and related activities, including, among others, hardware and software consultancy,
3 Note that in the literature on international management the empirical investigation of the relationship
between internationalisation and firm performance has a long tradition. However, given that the
samples used in these studies tend to be small cross-section samples that do not allow to control for
unobserved heterogeneity by including fixed firm effects, and that various measures of both
internationalisation and performance are used (see Bausch and Krist (2007), p. 332), we cannot find
an answer to our question – whether the productivity advantage of exporting services firms does lead
to a profitability advantage of exporters compared to otherwise identical non-exporters even when
exporters are facing extra costs and pay higher wages – from this literature (see Fryges and Wagner
2008a for an overview).

4
data processing, software publishing and database activities), 73 (research and
development), and 74 (other business activities, including, for example, business,
management and tax consultancy, advertising, legal activities, market research, and
architectural and engineering activities). Even though the business services sector
covers a wide range of activities, business services are traded more than most other
services,4 and these activities have in common that they provide primarily
intermediate inputs.
To investigate the relationship between exports and profitability we follow the
now standard approach in the micro-econometric literature on exports and
productivity (see The International Study Group on Exports and Productivity (2008)).
First, we document a negative profitability differential of services exporters compared
to non-exporters that is statistically significant, though rather small, when observed
firm characteristics and unobserved firm specific effects are controlled for. Based on
these negative export profitability premia we analyse in a second step a possible self-
selection of less profitable firms into export markets and find that export-starters in
services are less profitable than non-starters, even two years before they begin to
export. Finally, we analyse the effect of exporting on profitability. Unfortunately, the
data used in our empirical study cover the years 2003 to 2005 only. Therefore, we
cannot test whether services firms that started to export performed better or worse in
the years after the start than their otherwise identical counterparts that did not start to
export. Instead, we use a recently developed continuous treatment approach
4 According to the German balance of payments, business services (defined as advertising,
engineering, commercial and computer services) have by far the highest trade volume of any service
other than travel and transport (cf. Deutsche Bundesbank (2008)). In addition, Jensen and Kletzer
(2006) classified nearly all business services as tradable, based on the geographic concentration of
service activities in the United States.

5
(described in detail in section 6 below) to investigate the causal impact of exports on
profits. The estimated dose-response function for all business services sectors
(NACE 72 to 74) shows an s-shaped relationship between profitability in 2005 and
firms’ export-sales ratio in 2004, and the same picture is found when looking at the
more disaggregated two-digit NACE level separately. Enterprises with a very small
share of exports in total sales have a lower rate of profit than non-exporting firms.
Then, with an increase in export intensity the rate of profit increases, too. However,
even at the maximum of the dose response function the average profitability of the
exporters is not or only slightly higher than the average rate of profit of the non-
exporting firms. Beyond the maximum, firms exhibit a decrease in profitability
compared to firms with lower export intensities. This decrease might be a result of
additional costs of exporting, for instance due to rising costs of coordination and
control of a firm’s export activities or higher travel or transportation costs due to the
increasing geographical distance of the foreign markets a firm has entered.
These findings for German service sector exporters stand in stark contrast to
the results from the investigation of exporters from German manufacturing industries
reported by Fryges and Wagner (2008a). Given that Germany is one of the leading
actors on the world market for both goods and services, the evidence provided here
is interesting on its own. Furthermore, it can serve as a benchmark for future studies
using comparable data from other countries.
The rest of the paper is organised as follows: Section 2 introduces our data
base, the German statistics on business services. Section 3 presents results from
descriptive comparisons of exporting and non-exporting business services firms.
Section 4 reports estimations of exporter profitability premia after controlling for
observed and unobserved differences between exporters and non-exporters. Section
5 documents whether differences between export starters and non-exporters exists

6
even before the future exporters starts to export and Section 6 investigates the
causal effect of exporting on profitability using the recently developed generalised
propensity score (GPS) methodology. Section 7 concludes.
2. Data
To investigate the relationship between export and profitability of German business
services enterprises, we use the business services statistics (Strukturerhebung im
Dienstleistungsbereich) established by the German Federal Statistical Office and the
statistical offices of the Federal States (Länder). The statistics were first compiled for
the year 2000 on the initiative of the European Union. The data covers the
enterprises and professions (Freie Berufe) of the NACE divisions I (transport, storage
and communication) and K (real estate, renting and business activities) with an
annual turnover of €17,500 or more. A stratified random sample is used to select the
enterprises. The stratification is based on the federal states, 4-digit industries, and 12
size ranges (in terms of turnover or employees). For 2005, the following sample sizes
are drawn from the three industries analysed in this paper: 18.3% of all statistical
units from the NACE division 72 (computer and related activities), 36.9% of all
statistical units from the NACE division 73 (research and development) and 12.6% of
all statistical units from the NACE division 74 (other business activities). Because the
same enterprises that participated in 2003 also participated in 2004 and 2005, it is
possible to merge the cross-sectional datasets to a panel dataset that covers the
years 2003 to 2005.
The business services statistics include, among other data, information about
the economic sector, the number of persons employed (not including temporary
workers), total turnover, salaries and wages, and export – defined as turnover for
business with companies located abroad, including exports to foreign affiliates.

7
Unfortunately, information on the target countries of exports is not included in the
statistics. Also, no information is obtained about other forms of companies’ activities
abroad, such as cooperation, direct investments, or imports. Furthermore, small
enterprises with an annual turnover lower than 250,000 € are given a shorter
questionnaire, so important information, such as information about export activities, is
missing for these enterprises. As a result, only enterprises with an annual turnover
over 250,000 € are considered for the analyses.
These data are confidential but not exclusive. They can be used by
researchers on a contractual basis via controlled remote data access inside the
research data centres of the German Statistical Offices (see Zühlke et al. (2004) for
details).5 For more details about the German business services statistics panel see
Vogel (2009b).
3. Descriptive analysis
3.1 Export participation of business services firms
The enterprises’ export activities are measured by the export intensity, defined as the
percentage of exports in total turnover. Regarding all business services industries,
the share of exporters in all enterprises was about 14 percent in 2003 and about 16
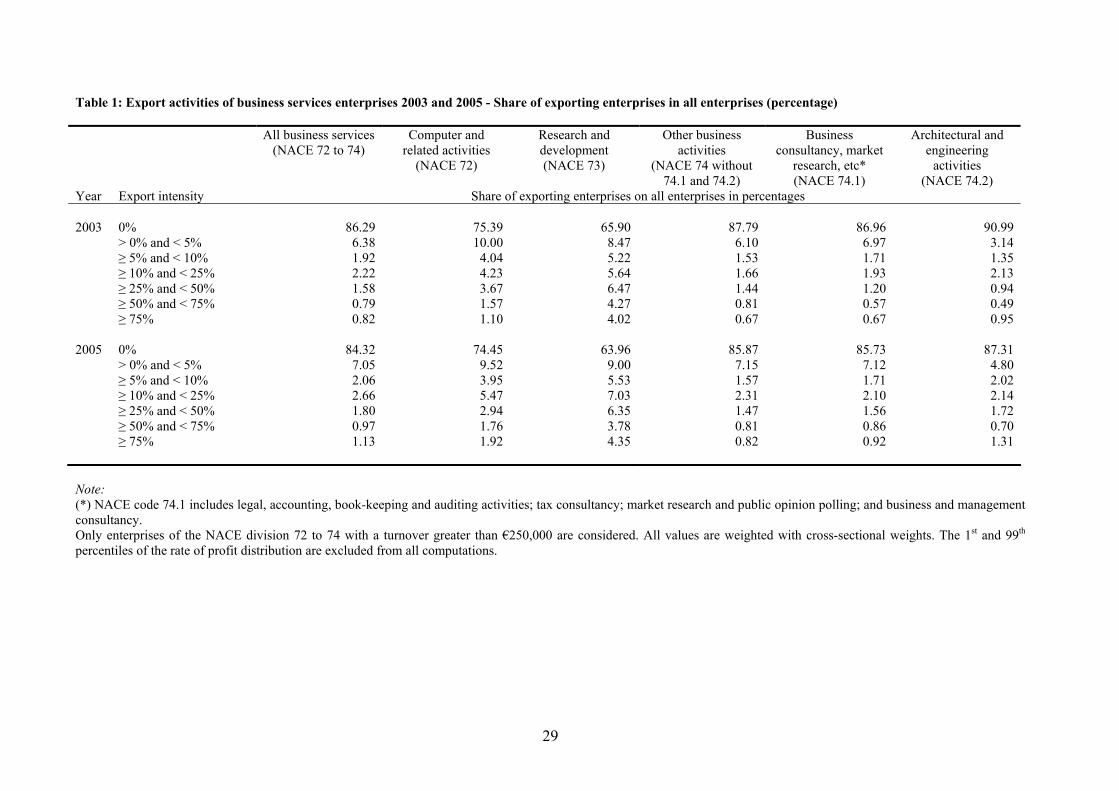
percent in 2005. Table 1 shows that in both years the distribution of the export
intensity was highly skewed – most of the exporters sold a relative small share of
their total production abroad, and only a few firms exported a very high share.
Looking at the more disaggregated industry level, the highest export participation
5 To facilitate replication the Stata do-files used in the computations are available from the first author
upon request.

8
was in the research and development sector (about 36 percent in 2005), followed by
computer and related activities (about 25 percent in 2005).6
[Table 1 near here]
3.2 Profitability of exporting and non-exporting firms
As a first step in our empirical investigation we compare the profitability of exporting
and non-exporting business services firms. The rate of profit of a firm is computed as
a rate of return, defined as gross firm surplus (computed in line with the definition of
the European Commission (1998) as gross value added at factor costs minus gross
wages and salaries minus costs for social insurance paid by the firm) divided by total
sales (net of VAT) minus net change of inventories.7
Our profit measure is a measure for the price-cost margin which, under
competitive conditions, should on average equal the required rental on assets
employed per money unit of sales (see Schmalensee (1989), p. 960f.). Differences in
profitability between firms, therefore, can follow from productivity differences, but also
from different mark-ups of prices over costs and from differences in the capital
intensity. Given that our data set does not have information on the capital stock
employed by the firms in our econometric investigations we control for differences in 6 To explain the high export participation in the research and development sector it has to be
mentioned that privately organised entities, owned by German research institutions such as the Max
Planck Society, the Fraunhofer Society, Helmholtz Association of National Research Centres, and
public research institutions of the federal and Länder governments are included. Usually, these
institutions are intensively integrated in international networks (Eickelpasch (2008)).
7 Note that the data set does not have any information on the capital stock, or the sum of assets or
equity, of the firm, so that it is not possible to construct profit indicators based thereon like return on
assets or return on equity.

9
the capital intensity by including a complete set of industry dummy variables at the
most disaggregated (4-digit) level.
Table 2 reports the mean and selected percentiles of the distribution of the
rate of profit for all business services enterprises within different classes of the export
intensity. In contrast to the evidence from the manufacturing sector (see Fryges and
Wagner 2008a) the descriptive results show that non-exporting enterprises tend to
have a higher rate of profit than exporters. This holds for the mean profitability and
for almost all considered percentiles. The results indicate that the mean profitability
(or the percentiles of the profitability distribution) of firms that export only a small
share of their total sales (less than 10 percent) falls below that of non-exporting firms.
The pattern over the higher export intensity classes, however, does not reveal any
clear pattern.
[Table 2 near here]
4. Exporter profitability premia
The next step in our empirical investigation consists of the estimation of so-called
exporter profitability premia that indicate the ceteris paribus difference in profitability
between exporting and non-exporting enterprises, controlling for other characteristics
of the enterprises. In analogy with the now standard approach in the micro-
econometric literature on exports and productivity (see The International Study Group
on Exports and Productivity (2008)) pooled data are used to regress the rate of profit
on the export activity of the enterprise plus a set of control variables including firm
size (measured as the number of employees and its squared value), and a full set of
interaction terms of the year of observation and the 4-digit industry the enterprise is
active in.

10
Export activity of an enterprise is measured in four different ways, i.e. by a
dummy variable that takes on the value of one if an enterprise is an exporter (and
zero otherwise), by the share of exports in total sales, by the share of exports in total
sales and its squared value, and by the share of exports in total sales plus its
squared and its cubic value. While the dummy variable for exporting firms tests for
the presence or not of an exporter profitability premium per se, the estimated
coefficient of the share of exports in total sales shows whether or not this premium
increases with an increase in the relative importance of exports for an enterprise. The
quadratic terms test for the presence or not of a so-called threshold of
internationalisation – whether the positive effects vanish and become even negative
when the optimal share of exports in total sales is exceeded because increasing
costs of exporting exceed the extra benefits. The cubic term tests for an s-shaped
relationship between profitability and the share of exports in total sales that is
suggested in recent studies from the international management literature.8
For all business services (NACE divisions 72 to 74) the results based on
empirical models using pooled data without fixed enterprise effects are reported in
columns 1 to 4 of Table 3. According to the results in column 1 exporting firms have a
rate of profit that is nearly four percentage points lower ceteris paribus than in non-
exporting firms (a difference that matches the order of magnitude showing up in the
descriptive analysis that does not control for firm size, and industry and time effects,
reported in Table 2), and from column 3 we see that the pattern of the relationship
between export intensity and profitability is u-shaped with an estimated minimum at a
level of exports to sales of 56 percent. According to column 4, there is evidence for a
8 See Contractor (2007) for a discussion of this s-shaped relationship in a longitudinal perspective that
investigates the relationship between internationalisation and performance when a firm increases its
international activities over time.

11
s-shaped relationship, with an estimated inflection point at an export intensity level of
55 percent, a minimum at 32 percent, and a maximum at an export intensity of 78
percent. In both the quadratic and cubic function there exists no export intensity level
where exporters have a higher predicted rate of profit than the average ceteris
paribus profitability level of non-exporters.
If unobserved firm heterogeneity9 is controlled for by including fixed enterprise
effects, still a negative relationship between exporting and the rate of profit is found.
From column 5 and 6 we see that the estimated coefficients of the exporter dummy
and the export intensity variable are negative and statistically significant at a usual
level. Exporters have on average a rate of profit that is 0.7 percentage points lower
ceteris paribus than in non-exporting enterprises, and an increase in the exports-
sales ratio of ten percentage points is accompanied by a decrease in the profit rate
by 0.3 percentage points. However, from the models with fixed enterprise effects we
do not have any evidence that the relationship between the share of exports in total
sales and profitability is nonlinear.
[Table 3 near here]
When we look at the more disaggregated industry level, we find almost similar
results in terms of signs and significance levels (see Table 4).10 The highest
9 These characteristics may include such factors as the age of the firm, the geographical scope of
exports, financial constraints, or the degree of risk aversion and international orientation of the
managers.
10 Due to space restrictions only the estimated coefficients of the exporter dummy are presented in
Table 4. The more detailed tables that include also the estimated coefficients of the share of exports in
total sales are available on request.

12
difference concerning the rate of profit between exporting and non-exporting
enterprises exists in the economic branch of architectural and engineering activities.
Here, based on the pooled regression model exporters have a rate of profit that is
seven percentage points lower than the profitability level of non-exporters. And even
in the model with fixed effects, exporters show a economically and statistically
significant lower profitability level of nearly three percentage points.
[Table 4 near here]
The negative exporter premia found in regression models using pooled data
for exporters and non-exporters cannot be interpreted as indicators for a negative
causal effect of exporting on profitability:
On the one hand, it might be the case that there is self-selection of less
profitable firms into exporting, because exports are viewed as a chance to raise the
rate of profit above the level that can be earned on the national market. Further,
Vogel (2009a) shows for West German business services firms a self-selection into
export markets of firms’ that pay higher average wages, that reflects the importance
of intangible assets by which it is possible to create a competitive advantage over
national and international rivals. Particularly in the labour-intensive business service
sector firms’ need highly qualified human capital to generate competitive advantages
in form of customer specific superior products. However, it is more difficult to absorb
the higher average wages that are related with the need for highly qualified human
capital by means of the firms’ higher productivity. Thus, we would expect a self-

13
selection of enterprises that pay higher wages, are more productive, but are less
profitable.11
On the other hand, exporting might decrease profitability by higher additional
costs related to export activities itself, or due to the fact that foreign services markets
are more competitive. Both directions of causality are possible. In the following,
therefore, Section 5 investigates whether export starters are less profitable than non-
exporters, even before they begin to export and Section 6 analyses the causal effect
of a firm’s export activity on its rate of profit.
5. Pre-entry profitability premia of export starters
Again following the now standard approach in the micro-econometric literature
on exports and productivity (see The International Study Group on Exports and
Productivity (2008)) the next step in our empirical investigation, consists in testing
whether we can document that enterprises that begin to export are less profitable
than non-exporters, even before they begin to export. To do so, we identify a group
of firms that did not export over a time span of the two years t-2 to t-1. Some of these
firms started to export in year t (these are called export starters of cohort t), some did
not (these are called non-starters of cohort t). We then compare the export starters
and the non-starters of cohort t
- in year t, and
- two years back in year t-2.
Given that our data cover the years 2003 to 2005, we can investigate the
cohort for t = 2005 only. Results are reported in Table 5.
11 Note that in this case one would expect a profitability level of export starters that is smaller than that of non-exporters, but not a negative rate of profit of export starters.

14
[Table 5 near here]
First, we compute the ceteris paribus percentage profitability difference
between export starters and non-starters in 2005, the year of start. In line with the
above presented pooled regression results, in all considered industries export
starters are less profitable than non-starters in t. However, this negative profit
premium for export starters is not statistically significant in NACE section 73 (where
the number of observations is very small) and NACE section 74.1.
Second, the ex-ante profitability premia in year 2003 (t-2) is the estimated
regression coefficient of a dummy variable (taking the value one for export starters in
2005, and zero for non-starters) from an OLS-regression of the rate of profit in 2003
on this dummy, controlling for firm size (number of employees and number of
employees squared), and the 4-digit industry, all measured in year 2003.12 This
coefficient is negative for all considered industries and statistically significant (at least
at the 5 percent level) for enterprises with architectural and engineering activities
(NACE 74.2), and for other business activities (NACE 74 without 74.1 and 74.2).
Therefore, we conclude that in contrast to nearly all empirical studies on the
relationship between productivity and exports we have no evidence for self-selection
of more profitable firms into exporting. In fact, we even have evidence that two years
before the export starters begin to export, the non-starters have a higher level of
profit than the starters. Regarding the coefficient for all business services (NACE 72
to 74) the difference is not only statistically significant but also economically large.
12 At first sight it might confuse that we regress the rate of profit in t-2 on a dummy variable measured
later in year t. Note, however, that this regression is not meant to “explain” past profits by today’s
exports – it is just a way to test whether or not profits did differ between today’s starters and today’s
non-exporters two years before the start.

15
Thus, in 2003 (t-2) the rate of profit of the non-starters is on average four percentage
points higher than the profitability of the export starters.
The negative profitability premium of exporters that was found in both the
descriptive analyses reported in section 3.2 and as a result of the econometric
investigation presented in Table 3 and 4 could be caused also by negative effects of
exports on the rate of profit. However, due to the time frame of the data used we
cannot test the hypothesis that firms which started to export performed worse in the
years after the start compared to their counterparts that did not start. As pointed out
in section 2, the German business services statistics panel covers only the years
2003 to 2005. Therefore, it is not possible to follow the cohort of starters from 2005
over the next year(s).
6. Causal effect of exports on profitability
In the last step of our analysis we examine whether there is a causal effect of a firm’s
export activity on its rate of profit. As stated in the previous section, we cannot
evaluate post-entry differences in profitability between export starters and non-
starters due to the time frame of the German business services statistics.
Nonetheless, the question of whether exports have a negative effect on profitability is
crucial for our analysis.
The hypothesis of a negative causal effect of exporting on profitability is tested
using the generalised propensity score (GPS) methodology recently developed by
Imbens (2000) and Hirano and Imbens (2004). The GPS methodology was
introduced to the literature examining the export-performance relationship by Fryges
(2008) and applied by Fryges and Wagner (2008a, 2008b) who estimated the
relationship between exports and labour productivity growth, and the relationship
between exports and profitability using a sample of German manufacturing firms.

16
The GPS methodology has a number of advantages compared to other
econometric techniques. Firstly, the GPS method allows for continuous treatment,
i.e., different levels of the firms’ export-sales ratio. In this way, we are able to
determine the causal relationship between profitability and the export-sales ratio (the
treatment) at each value of firms’ export intensity in the interval from zero to one.
Thus, the second important advantage of the GPS method is that it enables us to
identify the entire function of the rate of profit over all possible values of the
continuous treatment variable. This property of the GPS methodology might be
important in our case. The OLS regression of the determinants of the rate of profit in
Table 3 pointed out that there might be a nonlinear relationship between profitability
and the share of exports in total sales – at least if we restrict ourselves on the
estimations without unobserved heterogeneity. The GPS methodology allows to test
how the causal impact of exporting on profits varies along the range of the export-
sales ratio from zero to one.
Thirdly, the continuous treatment approach allows us to analyse the level of
the export intensity at which profitability is maximised (or minimised) or whether the
relationship between the export-sales ratio and the rate of profit exhibits turning
points or discontinuities (cf. Flores 2004). A detailed description of the GPS
methodology is presented in Fryges/ Wagner (2008a, appendix A.1).
Using the GPS methodology, we do not compare export starters versus non-
starters. Export starters that have entered the foreign market during the previous
year generally show a very small export-sales ratio. Thus, restricting the analysis to
export starters precludes a reliable estimation of the causal effect of medium-sized
and large export-sales ratios on profitability. Our causal analysis in this section
therefore includes export starters as well as firms that export for decades. We
estimate the causal effect of the export-sales ratio measured in period t on the rate of

17
profit in t+1.13 In this way, the GPS method is an appropriate econometric technique
that provides an analysis of the causal effect of exporting on profitability despite the
fact that, due to data restrictions, we cannot follow cohorts of starters over the next
years after foreign market entry.
Hirano and Imbens (2004) suggest a three-stage approach to implement the
GPS method. In the first stage, the conditional distribution of the treatment variable
given the covariates is estimated. In our case, the distribution of the treatment
variable, i.e. the export-sales ratio, is highly skewed. In particular, it has many limit
observations at the value zero, representing firms without any exports. The latter
group of firms decided that their optimal volume of exports was zero. Following
Wagner (2001, 2003), we apply the fractional logit model developed by Papke and
Wooldridge (1996) to estimate the export intensity of the firms in our sample.14 In the
second stage of the GPS method the conditional expectation of outcome (rate of
profit in our case) is modelled as a function of the treatment and the (estimated)
generalised propensity score. In the last stage, we estimate a dose-response
function that depicts the conditional expectation of profitability given the continuous
treatment (export-sales ratio) and the GPS, evaluated at any level of the continuous
treatment variable in the interval from zero to one.
As stated above, we first estimate the conditional distribution of the export-
sales ratio given the covariates, applying the fractional logit model. The exogenous 13 We do not estimate the contemporaneous effect of the export-sales ratio in t on the rate of profit in t,
because this raises the problem that wages per employee that are included in the fractional logit
estimation of the export-sales ratio (see below) are endogenous since wages are a component of our
measure of profitability. This problem is solved when the lagged effect of the export-sales ratio on
profitability is estimated.
14 Hirano and Imbens (2004) use a normal distribution for (the logarithm of) the treatment variable of
their model. However, they emphasise that more general models may be considered.

18
covariates of the fractional logit model include firm size (measured as the log of
number of employees and its squared value), the log of wages and salaries per
employee, the share of part-time employees, the log of the firms’ lagged labour
productivity (measured as sales per employee in t-1), and the share of purchased
goods and services for resale on total turnover (as a proxy for product
diversification). The average wage per employee is used to proxy differences in firms’
human capital. Because of the high level of interaction between user and provider,
particularly in the service sector, employees must have good language skills and a
high level of intercultural competence to establish and maintain certain contacts with
the foreign market (cf. McLaughlin and Fitzsimmons (1996), Winstead and Patterson
(1998)). Further, a firm with a highly qualified human capital is likely to generate
intangible assets (e.g., a technologically superior product or costumer-specific
superior products) leading to a competitive advantage of the firm over its
(international) rivals and enabling the firm to realise a high export intensity. In order
to control whether using the average wage per employee is misleading, we employ
available information on the proportion of employees who work part time
The lagged labour productivity is included as a covariate in order to account
for self-selection of more productive firms into the international market. While we did
not find any evidence for a self-selection effect of more profitable firms (see section
5), most studies in the literature about the manufacturing sector confirm the self-
selection hypothesis of firms with higher labour productivity (cf. Wagner (2007) for a
survey) and also for the German business services sector evidence for self-selection

19
of more productive firms is found (cf. Vogel (2009a)).15 Thus, firms with a higher
labour productivity in t-1 are expected to generate a higher share of total sales
abroad. The model was estimated for the export intensity in t = 2004, and the set of
covariates finally contains 4-digit industry and legal status dummies, and an Eastern
Germany dummy.
The results of the fractional logit model are presented in Table 6.16 Firm size
has a positive effect on the export-sales ratio; in the sectors research and
development, architectural and engineering activities, and other business activities
this effect, however, is not statistically significant. The negative sign of the squared
value of the number of employees is insignificant in all of the considered industries.
As hypothesised, firms with a higher average wage per employee have a higher
export intensity, reflecting the importance of a firm’s intangible assets by which it is
able to create a competitive advantage over its international rivals. Except for
architectural and engineering activities, this effect is significant in all business
services industries. The lagged labour productivity is also positively correlated with
the share of exports in total sales: Firms that exhibited a higher labour productivity in
the past are able to bear the additional costs of exporting and to extend their
international business activities. It can also be argued that more productive firms
have a competitive advantage when compared with their (foreign) counterparts. 15 Concerning the turnover per employed person Vogel (2009a) finds for West German business
services enterprises significant differences between enterprises beginning to export and those that are
not. Further, also positive pre-entry premia in terms of value added per employed person are found in
the dataset, but these premia were not statistically significant.
16 The sample we used to estimate the fractional logit model is restricted to those firms for which data
on profitability in 2005 (t+1) and data on labour productivity in 2003 (t-1) is available in the data set.
Due to the sampling frame of our data set, this reduces significantly the number of observations
compared to Table 4.

20
Thus, more productive firms are more likely to generate a higher share of total sales
abroad. However, in the industries computer and related activities, and research and
development the positive coefficients are not significant at any conventional level.
[Table 6 near here]
The fractional logit model is estimated in order to calculate the generalised
propensity score (GPS). As Imbens (2000) shows, adjusting for the GPS removes all
the bias associated with differences in covariates between treated (exporting) and
non-treated (non-exporting) firms. Thus, in the second stage of Hirano and Imbens’
GPS methodology the conditional expectation of the rate of profit in 2005 (outcome)
is modelled as a function of the export intensity in 2004 (treatment) and the estimated
generalised propensity score. To approximate the predictor for the conditional
expectation of the outcome we use a polynomial function with a cubic term of the
treatment variable and a cubic term of the estimated GPS. In the last stage of the
GPS method, the average expected outcome at each export intensity (treatment
level) in the interval from zero to one is estimated, using the regression coefficients
from the second stage of the GPS method. Thus we obtain an estimate of the entire
dose-response function that shows the average potential outcome at each dose of
the treatment and how average responses vary along the interval from zero to one.
The confidence intervals of the dose-response functions in this paper are determined
via bootstrapping.17
17 Computations were done using Stata 10 and the Stata package for the estimation of dose-response
functions (see Bia and Mattei (2008)) that was adjusted by the authors concerning the use of the
fractional logit model in the first step of the GPS method.

21
The dose-response function that represents the expected profitability
conditional on the export-sales ratio and the GPS is depicted in Figure 1.
[Figure 1 near here]
Due to the fact that only a small number of firms in the data set have an export
intensity that is greater than 50 percent (see Table 2), we restrict our interpretation
on the export intensity interval from zero to 50 percent. The estimated dose-response
function for all business services sectors (NACE 72 to 74) shows an s-shaped
relationship between profitability in 2005 and firms’ export-sales ratio in 2004. The
maximum value of the rate of profit is reached at an export-sales ratio of 44 percent,
where the expected value of the rate of profit amounts to 18.5 percent. Enterprises
that do not export show an expected rate of profit of 17.7 percent. The same picture
arises when looking at the more disaggregated industry level: In enterprises with a
very small share of exports in total sales the rate of profit falls below the profitability
level of non-exporting firms. Then, with increasing export intensity the rate of profit
increases, too. However, even at the maximum the average profitability of the
exporters is at most slightly higher than the average rate of profit of the non-exporting
firms.18 Beyond the maximum, firms exhibit a decrease in profitability compared to
firms with lower export intensities. This decrease might be a result of additional costs
of exporting, for instance due to rising costs of coordination and control of a firm’s
18 Exceptions are the business consultancy, market research, etc. sector (NACE 74.1) and the
research and development sector (NACE 73) where the profitability level of exporters at the maximum
is 16 percentage points or 8 percentage points respectively higher than the value of non-exporters.
However, note that the bootstrapped confidence intervals are very large at the maximum of these two
sectors.

22
export activities, or higher travel or transportation costs due to the increasing
geographical distance of the foreign markets a firm has entered.
The results we obtained in this section are very similar to those described in
section 4. At least, the estimation results without fixed enterprise effects as reported
in columns 1 to 4 of Table 3 show an s-shaped relationship between profitability and
the export-sales ratio. Based on the estimated function for all business services
industries on column 4, the rate of profit reaches its maximum for an export-sales
ratio of 78 percent whereas according to the estimated dose-response function the
rate of profit reaches its maximum for an export intensity of 44 percent. According to
the results of section 4, even at the maximum, exporters have a lower predicted rate
of profit than the average profitability level of non-exporters. By contrast, the analysis
based on the estimated dose-response function shows a profitability level of
exporters at the maximum that is slightly higher than the profitability level of non-
exporters. However, due to the fact that this difference is smaller than one
percentage point and that only a few firms in the business service sector have a
export intensity that is higher than 40 percent this difference is not economically
relevant.
7. Conclusion
This paper presents descriptive evidence and results from econometric investigations
that suggest that – contrary to firms from manufacturing industries – German firms in
business services industries do not benefit from exporting in terms of a higher rate of
profit. Given that exporting firms are more productive than non-exporting firms in both
manufacturing and services industries in Germany this means that in the services
sector (but not in manufacturing) any cost advantage due to higher productivity is

23
“eaten up” by higher costs related to export activities, or by higher wages paid in
exporting compared to non-exporting firms.
We document that the negative profitability differential of services exporters
compared to non-exporters is very small when observed firm characteristics and
unobserved firm specific effects are controlled for. Therefore, exporting seems to be
a business that is neither better nor worse than selling on the national market. The
estimated dose-response function shows an s-shaped relationship between
profitability and firms’ export-sales ratio. Enterprises with a very small share of
exports in total sales have a lower rate of profit than non-exporting firms. Then, with
an increase in export intensity the rate of profit increases, too. This might be
interpreted as follows: If services firms that start to export do so by exporting a small
share of their total sales only they will face a decline in their rate of profit due to extra
costs caused by export activities. If the share of exports in total sales increases over
time, profits will rise up to the level earned on the national market – or the firms will
leave the export market. Unfortunately, however, it is not possible to test whether this
interpretation holds with the short panel of service firms available.
Given that Germany is one of the leading actors on the world market for both
goods and services, the evidence provided here is interesting on its own.
Furthermore, it can serve as a benchmark for future studies using comparable data
for firms from services industries in other countries.
References
Bausch, Andreas / Krist, Mario (2007): “The Effect of Context-Related Moderators on
the Internationalization-Performance Relationship: Evidence from Meta-
Analysis”, Management International Review 47, 319-347.

24
Bernard, Andrew B. / Jensen, J. Bradford / Redding, Stephen J. / Schott, Peter K.
(2007): “Firms in International Trade”, Journal of Economic Perspectives 21,
105-130.
Bia, Michela / Mattei, Alessandra (2008): “A Stata package for the estimation of the
dose-response function through adjustment for the generalized propensity
score”, The Stata Journal 8, 354 – 373.
Bundesminsterium für Wirtschaft und Technologie (2009): “Internationaler
Dienstleistungshandel – Handelshemmnisse und Potenzial für Deutschland“,
Schlaglichter der Wirtschaftspolitik, Ausgabe 04-2009, 13-17.
Contractor, Farok J. (2007): “Is International Business Goof for Companies? The
Evolutionary or Multi-Stage Theory of Internationalization vs. the Transaction
Cost Perspective”, Management International Review 47, 453-475.
Deutsche Bundesbank (2008): Balance of Payments, www.bundesbank.de,
December.
Eickelpasch, Alexander (2008): “Export Orientation of Service Companies on the
Increase”, DIW Weekly Report 4, 28-35.
European Commission (1998): Commission Regulation (EC) No. 2700/98 concerning
the definitions of characteristics for structural business statistics, Brussels.
Flores, Carlos A. (2004): “Estimation of Dose-Response Functions and Optimal
Doses with a Continuous Treatment”, Job Market Paper, University of
California, Berkeley.
Fryges, Helmut (2008): “The Export-Growth Relationship: Estimating a Dose-
Response Function”, Applied Economics Letters, forthcoming.

25
Fryges, Helmut / Wagner, Joachim (2008a): “Exports and Profitability – First
Evidence for German Manufacturing Firms”, The World Economy,
forthcoming.
Fryges, Helmut / Wagner, Joachim (2008b): “Exports and Productivity Growth – First
Evidence from a Continuous Treatment Approach”, Review of World
Economics / Weltwirtschaftliches Archiv 144, 695-722.
Hirano, Keisuke / Imbens, Guido W. (2004): “The Propensity Score with Continuous
Treatments”, in: Gelman, Andrew / Meng, Xiao-Li (eds.): Applied Bayesian
Modeling and Causal Inference from Incomplete-Data Perspectives,
Chichester: Wiley, 73-84.
Imbens, Guido W. (2000): “The Role of the Propensity Score in Estimating Dose-
Response Functions”, Biometrika 87, 706-710.
Jensen, J. Bradford / Kletzer, Lori G. (2006): “Tradable Services: Understanding the
Scope and Impact of Services Offshoring”, in Brainard, Lael / Collins, Susan
M. (eds.), Offshoring White-Collar Work – Issues and Implications. Brookings
Trade Forum 2005, 75 – 134.
Mayer, Thierry / Ottaviano, Gianmarco I. P. (2007): The Happy Few: The
internationalisation of European firms. New facts based in firm-level evidence.
Brussels: Bruegel.
McLaughlin, Curtis P. / Fitzsimmons, James A. (1996): “Strategies for Globalizing
Service Operations”, International Journal of Service Industry Management 7,
43-57.
Papke, Leslie E./ Wooldridge, Jeffrey Marc (1996): “Econometric Methods for
Fractional Response Variables with an Application to 401(K) Plan Participation
Rates”, Journal of Applied Econometrics 11, 619-632.

26
Schank, Thorsten / Schnabel, Claus / Wagner, Joachim (2007): “Do exporters really
pay higher wages? First evidence from German linked employer-employee
data”, Journal of International Economics 72, 52-74.
Schmalensee, Richard (1989): Inter-Industry Studies of Structure and Performance,
in: Schmalensee, Richard / Willig, Robert D. (Ed.), Handbook of Industrial
Organization, Volume II, Amsterdam etc.: North-Holland, 951-1009.
The International Study Group on Exports and Productivity (2008): “Understanding
Cross-Country Differences in Exporter Premia – Comparable Evidence for 14
Countries”, Review of World Economics / Weltwirtschaftliches Archiv 144, 596-
635.
Vogel, Alexander (2009a): “Exporter Performance in the German Business Services
Sector: First Evidence from the Services Statistics Panel”, The Service
Industries Journal, forthcoming.
Vogel, Alexander (2009b): “The German Business Services Statistics Panel 2003 –
2007”, Schmollers Jahrbuch / Journal of Applied Social Science Studies 129,
forthcoming.
Wagner, Joachim (2001): “A Note on the Firm Size – Export Relationship”, Small
Business Economics 17, 229-237.
Wagner, Joachim (2003): “Unobserved Firm Heterogeneity and the Size-Exports
Nexus: Evidence from German Panel Data”, Review of World Economics 139,
161-172.
Wagner, Joachim (2007): “Exports and Productivity: A Survey of the Evidence from
Firm Level Data”, The World Economy 30, 60-82.
Winsted, Kathryn Frazer / Patterson, Paul G. (1998): “Internationalization of Services:
The Service Exporting Decision”, Journal of Services Marketing 12, 294-311.

27
Zühlke, Sylvia / Zwick, Markus / Scharnhorst, Sebastian / Wende, Thomas (2004):
“The research data centres of the Federal Statistical Office and the statistical
offices of the Länder”, Schmollers Jahrbuch / Journal of Applied Social
Science Studies 124, 567-578.

28
Figure 1: Estimated dose-response functions of the treatment export intensity in 2004 on the outcome rate of profit in 2005
All business services (NACE 72 to 74)
Computer and related activities (NACE 72)
Research and development (NACE 73)
0.1
.2.3
rate
of p
rofit
0 .2 .4 .6 .8 1export-sales ratio
-.10
.1.2
.3
rate
of p
rofit
0 .2 .4 .6 .8 1export-sales ratio
-.4-.3
-.2-.1
0.1
.2.3
.4
rate
of p
rofit
0 .2 .4 .6 .8 1export-sales ratio
Other business activities
(NACE 74 without 74.1 and 74.2) Business consultancy, market research, etc*
(NACE 74.1) Architectural and engineering activities
(NACE 74.2)
0.1
.2.3
rate
of p
rofit
0 .2 .4 .6 .8 1export-sales ratio
0.1
.2.3
.4.5
.6
rate
of p
rofit
0 .2 .4 .6 .8 1export-sales ratio
-.2-.1
0.1
.2.3
rate
of p
rofit
0 .2 .4 .6 .8 1export-sales ratio
Note: The solid lines indicate the estimated conditional expectation of enterprises’ profits given the export intensity in t and the estimated generalised propensity score (GPS). The dotted lines indicate the simulated confidence bounds at 95% (based on bootstrapping with 100 replications). Only enterprises of the NACE division 72 to 74 with a turnover greater than €250,000 are considered. The 1st and 99th percentiles of the rate of profit distribution are excluded from all computations. (*) NACE code 74.1 includes legal, accounting, book-keeping and auditing activities; tax consultancy; market research and public opinion polling; and business and management consultancy.
29
Table 1: Export activities of business services enterprises 2003 and 2005 - Share of exporting enterprises in all enterprises (percentage) All business services
(NACE 72 to 74) Computer and
related activities (NACE 72)
Research and development (NACE 73)
Other business activities
(NACE 74 without 74.1 and 74.2)
Business consultancy, market
research, etc* (NACE 74.1)
Architectural and engineering
activities (NACE 74.2)
Year Export intensity Share of exporting enterprises on all enterprises in percentages 2003 0% 86.29 75.39 65.90 87.79 86.96 90.99 > 0% and < 5% 6.38 10.00 8.47 6.10 6.97 3.14 ≥ 5% and < 10% 1.92 4.04 5.22 1.53 1.71 1.35 ≥ 10% and < 25% 2.22 4.23 5.64 1.66 1.93 2.13 ≥ 25% and < 50% 1.58 3.67 6.47 1.44 1.20 0.94 ≥ 50% and < 75% 0.79 1.57 4.27 0.81 0.57 0.49 ≥ 75% 0.82 1.10 4.02 0.67 0.67 0.95 2005 0% 84.32 74.45 63.96 85.87 85.73 87.31 > 0% and < 5% 7.05 9.52 9.00 7.15 7.12 4.80 ≥ 5% and < 10% 2.06 3.95 5.53 1.57 1.71 2.02 ≥ 10% and < 25% 2.66 5.47 7.03 2.31 2.10 2.14 ≥ 25% and < 50% 1.80 2.94 6.35 1.47 1.56 1.72 ≥ 50% and < 75% 0.97 1.76 3.78 0.81 0.86 0.70 ≥ 75% 1.13 1.92 4.35 0.82 0.92 1.31 Note: (*) NACE code 74.1 includes legal, accounting, book-keeping and auditing activities; tax consultancy; market research and public opinion polling; and business and management consultancy. Only enterprises of the NACE division 72 to 74 with a turnover greater than €250,000 are considered. All values are weighted with cross-sectional weights. The 1st and 99th percentiles of the rate of profit distribution are excluded from all computations.

30
Table 2: Rate of profite (percentage) for enterprises in different classes of the export intensity (2003 and 2005) – All business services All business services (NACE division 72 to 74) Rate of profit (in percent) Year
Export intensity
Number of enterprises Mean Standard
deviation p1 p25 p50 p75 p99
2003 0% 19,279 27.46 25.96 -33.80 8.65 25.27 44.44 90.80 > 0% and < 5% 1,759 25.13 23.72 -25.79 7.51 21.60 42.62 84.63 ≥ 5% and < 10% 521 23.90 27.00 -42.28 4.79 20.49 42.27 81.29 ≥ 10% and < 25% 669 19.25 25.48 -40.99 4.12 16.09 34.24 91.21 ≥ 25% and < 50% 423 23.50 27.72 -40.43 4.88 19.14 41.94 91.17 ≥ 50% and < 75% 205 18.63 28.99 x 4.14 18.53 36.66 x ≥ 75% 220 14.43 27.79 x 2.05 13.65 26.38 x 2005 0% 20,416 25.16 26.67 -41.06 5.62 22.28 42.81 90.40 > 0% and < 5% 2,033 21.20 23.81 -31.13 4.38 16.88 36.84 77.09 ≥ 5% and < 10% 620 17.06 22.74 -34.87 1.82 12.97 30.75 79.71 ≥ 10% and < 25% 810 18.67 27.62 -71.82 1.85 13.23 39.27 82.57 ≥ 25% and < 50% 521 17.27 27.28 -59.16 1.54 12.40 32.46 89.79 ≥ 50% and < 75% 238 22.66 30.12 x 3.47 23.89 42.91 x ≥ 75% 296 19.99 30.23 x 2.58 14.75 40.16 x Note: (x) Due to the small number of observations these values were not revealed for publication by the statistical office. Only enterprises of the NACE division 72 to 74 with a turnover greater than €250,000 are considered. All values (except the number of enterprises) are weighted with cross-sectional weights. The 1st and 99th percentiles of the rate of profit distribution are excluded from all computations.

31
Table 3: Exports and profits: Evidence from regression models (2003 – 2005), all business services (NACE divisions 72 to 74) Endogenous variable: Rate of profit (percentage) Pooled Data Fixed enterprise effects Model 1 2 3 4 5 6 7 8 Exogenous variable
Exporter ß -3.82 -0.71 (Dummy; 1 = yes) p-value 0.000 0.052 Export intensity ß -0.0737 -0.2259 -0.4105 -0.0286 -0.0599 -0.0906 (percentage) p-value 0.000 0.000 0.000 0.021 0.119 0.206 Export intensity ß 0.002 0.00906 0.000385 0.00155 (squared) p-value 0.000 0.000 0.381 0.526 Export intensity ß -0.000055 -0.000009 (cubic) p-value 0.000 0.631 Number of employees ß -0.00494 -0.00525 -0.00517 -0.00513 -0.00186 -0.00188 -0.00185 -0.00185 p-value 0.000 0.000 0.000 0.000 0.232 0.230 0.235 0.236 Number of employees ß 2.28e-07 2.39e-07 2.36e-07 2.35e-07 4.49e-8 4.51e-8 4.46e-8 4.45e-8 (squared) p-value 0.001 0.001 0.001 0.001 0.189 0.186 0.191 0.192 Constant ß 20.99 20.57 20.71 20.77 17.27 17.28 17.31 17.31 p-value 0.000 0.000 0.000 0.000 0.000 0.000 0.000 0.000 Interaction terms of year and 4-digit industry included included included included included included included included Number of observation 72,139 72,139 72,139 72,139 72,139 72,139 72,139 72,139 R² 0.124 0.122 0.123 0.123 0.002 0.001 0.001 0.001 Note: Only enterprises of the NACE division 72 to 74 with a turnover greater than €250,000 are considered. The p-values are based on cluster robust standard errors. The 1st and 99th percentiles of the rate of profit distribution are excluded from all computations.

32
Table 4: Profit premia of exporters (2003 – 2005): Evidence from regression models by service industries All business
services (NACE 72 to 74)
Computer and related activities
(NACE 72)
Research and development (NACE 73)
Other business activities
(NACE 74 without 74.1 and 74.2)
Business consul-tancy, market research, etc* (NACE 74.1)
Architectural and engineering
activities (NACE 74.2)
Profit premia (percentage points) of exporters (2003-2005)**
Profit Premia of exporters ß -3.82 -3.23 -2.94 -2.72 -3.35 -7.32 (pooled model 2003 to 2005) p-value 0.000 0.000 0.050 0.000 0.000 0.000 Profit Premia of exporters ß -0.71 -1.68 -1.06 -0.96 0.78 -2.88 (fixed effects model 2003 to 2005) p-value 0.052 0.034 0.646 0.142 0.195 0.024 Number of observations 72,139 11,800 2,010 26,405 23,227 8,697 Note: (*) NACE code 74.1 includes legal, accounting, book-keeping and auditing activities; tax consultancy; market research and public opinion polling; and business and management consultancy. (**) Only enterprises of the NACE division 72 to 74 with a turnover greater than €250,000 are considered. The profit premia are estimated regression coefficients of a dummy variable (taking the value one for exporters, and zero for non-exporters) from an OLS-regression on the rate of profit on this dummy, controlling for the number of employees and its squared value, and a full set of interaction terms of year and 4-digit industry dummies. The p-values are based on cluster robust standard errors. The 1st and 99th percentiles of the rate of profit distribution are excluded from all computations.

33
Table 5: Profit premia of firms that start to export in 2005: Evidence from regression models by service industries All business
services (NACE 72 to 74)
Computer and related activities
(NACE 72)
Research and development (NACE 73)
Other business activities
(NACE 74 without 74.1 and 74.2)
Business consul-tancy, market research, etc* (NACE 74.1)
Architectural and engineering
activities (NACE 74.2)
Profit premia (percentage points) of enterprises that start to export in 2005**
Profit premia of export starters ß -2.18 -3.64 -1.77 -3.73 -2.12 -8.71 in the start year p-value 0.012 0.049 0.765 0.009 0.165 0.000 Pre-entry profit premia of export ß -3.97 -0.35 -0.65 -2.94 -0.63 -6.24 starters two years before start p-value 0.000 0.846 0.874 0.050 0.681 0.016 Number of observations 12,915 1,763 253 5,095 4,157 1,647 Note: (*) NACE code 74.1 includes legal, accounting, book-keeping and auditing activities; tax consultancy; market research and public opinion polling; and business and management consultancy. (**) Only starters (enterprises with no export activities in 2003 and 2004, but export activities in 2005) and non-starters (enterprises that do not export between 2003 and 2005) of the NACE division 72 to 74 with a turnover greater than €250,000 are considered. The profit premia are estimated regression coefficients of a dummy variable (taking the value one for export starters, and zero for non-starters) from an OLS-regression on the rate of profit on this dummy, controlling for the number of employees and its squared value, and a set of 4-digit industry dummies. The p-values are based on robust standard errors. The 1st and 99th percentiles of the rate of profit distribution are excluded from all computations.

34
Table 6: Determinants of the export-sales ratio 2004 (endogenous variable) – results of fractional logit models All business
services (NACE 72 to 74)
Computer and related activities
(NACE 72)
Research and development (NACE 73)
Other business activities
(NACE 74 without 74.1 and 74.2)
Business consul-tancy, market research, etc* (NACE 74.1)
Architectural and engineering
activities (NACE 74.2)
Number of employees (log) ß 0.2896 0.2970 0.2554 0.0601 0.5194 0.3255 p-value 0.001 0.073 0.348 0.713 0.007 0.307 Number of employees (squared) ß -0.0135 -0.0094 -0.0170 0.0076 -0.0412 -0.0052 (log) p-value 0.222 0.651 0.625 0.689 0.107 0.887 Wage per employee (log) ß 0.3453 0.3895 0.5972 0.3697 0.3453 -0.0531 p-value 0.000 0.035 0.015 0.002 0.005 0.861 Part-time workers (in percent) ß 0.0006 0.0080 0.0009 -0.0031 0.0039 -0.0100 p-value 0.728 0.065 0.875 0.315 0.224 0.114 Labour productivity (value added ß 0.3244 0.1407 0.1322 0.2417 0.4386 0.5475 per employee) in t-1 (log) p-value 0.000 0.178 0.472 0.000 0.000 0.000 Purchased goods and services for ß 0.0002 -0.0083 -0.0038 -0.0014 0.0011 0.0099 resale (in percent of turnover ) p-value 0.920 0.017 0.665 0.607 0.760 0.014 Constant ß -10.8828 -8.8485 -11.5688 -9.4074 -14.0707 -10.2949 p-value 0.000 0.000 0.000 0.000 0.000 0.002 Eastern-Germany, Legal status, included included included included included included and 4-digit industry dummies Number of observations 16,520 2,735 465 6,195 5,111 2,014 Note: (*) NACE code 74.1 includes legal, accounting, book-keeping and auditing activities; tax consultancy; market research and public opinion polling; and business and management consultancy. Only enterprises of the NACE division 72 to 74 with a turnover greater than €250,000 are considered. The p-values are based on robust standard errors. The 1st and 99th percentiles of the rate of profit distribution are excluded from all computations.

Working Paper Series in Economics (recent issues)
No.128: Sebastian Troch: Drittelbeteiligung im Aufsichtsrat – Gesetzliche Regelung versus Unternehmenspraxis. Ausmaß und Bestimmungsgründe der Umgehung des Drittelbeteiligungsgesetzes in Industrieunternehmen, Mai 2009
No.127: Alexander Vogel: The German Business Services Statistics Panel 2003 to 2007, May 2009 [forthcoming in: Schmollers Jahrbuch 129 (2009)]
No.126: Nils Braakmann: The role of firm-level and regional human capital fort he social returns to education – Evidence from German social security data, April 2009
No.125: Elke Bertke und Markus Groth: Angebot und Nachfrage nach Umweltleistungen in einem marktanalogen Agrarumweltprogramm – Ergebnisse einer Pilotstudie, April 2009
No.124: Nils Braakmann and Alexander Vogel: The impact of the 2004 EU-enlargement on enterprise performance and exports of service enterprises in the German eastern border region, April 2009
No.123: Alexander Eickelpasch and Alexander Vogel: Determinants of Export Behaviour of German Business Services Companies, March 2009
No.122: Maik Heinemann: Stability under Learning of Equilibria in Financial Markets with Supply Information, March 2009
No.121: Thomas Wein: Auf der Speisekarte der DPAG: Rechtliche oder ökonomische Marktzutrittsschranken? März 2009
No.120: Nils Braakmann und Joachim Wagner: Product Diversification and Stability of Employment and Sales: First Evidence from German Manufacturing Firms, February 2009
No.119: Markus Groth: The transferability and performance of payment-by-results biodiversity conservation procurement auctions: empirical evidence from northernmost Germany, February 2009
No.118: Anja Klaubert: Being religious – A Question of Incentives? February 2009
No.117: Sourafel Girma, Holger Görg and Joachim Wagner: Subsidies and Exports in Germany. First Evidence from Enterprise Panel Data, January 2009
No.116: Alexander Vogel und Joachim Wagner: Import, Export und Produktivität in niedersächsischen Unternehmen des Verarbeitenden Gewerbes, Januar 2009
No.115: Nils Braakmann and Joachim Wagner: Product Differentiation and Profitability in German Manufacturing Firms, January 2009
No.114: Franziska Boneberg: Die Drittelmitbestimmungslücke im Dienstleistungssektor: Ausmaß und Bestimmungsgründe, Januar 2009
No.113: Institut für Volkswirtschaftslehre: Forschungsbericht 2008, Januar 2009
No.112: Nils Braakmann: The role of psychological traits and the gender gap in full-time employment and wages: Evidence from Germany. January 2009
No.111: Alexander Vogel: Exporter Performance in the German Business Services Sector: First Evidence from the Services Statistics Panel. January 2009 [revised version forthcoming in: The Service Industries Journal]
No.110: Joachim Wagner: Wer wird subventioniert? Subventionen in deutschen Industrieunternehmen 1999 – 2006. Januar 2009

No.109: Martin F. Quaas, Stefan Baumgärtner, Sandra Derissen, and Sebastian Strunz: Institutions and preferences determine resilience of ecological-economic systems. December 2008
No.108: Maik Heinemann: Messung und Darstellung von Ungleichheit. November 2008
No.107: Claus Schnabel & Joachim Wagner: Union Membership and Age: The inverted U-shape hypothesis under test. November 2008
No.106: Alexander Vogel & Joachim Wagner: Higher Productivity in Importing German Manufacturing Firms: Self-selection, Learning from Importing, or Both? November 2008 [revised version forthcoming in: Review of World Economics]
No.105: Markus Groth: Kosteneffizienter und effektiver Biodiversitätsschutz durch Ausschreibungen und eine ergebnisorientierte Honorierung: Das Modellprojekt „Blühendes Steinburg“. November 2008
No.104: Alexander Vogel & Joachim Wagner: Export, Import und Produktivität wissensintensiver KMUs in Deutschland. Oktober 2008
No.103: Christiane Clemens & Maik Heinemann: On Entrepreneurial Risk – Taking and the Macroeconomic Effects Of Financial Constraints, October 2008
No.102: Helmut Fryges & Joachim Wagner: Exports and Profitability – First Evidence for German Manufacturing Firms. October 2008
No.101: Heike Wetzel: Productivity Growth in European Railways: Technological Progress, Efficiency Change and Scale Effects. October 2008
No.100: Henry Sabrowski: Inflation Expectation Formation of German Consumers: Rational or Adaptive? October 2008
No.99: Joachim Wagner: Produktdifferenzierung in deutschen Industrieunternehmen 1995 – 2004: Ausmaß und Bestimmungsgründe, Oktober 2008
No.98: Jan Kranich: Agglomeration, vertical specialization, and the strength of industrial linkages, September 2008
No.97: Joachim Wagner: Exports and firm characteristics - First evidence from Fractional Probit Panel Estimates, August 2008
No.96: Nils Braakmann: The smoking wage penalty in the United Kingdom: Regression and matching evidence from the British Household Panel Survey, August 2008
No.95: Joachim Wagner: Exportaktivitäten und Rendite in niedersächsischen Industrieunternehmen, August 2008 [publiziert in: Statistische Monatshefte Niedersachsen 62 (2008), 10,552-560]
No.94: Joachim Wagner: Wirken sich Exportaktivitäten positiv auf die Rendite von deutschen Industrieunternehmen aus?, August 2008 [publiziert in: Wirtschaftsdienst, 88 (2008) 10, 690-696]
No.93: Claus Schnabel & Joachim Wagner: The aging of the unions in West Germany, 1980-2006, August 2008 [forthcoming in: Jahrbücher für Nationalökonomie und Statistik]
No.92: Alexander Vogel and Stefan Dittrich: The German turnover tax statistics panels, August 2008 [published in: Schmollers Jahrbuch 128 (2008), 4, 661-670]

No.91: Nils Braakmann: Crime does pay (at least when it’s violent!) – On the compensating wage differentials of high regional crime levels, July 2008
No.90: Nils Braakmann: Fields of training, plant characteristics and the gender wage gap in entry wages among skilled workers – Evidence from German administrative data, July 2008
No.89: Alexander Vogel: Exports productivity in the German business services sector: First evidence from the Turnover Tax Statistics panel, July 2008
No.88: Joachim Wagner: Improvements and future challenges for the research infrastructure in the field Firm Level Data, June 2008
No.87: Markus Groth: A review of the German mandatory deposit for one-way drinks packaging and drinks packaging taxes in Europe, June 2008
No.86: Heike Wetzel: European railway deregulation. The influence of regulatory ans environmental conditions on efficiency, May 2008
No.85: Nils Braakmann: Non scholae, sed vitae discimus! - The importance of fields of study for the gender wage gap among German university graduates during market entry and the first years of their careers, May 2008
No.84: Markus Groth: Private ex-ante transaction costs for repeated biodiversity conservation auctions: A case study, May 2008
No.83: Jan Kranich: R&D and the agglomeration of industries, April 2008 No.82: Alexander Vogel: Zur Exporttätigkeit unternehmensnaher Dienstleister in
Niedersachsen - Erste Ergebnisse zu Export und Produktivität auf Basis des Umsatzsteuerstatistikpanels, April 2008
No.81: Joachim Wagner: Exporte und Firmenerfolg: Welche Firmen profitieren wie vom internationalen Handel?, März 2008
No.80: Stefan Baumgärtner: Managing increasing environmental risks through agro-biodiversity and agri-environmental policies, March 2008
No.79: Thomas Huth: Die Quantitätstheorie des Geldes – Eine keynesianische Reformulierung, März 2008
No.78: Markus Groth: An empirical examination of repeated auctions for biodiversity conservation contracts, March 2008
No.77: Nils Braakmann: Intra-firm wage inequality and firm performance – First evidence from German linked employer-employee-data, February 2008
No.76: Markus Groth: Perspektiven der Nutzung von Methanhydraten als Energieträger – Eine Bestandsaufnahme, Februar 2008
No.75: Stefan Baumgärtner, Christian Becker, Karin Frank, Birgit Müller & Christian Quaas: Relating the philosophy and practice of ecological economics. The role of concepts, models, and case studies in inter- and transdisciplinary sustainability research, January 2008 [publisched in: Ecological Economics 67 (2008), 3 , 384-393]
No.74: Thorsten Schank, Claus Schnabel & Joachim Wagner: Higher wages in exporting firms: Self-selection, export effect, or both? First evidence from German linked employer-employee data, January 2008
No.73: Institut für Volkswirtschaftslehre: Forschungsbericht 2007, Januar 2008 (see www.leuphana.de/vwl/papers for a complete list)

Leuphana Universität Lüneburg
Institut für Volkswirtschaftslehre
Postfach 2440
D-21314 Lüneburg
Tel.: ++49 4131 677 2321
email: [email protected]
www.leuphana.de/vwl/papers