exporters, jobs, and wages in u.s. manufacturing: 1976 · pdf fileandrew b. bernard...
TRANSCRIPT

ANDREW B. BERNARD Massachusetts Institute of Technology
J. BRADFORD JENSEN Center for Economic Studies, U.S. Bureau of the Census
Exporters, Jobs, and Wages in U.S. Manufacturing: 1976-1987
PERHAPS AT NO POINT in recent years has the debate over the direction of trade policy so demanded public attention. Whether it has been Al Gore and Ross Perot clashing on national television about the merits and pitfalls of the North American Free Trade Agreement (NAFTA), or individual members of Congress attempting to provide additional protection for domestic industries in the General Agreement on Tariffs and Trade (GATT), the debate over the pace and scope of changes in trade regulations and tariffs has been omnipresent. Both proponents and opponents of NAFTA and GATT have argued that the implementation of these treaties will have large and important effects on the domestic economy.
Close to the surface in this debate is the issue of U.S. manufacturing competitiveness." The experience of increasing import competition,
particularly from export-led economies such as Japan, Korea, Singa- pore, and Taiwan, concurrent with stagnant living standards during the 1970s and 1980s and decreasing employment in manufacturing, has left some people wondering aloud about the competitiveness of U.S. man- ufacturing. The concerns include the long-term viability of important
We thank Dora Costa, Mark Doms, Jon Gruber, Ron Jarmin, Frank Levy, Robert McGuckin, and Steve Pischke for helpful discussions. We also benefited from the comments of our discussants and the editors, as well as seminar participants at the Bureau of the Census and the University of Pittsburgh. Additionally, we thank Bob Taylor for assistance with the data and Emily Gallagher for table preparation. Bernard's research was supported by the World Economy Laboratory at MIT.
Opinions expressed in this paper are those of the authors and do not necessarily reflect official positions of the Bureau of the Census. All errors are ours.
67

68 Brookings Papers: Microeconomics 1995
industries and the number of jobs and level of wages associated with them.
Opponents of free trade suggest that more openness will result in lost American jobs and lower living standards. Proponents of free trade suggest that lower trade barriers will reduce the costs of goods to consumers and will provide more markets for American exporters. In the new era of global competition, politicians and the media tout ex- porters as winners, who thus should be supported. Exporters are per- ceived as being more "competitive" than nonexporters and as "good" for the economy. Exporters are believed to be more productive and profitable and to provide more and better employment opportunities. Based on the belief that exporters are good for the economy, govern- ment programs are advocated to support and advance exporting and exporters.
While the arguments rage, the scope of solid information about the role of exporters in the U.S. economy is scant. The debates, both academic and public, have centered on the ability of industries to adapt to the provisions of the treaties; however, little accompanying evidence has been presented about the effects of trade, exchange rate, or foreign demand shocks on domestic firms. Discussions usually focus on indus- tries and regions and rarely provide information about the nature of exporting plants or firms. In this paper, we step back from the contro- versies regarding the merits of free trade and explore the role of ex- porting plants in the manufacturing sector. Are exporters different from nonexporters within the same industry? If they are, are these differences meaningful in terms of performance? We provide a picture of the struc- ture of U.S. manufacturing exporters and how they perform over time.
This paper attempts to fill a gap in what is known about the role of exporters in the manufacturing sector. To our knowledge there have been no comprehensive studies of exporting at the plant or firm level. Making use of panel data on a large cross-section of manufacturing plants, we explore the role of exporting establishments in the United States and provide a multitude of facts about exporting industries and exporting establishments.' Traditionally, the study of international trade, and thus exports, has used countries or industries as the relevant
1. Recent studies examining exporters using foreign plant-level data include Bernard (1995), Revenga and Montenegro (1995), and Aw and Batra (1994).
Andrew B. Bernard and J. Bradford Jensen 69
unit of observation.2 Countries trade, and particular industries export, because of differences in technology, endowments, and the structure of production. This focus on differences at the industry level potentially masks important heterogeneity across plants within industries. We make use of exactly this heterogeneity to develop our understanding of the role of exporting in plant performance and structure.
To guide us through the vast quantity of information available from our panel of manufacturing plants, we focus on a narrowly specified set of questions. Are exporters important in the manufacturing sector in terms of shipments and employment? If so, does their structure of production differ from that of nonexporters? In particular, what is their role in the labor market-do they provide so-called "good jobs" at "'good wages'"? Finally we look at the role of exporting plants in job and wage growth. Along the way we focus on the response of domestic industries to foreign demand and exchange rate shocks.
It is not immediately obvious that exporters should be distinguished from other manufacturers. Although direct exports as a share of man- ufacturing rose from about 4 percent in 1963 to 9 percent in 1988, exports still account for a relatively small share of total output and thus economists potentially overestimate the overall importance of export- ers, and exports. We start by considering the importance of exporting establishments in total U.S. manufacturing. Although exporting estab- lishments made up only 10.4 percent of manufacturing plants in 1976 and 14.6 percent in 1987, these plants accounted for more than 50 percent of total shipments and 40 percent of total employment in both years. Exports per se are a small fraction of shipments at each plant, but the plants that manufacture them play a larger role in overall production.
Exporters are a substantial presence in the manufacturing sector, but are they different from nonexporters? Throughout the paper we focus on two main competing hypotheses. First, we assume that export mar- kets do not differ substantially from domestic markets except for their locations and associated transport costs. Under this assumption, ex- porters should not differ from their nonexporting counterparts either at any given point or in their subsequent performance.
2. For example, Katz and Summers (1989) use industry-level data on exports to investigate the effect of trade policy on wages.

70 Brookings Papers: Microeconomics 1995
Alternatively, we consider the idea that selling in international mar- kets is a special and difficult status for a plant to achieve. This assump- tion corresponds to the notion that exporters are "winners" in the global race to be competitive. If true, this hypothesis suggests that exporters should differ significantly in size and productivity from nonexporters in the same industry in any year.3 To distinguish between the hy- potheses, we consider whether exporters and nonexporters differ in their structure of production within industries.
In addition to static comparisons of the two types of plants, we consider their employment and wage growth over time. If participating in international markets provides a benefit to plants, perhaps through increased awareness of productive and market possibilities, we might expect to see faster growth at exporting plants. Conversely, if exporting plants are merely contemporaneously successful and receive no addi- tional long-term gains from selling abroad, we would expect no signif- icant differences between exporters and nonexporters.
The policy debate over trade and jobs has often focused on whether exporting industries are creating so-called "good" jobs. We concen- trate instead on the concept of "good" plants. We consider several potential interpretations of "good" plants, including those that have higher labor productivity levels, higher growth rates, above-average job creation, and higher pay. To determine if exporters offer "better" jobs than nonexporters, we test whether exporters pay higher-than- expected wages given plant and industry characteristics. Additionally, we look at their record of wage growth.
The results are revealing. Compared at a point in time, exporters exhibit "better" performance characteristics than nonexporters in every dimension. Exporters are larger, more productive, and more capital intensive. In addition, exporting establishments pay wages that are more than 14 percent higher than those paid by nonexporting plants; benefits at exporters are a third higher than at nonexporters. On average during 1976-87, a production worker in an exporting plant with 250- 499 employees earned $3,429 more a year than a production worker in a nonexporting plant of the same size. Nonproduction workers earned $2,479 more in those same exporting plants.4 After controlling for other
3. This approach sidesteps the more difficult question of why exporters are different. 4. These numbers are calculated in 1987 dollars.

Andrew B. Bernard and J. Bradford Jensen 71
inputs and variables known to be correlated with higher wages at the plant, the export wage premium is still significant and between 7 percent and 11 percent, although industry variation accounts for much of the premium. These plant characteristics support the hypothesis that ex- porting is an activity undertaken by successful establishments.
The evidence on the benefits of export experience to the plant is mixed. Exporters do perform significantly better in the short run than nonexporters in terms of employment growth. Short-run wage growth and long-run performance in all areas are negatively correlated with export status in the initial year, however. The source of these negative correlations is not hard to find. The transition rate into and out of exporting is high; 18 percent of exporting plants leave the export market and 9 percent of nonexporters begin foreign shipments in an average year. These transition plants dominate the correlations of long-run growth with initial export status. In particular, plants that start export- ing increase employment and wages at dramatically higher rates, while plants that cease exporting fare poorly over short and long horizons.
The results show that exporters are important in terms of size and employment in the domestic economy and that they have all the char- acteristics of currently successful plants. At any point in time, exporters are larger and more productive and pay higher wages. Current export status, however, is a poor predictor of future wage and employment growth. Short- and long-term performance is conditional on the ex- porting status of the plant during the period under consideration; plants that become exporters grow the most, plants that cease exporting exhibit poor relative performance. Movement into exporting is associated with success.
Data
We use newly available, detailed plant-level data from the Census Bureau's Annual Survey of Manufactures (ASM) to investigate the relationship between exporting and plant performance. The ASM sur- veys U.S. manufacturing establishments and collects information on production and nonproduction employment, production hours, salaries and wages, shipments, value-added, capital measures, ownership struc- ture, and direct exports.
72 Brookings Papers: Microeconomics 1995
For exports, the ASM asks establishments to "report the value of products shipped for export. Include direct exports and products shipped to exporters or other wholesalers for export. Also include the value of products sold to the United States Government to be shipped to foreign governments. Do not include products shipped for further manufacture, assembly, or fabrication in the United States." To the extent that plants do not know the ultimate destination of products they ship, these directly reported exports understate the true value of exports from establishments. The ASM was conducted in every year between 1976 and 1987; however, in 1978, 1979, and 1982 the direct export question was not asked. In 1987 every plant in the Census of Manufac- tures (a census of manufacturing establishments conducted every five years) was asked to report direct exports.5 We use this census to con- struct detailed cross-section comparisons and the ASMs to examine the performance of exporters and nonexporters over time.
Although we are able to link plants' information across time, the ASM is not designed as a long-term panel, it is, instead, a series of five-year panels of U.S. manufacturing establishments. Each five years the sample is partially redrawn. Questionnaires are sent to about 56,000 of the 220,000 establishments that are surveyed in the Census of Man- ufactures. Some of the 56,000 establishments are included in the sample with certainty. These "certainty" cases include establishments with large total employment (greater than 250 employees), establishments with large value of shipments, and establishments owned by large en- terprises.6 Other establishments are sampled with probabilities ranging from 0.99 to 0.005, based on the size and industry of the establishment. The sample is designed to be representative of the population of man- ufacturing establishments in terms of industry and plant size. Establish- ments are assigned weights that are inversely proportional to their sam- pling probabilities. The weights are used to produce aggregate industry totals.
The plant level data, although limited by the nature of the panel and sampling issues, gives us the ability to identify and control for differ-
5. We do not consider "administrative records" in the Census of Manufactures. 6. Although the criteria for inclusion in the panels have changed over time, partic-
ularly between the 1974-78 ASM panel and subsequent panels, the general principle of sampling based on size and importance has held throughout the period we study.
Andrew B. Bernard and J. Bradford Jensen 73
ences between plants in the same industry.7 This capability is important because of the considerable heterogeneity that exists within industries, even at the four-digit SIC (standard industrial classification) level. Size, production techniques, output, and propensity to export all vary con- siderably across plants within the same four-digit SIC category.
Choice of Export Variable
Our definition of an exporting plant is one that reports any magnitude of direct exports in the ASM or Census. We treat export status as the relevant plant characteristic and use a dummy variable for exporting in most of our analyses. An alternative approach might treat the share of exports from the plant as the appropriate plant-level variable. At the plant level, however, export share is small and relatively stable across plants and over time. The majority of exporting establishments export a small fraction of total output; in 1987, 71.1 percent of exporters reported direct exports of less than 10 percent of total shipments, as shown in figure 1. These percentages are stable over time as well. Considering a sample of continuously operating establishments from 1976 through 1987, we find that 60 percent of exporting plants report annual changes in exports of less than 2.2 percent of total shipments. Among plants that start exporting, the median share of exported ship- ments is 2.4 percent, and similarly for plants that stop exporting, ex- ports comprise 2.5 percent of shipments at the median plant. This stability of the share of sales exported leads us to focus on exporting as a characteristic of the plant.
Export Coverage by Industry and Sample
As described above, we use two sources of plant-level data to ex- amine the role of exporters in the manufacturing sector: the 1987 Census of Manufactures primarily for cross-section analyses, and the ASM to study changes over time. Both surveys have potential drawbacks as data sources on exporting. Because these surveys capture only direct exports from establishments, they systematically undercount aggregate and in- dustry exports. To identify the magnitude of this undercount, we com- pare the ASM direct export totals to data on all exports collected by the
7. Details on the variables used in the paper are presented in the appendix.

74 Brookings Papers: Microeconomics 1995
Figure 1. Distribution of Exports as a Percentage of Sales, 1987
Percent of plants
60
50
40
30
20
10
0 0 10 20 30 40 50 60 70 80 90 100
Exports/sales
Source; Authors' calculations based on 1987 Census of Manufactures.
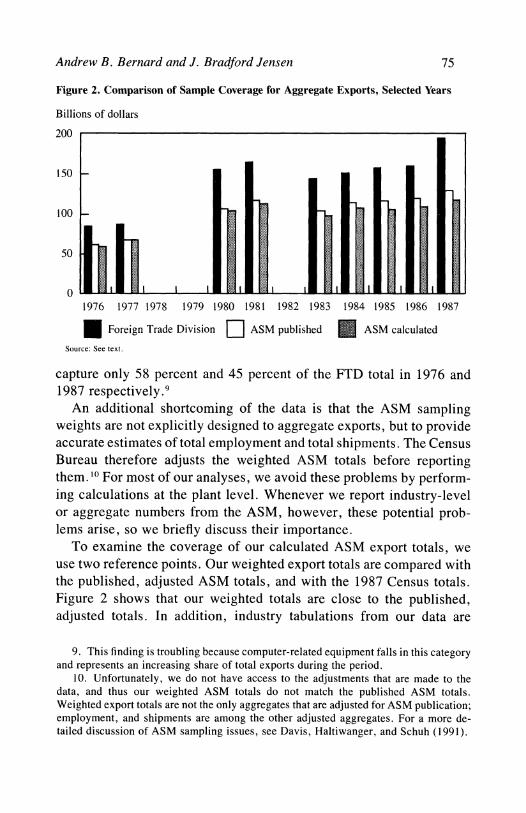
Foreign Trade Division (FTD) at the Census Bureau. The FTD data is collected at the port of export and, as a result, includes all exports. Figure 2 shows total exports from the FTD series and direct exports from the ASM. The undercounting of exports by the ASM is evident throughout the time period, averaging about 70 percent of the totals reported by the FTD, and is particularly poor for 1987, when our calculated numbers capture only 60 percent of total exports.
Coverage by two-digit industry exhibits substantial variation. When comparing industry totals from the FTD for 1976 and 1987, we find that ASM coverage is poorest in industries making up a small percent- age of total exports.8 These industries include textiles, apparel, wood, furniture, printing, leather, and miscellaneous manufacturing. The ma- jor exception is electronic equipment, which accounts for 11I percent of total exports in 1987. ASM direct exports for electronic equipment
8. Because small plants are undersampled in the ASM, industries dominated by smaller establishments are poorly covered. The poor coverage could also occur because small plants are less likely to export directly.
Andrew B. Bernard and J. Bradford Jensen 75
Figure 2. Comparison of Sample Coverage for Aggregate Exports, Selected Years
Billions of dollars
200
150-
100
50
0 1976 1977 1978 1979 1980 1981 1982 1983 1984 1985 1986 1987
Foreign Trade Division [2ASM published E ASM calculated
Source: See text.
capture only 58 percent and 45 percent of the FTD total in 1976 and 1987 respectively.9
An additional shortcoming of the data is that the ASM sampling weights are not explicitly designed to aggregate exports, but to provide accurate estimates of total employment and total shipments. The Census Bureau therefore adjusts the weighted ASM totals before reporting them. '0 For most of our analyses, we avoid these problems by perform- ing calculations at the plant level. Whenever we report industry-level or aggregate numbers from the ASM, however, these potential prob- lems arise, so we briefly discuss their importance.
To examine the coverage of our calculated ASM export totals, we use two reference points. Our weighted export totals are compared with the published, adjusted ASM totals, and with the 1987 Census totals. Figure 2 shows that our weighted totals are close to the published, adjusted totals. In addition, industry tabulations from our data are
9. This finding is troubling because computer-related equipment falls in this category and represents an increasing share of total exports during the period.
10. Unfortunately, we do not have access to the adjustments that are made to the data, and thus our weighted ASM totals do not match the published ASM totals. Weighted export totals are not the only aggregates that are adjusted for ASM publication; employment, and shipments are among the other adjusted aggregates. For a more de- tailed discussion of ASM sampling issues, see Davis, Haltiwanger, and Schuh (1991).
76 Brookings Papers: Microeconomics 1995
within 5 percent of reported ASM direct exports for almost all industries.
Because we use Census numbers to conduct the cross-section anal- yses of the characteristics of exporting establishments, we also are interested in the relationship between Census totals and their ASM counterparts. Across the twenty two-digit industries, only four show differences in total exports of more than 5 percent-apparel, wood, printing, and leather, which total less than 3 percent of direct exports. In fact, the correspondence between the export totals in the Census and the ASM is better on average than the correspondence between reported employment and shipments figures. "
Export Concentration: Sectoral and Geographic
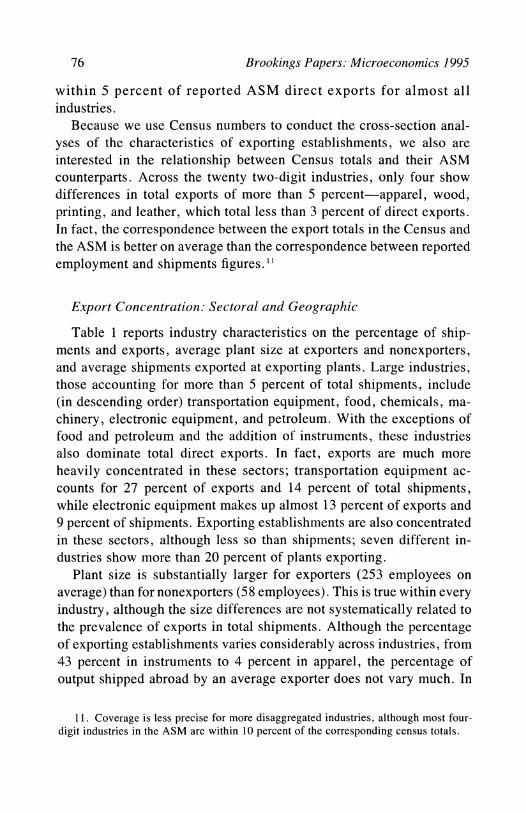
Table 1 reports industry characteristics on the percentage of ship- ments and exports, average plant size at exporters and nonexporters, and average shipments exported at exporting plants. Large industries, those accounting for more than 5 percent of total shipments, include (in descending order) transportation equipment, food, chemicals, ma- chinery, electronic equipment, and petroleum. With the exceptions of food and petroleum and the addition of instruments, these industries also dominate total direct exports. In fact, exports are much more heavily concentrated in these sectors; transportation equipment ac- counts for 27 percent of exports and 14 percent of total shipments, while electronic equipment makes up almost 13 percent of exports and 9 percent of shipments. Exporting establishments are also concentrated in these sectors, although less so than shipments; seven different in- dustries show more than 20 percent of plants exporting.
Plant size is substantially larger for exporters (253 employees on average) than for nonexporters (58 employees). This is true within every industry, although the size differences are not systematically related to the prevalence of exports in total shipments. Although the percentage of exporting establishments varies considerably across industries, from 43 percent in instruments to 4 percent in apparel, the percentage of output shipped abroad by an average exporter does not vary much. In
11. Coverage is less precise for more disaggregated industries, although most four- digit industries in the ASM are within 10 percent of the corresponding census totals.
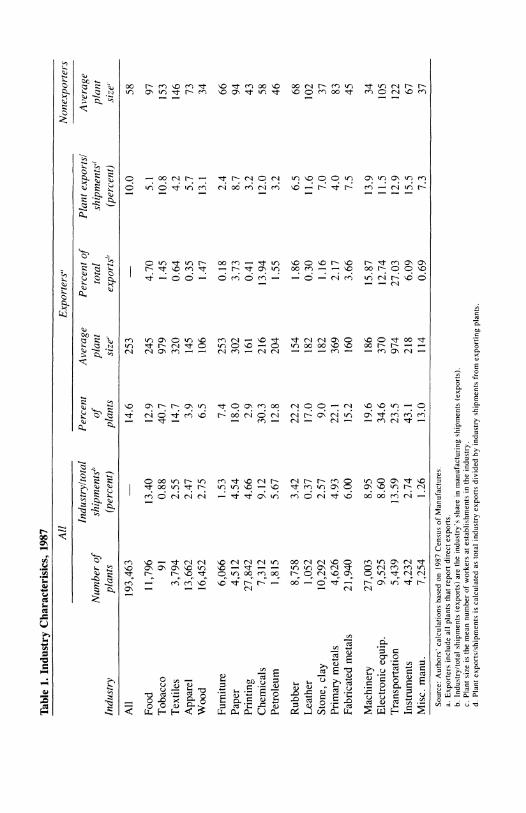
Table 1.
Industry
Characterisics,
1987 All
Exporters"
Nonexporters
Industryltotal
Percent
Average
Percent of
Plant
exportsl
Average
Number of
shipments"
of
plant
total
shipments"
plant
Industry
plants
(percent)
plants
size'
exportsb
(percenzt)
size'
All
193,463
14.6
253
10.0
58
Food
11,796
13.40
12.9
245
4.70
5.1
97
Tobacco
91
0.88
40.7
979
1.45
10.8
153
Textiles
3,794
2.55
14.7
320
0.64
4.2
146
Apparel
13,662
2.47
3.9
145
0.35
5.7
73
Wood
16,452
2.75
6.5
106
1.47
13.1
34
Furniture
6,066
1.53
7.4
253
0.18
2.4
66
Paper
4,512
4.54
18.0
302
3.73
8.7
94
Printing
27,842
4.66
2.9
161
0.41
3.2
43
Chemicals
7,312
9.12
30.3
216
13.94
12.0
58
Petroleum
1,815
5.67
12.8
204
1.55
3.2
46
Rubber
8,758
3.42
22.2
154
1.86
6.5
68
Leather
1,052
0.37
17.0
182
0.30
11.6
102
Stone,
clay
10,292
2.57
9.0
182
1.16
7.0
37
Primary
metals
4,626
4.93
22.1
369
2.17
4.0
83
Fabricated
metals
21,940
6.00
15.2
160
3.66
7.5
45
Machinery
27,003
8.95
19.6
186
15.87
13.9
34
Electronic
equip.
9,525
8.60
34.6
370
12.74
11.5
105
Transportation
5,439
13.59
23.5
974
27.03
12.9
122
Instruments
4,232
2.74
43.1
218
6.09
15.5
67
Misc.
manu.
7,254
1.26
13.0
114
0.69
7.3
37
Source:
Authors'
calculations
based on
1987
Census of
Manufactures.
a.
Exporters
include all
plants
that
report
direct
exports.
b.
Industry/total
shipments
(exports)
are
the
industry's
share in
manufacturing
shipments
(exports).
c.
Plant
size is
the
mean
number of
workers at
establishments in
the
industry.
d.
Plant
exports/shipments is
calculated as
total
industry
exports
divided by
industry
shipments
from
exporting
plants.

78 Brookings Papers: Microeconomics 1995
Table 2. Direct Exports by State, 1987
Percent of plants Exports Share of total Export sharel State exporting (millions of $) exports mfg. share
Maine 17.87 528 0.42 0.97 New Hampshire 17.14 686 0.55 1.10 Vermont 16.15 331 0.27 1.36 Massachusetts 17.28 3,755 3.02 1.20 Rhode Island 14.26 415 0.33 0.65 Connecticut 18.05 3,253 2.61 1.71
New York 10.49 7,106 5.71 1.03 New Jersey 15.06 2,287 1.84 0.55 Pennsylvania 16.68 3,926 3.16 0.66
Ohio 19.46 9,486 7.62 1.18 Indiana 17.49 3,261 2.62 0.77 Illinois 16.69 5,327 4.28 0.80 Michigan 17.07 8,961 7.20 1.23 Wisconsin 19.03 2,640 2.12 0.74
Minnesota 16.72 2,637 2.12 1.09 Iowa 18.77 1,587 1.28 0.90 Missouri 13.70 3,919 3.15 1.29 North Dakota 14.18 148 0.12 1.12 South Dakota 17.00 133 0.11 0.67 Nebraska 16.36 457 0.37 0.58 Kansas 17.26 1,150 0.93 0.75
Kentucky 15.34 1,786 1.44 0.85 Tennessee 13.41 1,996 1.61 0.68 Alabama 11.30 1,181 0.95 0.57 Mississippi 12.17 1,020 0.82 0.82
thirteen of the twenty industries, exporters ship between 7 percent and 15 percent of their total product abroad.
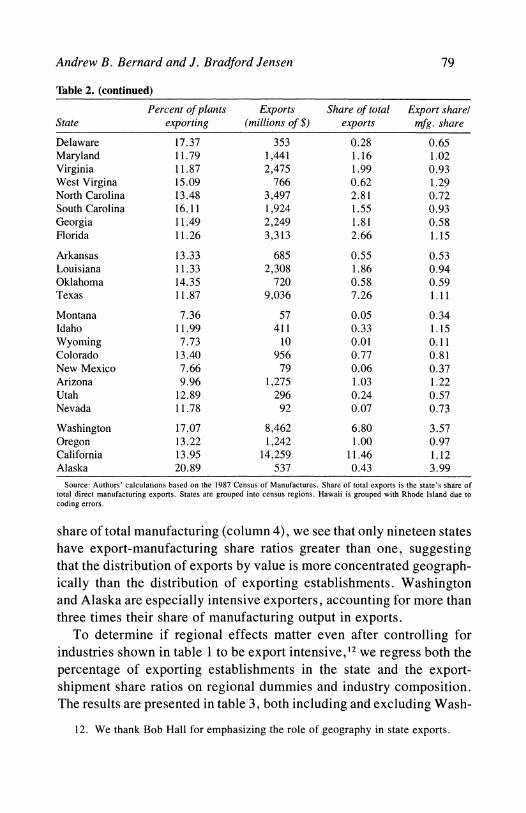
Table 2 reports export characteristics of individual states from the 1987 Census, including the percentage of plants reporting direct exports and the value of exported shipments. Nationwide, 14.6 percent of all manufacturing plants report direct exports in 1987, varying from a low of 7.4 percent in Montana to highs of 19-20 percent in Wisconsin, Ohio, and Alaska. Somewhat surprisingly, the percentage of exporting establishments varies little across states.
Looking at the value of goods exported (column 2), we find that large industrial states dominate the aggregates; California, Ohio, Michigan, and Texas each account for more than 7 percent of the national total. However, considering the ratio of the state export share to the state
Andrew B. Bernard and J. Bradford Jensen 79
Table 2. (continued)
Percent of plants Exports Share of total Export sharel State exporting (millions of $) exports mfg. share
Delaware 17.37 353 0.28 0.65 Maryland 11.79 1,441 1.16 1.02 Virginia 11.87 2,475 1.99 0.93 West Virgina 15.09 766 0.62 1.29 North Carolina 13.48 3,497 2.81 0.72 South Carolina 16.11 1,924 1.55 0.93 Georgia 11.49 2,249 1.81 0.58 Florida 11.26 3,313 2.66 1.15
Arkansas 13.33 685 0.55 0.53 Louisiana 11.33 2,308 1.86 0.94 Oklahoma 14.35 720 0.58 0.59 Texas 11.87 9,036 7.26 1.11
Montana 7.36 57 0.05 0.34 Idaho 11.99 411 0.33 1.15 Wyoming 7.73 10 0.01 0.11 Colorado 13.40 956 0.77 0.81 New Mexico 7.66 79 0.06 0.37 Arizona 9.96 1,275 1.03 1.22 Utah 12.89 296 0.24 0.57 Nevada 11.78 92 0.07 0.73
Washington 17.07 8,462 6.80 3.57 Oregon 13.22 1,242 1.00 0.97 California 13.95 14,259 11.46 1.12 Alaska 20.89 537 0.43 3.99
Source: Authors' calculations based on the 1987 Census of Manufactures. Share of total exports is the state's share of total direct manufacturing exports. States are grouped into census regions. Hawaii is grouped with Rhode Island due to coding errors.
share of total manufacturing (column 4), we see that only nineteen states have export-manufacturing share ratios greater than one, suggesting that the distribution of exports by value is more concentrated geograph- ically than the distribution of exporting establishments. Washington and Alaska are especially intensive exporters, accounting for more than three times their share of manufacturing output in exports.
To determine if regional effects matter even after controlling for industries shown in table I to be export intensive,'2 we regress both the percentage of exporting establishments in the state and the export- shipment share ratios on regional dummies and industry composition. The results are presented in table 3, both including and excluding Wash-
12. We thank Bob Hall for emphasizing the role of geography in state exports.

Table 3.
OLS
Estimates of
State
Export
Characteristics on
Region
Dummies,
1987
Dependent
variables
Percentage of
plants
exporting
Export
sharelmanufacturing
share
Independent
wlAlaska &
wlo
Alaska &
wlAlaska &
wlo
Alaska &
variables
Washington
Washington
Washington
Washinigton
Intercept
0.0638***
0.0542***
0.2108
0.1168
(0.0177)
(0.0167)
(0.2012)
(0.1105)
East
Coast
dummy
0.0070
0.0075
0.0147
0.0223
(0.0090)
(0.0083)
(0.1455)
(0.0773)
West
Coast
dummy
0.0431***
0.0147
1.576***
0.3522*
(0.0159)
(0.0200)
(0.2498)
(0.1807)
Canadian
border
dummy
0.0116
0.0063
0.59114***
0.3028***
(0.0106)
(0.0103)
(0.1605)
(0.0899)
Mexican
border
dummy
-0.0481***
-0.0429***
-0.3101
-0.0376
(0.0159)
(0.0151)
(0.2503)
(0.1362)
Gulf
Coast
dummy
-0.0115
-0.0132
0.2866
0.2057*
(0.0137)
(0.0128)
(0.2164)
(0.1150)
Great
Lakes
dummy
0.0021
0.0002
-0.1103
-0.0607
(0.0129)
(0.0120)
(0.1827)
(0.0972)
% of
output in
export-intensive
industries
0.3052***
0.3479***
1.3770***
1.7175***
(0.0697)
(0.0663)
(0.5034)
(0.2797)
Number
50
48
50
48
R2
0.48
0.54
0.62
0.57
Source:
Authors'
calculations
based on
1987
Census of
Manufactures.
Dependent
variables
are
state
percentages of
manufacturing
establishments
and
ratio of
state
share of
national
exports to
state
share of
national
manufacturing
output.
State
may
belong to
more
than
one
region.
States
are
grouped in
regions as
follows:
East
Coast-Connecticut.
Delaware,
Florida.
Georgia.
Maine.
Maryland,
Massachusetts,
New
Hampshire,
New
Jersey,
New
York,
North
Carolina,
Pennsylvania,
Rhode
Island,
South
Carolina,
Virginia;
West
Coast-Alaska,
California.
Oregon.
Washington:
Canadian
border-Alaska,
Idaho.
Maine,
Michigan,
Minnesota,
Montana,
New
Hampshire,
New
York,
New
Hampshire,
Vermont,
Washington;
Mexican
border-Arizona,
California.
New
Mexico,
Texas;
Gulf
Coast-Alabama.
Florida,
Louisiana,
Mississippi,
Texas;
and
Great
Lakes-Illinois,
Indiana,
Michigan,
Minnesota,
New
York,
Ohio,
Pennsylvania,
Wisconsin.
Export-
intensive
industries
are
defined as
those
whose
experts
total
more
than 5
percent:
chemicals,
machinery,
electronic
equipment,
transportation,
and
instruments
(See
table
I).
***Significant at
0.01
level.
*Significant at
0.10
level.

Andrew B. Bernard and J. Bradford Jensen 81
ington and Alaska. As shown in table 2, the percentage of exporting establishments does not vary much by region, a fact confirmed by the regression analysis. Only the Mexican border dummy is significant in both specifications; states along the Mexican border have lower per- centages of exporting plants. Without Alaska and Washington, the West Coast dummy is much smaller and no longer significant, although still positive. Industry composition does matter; states with higher shares of plants in export-intensive industries, such as chemicals, machinery, electronic equipment, transportation, and instruments, have signifi- cantly higher percentages of exporting plants.
Looking at the regional concentration of exporting relative to total manufacturing, we find that the ratio of national export share to national manufacturing share is more highly correlated with the region dummies, even after including the industry mix variable. Although Washington and Alaska again strongly influence both the West Coast and Canadian border dummies, they remain positive and significant even after drop- ping these two states. Throughout the subsequent analyses, we use detailed regional dummies to help control for the concentration of ex- port activity in these areas.
Characteristics of Exporting Plants
Although it is common knowledge that General Motors and Boeing are perennial top-ranked U.S. exporters, 13 few facts are available about the systematic differences between exporting and nonexporting firms or plants. In this section, we develop a basic set of facts about the pro- duction and ownership structure of exporting plants and firms. We consider whether the facts hold over time and across plants of different sizes. In addition, we provide evidence on the robustness of the facts over different industries and regions.
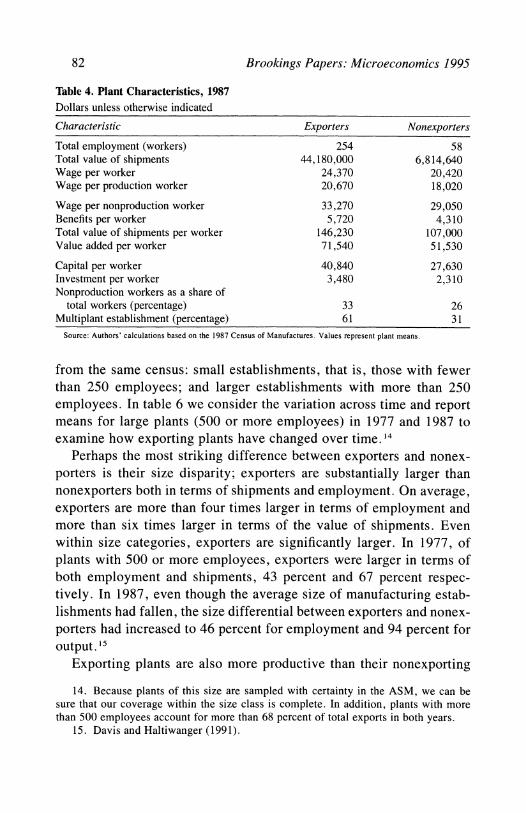
Taking the plant as the unit of analysis, we calculate plant means separately for exporting and nonexporting establishments in five cate- gories: size, labor productivity, labor inputs, capital intensity, and own- ership structure. The means for all plants in the 1987 census are reported in table 4. Table 5 calculates the means for two broad size categories
13. Rob Norton, "Strategies for the New Export Boom," Fortune, August 22, 1994, p. 132.
82 Brookings Papers: Microeconomics 1995
Table 4. Plant Characteristics, 1987 Dollars unless otherwise indicated
Characteristic Exporters Nonexporters
Total employment (workers) 254 58 Total value of shipments 44,180,000 6,814,640 Wage per worker 24,370 20,420 Wage per production worker 20,670 18,020
Wage per nonproduction worker 33,270 29,050 Benefits per worker 5,720 4,310 Total value of shipments per worker 146,230 107,000 Value added per worker 71,540 51,530
Capital per worker 40,840 27,630 Investment per worker 3,480 2,310 Nonproduction workers as a share of
total workers (percentage) 33 26 Multiplant establishment (percentage) 61 31
Source: Authors' calculations based on the 1987 Census of Manufactures. Values represent plant means.
from the same census: small establishments, that is, those with fewer than 250 employees; and larger establishments with more than 250 employees. In table 6 we consider the variation across time and report means for large plants (500 or more employees) in 1977 and 1987 to examine how exporting plants have changed over time. 14
Perhaps the most striking difference between exporters and nonex- porters is their size disparity; exporters are substantially larger than nonexporters both in terms of shipments and employment. On average, exporters are more than four times larger in terms of employment and more than six times larger in terms of the value of shipments. Even within size categories, exporters are significantly larger. In 1977, of plants with 500 or more employees, exporters were larger in terms of both employment and shipments, 43 percent and 67 percent respec- tively. In 1987, even though the average size of manufacturing estab- lishments had fallen, the size differential between exporters and nonex- porters had increased to 46 percent for employment and 94 percent for output. 15
Exporting plants are also more productive than their nonexporting
14. Because plants of this size are sampled with certainty in the ASM, we can be sure that our coverage within the size class is complete. In addition, plants with more than 500 employees account for more than 68 percent of total exports in both years.
15. Davis and Haltiwanger (1991).

Table 5.
Plant
Characteristics, by
Size
Category,
1987
Dollars
unless
otherwise
indicated
<250
Employees
250 +
Employees
Characteristic
Exporters
Nonexporters
Exporters
Nonexporters
Total
employment
(workers)
76
38
886
541
Total
value of
shipments
10,943,810
4,168,410
162,737,920
72,314,230
Wage
per
worker
23,700
20,410
26,790
20,870
Wage
per
production
worker
19,860
17,990
23,550
18,630
Wage
per
nonproduction
worker
32,760
28,990
35,040
30,550
Benefits
per
worker
5,490
4,290
6,570
4,800
Total
value of
shipments
per
worker
139,560
106,130
169,990
128,570
Value-added
per
worker
68,560
51,200
82,160
59,750
Capital
per
worker
36,400
27,370
56,670
34,190
Investment
per
worker
3,080
2,280
4,930
3,120
Nonproduction
workers as a
share of
total
workers
(percentage)
33
26
31
26
Multiplant
establishment
(percentage)
51
29
94
87
Source:
Authors'
calculations
based on
the
1987
Census of
Manufactures.
Values
represent
plant
means.

Table 6.
Plant
Characteristics in
Plants
with
500 or
More
Employees,
1977
and
1987
Dollars
unless
otherwise
indicated
1977
1987
Characteristic
Exporters
Nonexporters
Exporters
Nonexporters
Total
employment
(workers)
1,485
1,039
1,492
1,019
Total
value of
shipments
211,524,210
126,568,830
284,191,000
146,467,000
Wage
per
worker
27,620
22,660
28,760
22,930
Wage
per
production
worker
25,070
20,980
25,470
20,660
Wage
per
nonproduction
worker
34,830
31,180
36,290
32,100
Benefits
per
worker
6,430
4,620
7,100
5,370
Total
value of
shipments
per
worker
135,270
112,450
186,470
144,540
Value-added
per
worker
62,040
48,480
89,630
66,470
Capital
per
worker
46,620
31,720
65,040
43,370
Investment
per
worker
4,920
3,330
5,720
3,740
Nonproduction
workers as a
share of
total
workers
(percentage)
32
28
28
24
Multiplant
establishment
(percentage)
98
94
97
96
Source:
Authors'
calculations
based on
the
1977
and
1987
Annual
Surveys of
Manufactures.
Values
represent
plant
means.

Andrew B. Bernard and J. Bradford Jensen 85
counterparts with higher shipments and value-added per employee. La- bor productivity, whether measured by shipments or value-added, was approximately a third greater for exporters across both large and small plants in 1987. Over time the gap actually widened by more than 7 percent for the largest plants.
Exporting plants show higher levels of compensation per worker across all measures for all categories of workers. Average annual wages per employee are almost $4,000 higher at exporters; for production workers the premium is more than $2,500 a year, while nonproduction workers earn an additional $4,200 at exporters. '6 Additionally, average benefits per employee are more than $1,400 higher at exporting estab- lishments. The wage differentials between the plant types were sub- stantially bigger for large plants, especially for production workers, 26 percent in plants with 250 or more employees in 1987. Over time, in the largest establishments, the wage gap increased slightly for both categories of employees. 17
Capital inputs also differ for exporters and nonexporters. Capital- labor ratios are higher at exporting establishments, as are investment rates in machinery and equipment per employee. Exporters are consid- erably more capital intensive than nonexporters, especially in large plants where the capital-labor ratios and investment rates are more than 45 percent greater. Again, the largest category of plants showed a slight increase in the gap between exporters and nonexporters from 1977 to 1987.
Exporters are more likely to be part of a multiplant firm. Looking at the differences across size categories, however, we find that this is attrib- utable primarily to the size distribution of exporters. More than 85 percent of large plants of both types are members of larger firms.
Controlling for Industry, Size, and Location
As we have shown, the incidence of exporting varies substantially across industries and regions. Although the facts reported above hold
16. Throughout this paper, we refer to salary and wages excluding benefits as wages. A more precise definition might be earnings because the numbers represent annual receipts and not hourly compensation.
17. Osterman (1994) reports from a 1992 establishment survey that selling in inter- national markets is positively correlated with the introduction of modern flexible work practices. The relationships between these practices and higher compensation is less obvious.

86 Brookings Papers: Microeconomics 1995
over time and across broad size categories, the possibility remains that location or industry group accounts for most of the differences between exporters and nonexporters. To estimate the difference between ex- porters and nonexporters more precisely, we calculate the percentage differences for the stylized facts after controlling for four-digit SIC industry classifications and state-SMSA (standard metropolitan statis- tical area) geographic dummies. 18 In addition, to account for the prob- able differences in production structure across plants of different sizes, we also control for plant size as measured by total employment.
Table 7 reports the percentage differences in the characteristics after controlling for these factors. The coefficient on the export status dummy is strongly positive and significant for all the characteristics. Consid- ering measures of plant size, we find confirmation for the anecdotal evidence that exporters are substantially larger than nonexporters even within industries and regions. Employment at exporting plants is about 94 percent greater than at nonexporters within the same four-digit in- dustry. The total value of shipments is 110 percent higher at exporters than nonexporters. '9
Examining the labor market, we find that plant wages are 9 percent higher on average in exporting establishments than in nonexporters of a similar size in the same industry and location. Looking at wages by worker category, the exporter wage premium is slightly smaller, 7.4 percent for production workers and 5.4 percent for nonproduction work- ers. The higher average wage differential in part reflects the composi- tion of the work force. Nonproduction workers account for 12.4 percent more of total employment at exporting establishments.20 As other stud- ies have found, higher wages are not offset by lower nonwage benefits. Total nonwage benefits, including both mandated and supplemental, were also substantially higher (12.7 percent) at exporting plants. These
18. There are 448 regional dummies that are state dummies interacted with SMSA dummies where appropriate; that is, a plant within an SMSA in a state is different from a plant in the same state outside the SMSA. Two plants in the same SMSA but in different states also receive different regional dummies.
19. The log approximation actually underestimates the size differences. 20. The higher employment share of nonproduction workers at exporting plants
coupled with gains in their share of total manufacturing employment contributed sub- stantially to the rise in wage inequality across these types of workers in the manufacturing sector during the 1980s. See Bernard and Jensen (1994a).
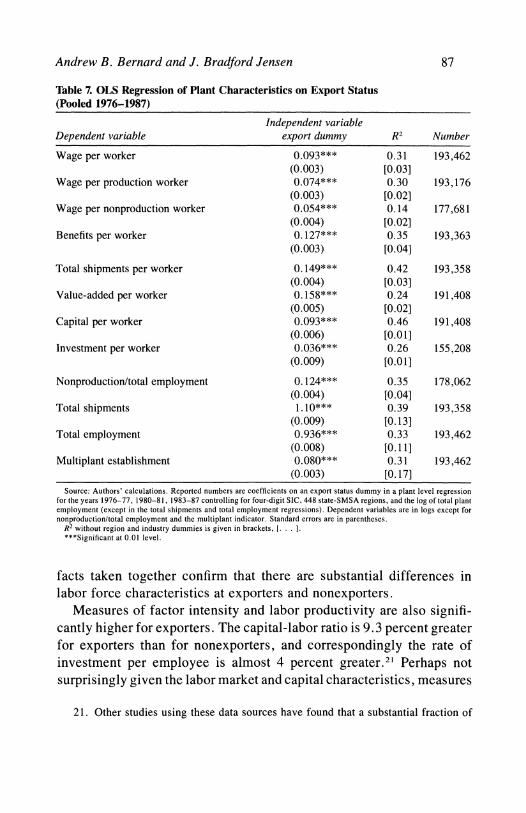
Andrew B. Bernard and J. Bradford Jensen 87
Table 7. OLS Regression of Plant Characteristics on Export Status (Pooled 1976-1987)
Independent variable Dependent variable export dummy R2 Number
Wage per worker 0.093*** 0.31 193,462 (0.003) [0.03]
Wage per production worker 0.074*** 0.30 193,176 (0.003) [0.02]
Wage per nonproduction worker 0.054*** 0.14 177,681 (0.004) [0.02]
Benefits per worker 0.127*** 0.35 193,363 (0.003) [0.04]
Total shipments per worker 0. 149*** 0.42 193,358 (0.004) [0.03]
Value-added per worker 0.158*** 0.24 191,408 (0.005) [0.02]
Capital per worker 0.093*** 0.46 191,408 (0.006) [0.01]
Investment per worker 0.036*** 0.26 155,208 (0.009) [0.01]
Nonproduction/total employment 0. 124*** 0.35 178,062 (0.004) [0.04]
Total shipments 1.10*** 0.39 193,358 (0.009) [0.13]
Total employment 0.936*** 0.33 193,462 (0.008) [0.11]
Multiplant establishment 0.080*** 0.31 193,462 (0.003) [0.17]
Source: Authors' calculations. Reported numbers are coefficients on an export status dummy in a plant level regression for the years 1976-77, 1980-81, 1983-87 controlling for four-digit SIC, 448 state-SMSA regions, and the log of total plant employment (except in the total shipments and total employment regressions). Dependent variables are in logs except for nonproduction/total employment and the multiplant indicator. Standard errors are in parentheses.
R2 without region and industry dummies is given in brackets, 1. . .
***Significant at 0.01 level.
facts taken together confirm that there are substantial differences in labor force characteristics at exporters and nonexporters.
Measures of factor intensity and labor productivity are also signifi- cantly higher for exporters. The capital-labor ratio is 9.3 percent greater for exporters than for nonexporters, and correspondingly the rate of investment per employee is almost 4 percent greater.2' Perhaps not surprisingly given the labor market and capital characteristics, measures
21. Other studies using these data sources have found that a substantial fraction of 21. Other studies using these data sources have found that a substantial fraction of

88 Brookings Papers: Microeconomics 1995
of labor productivity such as shipments per worker are almost 15 per- cent greater for exporters. Finally, exporters are 8 percent more likely to belong to a multiplant firm.
This section has detailed plant-level differences between establish- ments that export some of their product and those that export none. The typical exporting plant is much larger, pays higher wages, and is more capital intensive and more productive than its nonexporting counterpart. These plant characteristics hold over time and across size classes and are even true within fairly narrowly defined industries and regions.
Exporters and the Labor Market
The existence of interindustry wage differentials has been docu- mented and analyzed by several authors. Using data from the Current Population Survey, Krueger and Summers have shown that, after con- trolling for observable worker characteristics, substantial industry wage premiums remain.22 Partly in response to these findings, authors have suggested a variety of sources for the persistent industry-level wage gaps. We focus on the strand of the theoretical literature that maintains that labor markets are perfectly competitive and that observed industry differentials can be understood in the context of either unobserved worker characteristics, such as innate ability, motivation, and on-the- job training, or through unobserved job characteristics that affect work- ers' utility and must therefore be compensated through wages.
Wage Premiums for Exporters
If production for export requires more highly skilled workers than production for domestic sale, then exporting plants should pay higher wages, even within fairly detailed industry classifications. This is true particularly if standard industrial classifications hide a large degree of product heterogeneity, as is the case for four-digit SIC codes. Unob- served job characteristics play a similar role in raising wages in ex-
plant-level investment is bunched in relatively short time periods; see Doms and Dunne (1994). This finding should not affect the estimate of average investment rates per worker across exporters and nonexporters, but it limits our ability to discuss in detail the investment characteristics of these plants.
22. Krueger and Summers (1988).

Andrew B. Bernard and J. Bradford Jensen 89
porting plants. We calculate the average wage differentials for workers at exporters and nonexporters. In addition, we attempt to isolate the wage premium associated solely with the export status of the plant by controlling for industry, region, and plant characteristics.
One advantage of examining wages at the plant level is the ability to control for industry and location effects and to determine wage premi- ums across plants within an industry. In addition, the panel nature of the data allows us to remove fixed plant effects and estimate the change in wages when a plant moves from producing entirely for domestic consumption to exporting some of its production.
Plant Level Evidence on Wages
In this section we lay out the basic results on the relationship between exports and wages. We consider first the existence of wage premiums for exporters across plant characteristics. Previous work on plant-level heterogeneity in wages has emphasized plant size and technology.23 To determine if exporting plants with varying characteristics pay higher wages, we report average annual wage and benefit differentials per worker between 1976 and 1987 in constant dollars by plant character- istic, export status, and job type in table 8. The numbers represent the difference between mean plant wage or benefits in that category and the mean wage for the overall sample of plants.
For every plant characteristic, the exporter wage is larger (or less negative) than the nonexporter wages.24 This result holds across size, plant age, ownership, and capital-intensity categories. In addition, the premium exists for both production and nonproduction workers and is slightly larger for production workers in large, capital-intensive, and older plants and in plants that are part of a larger firm. The magnitude of the premium is substantial: for plants with between 1,000 and 2,499 employees, production workers in exporting establishments earn $2,674 more a year than their counterparts in nonexporting plants. For nonpro- duction workers in the same size category, the export premium is even larger, at $3,356. Benefits show similar patterns, compounding the earnings gap between exporting and nonexporting plants. Average ben-
23. Davis and Haltiwanger (1991) and Dunne and Schmitz (1992). 24. The only exception is for production workers in plants with 2,500-4,999 em-
ployees, a category whose mean is dominated by a few outliers.

Table 8.
Wage
Differentials by
Plant
Characteristics
Dollars
Benefits
per
worker
Production
worker
wage
Nonproduction
worker
wage
Characteristic
Exporters
Nonexporters
Exporters
Nonexporters
Exporters
Nonexporters
Size 1-20
Empl.
-1,737
-2,906
-2,692
-3,778
-1,285
-6,029
20-50
-
1,237
-
2,259
-
2,906
-4,524
2,166
-
1,061
50-100
-
883
-
2,007
-
2,695
-4,700
1,034
-
1,182
100-250
-360
-
1,589
-
1,555
-4,190
-431
-
2,518
250-500
32
-
1,380
-
566
-
3,995
-
1,355
-
3,834
500-1,000
622
-
822
1,303
-2,241
-448
-
2,939
1,000-2,500
1,653
437
4,007
1,333
2,015
-
1,341
2,500-5,000
3,547
2,919
8,428
8,759
6,388
4,076
5,000 +
3,934
2,605
9,481
6,966
7,304
6,076
Age 0-4 yrs
-316
-2,395
-887
-5,209
345
-3,591
5-9 yrs
-439
-2,080
1,223
-4,830
-297
-2,674
10+
years
1,641
-917
3,677
-2,022
2,366
-1,626
Ownership
type
Single
plant
-
1,444
-2,599
-3,827
-5,232
2,550
-1,084
Multiplant
1,556
-727
3,502
-1,869
1,949
-2,541
Capital
intensity
I st
quintile
-1,540
-2,998
-5,117
-8,428
-3,017
-5,707
2nd
quintile
-937
-2,335
-2,807
-6,135
-1,903
-3,711
3rd
quintile
140
-1,577
316
-3,219
-196
-2,628
4th
quintile
1,059
-845
1,888
-992
1,281
-
1,095
5th
quintile
3,160
696
7,737
2,787
5,446
1,734
Source:
Authors'
calculations
based on
the
Annual
Survey of
Manufactures,
various
years.
The
wage
differential is
given as
the
difference
between
the
mean
plant
wage
for
the
given
category
and
the
overall
mean
plant
wage.
Numbers
represent
the
average
differential
for
the
years
1976-77,
1980-81,
1983-87.
All
differentials
are
denominated in
constant
1987
dollars
per
worker.
Plants
are
weighted by
sampling
weights
and
total
employment.
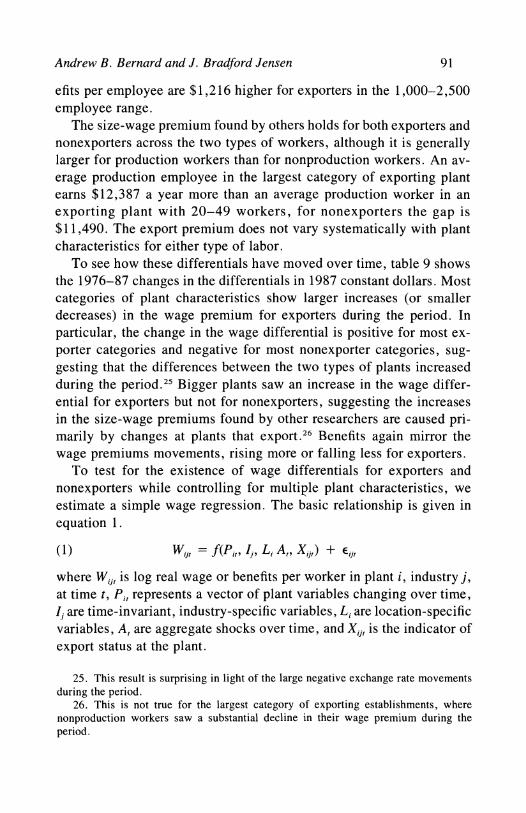
Andrew B. Bernard and J. Bradford Jensen 91
efits per employee are $1,216 higher for exporters in the 1,000-2,500 employee range.
The size-wage premium found by others holds for both exporters and nonexporters across the two types of workers, although it is generally larger for production workers than for nonproduction workers. An av- erage production employee in the largest category of exporting plant earns $12,387 a year more than an average production worker in an exporting plant with 20-49 workers, for nonexporters the gap is $11,490. The export premium does not vary systematically with plant characteristics for either type of labor.
To see how these differentials have moved over time, table 9 shows the 1976-87 changes in the differentials in 1987 constant dollars. Most categories of plant characteristics show larger increases (or smaller decreases) in the wage premium for exporters during the period. In particular, the change in the wage differential is positive for most ex- porter categories and negative for most nonexporter categories, sug- gesting that the differences between the two types of plants increased during the period.25 Bigger plants saw an increase in the wage differ- ential for exporters but not for nonexporters, suggesting the increases in the size-wage premiums found by other researchers are caused pri- marily by changes at plants that export.26 Benefits again mirror the wage premiums movements, rising more or falling less for exporters.
To test for the existence of wage differentials for exporters and nonexporters while controlling for multiple plant characteristics, we estimate a simple wage regression. The basic relationship is given in equation 1.
(1) WiV, = f(Pi,, Ij, Li A,, Xij,) + Eij,
where Wi,, is log real wage or benefits per worker in plant i, industry j, at time t, Pi, represents a vector of plant variables changing over time, I, are time-invariant, industry-specific variables, Li are location-specific variables, A, are aggregate shocks over time, and Xi>, is the indicator of export status at the plant.
25. This result is surprising in light of the large negative exchange rate movements during the period.
26. This is not true for the largest category of exporting establishments, where nonproduction workers saw a substantial decline in their wage premium during the period.

Table 9.
Change in
Mean
Wage
Differentials,
1976-87
Dollars
Benefits
per
worker
Production
worker
wage
Nonproduction
worker
wage
Characteristic
Exporters
Nonexporters
Exporters
Nonexporters
Exporters
Nonexporters
Size 1-20
Empl.
996
740
2,640
1,701
92
1,000
20-50
194
71
-771
-249
-
2,955
-
1,370
50-100
19
2
-
1,117
-694
-
2,523
-
1,076
100-250
67
21
-
868
-618
344
-
1,281
250-500
316
109
- 35
-967
1,222
-
311
500-1,000
113
-
150
53
-941
1,600
-40
1,000-2,500
251
-
349
1,371
-985
1,899
-
783
2,500-5,000
613
-
1,013
3,914
-451
2,246
-
1,990
5,000 +
-
1,618
-
2,273
378
-
3,528
-
1,656
146
Age 0-4 yrs
1,889
631
4,451
-219
2,751
-1,601
5-9 yrs
-913
-614
-2,827
-2,073
-460
-1,477
10 +
years
-497
-246
-377
-1,232
185
-1,027
Ownership
type
Single
plant
132
174
-408
50
-445
140
Multiplant
-208
-
146
274
-
1,068
456
-
1,069
Capital
intensity
I st
quintile
-268
-69
-1,300
-321
1,536
-571
2nd
quintile
443
45
829
-
193
760
-2,084
3rd
quintile
-135
5
721
-806
-242
-123
4th
quintile
82
154
746
-581
1,546
-328
5th
quintile
-47
442
1,004
579
1,063
511
Source:
Authors'
calculations
based on
the
Annual
Survey of
Manufactures,
1977.
1987.
Numbers
represent
the
change in
the
wage
differential by
category
from
1977 to
1987.
The
wage
differential is
given as
the
difference
between
the
mean
plant
wage
for
the
given
category
and
the
overall
mean
plant
wage.
All
amounts
are
denominated in
constant
1987
dollars
per
year
per
worker.
Plants
are
weighted by
sampling
weights
and
total
employment.

Andrew B. Bernard and J. Bradford Jensen 93
As we showed earlier, exporting plants within four-digit industries are larger and more capital intensive, and have higher labor productivity than their nonexporting counterparts. All of these plant characteristics are associated with higher wages, thus biasing upward the substantial export premium we observed at the four-digit level.27 Our set of plant level controls includes the log of the capital-labor ratio, the age of the plant, the log of plant size measured by total employment, the log of production hours per production worker, and a dummy indicating whether the plant is part of a multiplant firm. As our export variable, we report results including a dummy for whether a plant is exporting in the current period.28
Table 10 reports the results for a variety of specifications for total wages and total benefits per employee.29 Running the regression for the pooled sample from 1976 through 1987 and including only plant char- acteristics and year dummies but no regional or industry controls (col- umn 1) yields an estimate of the export wage premium of 11 .6 percent, statistically significant at the 1 percent level. The results suggest a very large wage premium in exporting plants even after controlling for plant characteristics known to increase wages. The export coefficient in the benefits regression (column 4) is even larger, at 18.5 percent. This simple specification accounts for 31.0 percent of the variation in aver- age wages across plants and over time, even without accounting for regional or industry effects.
Other plant characteristics enter significantly and with the expected signs. Total employment and capital intensity are positively related to average worker wages and benefits, as are production hours per pro- duction employee. Somewhat surprisingly, given the results on wage premiums by plant characteristics in table 8, the coefficient on the multiplant firm dummy is negative and significant, indicating 3.5 per- cent lower wages at multiplant firms, although benefits are 14 percent higher at these plants.30
27. Davis and Haltiwanger (1991); Brown and Medoff (1989); Barron, Black, and Loewenstein (1987); and Mellow (1982).
28. Results, including the dummy for export status and the share of shipments exported by the plant, were virtually identical to those reported here and are available from the authors by request.
29. Ideally, we would want to estimate an hourly wage, but hours for nonproduction employees are not collected in the ASM.
30. This effect is no longer significant when industry dummies are included.

Table
10.
OLS
Regressions of
Log
Wages
on
Plant
Characteristics
(Pooled
1976-1987) Dependent
variable
Independent
Wage
per
worker
Benefits
per
worker
variables
(M)
(2)
(3)
(4)
(5)
(6)
Exporter
0.1162
0.0827
0.0446
0.1845
0.1307
0.0756
(0.0012)
(0.0011)
(0.0011)
(0.0021)
(0.0020)
(0.0021)
Capital
per
worker
0.1343
0.1294
0.0976
0.2008
0.1908
0.1410
(0.0004)
(0.0004)
(0.0005)
(0.0008)
(0.0008)
(0.0041)
Hours
per
worker
0.3880
0.3865
0.3529
0.3883
0.3963
0.3462
(0.0025)
(0.0023)
(0.0021)
(0.0045)
(0.0042)
(0.0041)
Size of
plant
0.0167
0.0259
0.0366
0.0590
0.0737
0.0909
(0.0004)
(0.0004)
(0.0004)
(0.0008)
(0.0008)
(0.0008)
Multiplant
-0.0353
-0.0024
-0.0008
0.1387
0.1820
0.1717
(0.0014)
(0.0013)
(0.0012)
(0.0025)
(0.0023)
(0.0023)
4-Digit
SIC
dummies
No
No
Yes
No
No
Yes
Region
dummies
No
Yes
Yes
No
Yes
Yes
Number
411,574
411,327
411,327
408,689
408,442
408,442
R2
0.311
0.426
0.525
0.331
0.410
0.467
Source:
Authors'
calculations.
Dependent
variables
are
log
real
salary
and
wages
per
employee
(without
benefits)
and
log
benefits
per
employee.
All
specifications
include
dumnlies
for
year
effects
and
plant
age.
Standard
errors
are in
parentheses.
Andrew B. Bernard and J. Bradford Jensen 95
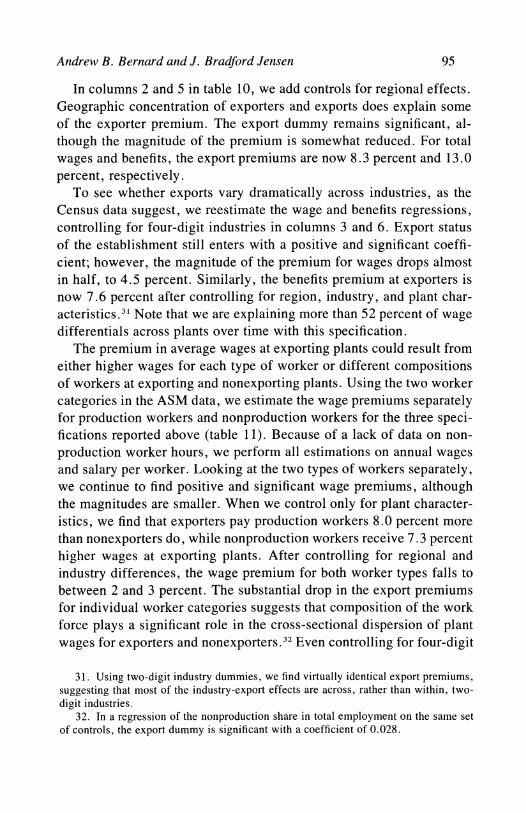
In columns 2 and 5 in table 10, we add controls for regional effects. Geographic concentration of exporters and exports does explain some of the exporter premium. The export dummy remains significant, al- though the magnitude of the premium is somewhat reduced. For total wages and benefits, the export premiums are now 8.3 percent and 13.0 percent, respectively.
To see whether exports vary dramatically across industries, as the Census data suggest, we reestimate the wage and benefits regressions, controlling for four-digit industries in columns 3 and 6. Export status of the establishment still enters with a positive and significant coeffi- cient; however, the magnitude of the premium for wages drops almost in half, to 4.5 percent. Similarly, the benefits premium at exporters is now 7.6 percent after controlling for region, industry, and plant char-
acteristics.3' Note that we are explaining more than 52 percent of wage differentials across plants over time with this specification.
The premium in average wages at exporting plants could result from either higher wages for each type of worker or different compositions of workers at exporting and nonexporting plants. Using the two worker categories in the ASM data, we estimate the wage premiums separately for production workers and nonproduction workers for the three speci- fications reported above (table 1 1). Because of a lack of data on non- production worker hours, we perform all estimations on annual wages and salary per worker. Looking at the two types of workers separately, we continue to find positive and significant wage premiums, although the magnitudes are smaller. When we control only for plant character- istics, we find that exporters pay production workers 8.0 percent more than nonexporters do, while nonproduction workers receive 7.3 percent higher wages at exporting plants. After controlling for regional and industry differences, the wage premium for both worker types falls to between 2 and 3 percent. The substantial drop in the export premiums for individual worker categories suggests that composition of the work force plays a significant role in the cross-sectional dispersion of plant wages for exporters and nonexporters.32 Even controlling for four-digit
31. Using two-digit industry dummies, we find virtually identical export premiums, suggesting that most of the industry-export effects are across, rather than within, two- digit industries.
32. In a regression of the nonproduction share in total employment on the same set of controls, the export dummy is significant with a coefficient of 0.028.

Table
11.
OLS
Regressions of
Production
and
Nonproduction
Wages
on
Plant
Characteristics
(Pooled
1976-1987)
Dependent
variable
Independent
variables
Production
wage
Nonproduction
wage
Exporter
0.0803
0.0486
0.0280
0.0732
0.0519
0.0202
(0.0013)
(0.0012)
(0.0012)
(0.0017)
(0.0017)
(0.0019)
Capital
perworker
0.1400
0.1322
0.0911
0.0853
0.0851
0.0771
(0.0005)
(0.0005)
(0.0005)
(0.0007)
(0.0007)
(0.0009)
Hours
per
worker
0.5749
0.5793
0.5432
0.0722
0.0682
0.0395
(0.0027)
(0.0025)
(0.0024)
(0.0039)
(0.0038)
(0.0038)
Size of
plant
0.0152
0.0246
0.0367
0.0386
0.0448
0.0488
(0.0005)
(0?0005)
(0.0005)
(0.0007)
(0.0007)
(0.0008)
Multiplant
-0.0172
0.0107
0.0212
-0.1129
-0.0854
-0.0762
(0.0025)
(0.0014)
(0.0013)
(0.0021)
(0.0021)
(0.0021)
4-Digit
SIC
dummies
No
No
Yes
No
No
Yes
Region
dummies
No
Yes
Yes
No
Yes
Yes
Number
410,806
410,561
410,561
388,627
388,404
388,404
R 2
0.326
0.412
0.509
0.067
0.104
0.138
Source:
Authors'
calculations.
Dependent
variables
are
log
real
salary
and
wages
per
production
worker
and
log
real
nonproduction
salary
and
wages
per
nonproduction
worker.
Standard
errors
are in
parentheses.

Andrew B. Bernard and J. Bradford Jensen 97
Table 12. OLS Fixed Effect Regressions of Wages by Worker Type on Plant Characteristics (Pooled 1976-87)
Dependent variable
Independent Wage per Benefits per Production Nonproduction variables worker worker wage wage
Exporter 0.0168 0.0297 0.0123 0.0179 (0.0010) (0.0023) (0.0012) (0.0021)
Capital per worker 0.0423 0.0613 0.0315 0.0371 (0.0006) (0.0015) (0.0008) (0.0014)
Hours per worker 0.2685 0.2472 0.4638 -0.0461 (0.0018) (0.0043) (0.0022) (0.0040)
Size of plant -0.0704 -0.0916 -0.0426 -0.0566 (0.0010) (0.0023) (0.0012) (0.0022)
Number 411,574 408,689 410,806 388,627 R2 0.889 0.809 0.864 0.688
Source: Authors' calculations. Dependent variables are log real salary and wages (excluding benefits) per worker, log real benefits per worker, log real production wage per production worker, and log real nonproduction wage per nonproduction worker. All specifications include dummies for year effects. Standard errors are in parentheses.
industry, however, the export premium is still positive and significant for both types of worker.
These results confirm that exporting establishments pay systemati- cally higher wages than their nonexporting counterparts even after con- trolling for plant, region, and industry factors that might raise wages. The premium is found for both high and low skilled workers. Because more precise evidence on the composition of workers at exporting and nonexporting plants is unavailable, the possibility remains that our results are driven by heterogeneity in worker composition across plants or by other omitted variables such as plant-specific technological inten- sity.33 Because this could represent additional unobserved heterogeneity in the composition of the work force, we take advantage of the large cross-section dimension of our panel and estimate our wage equations using plant fixed effects.
The fixed effects formulation provides additional evidence for an export wage premium (see table 12). The coefficients must be inter- preted somewhat differently from the earlier results, as the export dummy now represents the effect on wages and benefits of the within- plant change from nonexporter to exporter, controlling for changes in
33. Doms, Dunne, and Troske (1994).

98 Brookings Papers: Microeconomics 1995
other plant characteristics and removing aggregate year effects.34 Col- umn 1 reports the results from the fixed effect model for average plant wages. The coefficient on the export dummy remains positive and strongly significant; plants that start exporting show an increase in wages of 1.7 percent, even after controlling for changes in capital intensity, hours, and plant size. The results for production and nonpro- duction workers show wage changes of similar magnitudes. Production worker wages increase 1.2 percent in response to a switch from nonex- porting to exporting by the plant, while the increase in nonproduction worker wages is slightly larger, at 1.8 percent.35 Benefits continue to show larger premiums; plants that start exporting increase their benefits per employee by almost 3.0 percent. These results suggest that plants changing their export status are undergoing substantial changes in pro- duction structure.
Instruments and Robustness Checks
In the preceding results the export status of the plant could be proxy- ing for another plant characteristic that is truly driving the wage and benefits differentials. To address this problem, we employ a set of instruments correlated with exports yet arguably uncorrelated with other changes in plant characteristics. We must sacrifice some of the detail in our data set because no other variables are available to use as plant- level instruments for export status.
We use as instruments export-weighted exchange rates and foreign income variables. The foreign income variable is weighted aggregate income in the export destinations for a given industry. Using data on destinations of U.S. exports by four-digit SIC classification, we first construct annual export share weights for each country for each indus- try.36 An average share of exports for each country for each industry
34. The coefficients on other plant characteristics are significant and have the ex- pected signs. Increases in capital per worker and production hours per production worker increase wages. Increases in plant size have a small, negative effect, most likely because plants hire workers with lower-than-average wages for the establishment.
35. In the fixed effects specification with nonproduction employment share as the dependent variable, the export coefficient is significant but small at 0.002, confirming that plants switching export status also change their employment composition.
36. We consider only U.S. exports to the top twenty-five countries, ranked by value. The countries account for more than 90 percent of U.S. exports in every year. Exports for each country by industry come from the Census Foreign Trade Division Compro

Andrew B. Bernard and J. Bradford Jensen 99
during the period 1976-87 is used as the final weight. The income variables are foreign gross domestic product in 1985 prices, converted to U.S. currency.37 Our country exchange rate measures are real ex- change rate indices, with 1976-77 equal to 100.38
Before running the instrumental variables specification, we first use the demand instruments described above to test for the effect of foreign output and exchange rate movements on the exporting sectors of four- digit industries. The basic specification is a fixed effects regression in logs
(2) ln Yi, = oc, + bi + 1 ln Xi, + Ei,
where (x, are year dummies, 8i are four-digit industry dummies, and Xit is the vector of foreign demand instruments. Our dependent variables, Yit, include the response of exports and the percentage of plants ex- porting as well as the changes in total employment and domestic sales.
Table 13 contains the regression results. By setting up a fixed effects specification, we are estimating the within-industry response to foreign demand shocks controlling for aggregate business cycle effects. Both the fraction of plants exporting within an industry and the value of exports themselves increase in response to favorable foreign exchange rate and demand shocks.39 The estimated income elasticity for the per- centage of plants exporting is substantially larger than the correspond- ing price elasticity. Considering exports directly, the variables again enter with the correct signs, although the exchange rate variable is now insignificant. The point estimate of the export-income elasticity is sub- stantially higher, at 1.51, however, with much larger standard errors. The results suggest that the change in exports due to positive foreign demand shocks is attributable primarily to increases from existing ex- porters rather than to increasing numbers of exporting plants.
database for various years. These industrial classifications are matched with the 1972 four-digit industrial classifications used in the ASM and Census of Manufactures.
37. We use purchasing power parity exchange rates given in Summers and Heston (1991).
38. The real exchange rate is calculated as the nominal exchange rate adjusted for foreign and domestic inflation; all variables drawn from various International Financial Statistics Yearbooks. Although this measure might be problematic if used to compare income or consumption levels across countries, it yields an appropriate measure of the foreign price movements for each industry.
39. Because exchange rates are denominated in foreign currency per U.S. dollar, a fall in exchange rates improves relative prices for U.S. exporters.

100 Brookings Papers: Microeconomics 1995
Table 13. OLS Fixed Effect Regressions of Industry Characteristics on Foreign Demand Workers (Pooled 1976-87)
Log foreign Log foreign Dependent variable exchange demand
Number of exporters -0.0675* 0.4938*** (0.0399) (0.0848)
Value of exports -0.2000 1.5121*** (0.2597 (0.5508)
Exports as a share of total shipments -0.0159** 0.0729*** (0.0079) (0.0167)
Share of employment at exporters -0.0473 0.2890*** (0.0323) (0.0687)
Total employment -0.2213*** - 1.0128*** (0.0827) (0.1756)
Domestic shipments -0.2614*** -0.9631*** (0.0923) (0.1958)
Source: Authors' calculations. Dependent variables are at four-digit SIC industry level. Additional variables include four- digit industry dummies and year dummies. Foreign exchange rate is four-digit SIC industry export-share weighted foreign currency per U.S. dollar. Foreign demand is four-digit SIC industry export-share weighted gross domestic product in 1985 U.S. dollars adjusted for purchasing power parity. Standard errors are in parentheses.
***significant at 0.01 level. **significant at 0.05 level. *significant at 0. 10 level.
To understand whether foreign demand shocks shift production from domestic to foreign sales, we estimate the response of exports as a percentage of shipments, total employment, and domestic sales on the foreign demand variables. Both income and exchange rates are posi- tively and significantly correlated with the export share in total ship- ments. The results are mixed for both the total industry employment and the domestic sales regressions. Favorable exchange rate shocks increase total employment and domestic shipments, while favorable foreign income shocks are surprisingly strongly negatively correlated with both measures.40
These industry results are encouraging. Neither of these instruments is likely to be correlated with plant- or industry-omitted variables, yet both have the potential disadvantage of possessing only weak correla- tion with plant-level export status. However, an F-test in the first stage
40. Total employment and domestic sales regressions using three-digit industry dum- mies yield negative and insignificant coefficients for the foreign exchange variable and the expected positive and significant coefficients on foreign income.

Andrew B. Bernard and J. Bradford Jensen 101
Table 14. IV Regressions by Worker Type on Plant Characteristics (Pooled 1976-87)
Dependent variable
Independent Wage per Benefits per Production Nonproduction variables worker worker wage wage
Exporter 0.2915 0.1033 0.1051 -0.0157 (0.0775) (0.1338) (0.0814) (0.1120)
Capital per worker 0.0923 0.1452 0.0930 0.0754 (0.0022) (0.0037) (0.0023) (0.0031)
Hours per worker 0.3459 0.3342 0.5385 0.0412 (0.0029) (0.0055) (0.0031) (0.0053)
Size of plant 0.0136 0.1058 0.0360 0.0469 (0.0083) (0.0145) (0.0087) (0.0125)
Multiplant -0.0308 0.1789 0.0088 -0.1029 (0.0035) (0.0060) (0.0036) (0.0051)
Exogeneity test 1.692+ 0.329 -0.522 -0.113
Estimated wage premium* 0.1001 0.0355 0.0610 -0.0053 Source: Authors' calculations. Instruments for export status of the plant include four-digit industry foreign demand and
foreign exchange rates. All specifications include dummies for years and four-digit industries. Standard errors are in parentheses. The test for the exogeneity of export status is of the form given by Spencer and Berk (1981).
+Rejection at the 0. 10 level. *The first stage regression yields a probability of exporting at the plant. To produce an estimate of the wage premium for
the average plant, we multiply the average linear probability prediction by the estimated coefficient.
regression strongly rejects the null hypothesis that the instruments are uncorrelated with the export status of the plant.4'
The results using the industry variables as instruments for plant ex- port status are reported in table 14. For average plant wage, the export status variable is positive and significant. For the two worker categories and benefits, the estimates of the exporter dummy are insignificantly different from zero. To compare the results of the instrumental variables (IV) specification to the OLS estimates, we multiply the estimated coefficient by the average linear probability from the first stage regres- sion. The resulting estimate of the premium for total wages is 10.0 percent. These IV results offer additional evidence that composition effects are playing a large role in the wage increase at exporting plants.
To provide some evidence on the robustness of our results on the wage premium, we explore what happens to the export coefficients when we split our sample of plants by labor productivity and size
41. The first stage is a linear probability model; the F-statistic on the joint signifi- cance of the two instruments is 49.31. We perform an exogeneity test for plant export status and weakly reject exogeneity (at the 10 percent level) only for the total wage equation. See Spencer and Berk (1981).
102 Brookings Papers: Microeconomics 1995
classifications. Because we cannot directly control for labor productiv- ity in our specification, we split the sample into ten labor productivity categories based on initial value-added per worker. To avoid issues of different waves of the ASM discussed earlier, we restrict ourselves to the years 1984 through 1987.42 The export wage premium does not vary systematically with respect to initial labor productivity levels and re- mains significant, suggesting that the result is not driven by a correlation with plant labor productivity. The percentage of plants exporting does increase dramatically, however, as labor productivity rises, confirming the fact that high-productivity plants are more likely to be exporters.
Another possible explanation for the export-wage relationship is the size-wage premium for large plants. Although we controlled for plant size in our specification through total employment, plant size may still be playing a role. To check this we estimate the wage regressions separately for ten size categories. Again the export premium remains across plant size categories.43
In this section, we have documented the existence of a sizable wage premium in exporting plants for both production and nonproduction workers for both wages and benefits. This premium holds across all types of plants even after controlling for capital, size, labor productiv- ity, and ownership characteristics. After adding regional and industry controls, the premiums are substantially reduced, although still positive and significant. Wages and benefits also increase in plants that shift from nonexporting to exporting status. The results show that workers at exporting plants do receive substantially higher wages and benefits; however, most of that differential can be explained by plant character- istics such as location, industry, capital intensity, and size.
Wage Growth
The results on wage differentials over time suggest that the export premium has been growing for plants in most categories. This finding is distinct, however, from the issue of whether wages have been rising more rapidly at exporting plants. To determine whether export status is a good predictor for wage increases, we regress both annual and long-
42. Firms are still entering and exiting, but this sample minimizes problems of comparing productivity levels across years.
43. These results are available upon request from the authors.
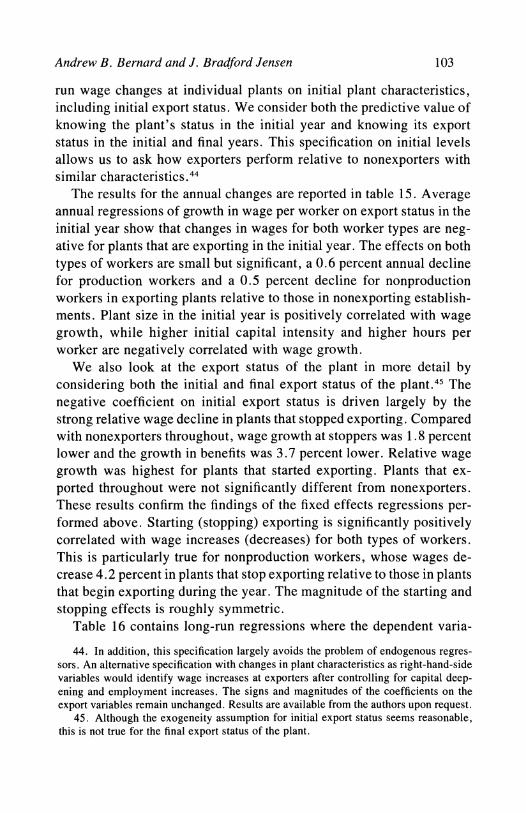
Andrew B. Bernard and J. Bradford Jensen 103
run wage changes at individual plants on initial plant characteristics, including initial export status. We consider both the predictive value of knowing the plant's status in the initial year and knowing its export status in the initial and final years. This specification on initial levels allows us to ask how exporters perform relative to nonexporters with similar characteristics.44
The results for the annual changes are reported in table 15. Average annual regressions of growth in wage per worker on export status in the initial year show that changes in wages for both worker types are neg- ative for plants that are exporting in the initial year. The effects on both types of workers are small but significant, a 0.6 percent annual decline for production workers and a 0.5 percent decline for nonproduction workers in exporting plants relative to those in nonexporting establish- ments. Plant size in the initial year is positively correlated with wage growth, while higher initial capital intensity and higher hours per worker are negatively correlated with wage growth.
We also look at the export status of the plant in more detail by considering both the initial and final export status of the plant.45 The negative coefficient on initial export status is driven largely by the strong relative wage decline in plants that stopped exporting. Compared with nonexporters throughout, wage growth at stoppers was 1.8 percent lower and the growth in benefits was 3.7 percent lower. Relative wage growth was highest for plants that started exporting. Plants that ex- ported throughout were not significantly different from nonexporters. These results confirm the findings of the fixed effects regressions per- formed above. Starting (stopping) exporting is significantly positively correlated with wage increases (decreases) for both types of workers. This is particularly true for nonproduction workers, whose wages de- crease 4.2 percent in plants that stop exporting relative to those in plants that begin exporting during the year. The magnitude of the starting and stopping effects is roughly symmetric.
Table 16 contains long-run regressions where the dependent varia-
44. In addition, this specification largely avoids the problem of endogenous regres- sors. An alternative specification with changes in plant characteristics as right-hand-side variables would identify wage increases at exporters after controlling for capital deep- ening and employment increases. The signs and magnitudes of the coefficients on the export variables remain unchanged. Results are available from the authors upon request.
45. Although the exogeneity assumption for initial export status seems reasonable, this is not true for the final export status of the plant.

Table
15.
OLS
Regressions of
Year to
Year
Percentage
Changes in
Wages
Dependent
variable
Independent
variables
Wage
per
worker
Benefits
per
worker
Production
wage
Nonproduction
wage
Exporter in
year 0
-0.0066
-0.0175
-0.0061
-
0.0045
(0.0010)
(0.0021)
(0.0012)
(0.0018)
Nonexporter in
year 0 &
nonexporter in
year 1
Exporter in
year 0 &
-0.0176
-0.0369
-
0.0151
-0.0226
nonexporter in
year 1
(0.0016)
(0.0034)
(0.0019)
(0.0030)
Exporter in
year 0 &
0.0011
-0.0025
0.0006
0.0066
exporter in
year 1
(0.0011)
(0.0024)
(0.0013)
(0.0021)
Nonexporter in
year 0
0.0153
0.0331
0.0141
0.0191
&
exporter in
year 1
(0.0016)
(0.0034)
(0.00 19)
(0.0030)
Size of
plant
0.0145
0.0137
0.0101
0.0086
0.0134
0.0127
0.0116
0.0105
(0.0004)
(0.0004)
(0.0008)
(0.0008)
(0.0005)
(0.0005)
(0.0008)
(0.0008)
Hours
per
worker
-0.1691
-0.1693
-0.1532
-0.1536
-0.2747
-0.2749
0.0245
0.0245
(0.0019)
(0.0019)
(0.0041)
(0.0041)
(0.0023)
(0.0023)
(0.0038)
(0.0038)
Capital
per
worker
-0.0133
-0.0135
-0.0233
-0.0237
-0.0090
-0.0092
-0.0116
-0.0119
(0.0004)
(0.0004)
(0.0009)
(0.0009)
(0.0005)
(0.0005)
(0.0008)
(0.0008)
Multiplant
firm
-0.0022
-0.0024
-0.0007
-0.0013
-0.0038
-0.0036
-0.0074
-0.0077
(0.0011)
(0.0011)
(0.0023)
(0.0023)
(0.0013)
(0.0013)
(0.0021)
(0.0021)
Number
350,051
350,051
347,014
347,014
348,201
348,201
328,555
328,555
R2
0.034
0.035
0.011
0.012
0.046
0.047
0.004
0.004
Source:
Authors'
calculations.
Dependent
variables
are
percentage
changes in
real
wages
per
worker.
All
specifications
include
dummies
for
plant
age,
region.
and
industry.
Standard
errors
are
in
parentheses.
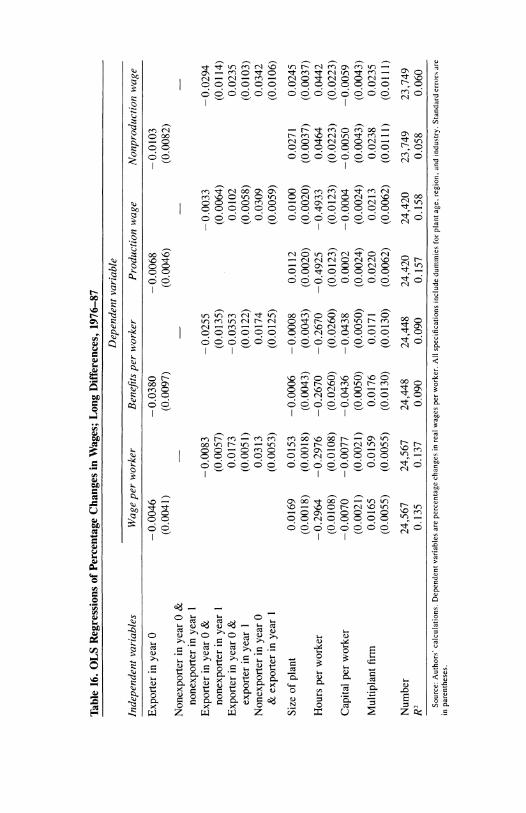
Table
16.
OLS
Regressions of
Percentage
Changes in
Wages;
Long
Differences,
1976-87 Dependent
variable
Independent
variables
Wage
per
worker
Benefits
per
worker
Production
wage
Nonproduction
wage
Exporter in
year 0
-0.0046
-0.0380
-0.0068
-0.0103
(0.0041)
(0.0097)
(0.0046)
(0.0082)
Nonexporter in
year 0 &
nonexporter in
year I
Exporter in
year 0 &
-0.0083
-0.0255
-0.0033
-0.0294
nonexporter in
year 1
(0.0057)
(0.0135)
(0.0064)
(0.0114)
Exporter in
year 0 &
0.0173
-0.0353
0.0102
0.0235
exporter in
year 1
(0.0051)
(0.0122)
(0.0058)
(0.0103)
Nonexporter in
year 0
0.0313
0.0174
0.0309
0.0342
&
exporter in
year 1
(0.0053)
(0.0125)
(0.0059)
(0.0106)
Size of
plant
0.0169
0.0153
-0.0006
-0.0008
0.0112
0.0100
0.0271
0.0245
(0.0018)
(0.0018)
(0.0043)
(0.0043)
(0.0020)
(0.0020)
(0.0037)
(0.0037)
Hours
per
worker
-0.2964
-0.2976
-0.2670
-0.2670
-0.4925
-0.4933
0.0464
0.0442
(0.0108)
(0.0108)
(0.0260)
(0.0260)
(0.0123)
(0.0123)
(0.0223)
(0.0223)
Capital
per
worker
-0.0070
-0.0077
-0.0436
-0.0438
0.0002
-0.0004
-0.0050
-0.0059
(0.0021)
(0.0021)
(0.0050)
(0.0050)
(0.0024)
(0.0024)
(0.0043)
(0.0043)
Multiplant
firm
0.0165
0.0159
0.0176
0.0171
0.0220
0.0213
0.0238
0.0235
(0.0055)
(0.0055)
(0.0130)
(0.0130)
(0.0062)
(0.0062)
(0.0111)
(0.0111)
Number
24,567
24,567
24,448
24,448
24,420
24,420
23,749
23,749
R2
0.135
0.137
0.090
0.090
0.157
0.158
0.058
0.060
Source:
Authors'
calculations.
Dependent
variables
are
percentage
changes in
real
wages
per
worker.
All
specifications
include
dummies
for
plant
age.
region,
and
industry.
Standard
errors
are
in
parentheses.

106 Brookings Papers: Microeconomics 1995
bles are percent wage changes between 1976 and 1987. Plants in this sample are those who were in the 1976 ASM and were still in existence in 1987. As a result the sample consists of "successful" establish- ments. We consider the relative wage growth of plants within industries that stayed in operation. For all three wage variables, initial export status enters with a small, negative, and insignificant coefficient. Export status does not appear to predict above or below average wage changes over long horizons; however, changes in benefits are significantly neg- ative at initial exporters. Considering the effects of other plant char- acteristics, we find that initial plant size and the multiplant status of the plant are both positively correlated with long-run wage increases, es- pecially for nonproduction workers. Capital intensity again is nega- tively correlated with the wage changes. Breaking the export status into the four beginning and ending categories in table 16, we see broadly similar results for long-run wage changes. Plants that start exporting during the period increase wages the most, while stoppers perform relatively poorly. Exporters throughout have significantly higher wage growth than nonexporters throughout.
Employment Growth
To determine whether exporters also increase employment faster than nonexporters, we consider the relationship between export status and job growth. In tables 17 and 18, we estimate differences in short- and long-run relative employment changes for exporters and nonexporters .46
As in the wage growth specifications, we control for initial levels of plant characteristics including size, capital intensity, hours per worker, and multiplant status.
Unlike the wage results, exporters show substantially higher annual employment growth for both types of workers. The total employment growth rate was 2.4 percent higher at plants that exported initially, as was the growth rate for production workers. Nonproduction employ- ment growth was also faster at exporting plants than at nonexporters, 1.5 percent a year. As in the wage regression, initial plant character- istics enter significantly with the expected signs. Initial employment
46. Both tables include plants that survived the period, thus potentially biasing the results. In an earlier draft, we report that exporters have a higher probability of survival, especially over short time horizons. See Bernard and Jensen (1994b).
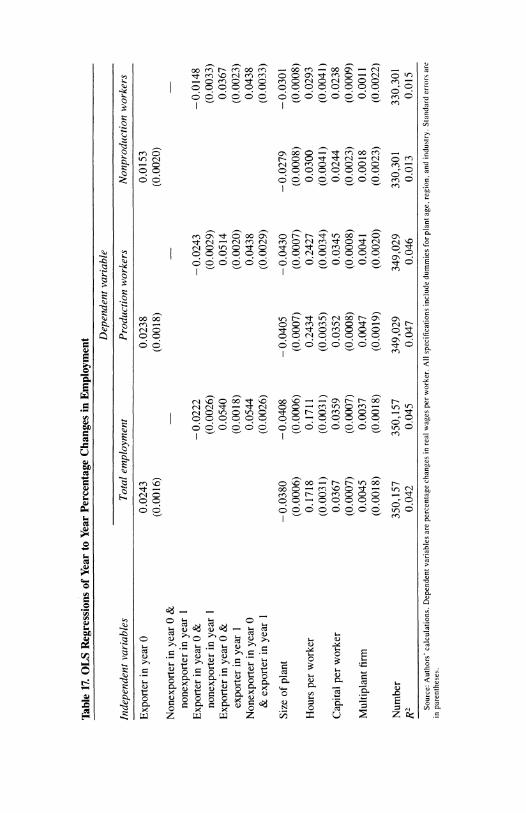
Table 17.
OLS
Regressions of
Year to
Year
Percentage
Changes in
Employment
Dependent
variable
Independent
variables
Total
employment
Production
workers
Nonproduction
workers
Exporter in
year 0
0.0243
0.0238
0.0153
(0.0016)
(0.0018)
(0.0020)
Nonexporter in
year 0 &
nonexporter in
year 1
Exporter in
year 0 &
-0.0222
-0.0243
-0.0148
nonexporter in
year 1
(0.0026)
(0.0029)
(0.0033)
Exporter in
year 0 &
0.0540
0.0514
0.0367
exporter in
year 1
(0.0018)
(0.0020)
(0.0023)
Nonexporter in
year 0
0.0544
0.0438
0.0438
&
exporter in
year 1
(0.0026)
(0.0029)
(0.0033)
Size of
plant
-0.0380
-0.0408
-
0.0405
-
0.0430
-0.0279
-0.0301
(0.0006)
(0.0006)
(0.0007)
(0.0007)
(0.0008)
(0.0008)
Hours
per
worker
0.1718
0.1711
0.2434
0.2427
0.0300
0.0293
(0.0031)
(0.0031)
(0.0035)
(0.0034)
(0.0041)
(0.0041)
Capital
per
worker
0.0367
0.0359
0.0352
0.0345
0.0244
0.0238
(0.0007)
(0.0007)
(0.0008)
(0.0008)
(0.0023)
(0.0009)
Multiplant
firm
0.0045
0.0037
0.0047
0.0041
0.0018
0.0011
(0.0018)
(0.0018)
(0.0019)
(0.0020)
(0.0023)
(0.0022)
Number
350,157
350,157
349,029
349,029
330,301
330,301
R2
0.042
0.045
0.047
0.046
0.013
0.015
Source:
Authors'
calculations.
Dependent
variables
are
percentage
changes in
real
wages
per
worker.
All
specifications
include
dummies
for
plant
age,
region,
and
industry.
Standard
errors
are
in
parentheses.

Table
18.
OLS
Regressions of
Percentage
Changes in
Employment:
Long
Differences,
1976-87
Dependent
variable
Independent
variables
Total
employment
Production
workers
Nonproduction
workers
Exporter in
year 0
0.0032
-0.0009
-0.0103
(0.0010)
(0.0112)
(0.0133)
Nonexporter in
year 0 &
nonexporter in
year 1
Exporter in
year 0 &
-0.0585
-0.0586
-0.0604
nonexporter in
year 1
(0.0143)
(0.0155)
(0.0184)
Exporter in
year 0 &
0.1834
0.1772
0.1364
exporter in
year 1
(0.0130)
(0.0140)
(0.0166)
Nonexporter in
year 0
0.2246
0.2256
0.1826
&
exporter in
year 1
(0.0133)
(0.0144)
(0.0171)
Size of
plant
-0.2188
-0.2323
-0.2231
-0.2365
-0.1976
-0.2089
(0.0046)
(0.0046)
(0.0049)
(0.0049)
(0.0060)
(0.0060)
Hours
per
worker
0.1050
0.0952
0.2115
0.2016
0.0386
0.0474
(0.0276)
(0.0273)
(0.0300)
(0.0297)
(0.0362)
(0.0361)
Capital
per
worker
0.0907
0.0853
0.0944
0.0889
0.0427
0.0383
(0.0054)
(0.0053)
(0.0058)
(0.0058)
(0.0070)
(0.0069)
Multiplant
firm
-0.0228
-0.0264
-0.5259
-0.0133
-0.0598
-0.0625
(0.0140)
(0.0138)
(0.0355)
(0.0149)
(0.0180)
(0.0180)
Number
24,567
24,567
24,435
24,435
23,795
23,795
R2
0.255
0.272
0.239
0.253
0.167
0.175
Source:
Authors'
calculations.
Dependent
variables
are
percentage
changes in
real
wages
per
worker.
All
specifications
include
dummies
for
plant
age,
region.
and
industry.
Standard
errors
are
in
parentheses.

Andrew B. Bernard and J. Bradford Jensen 109
levels are negatively correlated with subsequent growth, while the cor- relations for hours and capital intensity are both large and positive.
The source of the differences in the wage and employment growth regressions is the strong employment growth in plants that export throughout the period. Both starters and continuing exporters perform strongly, with total employment growth rates 5.4 percent higher than those of nonexporters throughout. Employment growth rates for pro- duction workers are actually larger for continuing exporters than for starters. Plants that stop exporting fare particularly poorly, with em- ployment growth rates 7.7 percent lower than either continuing export- ers or starters.
Table 18 reports the relationship between export status and employ- ment growth for continuing plants between 1976 and 1987. Initial ex- port status is positively and significantly correlated with total employ- ment growth during the period, although the coefficients are small, 0.3 percent over eleven years. The estimates for the two categories of workers are negative and not significant. These results are similar to those for the long-run wage changes, and examining the role of export status in the initial and final years, we again see that starters and stop- pers dominate the movements. Continuing exporters outperform con- tinuing nonexporters in terms of employment growth: 18.3 percent, 17.7 percent and 13.6 percent for total employment, production, and nonproduction workers respectively. Starters again grow the fastest, with a relative total employment gain of 28.3 percent compared with stoppers.
Conclusions
In this paper, we have used microeconomic data to explore the role of exporting plants in the manufacturing sector. We performed two distinct analyses: first, we documented the characteristics of exporters and nonexporters, testing whether exporters are relatively successful plants. Second, we examined how these plants have behaved over time, considering variables that influence exporting and whether exporters perform better than nonexporters.
Perceptions that exporters are "better" than nonexporters were borne out by the cross-section evidence from the 1987 Census of Man-
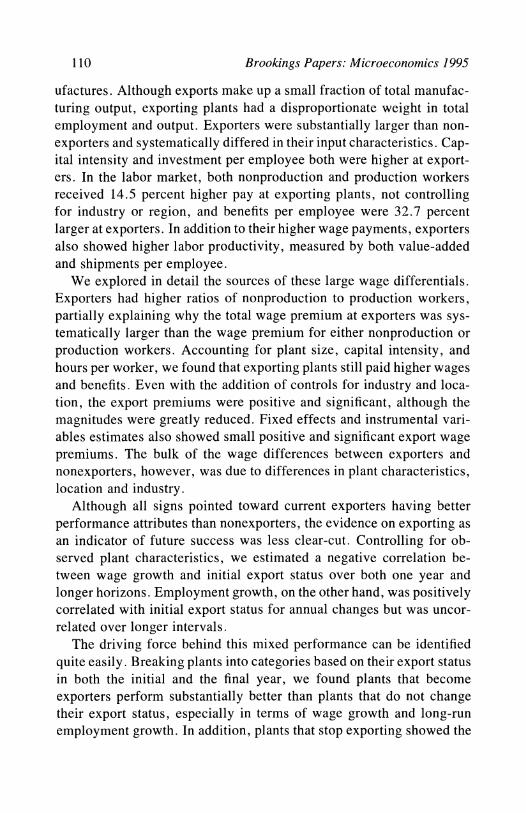
110 Brookings Papers: Microeconomics 1995
ufactures. Although exports make up a small fraction of total manufac- turing output, exporting plants had a disproportionate weight in total employment and output. Exporters were substantially larger than non- exporters and systematically differed in their input characteristics. Cap- ital intensity and investment per employee both were higher at export- ers. In the labor market, both nonproduction and production workers received 14.5 percent higher pay at exporting plants, not controlling for industry or region, and benefits per employee were 32.7 percent larger at exporters. In addition to their higher wage payments, exporters also showed higher labor productivity, measured by both value-added and shipments per employee.
We explored in detail the sources of these large wage differentials. Exporters had higher ratios of nonproduction to production workers, partially explaining why the total wage premium at exporters was sys- tematically larger than the wage premium for either nonproduction or production workers. Accounting for plant size, capital intensity, and hours per worker, we found that exporting plants still paid higher wages and benefits. Even with the addition of controls for industry and loca- tion, the export premiums were positive and significant, although the magnitudes were greatly reduced. Fixed effects and instrumental vari- ables estimates also showed small positive and significant export wage premiums. The bulk of the wage differences between exporters and nonexporters, however, was due to differences in plant characteristics, location and industry.
Although all signs pointed toward current exporters having better performance attributes than nonexporters, the evidence on exporting as an indicator of future success was less clear-cut. Controlling for ob- served plant characteristics, we estimated a negative correlation be- tween wage growth and initial export status over both one year and longer horizons. Employment growth, on the other hand, was positively correlated with initial export status for annual changes but was uncor- related over longer intervals.
The driving force behind this mixed performance can be identified quite easily. Breaking plants into categories based on their export status in both the initial and the final year, we found plants that become exporters perform substantially better than plants that do not change their export status, especially in terms of wage growth and long-run employment growth. In addition, plants that stop exporting showed the

Andrew B. Bernard and J. Bradford Jensen 111
worst performance characteristics. These findings confirmed the per- ception that "good" plants are exporters, but they do not support the notion that on average today's exporters will be tomorrow's success stories.
This combination of results about cross-section characteristics and performance over short and long horizons reinforces the perception that exporters are important plants in the manufacturing sector but that cur- rent export status is a poor indicator of short- and long-run increases in wages. In other words, current exporters have been successful in the past-it is likely that success has helped them become exporters-but there is no guarantee that current exporters will continue to outperform other establishments in the future.
Given the sustained policy interest in promoting exports as a way to increase the performance of the U.S. manufacturing sector, these results call for substantial caution. Consider a policy that aids plants designated as "winners." Our results suggest that using current export status as the selection criterion may pick plants that will do well over short horizons but not necessarily over longer periods. It is likely that such a policy would merely reward previous accomplishments rather than identify future success.
Based on our findings, we conclude that exporting plants have an important role to play in the economy and that future research should focus on how plants move from domestic production to a combination of domestic and foreign sales. Knowing that exporters are successful can help us learn what distinguishes successful plants from failures in the same markets.
Appendix: Data Description
Descriptions of variables are from Census of Manufactures General Summary MC87-S-1 (Bureau of Census 1987). Total employment rep- resents the total number of employees at the plant, which is broken into two components, production workers and nonproduction workers. Pro- duction workers are employees (up through the working foreman level) engaged in fabricating, processing, assembling, inspecting, receiving, packing, warehousing, shipping (but not delivering), maintenance, re- pair, janitorial and watchman services, product development, auxiliary
112 Brookings Papers: Microeconomics 1995
production for plant's own use (for example, powerplant), record- keeping, and other services closely related to these production activities at the establishment. Nonproduction workers include those employees of the manufacturing establishment engaged in factory supervision above the level of line supervisor, including sales, sales delivery, ad- vertising, credit, collection, installation, service, clerical, executive, purchasing, financial, legal, personnel (including cafeteria, medical, etc.), professional, and technical employees. These two categories of employment are clearly inadequate for describing the changing com- position of employment within plants; however, they do capture some of the within-industry heterogeneity across exporters and nonexporters.
Salaries and wages represent the total gross earnings paid in the calendar year to employees at the establishment. Benefits are supple- mental labor costs, both those required by state and federal laws and those incurred voluntarily or as part of collective bargaining agree- ments. Salaries and wages and benefits are deflated by the Bureau of Labor Statistics regional consumer price index (1987 = 100).
Total value of shipments represents the output of the plant. We use the machinery assets at the end of the year as our capital measure. It represents the original cost of all production machinery, transportation equipment, and office equipment and any costs incurred in making the assets usable.47
Value-added is derived by subtracting the cost of materials, con- tainers, fuel, purchased electricity, and contract work from the value of shipments. The result of this calculation is adjusted by the net change in finished goods and work in process between the beginning and end- of-year inventories. Shipments, capital, and value-added are deflated by four-digit sectoral deflators.48 In addition to plant characteristics, we make use of information on the ownership structure of the firm. We construct a dummy for plants that are owned by a larger firm composed of other establishments, either manufacturing or other (such as retail and wholesale).
47. Other research suggests that this measure of capital performs comparably to more detailed measures such as perpetual inventory methods. See Baily, Hulten, and Campbell (1992).
48. Bartlesman and Gray (1994).

Comments and Discussion
Comment by Robert Z. Lawrence: In this useful paper, Bernard and Jensen explore the behavior of exporting plants in the United States. From one vantage point, their results can be judged disappointing, because they suggest that exporting is neither a powerful independent source of growth nor a good predictor of future success. But I think these findings are useful and have an important bearing on three critical questions in current trade policy discussions.
First, premium wages. In the debates about the North American Free Trade Agreement and the Uruguay Round trade agreements, official supporters of the legislation frequently cited the statistic that U.S. jobs associated with exports pay 18 percent more than those in the rest of the economy. The implication was that more exports would mean more jobs with high wages. But, of course, that does not necessarily follow. Workers engaged in exports, for example, might be better educated than those who are not. Such workers might earn higher wages even if they are not engaged in exporting. The key issue, therefore, is whether the association between exports and high wages reflects links that are causal or simply coincidental. Do exports provide benefits that would not be obtained otherwise?
Bernard and Jensen show that the data associating exporting with other measures of success do tend to exaggerate the pure benefits of exporting. The raw data indicate that wages are 14.5 percent higher at exporting plants and benefits per employee 32.7 percent higher. But the authors find that the impact of exports, while positive and statisti- cally significant, is considerably reduced once the effects of capital
113

114 Brookings Papers: Microeconomics 1995
intensity, industry, plant scale, and location are controlled for. One suspects, moreover, that the premiums would be even further reduced if the authors were able to control for worker characteristics. Thus the wage benefits that are attributable solely to exporting appear to be rather small.
At the same time, the partial equilibrium approach adopted here ignores the possibility that an increase in exports could raise the return to plants (or workers) with particular characteristics throughout the economy. It could therefore understate the economywide impact of exporting. Indeed, the central theory of the distributional impact of trade, the Stolper-Samuelson theory, predicts a positive association between exports and the economywide rewards to factors used relatively intensively in export industries. One would not want to conclude, in that model, that because wages of skilled workers were the same in export and import-competing industries, exports (or trade) had not af- fected wages.
Second, exports and growth. In the debate about the sources of the rapid growth in the emerging Asian economies, considerable attention has been paid to the role of export-led growth. Although they differ in the degree to which they protected their domestic markets, all success- ful Asian nations emphasized exports. Some economists, most notably those who participated in the study by the World Bank on the East Asian miracle, have stressed the benefits from exporting and indeed left the impression that the benefits from a dollar's growth in exports ex- ceeds those from other types of activity. According to the World Bank, "broad government support for exports was a highly effective way of enhancing absorption of international best practice technology and thus boosting productivity and output growth. "1 Similar arguments have been applied to industrialized countries. In particular, it is argued that access for U.S. electronics firms to Japan's markets is crucial, not only because of the potential for increased sales, but also because of the benefits firms obtain from learning and competition.
There are many plausible reasons why exporting activity might afford advantages, such as scale economies and exposure to foreign competi- tion, ideas, and customers. But, again, correlation does not necessarily imply causation. Indeed, the chain of causation could actually be re-
1. World Bank (1993, p. 293).
Andrew B. Bernard and J. Bradford Jensen 115
versed. Successful production could lead to more exports rather than the reverse. The findings here that exporting per se adds only small additional benefits casts some doubt on the view that, for a large, industrialized country such as the United States, exporting brings un- usually large benefits. Of course, it might still be the case that, for developing countries, export market exposure is more important.
These findings would have been even more powerful if the authors had used estimates of total factor productivity, rather than just output per employee and wages as their measures of successful performance.
Third, exports and industrial policy. In its report on the East Asian miracle, the World Bank extols the virtues of using export performance as an objective indicator of successful performance. The report de- scribes how the governments of Japan, Korea, and Taiwan organized economic "contests" among their firms in which preferential access to credit, licenses, and foreign exchange were granted to successful ex- porters. "Exports, and especially manufactured, nontraditional ex- ports, were the yardstick against which the success of other allocation decisions-for example, credit allocation, domestic content require- ments and industrial licensing-were judged. . . . From a social stand- point, exporting may be a better indicator of whether a firm merits additional funds than success in selling domestically," the authors said.2 In industrialized countries, similarly, efforts have been made to promote champion firms in export markets, in the belief that export performance brings unusually large social rewards. But the paper dem- onstrated that exports are the result of successful performance but not a predictor of future success in long-term employment and growth in labor productivity. This provides a very useful caution for the type of industrial policy in which exporters are rewarded with various kinds of preferential treatment.
General Discussion: Because the authors' analysis focused on plants rather than firms, the relationship between firm structure and the pro- pensity of plants to export was a topic of concern for some of the participants. F. M. Scherer noted that multiplant firms can be of several types: vertically integrated, horizontally integrated, and conglomerate. He said that in vertically integrated firms, most plants would not be
2. World Bank (1993, p. 97).
116 Brookings Papers: Microeconomics 1995
exporting at all because they would be sending their output to other plants for additional assembly; thus, export propensities would be asymmetrical within a vertical chain. For those firms that are horizon- tally integrated because of the need to decentralize operations in order to reduce transportation costs, low export propensities would be ex- pected. Conversely, those firms that are horizontal because of product differentiation should have plants with a very high propensity to export, as long as the logic of intraindustry trade is correct. Scherer said that the export picture for conglomerates was somewhat unclear. In re- sponse, Henry Aaron argued that a high propensity to export would also be found in vertically integrated transnational companies, because such firms must send their intermediate products across international borders.
Several participants discussed data, modeling, and measurement is- sues and suggested avenues for additional research. Eric Bartelsman argued that the four-digit price deflators used in the paper were not sensitive enough to the product mix in some of the industries, such as chemicals and precision instruments, where exports are concentrated. As a result, he said, the productivity effects from exporting may have been underestimated.
Frank Lichtenberg argued that a firm that wishes to enter a foreign market must choose between exporting and building a new plant in that country. Thus, he said, the authors' exclusive reliance on Census of Manufactures data, which cover only domestic plants, leads to a sample selection bias. He suggested that the authors look at Compustat geo- graphic segment data, which includes information on both overseas and domestic employment at the firm level.
Sam Peltzman noted that the paper's data covered a period of signif- icant exchange rate movements. He argued that the authors' results were picking up the lag effects of, first, the low dollar of the early 1980s and, later, the high dollar of the mid-1980s. He suggested that the authors examine whether the characteristics of firms drawn into exporting when exchange rates are favorable differ systematically from those of firms entering the export business when they are not.
Susan Collins said that it is not surprising that, over the long-run and once industry and other characteristics are controlled for, exporting plants do not significantly outperform nonexporters. She argued that several trade models imply that it is exactly those characteristics that

Andrew B. Bernard and J. Bradford Jensen 117
determine the propensity of a plant to export. Thus, she suggested, rather than looking for differences between exporting and nonexporting plants, the authors should focus on the effects of impediments to ex- porting and what happens to plant performance when such impediments are removed. According to Collins, possible export impediments would include export disincentives of U.S. economic policy, labor disputes, and foreign trade barriers.
Aaron agreed with discussant Robert Lawrence, arguing that the controls for plant characteristics utilized by the authors may have hid- den some of the wage effects of exporting. He said that if industries in which exports are concentrated have, by chance, a high ratio of non- production to production workers or of high- to low-wage workers, a rising demand for exports caused by, for example, falling exchange rates, would have the effect of raising the demand for nonproduction or high-wage workers, which would increase their employment and income relative to that of production or low-wage workers.
Ralph Landau argued that one of the most important benefits indi- vidual firms receive from exporting (and from dealing with the impact of imports) is the opportunity to compete against the world's most efficient companies. He said that this search for competitiveness- enhancing innovations forces firms to invest in research and develop- ment. An example, he said, is Germany's I.G. Farben chemical cartel, which was formed as a monopoly in the 1920s and thus in theory should have been uncompetitive. The country's need to earn hard currency to pay its World War I reparations obligations, however, compelled Far- ben to export and, in turn, to compete with such leading international firms as DuPont and Monsanto. This competition forced Farben to develop several important innovations, some of which were still con- tributing to the international success of the German chemical industry after World War II.

118 Brookings Papers: Microeconomics 1995
References
Aw, Bee-Yan, and Geeta Batra. 1994. "Exports, Firm-Size, and Wage Ine- qualities." Pennsylvania State University, Economics Department. March.
Baily, Martin Neil, Charles Hulten, and David Campbell. 1992. "Productivity Dynamics in Manufacturing Plants." Brookings Papers on Economic Activ- ity: Microeconomics: 187-249.
Barron, John M., Dan A. Black, and Mark A. Loewenstein. 1987. "Employer Size: The Implications for Search, Training, Capital Investment, Starting Wages, and Wage Growth." Journal of Labor Economics 5 (January): 76- 89.
Bartelsman, Eric, and Wayne Gray. 1994. "NBER Manufacturing Productivity Database." Boston: National Bureau of Economic Research. December.
Bernard, Andrew B. 1995. "Exporters and Trade Liberalization in Mexico: Production Structure and Performance." MIT, Department of Economics. February.
Bernard, Andrew B., and J. Bradford Jensen. 1994a. "Exporters, Skill- Upgrading, and the Wage Gap." Center for Economic Studies Discussion Paper 94-13. Bureau of the Census, Washington. November.
. 1994b. "Exporters, Jobs, and Wages in U.S. Manufacturing." MIT Department of Economics Working Paper No. 95-7. December.
Brown, Charles, and James Medoff. 1989. "The Employer Size-Wage Ef- fect." Journal of Political Economy 97 (October): 1027-59.
Bureau of the Census. 1987. Census of Manufactures General Summary MC87- S-l. U.S. Department of Commerce.
Davis, Steve J., and John Haltiwanger. 1991. "Wage Dispersion Between and Within U.S. Manufacturing Plants, 1963-1986. " Brookings Papers on Eco- nomic Activity: Microeconomics. 115-80.
Davis, Steve J., John Haltiwanger, and Scott Schuh. 1991. "Published versus Sample Statistics from the ASM: Implications for the LRD." Center for Economic Studies Discussion Paper 91-1. Bureau of the Census, Washington.
Doms, Mark, and Timothy Dunne. 1994. "Capital Adjustment Patterns in Manufacturing Plants." Center for Economic Studies Discussion Paper 94-11. Bureau of the Census, Washington. August.
Doms, Mark, Timothy Dunne, and Ken Troske. 1994. "Workers, Wages, and Technology." Center for Economic Studies. Bureau of the Census, Wash- ington. April.
Dunne, Timothy, and James A. Schmitz, Jr. 1992. "Wages, Employer Size- Premia, and Employment Structure: Their Relationship to Advanced-Tech- nology Usage at U.S. Manufacturing Establishments." Center for Economic

Andrew B. Bernard and J. Bradford Jensen 119
Studies Discussion Paper 92-15. Bureau of the Census, Washington. Decem- ber.
Katz, Lawrence F., and Lawrence H. Summers. 1989. "Can Interindustry Wage Differentials Justify Strategic Trade Policy?" In Robert C. Feenstra, ed., Trade Policies for International Competitiveness, 85-124. University of Chicago Press.
Krueger, Alan B., and Lawrence H. Summers. 1988. "Efficiency Wages and the Inter-Industry Wage Structure" Econometrica 56 (March): 259-93.
Mellow, Wesley. 1982. "Employer Size and Wages." Review of Economics and Statistics 64 (August): 495-501.
Osterman, Paul. 1994. "How Common Is Workplace Transformation and Who Adopts It?" Industrial and Labor Relations Review 47 (January): 173-88.
Revenga, Ana L., and Claudio Montenegro. 1995. "North American Integra- tion and Factor Price Equalization: Is There Evidence of Wage Convergence Between Mexico and the United States?" Paper prepared for the Brookings Conference on Imports, Exports, and the American Worker, February 2-3, 1995.
Spencer, David E., and Kenneth N. Berk, 1981. "A Limited Information Specification Test." Econometrica 49 (June): 1079-85.
Summers, Robert, and Alan Heston. 1991. "The Penn World Table (Mark 5): An Expanded Set of International Comparisons, 1950-1988." Quarterly Journal of Economics 106 (May): 327-68.
World Bank. 1993. The East Asian Miracle: Economic Growth and Public Policy. Oxford University Press.