export marketing:a case study of handicraft exporters kenya
TRANSCRIPT

EXPORT MARKETING:>A CASE STUDY OF ^HANDICRAFT EXPORTERS
iIN !>KENYA.
BYSUSAN ATIENO
■< <i>
A Research Paper Submitted to the Department of Economics, University of Nairobi in
Partial Fulfilment of the Requirements of the Degree of Master of Arts in
Economics.
1988.
UNIVERSITY OF NAIROBI LIBRARY

1 1
This Research Paper is my original work and has not been presented for a degree
in any other University.
SUSAN ATIENO
This Research Paper has been submitted for examination with our approval as University of Nairobi Supervisors.
CKA ' b ! %
DR. S.W. MASAI
9 ^
DR. K.K. MUKERUEE J/7/sf .

- iii
ACKNOWLEDGEMENTS)Itij I am grateful to Dr. Masai and Dr. Mukerjee ofthe Department of Economics, University of Nairobi, who devotedly supervised this research project.
I would like to thank all the senior officials at the Kenya External Trade Authority and the Kenya National Chamber of Commerce for their assistance. I am unable to thank here by name all the handicraft exporters who assisted me by responding to the questionnaire and all those who assisted in one way or other to trace the handicraft exporters. Shabbir, one of the exporters, deserves mention here for his invaluable support during my trip to Mombasa. i
I am also grateful to my colleagues in the M.A. programme, especially Gathiaka for the constructive comments they offered since the beginning of this project. I also thank my husband Fred and all members of our family who have all along taken keen interest in whatever I was doing. I am also particularly grateful to Mr. P. Kimani for typing the Research Paper.
SUSAN ATIENO1988.

ABSTRACT
The Government of Kenya has been keen on reducing the country's dependence on coffee, tea and petroleum as the main sources of foreign exchange. Kenya's petroleum exports contain little value added as the crude oil is imported whereas the growth in coffee and tea exports is often very minimal due to the low income elasticity of demand for coffee and tea. Since 1976, the Kenya Government has through its Kenya External Trade Authority (KETA) been playing an active part in the promotion of handicraft exports in Kenya. However, very little is known about the exporters, their problems and factors explaining for the varying levels of export sales amongst the handicraft exporters. The reason for this is that there has been very limited research on handicrafts in Kenya. Lack of adequate time series data does not allow an empirical analysis be made into the factors affecting handicraft exports from Kenya.
This study is an exploratory one, it makes a diagnosis of the problems facing Kenya's, handicraft exports and attempts at solutions based on the theoretical concepts of the product life cycle and the export cycle. It is concerned with the efforts that should be undertaken to avoid future fluctuations in Kenya's handicraft exports. It also suggests measures to cope with the stiff competition now prevailing in the international market.

V
Using Ordinary Least Squares, the study analyses the variation in export sales amongst the handicraft exporting firms in Kenya. As a result, the differences in levels of marketing efforts, experience in exporting handicrafts and institutional support from the KETA, were found to be explaining for a significant proportion of the variation in export sales amongst the firms.
The main finding of the study is that export sales are positively correlated with the proxy variables used in the study for levels of marketing effort, experience and institutional support from the KETA. The proxy for experience in exporting handicrafts, was found to have the greatest impact on export sales. However, the impact of the proxy for institutional support from the KETA was found to be statistically insignificant. This study however, underscores the importance of enhancing the exporters' ability to undertake successful promotional ventures aimed at the foreign markets.

VI
TABLE OF CONTENTSII’ PAGEi
TITLE OF RESEARCH PAPER........................ (i)I
DECLARATION .................................... ( ii)ACKNOWLEDGEMENTS ............................... (iii)ABSTRACT ....................................... (iv)TABLE OF CONTENTS .............................. (vi)
CHAPTER ONE: INTRODUCTION 11.0 Background to the Study..... 51.1 The Rationale for the Study . 121.2 Objectives of the Study .... 121.3,Definition of the Term
"Handicrafts" .......... 121.4 The Structure of Kenya's
Handicraft Exports ......... 151.5 The Organization of
Production and Marketing ofHandicrafts in Kenya ....... 23
1.6 Importance of the Study .... 301.7 Plan of the Remainder of
the Paper .................. 31
CHAPTER TWO: LITERATURE REVIEW2.1 Review of Literature on
Handicrafts 35

Vll
PAGE2.2 Theoretical Framework ..... 43
2.3 The Model .................. 4 82.4 Hypotheses of the Study ..... 51
CHAPTER THREE: THE RESEARCH METHODOLOGYINTRODUCTION 55
3.1 The Sampling Procedure ...... 573.2 Estimation of the Variables . 583.3 Data Analysis ............... 61
CHAPTER FOUR: ANALYSIS OF DATAINTRODUCTION 64
4.1 An Analysis of the RolePlayed by the K ETA.......... 64
4.2iThe Characteristics ofPrivate Handicraft .......... 78
4.3 Results of the Regressionand Correlation Analysis .... 104
CHAPTER FIVE: CONCLUSIONS AND IMPLICATIONS OFTHE STUDY
5.1 Results and Discussion ...... 1105.2 Conclusions of the Study .... 1185.3 Limitations of the Study .... 1195.4 Recommendations ............ 1205.5 Suggestions for Future
Research ................... 128BIBLIOGRAPHY 129APPENDICES 134

i
CHAPTER ONE-- f--------)
INTRODUCTION
1.0 BACKGROUND TO THE STUDY
The Kenya Government places a high priority in the generation of self-employment and the expansion of exports. The generation of self-employment opportunities is imperative given the slow growth of wage employment particularly in the modern sector. According to the fifth Kenya Development Plan (1984-1988), total employment has been growing at a much slower rate than the population and the labour force. Between 1976 and 1981, total employment grew by an annual growth rate of only 3 per cent while the population and the labour force increased by an annual growth rate of slightly above 4 per cent within the same period. The need for creating self-employment opportunities is underscored by the fifth plan which says that:
"the Government will continue its policy of making self-employment more attractive by’expanding training facilities...... "1
It is also stated that the Government will continue to support the informal sector by providing the essential infrastructural facilities and that several measures would be undertaken to ensure that the sector, does not suffer from unnecessary harassment from the authorities.

2
The rapidly rising demand far imported goods,i
demands that there shou'ld be a rapid expansion ofexports. Kenya's total earnings hive in the past beensubject to sporadic fluctuations owing to exogenousfactors such as inadequate demand for her agriculturalproducts and global overproduction of coffe and teathereby resulting in the instability of their pricesin the international market. The Government's effortsto diversify Kenya's exports from an agricultural base,by encouraging the export of manufacturers have beenhindered by unfavourable tariff and non-tariffrestrictions adopted by the developed economies. Thefifth Development Plan emphasized the need for anappropriate export promotion strategy and outlined thevarious programmes to be used for expanding Kenya'sexports. Indeed, 1984, was declared the year of exportspromotion and other measures such as the improvementof export channels and schemes have been undertaken.Despite a vigorous compaign however, the composition ofexports and total export earnings did not change much.Coffee, tea and petroleum products which traditionallyaccount for 45 to 50 per cent of total exports remain
2to be the country's major foreign exchange earners.As shown in Table 1.1, the relative share of manufactured exports in the total merchandise exports showed a decline from 20.7 per cent in 1974 to 12.8 per cent in 1983.
The scarcity of arable land and the growing food

TABLE 1.1: COMPOSITION OF COMMODITY EXPORTS 1966-1983 fKE'OOO)
Year
(1)
PrimaryExports(PX)
(2)
ManufacturedExports(MX)
(3)
TotalExports(X)
(4)
GrossDomesticProduct(GDP)(5)
MX as a Percentage of X
(6)
MX as a Percentage of GDP (GDP)(7)
PX as a Percentage of X
(8)1966 52,000 6,000 58,000 381,000 10.7 1.6 ' 88.91967 47,000 6,000 54,000 406,000 10.6 1.4 88.71968 57,000 7,000 58,000 439,000 11.8 1.6 87.51969 56,000 7,000 63,000 476,000 11.8 1.6 87.81970 78,000 25,000 103,000 522,000 24.6 4.9 75.21971 79,000 28,000 107,000 57 6*j 000 26.5 4.9 73.41972 98,000 25,000 123,000 658,000 20,6 3.9 79.11973 122,000 38,000 160,000 793,000 23.3 5.1 78.51974 167,000 44,000 211,000 895,000 20.7 4.9 79.21975 175,000 40,000 215,000 1,028,000 18.7 3.9 81.31976 269,000 49,000 319,000 1,263,000 15.5 3.9 84.51977 432,000 48,000 480,000 1,635,000 10.0 2.9 89.91978 321,000 48,000 370,000 1,780,000 13.1 2.7 86.81979 332,000 53,000 386,000 1,975,000 13.8 2.7 86.21980 420,000 67,000 488,000 1,135,000 13.8 3.0 86.51981 439,000 74,000 514,000 2,597,000 14.5 2.9 85.51982 478,000 68,000 546,000 2,951,000 12.4 2.3 87.61983 355,000 81,000 631,000 333,000 12.8 2.4 87.2
Source: Kenya Statistical Abstract: Various Issues.

4
requirements ^arising from the rapid growth of th =;
population hdve been rendering the expansion ofI -_■" ' /agricultural '"exports much more difficult. There is therefore an urgent need, to promote alternative exportable goods outside the formal manufacturing and agricultural sectors. The need is even more urgent since the share of commodity exports in total commodity imports has been declining in the past, from 73 per cent in 1965 to 57 per cent in 1983?
The development of the handicraft sector in Kenya is one way of achieving the Government's development goals because of the high potentialities of self-employment in the sector and the ability of handicrafts to penetrate foreign markets. Handicrafts are efficient foreign exchange earners because the production of handicrafts entails little or no imported inputs (Kathuria, 1985) . Since handicraft production units are widely dispersed throughout the country, the development of the sector can go along way towards benefitting people throughout the country. Handicrafts also generate foreign exchange indirectly through the purchases of souvenirs made by tourists. Over500,000 tourists currently visit each year, howevertheir actual expenditure on handicrafts has never been
, 4estimated.
The Kenya Government recognizes the role of the handicraft sector in economic development and has since
5
1976 embarked on active programme for the promotion of Kenyan handicrafts abroad. The Kenya External Trade Authority (KETA) which bears the responsibility of implementing acting aimed at expanding and diversifying Kenya's exports, is also charged with the responsibility of promoting handicraft exports. The handicraft sector in Kenya, however, suffers various setbacks in terms of production, marketing and training facilities. However, given the limitations imposed by time and resource availability it is not possible to study the entire sector. This study focusses on the export marketing of handicrafts and seeks to generate information on the handicraft exporters in Kenya.
1.1 THE RATIONALE FOR THE STUDY-------- s------------------------
Kenya's handicraft exports have grown very remarkably as shown in Tables 1.2 to 1.5, except for 1986 when there was a decline in the values of handicraft exports from Ksh.124.14 million in 1985 to, 5Ksh.97.66 million in 1986. Benjamin (1977), estimated
that Kenya exported handicrafts worth Ksh.10 million in 1977. The increase in handicraft exports has therefore, been quite remarkable since the KETA startedft
its active promotion of handicraft exports in 1977. Following the 1986 decline, some recovery in the value of handicraft exports was, however, realised in 1987 when the exports amounted to Ksh.140.41 million.

6
The share of handicrafts in total exports has also grown remarkably from 3.26 per cent in 1981 to 15.81 per cent in 1985 but declined to 10.19 per cent in 1986. Stiff competition and the .inability of the Kenyan exporters to compete effectively in the world market are the major setbacks to increasing handicraft exports. At present stiff competition is being encountered from countries such as Japan and Philippines which have in the recent years embarked on large scale production of some of Kenya's traditional handicrafts such as the sisal baskets. The stiff competition prevailing in the international market and amongst Kenyan handicraft exporters calls for the need to undertake deliberate efforts aimed at maintaining and increastng market shares both at the national and the exporting firms levels. This is necessary given that coping with strong competition requires more organised and aggressive marketing than is existing at present.The basic premise of the study therefore, is that successful export marketing is a function of marketing efforts.
The rationale for the study arises from the fact that, while the Kenya Government policy is strongly in favour of promoting handicraft exports, very little is known regarding the handicraft exporters approach to international trade and the factors explaining for the differences in the level of export sales at the firm level
7
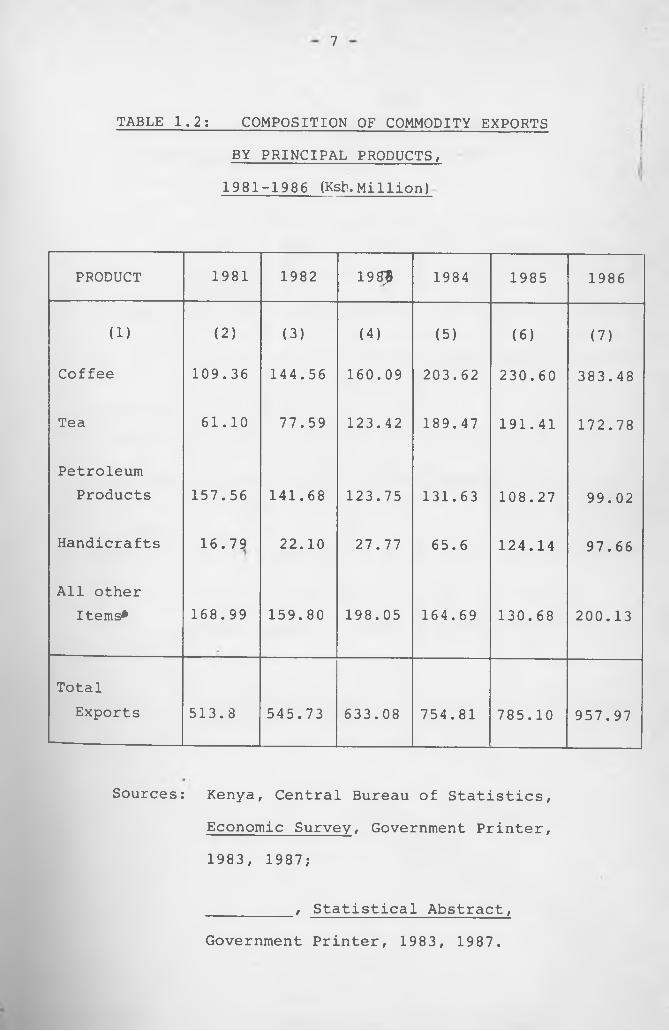
TABLE 1.2; COMPOSITION OF COMMODITY EXPORTS BY PRINCIPAL PRODUCTS,1981-1986 (Ksfr.Million)
PRODUCT 1981 1982 198? 1984 1985 1986
(1) (2) (3) (4) (5) (6) (7)
Coffee 109.36 144.56 160.09 203.62 230.60 383.48
Tea 61.10 77.59 123.42 189.47 191.41 172.78
PetroleumProducts 157.56 141.68 123.75 131.63 108.27 99.02
Handicrafts 16.79 22.10 27.77 65.6 124.14 97.66
All other Items* 168.99 159.80 198.05 164.69 130.68 200.13
TotalExports 513.8 545.73 633.08 754.81 785.10 957.97
Sources: Kenya, Central Bureau of Statistics,Economic Survey, Government Printer, 1983, 1987;
_________, Statistical Abstract,Government Printer, 1983, 1987.

8
TABLE 1.3: PERCENTAGE SHARE OF PRINCIPALPRODUCTS IN TOTAL EXPORTS, 1981-1986.
1981 1982 1983 1984 1985 1986
Coffee 21.29 26.48 25.28 26.97 29.37 40.55
Tea 11.89 14.21 19.49 25.20 24.38 18.03
PetroleumProducts 30.67 25.96 19.54 17.45 13.79 10.33
Handicrafts 3.26 4.04 4.38 8.69 15.81 10.19
All Other Items 32.89 29.31 31.31 21.79 16.65 20.90
Total 100.0 100.0 100.0 100.0 100.0 100.0
Source: Computed from Table 1.2 above.

TABLE 1.4: HANDICRAFT EXPORTS FROM KENYA BY DESTINATION 1981-87 (KSHS. MILLION)f
COUNTRY1981 Per
centage of the Total
1982 Percentage of the Total
1983 Percentage of the Total
1984 Percentage of the Total
1985 Percentage of the Total
1986 Percentage of the Total
1987 Percentage of the Total
U.S.A. 10.87 64.74 15.42 69.77 18.78 67.62 49.57 75.56 96.00 77.33 53.16 54.43 40.51 30.00WestGermany 1.00 5.96 1.01 4.57 1.04 3.75 5.00 7.62 9.05 7.29 11.91 12.20 36.50 26.00U.K. 0.93 5.53 0.36 1.63 0.75 2.70 1.56 2.38 3.00 2.42 10.08 10.32 15.07 10.73 >Japan 0.93 5.53 1.70 7.69 2.4 i 8.71 1.95 3.00 3.45 2.78 2.13 2.18 4.03 3.00Netherlands 0.44 2.62 0.38 1.72 0.39 1.40 0,42 0.64 0.60 0.48 0.91 0.93 0.42 0.30Denmark 0.19 1.13 0.07 0.32 0.07 0.25 0.25 0.38 0.61 0.49 1.57 1.61 1.73 1.23Sweden 0.12 0.71 0.08 0.36 0.23 0.82 0.33 0.50 0.12 0.01 0.72 0.74 0.73 0.52France 0.34 2.03 1.51 6.83 1.49 5.37 3.62 5.52 3.55 2.86 4.19 4.29 11.97 8.53Spain 0.16 0.95 0.48 2.17 0.55 2.00 0.06. 0.10 0.14 0.11 1.09 1.02 6.31 4.50CanaryIsle - - 0.28 1.27 0.27 0.97 _ • _ _ _ _
Canada 0.53 3.16 0.33 1.49 0.35 1.26 0.87 1.32 1.83 1.47 3.08 3.15 7.57 6.40Australia 0.40 2.38 . 0.05 0.23 0.05 0.18 0.75 1.14 0.72 0.58 2.70 2.7Tr- — 4.7-1 3.35Italy 0.01 0.06 0.46 2.08 0.24 0.86 0.19 0.29 0.97 0.78 0.51 0.52 4.45 3.17Norway 0.17 1.01 0.02 0.09 0.07 0.25 0.12 0.18 0.19 0.15 0.32 0.33 0.89 0.63Switzerland 0.25 1.49 0.54 2.44 0.55
w2.00 0.70 1.07 1.39 1.12 0.89 90.91 1.70 1.21NewZealand 0.10 0.60 0.05 0.23 0.01 3.60 0.01 0.02 0.14 0.11 0.03 0.03 0.41 0.30Singapore - - 0.02 0.09 - - - - - - - - - -
Belgium 0.02 0.12 0.09 0.41 0.01 3.60 0.01 0.02 0.15 0.12 3.10 3.17 1 1.22 0.87Finland - - - - - - - - - - 0.23 0.24 1.24 0.88Austria 0.14 0.83 0.01 0.05 0.05 0.18 0.09 0.14 0.07 0.06 0.07 0.07 0.79 0.56Others 0.15 0.89 0.09 0.41 0.5 1.80 0.59 1.00 1.69 J __ 1.-3Q 0. 1 A


11
TABLE 1.5: HANDICRAFT EXPORTS FROM KENYA o-/
iBY PRODUCT GROUPS
1981-871(KSHS. MILLION)
aP av/ Ay
PRODUCT YEAR
1981 1982 1983 1984 1985 1986 1987
1. Wood Carvings 10.58 11.33 12.45 21.84 21.42 19.09 37.42(%) (63%) (51%) (44%) (33%) (17%) (19%) (26%)
2. Sisal Baskets 2.74 5.86 11.36 35.42 91.35 50.23 54.56(%) (16%) (26%) (40%) (53%) (73%) (51%) (38%)
3. Soapstone Carvings 1.04 1.27 1.51 1.87 3.60 2.10
99.49
(%) ( 6%) ( 5%) ( 5%) ( 2%) ( 2%) ( 2%) ( 6%)
4. Jewellery 0.29 0.46 0.55 1.20 4.50 2.27 6.32(%) ( 6%) ( 5%) ( 5%) ( 2%) ( 2%) ( 2%) ( 6%)
5. All Other Handicrafts 2.72 3.17 1.89 3.26 3.27 23.97 32.62
(%) (16%) (14%) ( 5%) ( 4%) ( 2%) (24%) (23%)
Total(Ksh. Million) 16.75 22.10 27.77 65.60 124.14 97.66 140.41
Source: Certificates of Origin Maintained by KETA(1981-1987)

12
1.2 OBJECTIVES OE THE STUDY----- —----------------------------- r--- -J
The purpose of this stud j is fourfold:
1. To identify the marketing strategies pursued by the handicraft exporters to cope with the stiff competition prevailing in the international market.
2. To identify the factors constraining export sales at the firm level.
3. To explain for the varying levels of export sales that exists amongst the handicraft exporting firms in Kenya.
4. On the basis of (1) (ii) and (iii) to make recommendations about the measures that could be adopted at the firm level and policies which could aid in promoting increased handicraft exports in terms of earnings.
1 .3 .DEFINITION OF THE TERM "HANDICRAFTS"
There is no exact definition of handicrafts but as is suggested by the term, handicrafts are handmade goods in the sense that they require little or no production machinery. They are a class within the category of hand-made goods. What distinguishes

13riII
handicrafts from the rest of hand-made products,i;is that they are either part of the culture or
they reflect the culture of the region in which they are produced. Apart from India, no country in the developing world, has a precise list of products classified as handicrafts. Owing to the lack of agreement at the international level as to what actually constitutes handicrafts, the following provisional definition was adopted in 1969 by the United Nations Conference on Trade and Development (UNCTAD) Intergovernmental Group of Experts Meeting on Tariff Reclassifications:
The term hand-made covers articles produced with simple tools or instruments in most cases pedal-powered or handled by the craftsman himself or with no tools at all. This category includes items, such as handicrafts, which often have the additional characteristics such as having traditional or artistic features typical of the country or region in which they were produced or being fashioned by artists working in their homes. Some articles such as machine-made dresses with hand embroidery or other decorations, may be produced partly by machine and in this case, the term "handicraft" or "hand-made" apply if the main characteristics of the finished article is imparted by the manual part of production.6
s

14
This- definition is wide in that it covers allihand-made goods. However, it points to the fact that
,!handicrafts' are a sub-set within the class of hand-made goods. In this study all hand-made goods, that are part of the traditional culture of any ethnic group in Kenya or reflect traditional African culture, will be considered as handicrafts. Modern crafts such as tie and dye, jewellery, batiks and leatherwork will also be included. It is however difficult to develop a clear-cut definition for handicrafts.
The definition adopted by UNCTAD is used internationally for the administration of the Generalized System of Preferences (GSP) which partly or totally exempts handicrafts from developing countries from the payment of import duties. However, an authorized agency of the country in favour must issue a certificate of origin against those handicraft exports for which preferential treatment is required. In Kenya, the KETA is responsible for official identification of handicrafts. The KETA uses the categories shown in Table 1.5 to classify the- wide variety of handicrafts produced in Kenya. The Authority has however, made no attempt to define Kenyan handicrafts.
The growing importance of handicrafts in international trade arises from the desire by consumers ln the developed countries to possess products that

15
portray the traditional cultures of people in the underdeveloped countries. The growing demand for handicrafts is also attributable to the growing preference in the developed countries for hand-made goods made out of natural materials as opposed to products produced en masse through capital intensive processes.
1.4 THE STRUCTURE OF KENYA'S HANDICRAFT EXPORTS
The KETA has since 1981 been compiling statistical data on Kenya's handicraft exports. These statistical data are rather sketchy as they only include export shipments for which preferential treatment under the GSP and EEC schemes has been applied for. The data are compiled from commercial invoices and Form A or EUR forms (See Appendix I) submitted to the KETA by the exporters for the issuance of a Certificate of Origin.The data therefore, excludes export shipments where Certificates of Origin have not been sought. The figures available from the KETA therefore, give only a rough picture of Kenya's handicraft exports. The Annual Trade Statistics published by the Ministry of Finance on the basis of the Standard International Trade Classification (SITC) codes, do not provide a solution to the problem because goods entering international trade are classified °n the basis of materials used in their production.

16
The SITC codes also allow for the possibility of classifying a product in more than one SITC numbers. Wood-carvings, for instance, can be included under SITC numbers 635.42, 635.49, 635.9 or 899.1. Since there are no taxes or levies on handicraft exports, the Customs authorities in Kenya accept any Statistical Code entered on the forms by the shipper.This statistical problem can be rectified if the KETA is notified about all handicraft exports leaving the country.
Tables 1.4 and 1.5 illustrate the changes that have occured in the structure of Kenya's handicraft exports. The tables provide evidence that there has been lack of product and market diversification all along. 1
The other important importers of Kenya handicraft going by the level of handicraft export sales in 1987 are West Germany (26%) , the United Kingdom (10%), France (8%), Canada (6%), Spain (4%), Australia (3%) and Japan (3%). Handicraft export sales to West Germany increased dramatically from Ksh.12 million in 1986 to Ksh.26 million in 1987. Table 1.4 indicates that in 1987 Kenya's export market for handicrafts, was much more diversified than in the rest °f the years where exports to the U.S.A. dominatedthroughout.

17
Table 1.5 shows that sisal baskets, which are also popularly known as 'Chondo' or 'Kiondo', have been a predominant export item for the handicraft sector in Kenya since 1983. In 1981 the share of sisal basekts in handicraft exports was only 16 per cent and this has steadily grown to 73 per cent in 1985.However in 1986, due to changes in the foreign market and factors affecting the export marketing of handicrafts at home, the share of sisal baskets in handicraft exports fell to 51 per cent and has continued to fall to 38 per cent in 1987. The reason for this decline is due to the stiff competition in the U.S.A. market and some unfair pricing tactics used by the Kenyan exporters to dislodge one another from the export market. By 1985 the handicrafts export business was in serious problems as explained by Mr. F. Macharia the Chairman of the Kenya National Chamber of Commerce in the "Kenya Export News" of October, 1985. The quality of handcrafts was deteriorating rapidly and the exporters were engaged in cut-throat competition. At the same time, business was being lost to foreign buyers who had embarked on buying handicrafts directly from the producers "at extremely very low prices".
The United States of America (U.S.A.) continues to be the principal buyer of Kenya's handicrafts. The value of exports to the U.S.A. rose rapidly and reached a peak in 1985. The value of handicraft exports to the

18
U.S.A. has continued to decline since 1986. Between1981 and 1985, the U.S.A. accounted each year for about70 per cent of Kenya's handicraft exports. In 1986and 1987 the share of handicraft exports to the U.S.A.in total handicraft exports was only about 50 and 30per cent respectively. This decline is also reflected
Table 1.5 which show thatby the figures in/ Kenya exported handicrafts worth only Ksh.53 million in 1986 and Ksh.40 million in 1987 compared with Ksh.96 million in 1985.
The drastic fall in exports to the U.S.A and the decline in the total handicraft exports which ensued in 1986, was due to the sharp decline in the value of sisal basket exports. The U.S.A. has been the principal buyer of sisal baskets from Kenya but the recent stiff competition from Japan and Philippines has led to a crash in prices of sisal baskets in the U.S.A. and in other foreign markets. The crash in the prices of sisal baskets abroad is also attributable to the intense price competition prevailing amongst the Kenyan exporters which has caused an excess supply of the baskets in the major foreign markets. This market situation has also been aggravated by unscrupulous traders in Kenya, whose prime objective is to transfer foreign exchange to foreign bank accounts rather than earning it for the country. Such traders have helped to flood the foreign markets with cheap poor quality baskets sold at large discounts to their accomplices

19
abroad. II)|
In order to minimize the competition amongst the Kenyan exporters, the registered handicraft exporters in Kenya formed the Kenya National Handicraft Organization (KNHO) in 1985 under the auspices of the Kenya National Chamber of Commerce and Industry (KNCCI). Following a recommendation by the KNHO, the Government instituted a minimum Free On Board (FOB) price for sisal baskets in 1986 in a bid to minimize foreign exchange fiddles. The new price affected several exporters who had to cancel export orders if the prices agreed upon with the importer were lower than the new FOB price of Ksh.70 per basket. In the same year, handicrafts were struck off from the Export Compensation Schedule during the presentation of the budget in June 1986. Only those goods which are subject to sales tax remained eligible for export
gcompensation. Those exporters who found it unprofitable to export at their usual prices without export compensation had to cancel so.me export orders.All the factors discussed above, affected handicraft exports negatively thereby reducing the total earnings from handicrafts exports in 1986.
Before the sisal baskets became a major export item in 1983, wood-carvings were the pre-dominant item ln KenYa's handicraft exports. Up to 1983, wood-carvings

20
constituted about 60 per cent of handicrafts exports« [
each year. The relative share of wood-carvings in1t
handicraft exports has steadily declined to 26 petcent in 1987. The value of wood-carvings exportshowever rose in absolute terms from Ksh.10.58 millionin 1981 to Ksh.37.42 million in 1987. Unlike thesisal baskets, the constraints to expanding wood-carvingsexports, exist on the supply side rather than on thedemand side due to two major reasons. In the firstinstance, very few entrepreneurs have had success
for wood carvingsintroducing new designs/due to the conservative and9independent nature of the Akamba carvers. For this
reason, the market continues to be supplied with the same designs. The KETA, for instance, has the following to say about wood carvings:
"Wood carvings are well liked.....but not guite as much as they used to be, as for the most part the same designs are used over and over again."10
Secondly, the supply of wood is unreliable in Kenya due to the stringent forest conservation measures being undertaken by the Government. As a result, the Muhugu" wood(or Branchelea is Hutchinsi) which is used in wood carving is very scarce. The KETA has in the Past being promoting the use of alternative wood but with little success. The major competitors in the world Market for wood-carvings are Thailand, Indonesia and roany other African countries. Kenya however, has a

21
competitive edge over the Asian countries with respecti
to wood-carvings owing to the durability of the wood used.
The Kisii Soapstone carvings are the third important export items and account for about 4 per cent of Kenya's handicraft exports each year. The value of soap stone exports has generally been about Ksh.2 million a year but in 1987 the value rose drastically to Ksh.9.49 million. The major limitation to increasing soapstone exports, however, lies in the nature of the stone. In its natural state, the stone is very fragile and heavy and therefore entails higher shipping costs relative to value. The KETA has been helping carvers minimize on weighti by suggesting better carving techniques.
Benjamin who was up to 1982 an export marketing adviser to the KETA carried out experiments which proved that the problem of easy breakage can be resolved by subjecting the soapstone carvings to intense heat in a kiln. This finding has so far not been adopted on a commercial basis. Competition from other countries is minimal in the international market, because of the unique colours of the Kenyan soapstone.In Kenya, the stone is mined at Tabaka location of Kisii district.

22
{Hand-made jewellery are the next importantI
handicraft exports in Kenya; They account for aniannual average of 4 per cent of Kenya's handicraft
exports. In 1987, hand-made jewellery exports fetched a total of Ksh.6.32 million compared to Ksh.4.5 million in 1985 and Ksh.2.27 million in 1986. Precious jewellery are excluded from this category of handicrafts. This category of handicrafts only includes traditional ornaments fashioned from beads, clay, and se^ds. According to Benjamin (1977) , restraints in expanding the exports of Kenyan hand-made jewellery are:
1. Inconsistency of supply by organized producers.
12. Lack of standardization of styles and sizes.
3. Unsuitable, low grade materials used in the finishing.
4. Use of certain materials restricted for import due to their possible misuse or toxic content.
The other important handicrafts in Kenya are batiks,- ceramics, and pottery, hand-woven and hand- screened textiles, leaf products, ethnographs and of late fish flies. Fish flies are lures used irt fishing. They are assembled in such a way that each of them resembles a fly. It is not clear why fish-flies are

23
considered as handicrafts. The inclusion of fish-fliesunder handicrafts indicates how difficult it is to
. fthave a clear-cut definition for handicrafts. Ethno- graphs, on the other hand are tribal art facts such as musical instruments, household utensils, ritual pieces, and ceremonial gear that have been used at one time or other. Ethnographs are mainly purchased by museums and antique collectors. Being rare items, ethnographs fetch very high prices in the international market. All the products listed in this paragraph, are classified by the KETA as "all other handicrafts".
The share of "all other handicrafts" in Kenya's handicraft exports has increased rapidly in the recent years from 2 per cent in 1985 to 23 per cent in 1987.The value of these exports grew from Ksh.3.27 million in 1985 to Ksh.32.62 million in 1987 thus indicating the need to disaggregate this data.
1.5 THE ORGANIZATION OF PRODUCTION AND MARKETING OF HANDICRAFTS IN KENYA
Most of the production of handicrafts takes place within the households. The artisan households are widely dispersed throughout the country. The artisans are mainly found in the rural areas and produce handicraft mainly as a part time activity. Wood and soap stone carvings are however undertaken more or less as
I

24
a full time activity. Appendix II shows the1
distribution of non-farm activities in Kenya based on information gathered through an Intergrated Rural Survey in 1972. The provincial frequencies which are stated in numbers and percentages indicate how many of the sampled households in a given province were engaged in a particular activity. Apparently, handicraft activities fall within the third, fourth and fifth activity categories. The table shows that wood carving households are mainly found in the Eastern and Coast Provinces and that 0.4 per cent of rural households in Kenya are engaged in the production of wood carvings. It also shows that 1.7 per cent of rural house-holds in Kenya are engaged in pottery and most of such households are located in the Western and Nyanza Provinces.
The artisan households belong mainly to the low income brackets. They consist mainly of the handicapped, the illiterate, and those with low academic qualifications. Handicrafts are an important supplement to agricultural .incomes and provide employment during periods of low agricultural activity. Empirical studies are however required to verify the above casual observations.
The export side of the. handicraft sector is generally urban oriented and with the growth of more

25
handicraft exports there is no doubt that more artisans are being attracted to move into the major urban centres. The artisans often lack a direct link with the major consumers so that there are many middlemen engaged in the handicrafts trade in Kenya.These middlemen may be categorized into four groups, viz. private traders, church organizations and non governmental organizations, producer co-operatives and lastly governmental agencies.
The private traders consist of collecting agents, wholesalers, curio dealers, and exporters mainly based in Nairobi and Mombasa. These traders often do not act in the interests of the producers and tend to exploit the weak bargaining position of the artisans most of whom are poor.
Given the poor position of artisans in the society, there are several church-organizations involved in the marketing of handicrafts in Kenya. The largest is the chain of Jisaidie Cottage Industries which operates under the direction of the National Council of Churches of Kenya. Jisaidie, is a marketing organization with retail, wholesale and export functions. It sells handicrafts collected from self-help groups throughout the country. The Young Men's Christian Association (YMCA) is another church organization that markets andicrafts on behalf of artisans. It sells handicrafts

26
both at home and overseas. The YMCA International does export-marketing on behalf of the Kenya YMCA. The two organizations the YMCA and Jisaidie also provide vocational training through their training Centres.The YMCA has a large Crafts Training Centre at Shauri Moyo in Nairobi where it provides a three year course in ceramics, jewellery, graphic design, batiks, tie and dye and leather work. The course is however undersubscribed either because people are not aware of the course's employment potentialities or because the training charges are considered too high. Currently, the institution trains a handful students in
12handicrafts all of whom are sponsored by the YMCA.
Compared to, the agricultural sector, there are very few producer co-operatives in the handicraft sector and all the major ones are in wood-carvings. All the wood-carving producer co-operatives are affiliated to the Nairobi based Kenya Crafts Co-operative Union (KCCU) which was formed in 1981 with the initiative of the KETA. Lack of marketing skills and general illiteracy of members are the major constraints for the producer co-operatives which are only able to handle a small proportion of their members' total Production. Other producers especially the women market their handicrafts through Self-help Groups. The formation of self-help groups is very much encouraged by the Ministry of Culture and.Social Services which

27
provides material and financial assistance to such groups.
The Maendeleo ya Wanawake is the largest governmental organization involved in the marketing of handicrafts in Kenya. The organization was formed in 1952 as a women's welfare organization. In 1963, the organization embarked on a programme of organising women into Self-help Groups. The organization also started marketing handicrafts produced by the Self-help groups as from 1963. However, the organization has not been effective in the marketing of handicrafts as its attention has been deviated towards political rather than economic issues. Following leadership wrangles within the top ran^s, the organization ceased to fall under the direction of the Ministry of Culture and Social Services and now falls under the ruling party following a Presidential directive made in 1987. The Machakos Handicraft Centre is another governmental agency which was established in 1980 as part of the EEC financed Machakos Integrated Development Programme. The centre markets sisal baskets on behalf of women in the Machakos and Kitui districts. The centre is also involved in the development of improved sisal basket designs.
Finally, in the marketing of handicrafts there ls the KETA which has the official responsibility of Promoting Kenya's handicraft exports. The KETA operates

28
under the auspices of the Department of External Trade in the Ministry of Commerce and Industry. The promotion of handicrafts is accorded a special priority by the KETA which has set aside a special section which deals with handicrafts only. The KETA's Handicraft Section deals specifically with the promotion and the development of handicrafts. No other commodity has been accorded a similar status by the KETA. The Handicraft Section was formed in 1977 with advisoryassistance from the International Trade Centre (ITC) which is a United Nations' advisory agency. It is funded by the UNCTAD and the General Agreement on Tariff and Trade (GATT). It was established in 1964to provide trade information and trade promotion
1 13advisory services to the developing countries. In1977 the ITC seconded a handicraft marketing expertto the KETA which was also at the time receiving othertechnical assistance from the ITC. Benjamin, theexpert, made a lot of contribution towards makingthe Handicraft Section what it is today. He initiateddata collection, participation in exclusive internationaltrade exhibitions for handicrafts and also intiatedprogrammes for product development. He saw a lot ofPotential in Kenyan handicrafts which led him to referto the handicrafts as the "Kenyan Gold'.' However, at
end of his contract several criticisms werelevelled aaainst him.^against him.

29
Since its formation the KETA has been providingi
various market promotion, product development and technical support activities to the handicraft sector as a whole. Benjamin15 (1982) , discusses these activities in greater detail. The marketing assistance include organising for the exporters participation in specialized trade fairs, organizing buyer/seller meetings abroad, helping exporters design business materials, negotiating for favourable freight rates on behalf of the exporters, and providing telex facilities to the exporters. The marketing assistance has helped to encourage more co-operatives and small-scale entrepreneurs venture into exporting handicrafts.The KETA organizes training seminars throughout the country for exporters and producers with the aim of enhancing their capabilities. The KETA also helps the exporters organize for group shipping mainly to the U.S.A thereby helping to reduce shipping costs.
With regard to product development and technical support, the KETA helps to introduce new designs and improved production and finishing techniques. Collaboration between the KETA, The Tropical Institute (TPi) and the imperiai Chemical Industries (ICI) has °r instance, helped to extend the colour dyes for sisal
baskets. The KETA has also been engaged in helping to eP up the productivity of spinners and weavers by elping them acquire more productive equipment and by

30
providing training. i»The assistance by the KETA to small-scale ,1
exporters has helped to Africanise the export business. Analysis of statistical data by Benjamin (1982), for instance, indicated that 70 per cent of the handicrafts exported in 1976 were effected by only seven firms but by 1982, this number had increased to nineteen^The KETA's initiatives to engage co-operatives to engage in direct marketing has also helped to reduce the producer's dependence on middlemen. The KETA assists producer co-operatives undertake sales promotions abroad.
1.6 , IMPORTANCE OF STUDY
Th study will be of particular interest and importance to the handicraft exporters in Kenya and the KETA. It will help in suggesting measures to cope with the current competition prevailing in the international market for handicrafts. The study will also help in suggesting measures to improve the production and marketing of handicrafts in Kenya.
Since there has virtually been no research on handicrafts in Kenya, this study should serve as a reference material for scholars and the generalpublic.

31
1.7 ■PLAN OF THE REMAINDER OF THEPAPER
jIn the light of the above discussion, it is now
proposed to present a brief outline of the remainder of the paper. In Chapter two, a review of existing literature on handicrafts is presented and along with this is the theoretical framework within which the problem of their export marketing will be analysed.The chapter contains the hypotheses upon which the tests of significance will be based.
Chapter three discusses the research methodology utilized in the study. Chapter four is devoted to the analysis of data collected from the field. Chapter five contains a summary of the findings, conclusions, recommendations and suggestions for future research.

32
e n d no t es»
1. Republic of Kenya, I jenya Development PlanFor the period 1984-1988, Government Printer, Nairobi, 1984, page 147.
2. _________________, Op. cit. page 21.
3. _________________, Sessional Paper, No.l of1986 on Economic Management for Renewed Growth. Government Printer, Nairobi,1986, page 21.
4 . _________________, Tourism Market Reportof 1986, Ministry of Tourism and Wildlife, 1986.
i
5. Benjamin, M., "Handicrafts Export Marketing".A Sectoral Report and Recommendations to the Kenya Government, ITC/UNCTAD/GATT Project 1977.
6- Africa - Carribean - Pacific - EuropeanEconomic Community, The Courier, No.68 July-August 1981, page 58.
This information was obtained from the grievances contained in the Kenya National Chamber of Commerce Handicrafts File No. ADM/59/1.

33
8. Ministry of Finance, Budget Speech, 1986.
9. Benjamin, M., Op cit. page 21.
10. The Kenya External Trade Authority, KenyaExport News, Vol.36 No.360, October,1987, page 22.
11. Benjamin, M., Op cit. page 23.
12. The YMCA Crafts Training Centre was visited bythe author on 10th March 1988. The Centre also provides vocational training in woodwork. It also provides training in secretarial and accountancy courses. At the time of the visit, all the thirteen students found training in the Handicrafts Department were graduate students who had completed their three year course. The students produce handicrafts using the YMCA's facilities.The YMCA markets their handicrafts on a commission. The lack of training students is attributed to lack of funds to sponsor more people for the handicrafts courses.Many school leavers, it was said, prefer to opt for the more familiar courses such as secretarial, accountancy, and woodwork which are oftenoversubscribed.

34
Glover, F.J., The International Trade Cetnre UNCTAD/GATT 1964-84; A Historical Account of Twenty Years of Service to Developing Countries, International Trade Centre, UNCTAD/GATT, 1984.
Malcolm Benjamin was implicated in a scandal appearing in the Nairobi Times of 18th and
• 27th December 1982, which accused him of conspiring to form a cartel of foreign buying firms in order to control the purchase of Kenyan handicrafts. This allegations were however, unfounded.
Benjamin, M., "Market Development and Development1of Export Industries". Kenya External Trade
Authority, 1982.
Benjamin, M., Op cit., 1982, page 2.
CHAPTER TWO
LITERATURE REVIEW AND THEORETICAL FRAMEWORK
This chapter reviews the available literature on handicrafts and also reviews theoretical literature on the subject of export marketing. The theoretical literature provides the theoretical framework upon which this study is based.
2.1 REVIEW OF LITERATURE ON HANDICRAFTS
Generally handicrafts have received little attention in economic literature. The reason for this inattention stems frcm the fact that handicrafts fall within the category of traditional and small scale industries which have so far, received very little attention in the literature on the strategy and planning of economic development. The role of these industries is now acknowledged in ’the less developed countries (LDCs) following the International Labour Organization (ILO) efforts in the early 1970s to draw the attention of the governments of the LDCs to the great potentialities of self-employment existing in those industries.
There are various reasons for the inattention given to the traditional and small-scale industries. Ho and Huddle (1972), discusses the major reason for this inattention by saying the following:
*
Traditional and small-scale industries are widely identified as belonging .to the most rudimentary, early stages of development. Indeed, the very essence

36
of development is seen as the progress from traditional and small-scale industry to modern large-scale industry.Most typically, economists conveniently perceive the development process in a two- sector model framework in which the small scale and traditional sector are practically synonymous with inefficiency, backwardness and underdevelopment. Even on the demand side, the products of such industries are viewed as being 'inferior' and replaceable by 'better' mass produced, standardized products as large scale, capital-intensive proceeds-*- .
As a result of this, as well as lack of mediaattention, the handicraft sector has received very littleattention and there has also been very little research
18 aon handicrafts. According to Pye (1986 ), the sector has not come to the attention of researchers as a priority area of study. Furthermore, he says, researchers are often reluctant to carry out "difficult" assignments especially those that involve staying for extended periods of time in poor villages and under uncomfortable circumstances. The fact that handicrafts in the rural areas of LDCs are widely dispersed makes field research even more difficult. Research into handicrafts is also made even more difficult by the lack of elementary data since many governments do not collect data on handicrafts.
Bulk of the existing literature comes from India where the Government of India has made a substantial contribution towards the development of handicrafts.India launched a programme to revive and develop handicrafts immediately after independence. The All-india Handicrafts

37
Board was established in 1952 to improve their production and marketing. The state governments 6f
IIndia also undertake their own schemes for handicrafts and training of craftsmen. There are many other organizations in India such as the Handloom Board, the Silk Board, the Coir Board and the Khadi and Village Industries Commission which are also involved in handicrafts.
There is very little written about handicraftsin Eastern Africa. The few available studies are mainly
. 19descriptive rather than analytical. Schadler (1968), ,carried out a study aimed at assessing the role of craftsand small-scale industries in Tanzania. However, this
2 7study was more concerned with skill acquisition. Karsten (1972), also attempted to assess the role of the handicraft sector and to provide a description of economic activities pursued by the craftsmen in Ethiopia. Another
2 8study on Potters in Ethiopia was undertaken by Hakemulder(1980), which indicated that the level of illiteracywas very high amongst the potters. Only 3 out of the147 potters interviewed were able to read and write. A
22study by Chesajo (1981) on weavers of sisal baskets in the Kiambu District of Kenya, found that there was a general high level of illiteracy amongst the women interviewed and this was found to be a major constraint on their marketing effectiveness. She found that the women could not adapt their products to the existing market tastes thereby ending up accumulating stocks which

38
which could not be sold.i!
The literature mentioned above, point to some commoni! •features of the handicraft sector in the LDCs. Five
of the characteristics are considered here. Firstly, the sector has received little attention from policy makers with the exception of India. However, in the recent years many developing countries have started to pay increased attention to their handicraft sector.
Secondly, the producers of handicrafts generallybelong to the low income categories. Pye J (1986°),points out that the incomes of the producers in Asia,are to a large extent below the poverty line. The ILOreports to the governments of Jordan and Thailand thatwere submitted in 1958 and 1960 respectively also confirmthat artisans bdlong to the disadvantaged segments of
24the society . This poverty, it is said generally makes them vulnerable to exploitation by the middlemen in the private sector.
Thirdly, it is has been observed that most training occurs at the household level where the skills are passed on from one generation to another.
Fourthly, it is observed that the factory mode of production has not taken root even for large exporting countries such as India and Nepal. Pye (1986 ), points out that this is probably due to the labour legislation

39
in the Asian countries which does not allow manufacturers to drop workers during periods of weak demand. The middlemen therefore prefer subcontracting productionto the artisans.
Fifthly, as it is pointed out by Pye (198613) , handicraft exports do not account for a sizeable portion of the total exports. Even for India which is one of the largest exports of handicrafts, handicrafts only account for only 16% of total exports.
Due to limitations imposed by the SITC codes used in collecting international trade statistics, it is stillimpossible to make a valid assessment of the volume of
. 25trade in handicrafts. However, Kathuria (1986) estimatesthat handicrafts worth about US$ 25 billion entered theinternational market in 1985. Pye (1986a) estimatedthat all developing countries put together, exportedhandicrafts worth US$ 8.43 billion in 1983.
2 6Kathuria (1985), made a study on Indian handicraft exports to evaluate the performance of India crafts on the world market. He noted that India's earnings from handicraft exports showed tremendous instability.He pointed out that this was due to lack of aggressive marketing tactics amongst the Indian exporters. His study revealed that the exporters who had made substantial investments in design and development were more successful. Kathuria also analysed the effect of tariff policies of

40
the industrialized nations on handicraft exports ofvarious Asian countries in order to establish whetherchanges in tariff barriers affect handicraft exportsfrom the LDCs. By comparing handicraft exports fromthe Asian LDCs, before and after the introduction ofthe GSP in the U.S.A. and of the duty free quotas forhandicrafts in the EEC countries, he found that the removalof trade barriers on handicrafts from the LDCs had no significantimpact on the volume of handicraft exports from the developingcountries. He therefore concluded that it was needlessfor the developing countries to urge for the removalof tariff barriers on handicrafts but should insteadbe more concerned about their internal marketing networks.
The study by Ho and Huddle (1972), challenged the validity of the popular assumption that traditional and culture-oriented goods are inferior goods. They argued a prior that the increased demand for handicrafts in the developed countries indicated that the view about handicrafts being inferior goods was probably valid for the LDCs but was not accurate for the developed countries.Ho and Huddle undertook an empirical study aimed at estimating the income elasticity of demand for handicrafts using cross-section data on the 15 countries of the Organization for Economic Co-operation and Development (OECD) and time series data on the U.S.A. economy. On the basis of logarithmic regression analysis, it was found that traditional and culture-oriented goods consistently

41
had income elasticities of demand greater than; unity.)
Ho and Huddle, then continued to explain why there has been a rapid expansion of demand for handicrafts when historically the role of traditional industries was expected to decline. They explain that the situation has been brought about by the growing affluence amongst the middle income classes of the developed countries which has generated the need for distinctive consumption. In such a setting, mass produced factory goods loose much of their appeal and the handmade non-standardized goods of artistic merit become much more appealing. The situation in the LDCs is however unclear because so far no study has been undertaken on the consumption of handicrafts to determine their income elasticity of demand.
It is observed in the available literature thathandicrafts like any consumer product are subject toa product life cycle. This fact is underscored in tradematerials written for handicraft exporters in the LDCs.A product development handbook compiled by Netherland'sCentre for Promotion of Imports from Developing Countries
2 7(CBI) also concurs with this fact . The idea is also2 8mentioned by Hughes (1981) of the Fund for Research
and Investment for Development in Africa (FRIDA).
The CBI of Netherlands points out that most handicrafts are decorative items and are not subject to frequent replacement. Consequently they only have

42
to be substituted as soon as| new products appear on the)
market which are somewhat mc|re appealing to the changing tastes of the consumer. Th changes in consumer tastes are reflected by 'fashion trends' which keep on changing.The CBI, therefore, suggests that the handicraft supplying countries have to develop and launch new products in order to maintain their sales. The CBI notes that there has been a marked decline in the demand for handicrafts in the Netherlands since the end of the 1970s. It gives the reason that this decline has been due to the fact that the same products have continued to be offered to the Netherlands market with very few new products appearing. As the number of suppliers increased, price competition also increased leading to a decline in quality.It is argued that this competition let to the saturation of the Netherlands market thus making handicrafts cease to be attractive to the affluent consumers.
In the present study, the Product Life Cycle (PLC) is considered to be of central importance since it suggests marketing policies to be adopted in the face of stiff competition or declining sales. In 1986, Kenya registered a sharp decline in her handicraft exports to the U.S.A. and in her total handicraft exports. Although there was an improvement in 1987 in the value of total handicraft exports, the exports to the U.S.A. continued to decline. In the recent years countries such as Japan and Philippines have started producing handicrafts such

43
as the sisal basket which has for a long time been an exclusive Kenyan product. The product life cycle (PLC) is therefore important for this study which focusses on the export marketing of handicrafts. The next section examines the importance of the PLC concept in the export marketing of handicrafts.
2.2. THEORETICAL FRAMEWORK
The PLC concept is an important concept in the theory of marketing. It is based on the observation that following the introduction of a new product in the market very low sales are realized but as the product continues to appeal to more of its potential consumers, the sales gradually increase. Eventually, however, the market becomes saturated causing sales curve to decline.This sales pattern exhibits a sales curve similar to the one in Figure 2.1.

44-
The maturity stage is of special concern to the seller. The maturity stage represents a situation where the product has gained the acceptance of most of its potential consumers so very little growth in sales can be realised. Growth in the sales of a product depends on the frequency at which the product has to be replaced. Therefore, for those handicrafts which do not require replacement once most of the consumers have purchased the product, very little growth in sales is likely to be generated. The growth in sales will also depend on the time taken by competing manufacturers to launch a successful similar product.
29According to Malumo (1986), the aim of the seller should be to push products as quickly as possible to the maturity stage through sales promotion, advertising and distribution strategies. Once that is done, the ideal situation is to keep the product between growth and maturity stages which generate the highest sales.What should be done to maintain sales will differ from one product to another depending on competition , the frequency *at which the product is replaced and the rate at which the consumers' taste changes. With stiff competition and rapidly changing consumer tastes, it becomes necessary for the seller to undertake what is called in literature, "product extension". This essentially involves a real or an imaginery regeneration of an old product, either by improving on quality or by adding a

45
previously non-existent ingredient or colour. Product/
extension inevitably entails higher marketing(expenditures on market promotion, marketing research and product development.
30Many proponents of the product cycle , concept assume that customers who purchase the product early in its life will have a higher income than those who will buy it as it matures. It has also been shown that price tends to fall over the product life cycle. It has also been shown that for a period after a new product is introduced in the market, standards for comparing performance of its various versions do not exist. At the initial stage, the individual firm and the whole industry producing the product will face a low price elasticity of demand. As consumers' desires become well known through the exploration of alternative product forms, standardization begins to take place and performance measures begin to appear in the market. Over time the consumer is better able to compare the prices and performance of products from the different firms so that eventually the individual firm finds itself faced with an increasingly elastic demand curve.
To maintain its market share a firm has to apply aggressive marketing tactics and product development.The product development activities undertaken should be aimed at producing a more sophisticated product capable
i
46
of attracting the high incoirie consumers. Marketingi
research therefore becomes important because in orderto launch a new or apparently new product, the producthas to be attractive to a large number of consumers whoare willing to purchase it at a price high enough togenerate sales and profits big enough to satisfy allthe parties involved in the distribution process. Hencemarketing research is required to determine the consumers'changing preferences and to determine the factors inthe market that are capable of influencing the firm'ssales in a negative sense. The next stage after marketingresearch is to design appropriate marketing strategies
31and products for the target market. Kotler (1986), points out that market research and product development have to be a continuous activity for the firm.
iWhere changes in the level of a country's exports
occur due to emerging competition from other countries then the relevant term usually used is the 'export cycle'. The two concepts, the PLC and the export cycle are one and same thing, the only difference is that the latter concept is often applied to international trade.The implication of the export cycle concept is that a country's monopoly position in supplying a product to the international market diminishes as the demand for the product continues to grow. This happens because the growth of the demand provides incentives to nonproducing countries to venture into the production of

47
the product.
The PLC concept and the related export cycle concept appears to fit the experience of Kenya's handicraft exports well. Kenyan handicraft exporters now have to contend with the increasingly elastic demand for their handicrafts. They have to cope with the increasing stiff competition prevailing in the international market and also amongst the Kenyan exporters themselves given that there are now many handicraft exporters in the country than there was in the mid 1970s.
Having noted that items which do not require frequent replacement present the seller with a challenging task where there is stiff competition, it can be said that the Kenyan handicraft exporters face a similar situation given that most bf the handicrafts e.g. sisal baskets, batiks, jewellery, carvings etc do not require, frequent replacement. In such a setting therefore, as is implied by the PLC and the related concept of the export cycle, an exporter has to embark on an active product competition and marketing programme.
However, before embarking on such a programme to cope with the stiff competition and the other changing conditions in the foreign markets, there is need for the exporter to be assured that successful export marketing is a function of the sacrifices made at the firm level to improve export sales. Hence an analysis

48
into the factors that explain for the differences in the level of export sales amongst the handicraft exporting firms, is therefore necessary. It is also important to understand the marketing strategies currently being used by the exporters and the factors constraining their export sales. This information would help to determine how best assistance to the handicraft sector can be improved in order to enhance the competitiveness of Kenyan handicrafts abroad. This study hopes to fill this gap by analysing information collected from handicraft exporting firms in Kenya.
The purpose of this research is to identify the factors that would enable a handicraft exporting firm to exploit, as far as possible, whatever potential exists in international trade in order to further its profit objectives and also to contribute to the country's economic development.
There is much literature available on export . 33marketing , all of which underscore the role of export
marketing research, product design and development and market promotion in improving the relative position of a firm in the international market.
2.3 THE MODEL
The model to be utilised in this study is based on the assumption that successful export marketing is

49
a function of the firm's marketing efforts(m);the institutional support received from the exporjt promotion
Undertaking marketing efforts inevitably entails costs. The firm's export marketing budget can therefore be used asn an indicator of how seriously it approaches international trade. The marketing budget may be spent in several ways but of interest to the study are the firm's expenditures on marketing research(R), product design and development(PDD) and export promotion(P).
The following model, therefore, will be used to explain for the differences in export sales amongst the handicaraft exporting firms in Kenya:
agencies(I) and its experience in export marketing(E).
( 1 )
Where t Represents time and:
S t = Export sales at time t
Rt = Expenditure on marketing research in time t
PDDt = Expenditure on product design and development in time t
E = Experience in export marketing at time t
= Institutional support at time t.
The partial derivatives Sx ; " Sx ; 5 Sx ;x ; 6 Sx6 R 6 PDD 6 Px 6 E6 Sand x are a priori, expected to be positive.6 I

50
Cross-section data on 1987 would be used becausei
it was expected that very little co-operation would be received from the handicraft Exporters if the questionnaire required that they divulge a lot of their financial secrets. Thus 1987 was selected because this would enable even those firms that do not keep proper records, to provide reliable information about their marketing budget and sales. In order to analyse the variation in export sales of the different handicraft exporting firms, it is necessary to transform the model as follows:-
S . = f(R. , PDD. , P . , E . , I . ) xi l x xi l 1* thWhere I, stands for the l firm and time (t)
is 1987.
(2 )
The two variables, experience and institutional support are included in the model in order to capture the variation in export sales that is not captured by differences in the levels of marketing effort.Experience it is believed, determines to some extentthe effectiveness of the marketing tools or policiesused by the firm. Experience is expected to be positivelycorrelated to the level of export sales because a firmthat has been in business for long is able to accumulateknowledge for instance on market tastes and needs andit is also able to establish long term business relationships in the market.Institutional support on the other hand help to supplementthe firm's marketing efforts.

51
2.4 HYPOTHESES OF THE STUDY
There are three major hypotheses for this study.The first hypothesis is comprised of three sub-hypothesis. The study hypothesis that firm export sales are a function of:
1. The firm's level of marketing efforts on:i) export marketing researchii) product design and developmentiii) Export market promotion.
The firm's expenditures on these activities will be used as an indicator of how much of these activities are undertaken by the firm.Thus, it is proposed that firms which put in more efforts into export marketing research, product1 design and development and on export market promotion will have higher export sales.
2. The firm's experience in exporting handicrafts.It is hypothesized therefore, that firms with longer experience in exporting handicrafts, also ’have relatively higher export sales.
3. The institutional support or assistance received from the KETA. It is expected, therefore, that firms which have received greater assistancein the past, from the KETA, should have relatively higher export sales.
52
ENDNOTES
17. Ho, Y.M. and Huddle, D., "Traditional and SmallScale Cultural Goods in International Trade and Employment". Paper No. 35,Rice University,Houston, 1972.
18. Pye, E.A., "Handicraft Industries in the EconomicDevelopment Process in Asia". International Development Research Centre, Singapore,1986a.
19. Schadler, K., Crafts, Small-Scale Industries andIndustrial Education in Tanzania. Welforum Verlag, Munchen, 1968.
20. Karsten, D., The Economics of Handicrafts inTraditional Societies in Sidamo and Gemu Goffa Province, Southern Ethiopia. Welforum Verlag, wunchen,1972.
21. Hakemulder, R.P., "A Study of Two Villages inEthiopia". United Nations Economic Commission for Africa, Addis Ababa, 1980.
22. Chesaro, L.T., "A Dissertation on Handicraft MarketingActivities of Women in Kikuyu Division of Kiambu District". Dissertation, Diploma of Education, University of Nairobi, 1981.
23. Pye, E.A., "Artisan Industries in Asia: RegionalComparisons and Trends". International
uDevelopment Research Centre, Singapore, 1986°.
4. See the International Labour Office, Report tothe Government of Jordan on the Development of Jordan on the Development of Handicraft.ILO, Geneva, 1958, and___________, Report to the Government of Thailand onHandicrafts Training in Chacho-Engsao Pilot Project. ILO, Geneva, 1960.

53
r!25. Kathuna, S., "Handicraft Exports: AnilndianCase Study". Economic and Political Weekly,Vol. XXI, No. 40, October 1986j
26. __________, "Indian Handicraft Exports: Constraintsand Prospects". Inidan Council for Research and on International Economic Relations,New Delhi, 1985.
27. Centrum tot Bevordering Van de Import uitOntwikkelingslanden, The Market for Handicraft Products in the Netherlands, CBI, Rotterdam, 1985.
See also: Lemmers, A. and Hoenns, J., New Handicrafts: A Product Development Handbook for Producers of Handicrafts in Developing Countries.CBI, Rotterdam, 1985.
28. Hughes, J., "Village Craftsmanship Versus MassProduction". The Courier, No. 68 July-August 1981, page 6 6 .i
29. Malumo, S., Introduction to Marketing in Africa,Macmillan Publishers, London, 1986.
30. Louis, T.W. (ed.), The Product Life Cycle andInternational Trade, Harvard University 1972.
31. Kotler, P., Marketing Management: Analysis, Planningand Control, Prentice-Hall of India,New Delhi, 1985.
32. Porter, R.C.,"Some Doubts about Kenya's Futureas an Exporter of Manufactures".Discussion Paper No. 177, Institute of Development Studies, University of Nairobi.

54
33. See for instance the following:
Cateora, P.f International Marketing, Richard 0. Irwin, Homewood, 1971.
Fayerweather, J., International Marketing,Prentice-Hall Inc., Engelwood Cliffs N.J., 1965. page 92.
Hoges, T.M., Selling in the Export Market,Sir Pitman and Sons Limited, London, 1967.
Llyold, P.J., International Trade Problems of Small Nations, Durham N.C., Duke U.P., 1968.

CHAPTER THREE
THE RESEARCH METHODOLOGY
The data for this study were collected from two main sources. One, by administering a questionnaire to owners or managers (and occasionally export managers) of privately owned handicraft exporting firms. These firms were randomly selected from a compiled list of privately owned handicraft exporting firms in Kenya.The second source of data, was the Kenya External Trade Authority (KETA). Information about the Authority' involvement in promoting handicraft exports from Kenya was obtained through a desk research conducted at the KETA library and from continuous consultation with the senior officials of the Authority.
The study was confirmed to firms in the private sector only, given the objectives that the study it was intended to achieve. One of the objective of the study is to establish what factors explain for the varying levels of firm export sales. On the basis of the theoretical concepts of the product life cycle and the export cycle, the firm export sales function in chapter two was formulated. The two theoretical concepts, underscore the role of marketing efforts such as marketing research, market promotion and product design and development in maintaining or increasing the firm's export sales in a situation of stiff market competition and changing consumer tastes. In the

56
case of handicrafts, the firm's level of experience and the level of assistance received from the KETA are also expected a priori to influence the firm's export sales. The decision to confine the study to the firms in the private sector was taken, given the non-profit and non-economic objectives pursued by the non-private organisations.
The aim of the questionnaire that was designed for the exporters, was to gather information about the handicraft exporters in Kenya and to collect data for the study's analytical model presented in the preceeding chapter.
The year 1987 was selected as the data base because it was anticipated in advance that the exporters would be unwilling tp supply reliable time series financial data on their business operations. Being a developing country, people and particularly businessmen are generally very suspicious about researchers seeking to gather information about them. Kibera , has the following to say about the problem:
"... in developing countries wheresuspicion of strangers is more predominant.Respondents may refuse to co-operatebecause of fear that th<=> interviewermay be a tax official or any other-Governmentofficial who is suspected of trying to ca tch them" 26.
Given such a setting, it would almost be impossible to collect time series financial information from each

57
firm. The year 1987 was therefore selected as a data base because it is easy for exporters to recall
I 'information about the previous year and also becauseiidata on a single normal year was considered adequate
for the purpose of comparing the firms.
3.1 THE SAMPLING PROCEDURE
It was proposed right from the beginning that the required data on exporters should be gathered from a sample of not less than 10% of the private handicraft exporting firms in Kenya. The KETA officials estimated that there was a total of about 600 private and non-private firms exporting handicrafts from Kenya. The KETA, however, does not maintain an exhaustive list of the exporters but only maintains a cumulative list of addresses of some of the exporters who have sought for some assistance from the KETA in the past. This roster maintained by the KETA, is rather outdated as it does not provide up to date information on the current handicraft exporters in Kenya.
The -method of selecting the sample was first to prepare a list of all privately owned handicraft exporting firms. The names and addresses of these firms was obtained from the KETA's roster, from special features and advertisements in the "Kenya Export News" and from the 1985 Kenya National Handicrafts Exhibition Catalogue. Some additional addresses were obtained from

58
the U.S.A. Commercial Attache in Nairobi and from the trade directories available at the KETA Library.Whenever in doubt, the Officers at the Authority's
i!Handicraft Section assisted in verifying which of the firms fell into the category of private firms.
The final list of the private firms contained a total of 312 firms. The distribution of the firms going by their postal addresses was as follows:
TABLE 3.1: THE DISTRIBUTION OF PRIVATELY OWNED HANDICRAFT EXPORTING FIRMS IN KENYA
Location Number of firms Percentage of the Total
Nairobi 270 86.5Mombasa) 24 7.69Other towns 18 5.76
312 100
Sources: (i) The Kenya External Trade Authority,Kenya Export News (Various Issues).
(ii) _, "Kenya NationalHandicrafts Exhibition Catalogue",1985.
(iii) The Kenya National Chamber ofCommerce, Trade Directory (Various Issues).
(iv) The Comemrcial Attache, The U.S.A. Embassy in Nairobi.

59
Random selection using a random number table . . 27in the manner explained by Mueller , was used to select a sample of 30 firms. The response was quite low because only 12 of the firms could supply the required information, the remaining 18 either refused to cooperate, could not be traced or had ceased exporting handicrafts and had closed down or switched to some other business.
It was then considered necessary to double the sample size to 60. Out of the 60 firms, only 28 responded, 12 refused to co-operate, 9 had ceased exporting handicrafts and 11 could not be traced or the persons concerned failed to honour appointments even after repeated calls.
The questionnaire was administered to the owners or managers of'the firms in 1988, during the months of February, March and April.
3.2 ESTIMATION OF THE VARIABLES IN THE MODEL
In order to estimate the model, the following information was required:
(i) The individual firm's handicraft export sales in 1987.
(ii) The firm's expenditures in 1987 on export marketing research, product design and development and on export market promotion on publicity.

(iii) The firm's experience in exporting handicrafts
(iv) and lastly, the institutional support so far received by each firm from the KETA.
The estimation procedure was as follows. Each respondent had to state the gross value of handicrafts exported by their respective firms in 1987. This information was readily available as the respondent only had to refer to his 1987's commercial documents.
Marketing expenditures were used as a proxy for the firm's levels of marketing efforts in marketing research, product design and development and market promotion. To estimate a firm's 1987 export promotion expenditure, the respondents were asked to recall the promotional efforts undertaken in 1987. Each respondent therefore, had to state the costs of attending trade exhibitions undertaken in 1987, the costs of promotional materials used and the costs of business trips undertaken in 1987 to promote handicraft exports. To estimate the firm's expenditures on marketing research, the respondents were asked whether in 1987 they made any efforts to study any of their foreign market. The respondents were asked to estimate the costs incurred in undertaking market research in 1987. To estimate the firm's expenditures on product design and development,
61
the respondents were asked to recall how much it cost them in 1987 to improve on their products and to
tdevelop new products and new designs. The respondents therefore, had to estimate how much it cost to employ designers and casual labour needed to carry out product design and development for 1987's exports. Also included here are the costs of sanding,polishing, waxing and other finished materials that were absorbed by the exports in 1987.
The length of time a firm has been exporting handicrafts (stated in number of years) was used as a proxy for the firm's experience in exporting handicrafts.
For institutional support received from the KETA, it was difficult to quantify the Authority's assistance to each exporter due to lack of access to such information. The number of times a firm has participated in the KETA's promotional activities such trade fairs and exhibitions, was used as an indicator of the level of institutional support it has so far received from the KETA.
3.3 DATA ANALYSIS
After gathering all the information required for the study, attempt was made to present the data using tables and descriptive statistics such as percentages.

62
Regression and correlation analyses are thei
major statistickl tools employed in this study to test the relationship between the export sales and the explanatory variables in the regression model presented in Chapter Two. The relationships were a priori expected to be positive. The t tests and the correlation co-efficients have been used to test the strength of the relationships.

63
ENDNOTES
34. Kibera, N.F., "The Effects of SelectedCommunication Variables on the Adoption of New agricultural Practices by Smallholders in Central Kiambu, Kenya",M.A. Thesis, University of Toronto,1979* page 105.
35. Mueller, J.H., Statistical Reasoning in Sociology.Houghton Mifflin Company, Boston, 1979. page 355.

CHAPTER FOUR
ANALYSIS OF DATA
In this chapter, data collected from the KETA and the handicraft exporters in Kenya is presented for analysis. It was the aim of the researcher to be exploratory given that no previous research so far has been undertaken on the handicraft export business in Kenya. The study attempts to explain for the varying levels of export sales between the exporters. It was hypothesized that successful export marketing given the external market conditions, is a function of the marketing efforts undertaken by the firm, its level of experience in exporting handicrafts and the level of institutional support so far received from the KETA.
Some of the questions to which the study addresses itself to in order to realise its objectives are: Whatare the characteristics of the handicraft exporting firms in Kenya? What are their motivations and goals? What are the problems faced in the initial stages following a decision to venture into the business?What are the current problems constraining their export sales? What type of assistance does the KETA offer to actual and potential exporters? and finally, how does the differences in the levels of marketing efforts, experience and assistance from the KETA explain for the varying levels in export sales between the firms?

65
The last question is of fundamental importanceto the study because if the study can demonstrate that1the three factors are significant in explaining for the variation in export sales then one of the goals of the firms' strategy should be to undertake more aggressive marketing efforts in order to maximize export sales.For the KETA, one of the goals of its export promotion strategy for handicraft exporters would be to maximize „ its assistance to the handicraft exporters while at the same time improving their marketing skills to enable them to cope with the dynamic character of foreign markets and also to enable them to undertake their own private sales promotion.
The questions proposed by the study are discussed in the following analysis of data which forms the basis upon which policy formulations for maximizing handicraft exports from Kenya are made.
The chapter consists of three main sections.The first section examines the part played by the KETA in promoting handicraft exports from Kenya. The second contains an analysis of the primary data gathered from the handicraft exporters. The final section contains the results of the regression analysis.

66
4.1.0 AN ANALYSIS OF THE ROLE PLAYEDBY THE KETA IN THE PROMOTION OF HANDICRAFT EXPORTS -----!----------------------------------------
»■jthe information presented here is based on data
gathered through desk research and from a series of interviews with some senior officials from the KETA.In the subsequent sub-section, the objectives and the organizational structure of the KETA and the assistance provided to handicraft exporters are examined in detail.
4.1.1 A BRIEF HISTORICAL BACKGROUND OF THE KETA
The Kenya External Trade Authority (KETA) wasextablished in February 1976 as the main plank to
3 6strengthen and re-organize export promotion. The KETA was established to replace the defunct Export Promotion Council which was formed in 1964 as Kenya's export promotion strategy. The KETA is the export promotion arm of the Ministry of Commerce and Industry.It is the Trade Promotion Division of the Department of External Trade in the Ministry.
The main role of the KETA is to implement action aimed at expanding and diversifying Kenya's exports. The K-ETA also deals with international trade policy matters and liaises with Kenya Commercial representatives abroad. The Authority provides governmental service to the whole export sector in Kenya. In order to achieve its goal of trade promotion, the Authority is particularly

67
active in the field of: international trade fairs,)
product marketing, trade information, freight problems, product development, training fcnd handicraft exports.
The members of the KETA's board are drawn from the Government and the private commerce and industry sectors. They are appointed by the Kenya Government. The KETA receives its funding from the Government and from external sources such as the EEC, the World Bank, and the development agencies of such countries such as Germany and the Nordic countries.
The KETA has a total of forty officers working in different capacities. All the Authorities' officers are based in Nairobi and they cater for the whole country. The KETA works in conjunction with District Trade Officers with whom the Authority organizes seminars and training programmes mainly for businessmen in the districts. At the districts, the District Trade Officers are responsible both for matters pertaining to internal and external trade. All export and import licences are approved by the Ministry's headquarters in Nairobi.
4.1.2 THE ORGANIZATIONAL STRUCTURE OF THE KETA
The structure of the Authority is very decentralized as it is divided into eight sections each

68
of which provides some specialised service. Except for the Handicraft Section which has four officers, each section has an average of five officers. The sections are:
(i) THE MARKETING SECTION - This section undertakes all market studies for Kenyan goods, to assess their local production potential. It organizes outgoing trade missions and assists exporters improve their promotional materials, like catalogues, brochures and letterheads.
(ii) THE TRADE FAIRS AND EXHIBITIONS SECTION - This isection organises Kenya's participation in international trade fairs and exhibitions. The KETA, however, does not meet the full costs of the exporters participation insuch trade events. The KETA only meets the costs of the display stand and that of shipping each exhibitors merchandise not exceeding 50 kilograms. Depending on the availability of funds, a trade mission is sent in advance to ascertain the conditions in the target market where an exhibition is scheduled to take place.
(iii) THE PRODUCT DEVELOPMENT SECTION - This section provides technical support necessary

69
in raising the quality standards of Kenya's tradeables. It advises exporters on improved production techniques and undertakes product development. This section has been instrumental in introducing new products and designs for the handicraft sector particularly in wood-carving, ceramics or pottery and sisal baskets.
(iv) INFORMATION AND PUBLICITY SECTION - This section stores and disseminates information on matters related to international trade.It maintains a reference library which stocks' articles to provide the general public with information on various aspects of international trade. It also distributes copies of the "Kenya Export News" whichis a monthly magazine published by the KETA. Also distributed by the section, are copies of trade inquiries received
. from overseas by ,telex.
(v) TRADE FACILITATION SECTION - This section plays only an advisory role. It examines and advises on ways of reducing the costs and complexities of international tradein Kenya. This section has been very instrumental in streamlining the export
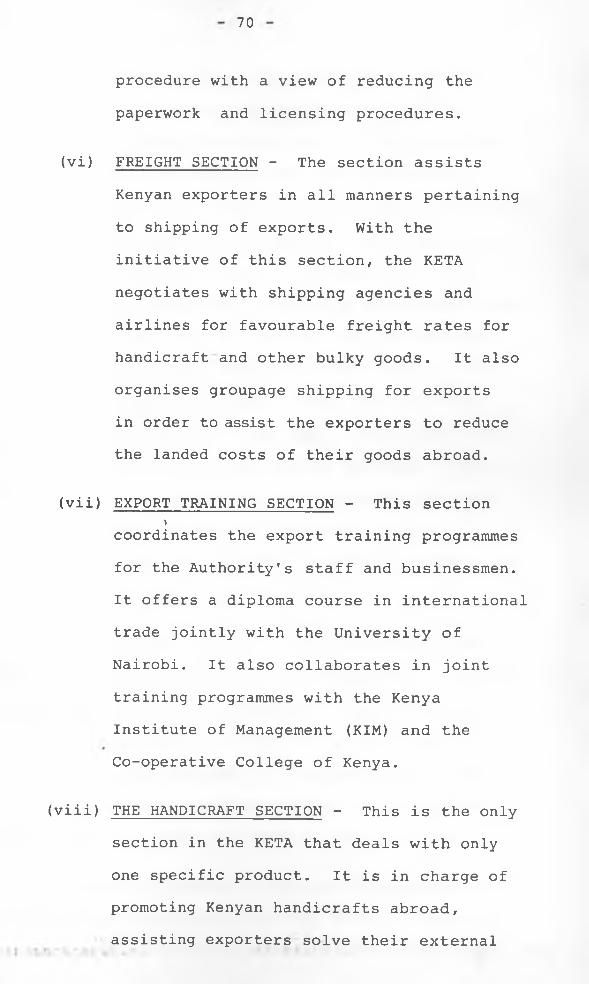
70
procedure with a view of reducing the paperwork and licensing procedures.
(vi) FREIGHT SECTION - The section assists Kenyan exporters in all manners pertaining to shipping of exports. With the initiative of this section, the KETA negotiates with shipping agencies and airlines for favourable freight rates for handicraft and other bulky goods. It also organises groupage shipping for exportsin order to assist the exporters to reduce the landed costs of their goods abroad.
(vii) EXPORT TRAINING SECTION - This section)
coordinates the export training programmes for the Authority's staff and businessmen. It offers a diploma course in international trade jointly with the University of Nairobi. It also collaborates in joint training programmes with the Kenya Institute of Management (KIM) and the Co-operative College of Kenya.
(viii) THE HANDICRAFT SECTION - This is the only section in the KETA that deals with only one specific product. It is in charge of promoting Kenyan handicrafts abroad, assisting exporters solve their external

71
trade problems and undertaking product development. There are four officers working in the section. It liaises with the rest of the seven sections of the KETA each of which render their specialized services to the section. The handicraft section, however, undertakes the first initiative by identifying what needs to be done. It was observed that the officers have been working for the section for at least eight years. This reflects that there exists a low labour turnover in the section in terms of its manpower. This is an advantage, because these officers have in the past undergone various training programmes in boosting handicraft exports.
The Handicraft Section organises Kenya's participation in about 3 to 5 exclusive handicrafts international trade fairs and exhibitions. Each exhibition costs the Government about Ksh .1.5 million excluding accommodation and transport for the exhibitors. The handicraft exporters are also allowed to participate in other trade fairs where the KETA is participating.
It was not possible to extract information about the promotion expenditures that the KETA has devoted on handicrafts in the past as this kind of information

72
is classified information. However, it was estimatedl
by one of the KETA's directors, that one third of the*,1KETA's Market promotion budget is devoted to promotin'g
Kenya's handicrafts abroad. In 1985, the KETAorganized an exhibition for Kenyan handicrafts, withfinancial assistance from the EEC. Various regularimporters were invited to attend the exhibition. Itwas expected that the national exhibition would becomean annual event if the EEC would be impressed by its
37success. However, so far no similar exhibition has been organised as at 1988.
According to the Authority's officials, plans are under way to organise promotional activities for handicrafts aimed at the U.S.A market. The activities are scheduled to take place in 1989 and will cost the KETA over Ksh.5 million. This decision was taken after it was observed that the sh re of handicraft exports to the USA has been on the decline since 1986. It is hoped that the promotions will help prevent a further decline in Kenya's handicraft exports to the U.S.A.
4.1.4 THE KETA'S ASSISTANCE TO HANDICRAFT EXPORTERS IN KENYA
The Handicraft Section provides various services and assistance to the handicraft sector with a view of stimulating greater exports from the sector. It for instance generates market information about the foreign

73
markets by undertaking market studies and organising buyer/seller meetings in which the overseas importers exchange views with the Kenyan exporters. It organizes Kenya's participation in international trade fairs and exhibitions which are exclusively organised for handicrafts. It participates in at least three to five such events every year.
The section helps exporters prepare promotional materials such as business brochures, catalogues and letterheads. It organises seminars and training programmes for producers and businessmen. During such training programmes participants are introduced to new production techniques, information on foreign market conditions, and ar^ also furnished with information on export procedures, packaging for export, credit and shipping.
Prior to Kenya's participation in any exclusive international trade fairs and exhibitions, for handicrafts the section makes advance arrangements for accommodation and transport on behalf of the Kenyan exhibitors. It also provides interpreters to facilitate communication between the Kenyan exhibitors and the potential buyers abroad. The section maintains a register in which the addresses of any exporters who have sought for assistance are recorded.
A total of. four expartriate advisers have

74
worked for the section since it was set up in 1977.{
At present the section is run fcjy four officers all of whom have undergone different graining programmes on promoting handicraft exports.
4.1.5 GENERAL OBSERVATIONS ABOUT THE HANDICRAFT SECTION AND THE KETA AS A WHOLE.
The KETA's offices and officers are all based in Nairobi. In the countryside, the businessmen are catered for by their respective District Trade Officers who are also responsible for internal trade. The KETA organises various training seminars for businessmen in the districts. However, all import and export licences are approved in Nairobi. It is very doubtful therefore, whether such an arrangement adequately caters for the businessmen based outside Nairobi. It is no wonder therefore, that 270 or 86 per cent of the 312 private handicraft exporting firms in the list that was compiled as explained in chapter three, are based in Nairobi. To make a larger impact in accelerating handicraft exports, the KETA has to get the businessmen in the country-side to become more actively involved in exporting handicrafts. The temporary presence of the KETA in the districts which takes the form of seminars and training programmes is not enough to motivate the businessmen in the districts to venture into regular export trade.

75
The organizational structure of th^ KETA makes)it difficult to determine the exact amount of financesft
i!that have been channelled into the handicraft sector. However, from sub-section 4.1.2 above, it is clear that the Authority gives special priority to the promotion of handicraft exports and that a substantial proportion of the Authority's market promotion expenditures go towards the promotion of handicrafts abroad.
From the views expressed by the handicraft exporters, it appears that they are all generally in praise of the Authority's role in providing assistance to exporters. It was however argued that the KETA's assistance is at present biased towards participation, in international trade fairs and exhibitions. As a result, there is very little emphasis placed on gathering market information and passing such information to the exporters. The responses obtained from the exporters concerning their views about the Authority are summarised in Table 4.1 and 4.2.
Table 4.2 shows the number of times the particular negative comments were made. Those exporters who felt that the modes of distributing trade enquiries and selecting exhibitors was not fair noted that there is a lot of favouritism in the manner the two issues were handled. The handicraft exhibitions organised by the

76
.TABLE 4.1: THE EXPORTERS' OPINIONABOUT THE KETA'S ASSISTANCE
SituationNumber of respondents
Percentage of the total Number of respondents
Number of Exporters satisfied with the KETA's assistance
10 35%
Number of Exporters expressing negative comments about the KETA
6 21%
Number of Exporters with a Mixed Opinion 4 14%
Number of Exporters without any comment 8 28%
Total Number 28 100%
Source: Field Survey.
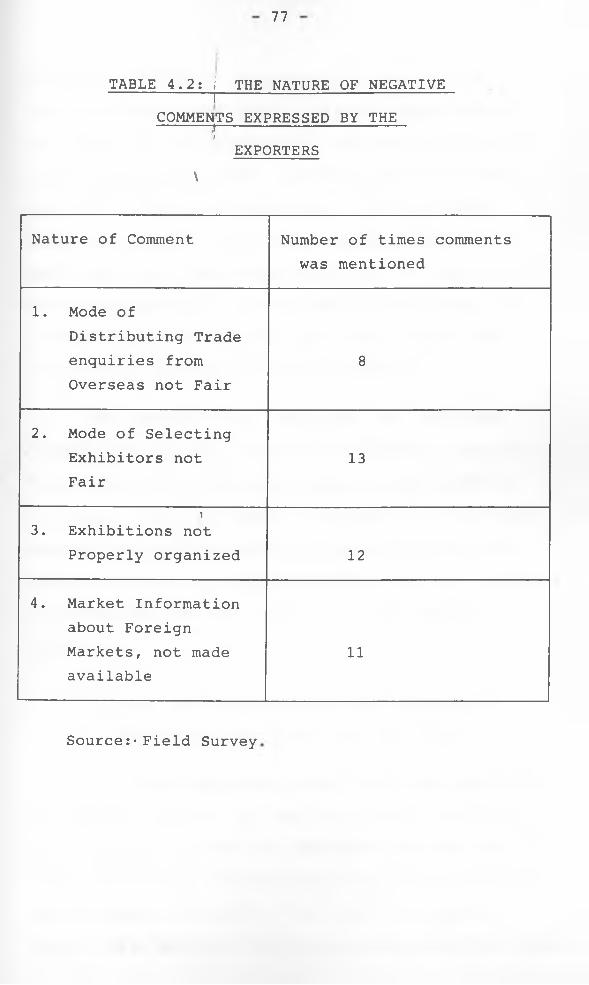
77
TABLE 4.2: i THE NATURE OF NEGATIVE--------------------- ,-----------------------------------------------
COMMENTS EXPRESSED BY THE---- i---------------EXPORTERS
\
Nature of Comment Number of times comments was mentioned
1. Mode ofDistributing Trade enquiries from Overseas not Fair
8
2. Mode of Selecting Exhibitors not Fair
13
i3. Exhibitions not
Properly organized 12
4. Market Information about Foreign Markets, not made available
11
Source:• Field Survey

78
KETA were criticized, because all exhibitors with similar products were made to display their goods in one place. It was argued that this method of display breeds unnecessary price competition and even hatred amongst the handicraft exporters. Some exporters noted that they do not receive adequate information about the supply and demand conditions in the country where an exhibition is scheduled to take place. As a result, they end up with many handicrafts that could not be sold during the exhibitions.
The KETA officials explained that they were already aware of the inconvenience caused by having all Kenyan handicraft exhibitors display their goods in one place. Plans Are said to be underway to have each exporter display his goods in a separate corner and disciplinary action would be taken against any exporters trying to lure away the buyers of their fellow exhibitors.
4.2.0: THE CHARACTERISTICS OF PRIVATEHANDICRAFT EXPORTING FIRMS IN KENYA
As already mentioned, most handicraft exporters are based in Nairobi. Of the 312 private exporting firms appearing in the list compiled from the KETA, the 'Kenya Export News' and from the U.S.A. Embassy, 86 per cent are based in Nairobi, 7 per cent are based in Mombasa while the rest 5 per cent are based in the rest

79
of the country. Table 4.3 shows the distribution ofithe respondent sample firms.
TABLE 4.3:
LOCATION OF THE RESPONDENT FIRMS
Location of the Respondent firms
Number of Firms
Percentage out of the Total Respondent Firms
Nairobi 25 89%Mombasa 3 11%Other Towns - -Total 28 100%
i
Source: Field Survey.
Table 4.4 below shows their type of ownership.The table shows that most of handicraft exporting firms in Kenya are family owned. Such family owned firms are managed by a husband, his wife and children. There are few joint stock companies engaged in exporting handicrafts all of which were found to be privately owned companies. All the joint stock companies are firms with long experience in exporting handicrafts. Three of them specialize only in exporting handicrafts.

80
TABLE 4.4: NATURE OF OWNERSHIP
Type of Ownership Number of Firms
Percentage of the Total
Sole Proprietor 7 25%
Family Enterprise 14 50%
LimitedPartnership 3 10%
Joint Stock Capacity 4 14%
Total 28 100%
Source: Field Survey.

81
Table 4.5 shows the types of other businesses operated by the respondent firms.
TABLE 4.5; FIRMS OPERATING OTHER BUSINESS BESIDES EXPORTING HANDICRAFTS
(Percentages Appear in the Parenthesis)
TYPE OF ADDITIONAL BUSINESS ACTIVITIES UNDERTAKEN
Number of firms out of the 28, reporting that they also handle this
business
1. Production of some of the handicrafts exported 15 (53%)
2. Handicrafts Retailing or Wholesale 17 (60%)
3. Farming 1(3%)
4. Other Export/ Import Trade 6 (21%)
5. Deals in' Other Retail Trade 1 ( 3%)
6. Matatu Business 1 ( 3%)
7. No other Business 3 (10%)
Source: Field Survey.

8 2
Table 4.5 shows that 53 per cent of the exporting firms also undertake the production of some of the handicrafts they export. Sixty per cent of the firms also undertake local retailing and wholesaling of handicrafts. Twenty-one per cent of the firms also undertake some other export and import trade. Only three or ten per cent of the firms specialize only in exporting handicrafts.
Table 4.6 shows the number of other businesses operated by the respondent firms.
TABLE 4.6: NUMBER OF OTHER BUSINESS OPERATEDBESIDES EXPORTING HANDICRAFTS
1
Number of other Business besides exporting handicrafts
Number of Firms
Percentage of the Total
More than 4 0 0%4 2 7%3 5 18%2 7 25%1 11 40%0 3 10%
Total 28 100%
Average Number of Other Activities = 3
Source: Field Survey

83
Table 4.6 shows that none of the respondent jifirms undertakes more than five business activities ht«i»a time and that on average the exporters run about
three business activities at a time.
Table 4.5 shows that 15 or 53 per cent of the respondent firms also produce some of the handicrafts they exported. However, 14 of them, which is almost all of them, are engaged in the production of handmade jewellery. The exporters feel that it is more remunerative to make their own jewellery than purchase
•jewellery from other producers at exhorbitant prices.jewellery
The hand-made/is easy to make except for the Maasai jewellery which is difficult to make. However, the Maasai jewellery isi relatively cheap and is obtained from the producers.
Only five of the firms manufacturing jewellery manufacture jewellery on a large scale basis otherwise for the rest of the firms the jewellery is produced by the owner himself or with the help of a few sales personnel. There is only one firm in Kenya that produces ceramic jewellery. This firm is located in the outskirts of Nairobi and employs slightly over 75 workers most of whom are women. Three of the jewellery manufacturing firms, including the ceramic jewellery factory, specialize only in exporting the jewellery they produce.

84
For the remaining handicrafts such as carvings, sisal baskets and batiks which require special artistic skills, production is subcontracted to the independent artisans because the exporters argue that it is cheaper to purchase from the producers rather than undertaking their own production. Only one firm amongst those interviewed, undertakes the production of other handicrafts other than jewellery. The firm makes furniture and wood carvings at its Gallery which is located at the city centre in Nairobi. The firm, at once time, opened a Sculpture College in Nairobi where local artists were trained how to produce sculptures of wood, stone and metal. The college washowever, closed in 1986 after it was realised that it1was difficult for artists to replicate the skills of the traditional artisan. The firm also produces soapstone carvings at its factory located at Tabaka Location of Kisii District. The factory was established in order to ensure that the firm's designs did not get copied by other handicraft dealers and producers.The firm employs qualified designers and artisans to develop new designs for soapstone. It is on the basis of the new designs that prototypes are made. Initially the prototypes were developed solely for the Tabaka factory but due to high labour turnover problems suffered by the project, it has not been possible for the factory to meet all the firm's soapstone

85
requirements. Some production therefore has to beisubcontracted to the independent artisans who take
advantage of the prototypes provided to them, to secure orders from other handicraft dealers. The firm has now realised that without some form of legal protection, it is difficult to protect its new designs because even for the artisans employed by the firm nothing stops them to undertake their own production during their spare time and also to share the expertise with their friends and relatives.
It was strongly argued by the exporters, that for carvings and baskets, there exists no incentives for manufacturing and even product design and development because first, it ife difficult to guard new designs and secondly one cannot be sure that a regular demand for the handicrafts being manufactured, will exist in the future.
As data in Table 4.7 indicates, majority of the respondent firm first ventured into exporting handicrafts in 1976. It is in 1976 when the Government through the KETA, started promoting handicraft exports. Up to 1976 the export trade in handicrafts was dominated by non- African firms with large capital assets. From 1976 onwards, the KETA has pursued a policy of Kenyanization and priority has always been given to the local Kenyans. This is supported by evidence from the non-African firms

86
that the KETA no longer invites them to participate in its trade exhibition^. Only two of the non-African owned firms have participated in the KETA's trade events and that was well before 1980.
TABLE 4.7: YEAR OF EXPORTER'S FIRST(HANDICRAFTS) EXPORT
(1)Period when the firms started exporting handicrafts
(2)Number of Firms
(3)Percentage of the
Total
Prior to 1963 , 1 3%1963 - 1975 2 8%1976 - 1988 25 89%
Total 28 100%
Source: Field Survey
Table 4.8 below shows that the handicraft export firmsare largely owned by Africans. This contrasts verymuch with Benjamin (1982)'s finding that as at 1977the handicraft export business was dominated by seven
3 8firms most of whom were owned by non-Africans.

87
TABLE 4.8: OWNERSHIP OF THE EXPORTING FIRMS
(1) (2) (3)Ownership Number of Percentage of the
Firms Total
African 20 71%Non-African 8 29%Mixed Ownership - -
Total 28 100%\
Source: Field Survey.
Whereas this study shows that only 29 per cent of the firms are owned by non-Africans, the firms owned by the non-Africans command a larger share of the business. The eight non-African firms altogether accounted for 66 per cent of the total export sales in 1987 (See Table 4.12). Infact two of the non-African firms with the longest experience, reported that they exported handicrafts worth Ksh.16 million in 1987 which is 26 per cent of the total exported by the respondent firms in 1987.
The respondents were asked for the three most difficult problems they had to overcome in starting their business. There appeared to be 14 categories of problems for those interviewed. The various responses
88
are summarised in Table 4.9. The table shows that shortage of working capital and establishing business contacts (customers) abroad were the most constraining problems facing businessmen following a decision to venture into exporting handicrafts.
The concern by 67 per cent of the exporters about the difficulty involved in obtaining foreign buyers was an indicator that it was their desire to maximize export sales, at least in the short run. However, the problem of inadequate working capital was found to be most constraining because where production is subcontracted, ready cash is required to purchase the handicrafts most of which are purchased in their unfinished forms. Money is then required to pay for finished materials, labour, shipping costs, transport to airport and for clearing and forwarding services. These costs, it was said, depend on the size of the expor order so that the larger the export order the greater the financial costs involved. Bank credit is difficult to obtain particularly for the Africans whose credibility is often doubted by the local commercial banks. The artisans sometimes may extend credit by accepting late payments but as one exporter put it:
"Yes, they may allow you to purchase on credit but after that they will never give you your piece of mind. You wake up in the morning, only to find that they are waiting for you. They will continue to press for their money till the day you have fully paid up."
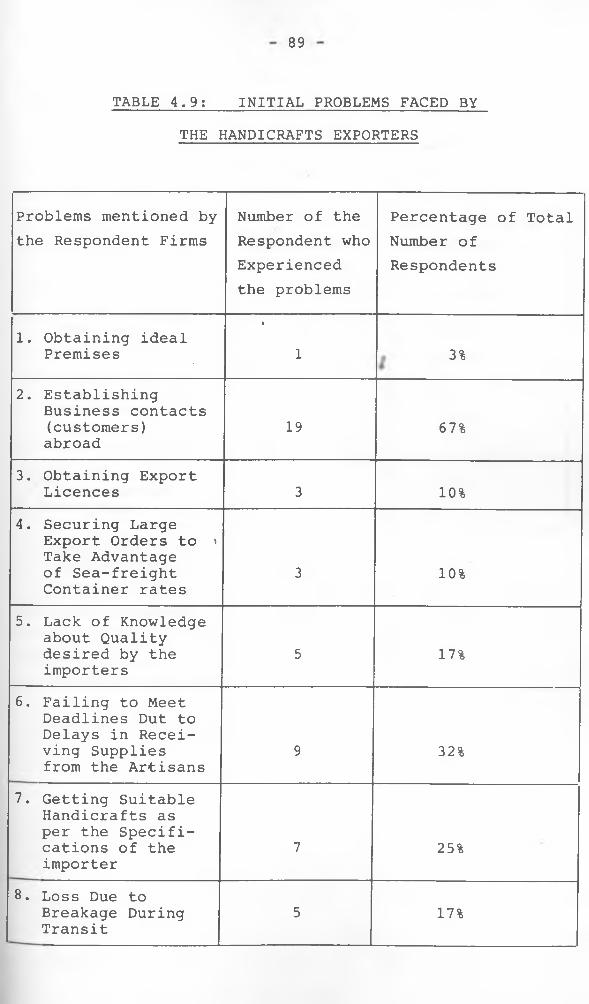
89
THE HANDICRAFTS EXPORTERSTABLE 4.9: INITIAL PROBLEMS FACED BY
Problems mentioned by the Respondent Firms
Number of the Respondent who Experienced the problems
Percentage of Total Number of Respondents
1. Obtaining ideal Premises
•
1 3%
2. EstablishingBusiness contacts(customers)abroad
19 67%
3. Obtaining Export Licences 3 10%
4. Securing LargeExport Orders to i Take Advantage of Sea-freight Container rates
3 10%
5. Lack of Knowledge about Quality desired by the importers
5 17%
6. Failing to Meet Deadlines Dut to Delays in Receiving Supplies from the Artisans
9 32%
7. Getting Suitable Handicrafts as per the Specifications of the importer
7 25%
8. Loss Due toBreakage During Transit
5 17%

90
TABLE 4.9 CONTD...
Problems mentioned by the Respondent Firms
Number of the Respondent who Experienced the Problems
Percentage of Total Number of Respondents
9. Lengthy Export Procedures 5 17%
10. Excess Supply Conditions in the Foreign Markets
4 14%
11. ExportCompensation too slow
2 7%
i12. Shortage of
Working Capital 18 64%
13. Other Problems 10 35%
14. No Problem 1 3%
Source: Field Survey.
91
The problem of shortage of wording capital isImost severe when an exporter has to handle frequentJlarge orders. Few importers are willing to make a downpayment before receiving their goods.
Two of the firms noted that they had experienced delays in receiving export compensation for handicrafts exported. This problem, however, no longer applies as handicrafts were struck out of the Export Compensation Schedule by the Minister of Finance in 1986 during the preseventation of the budget. Most of the exporters reported that they had been able to overcome most of their initial problems over time. This response indicates that experience is an essential factor in the export marketing of'handicrafts. Experience gained over the years helps the exporters learn ways ofminimizing breakage and shipping costs through better packaging techniques and also to negotiate for competitive rates and prices. Over time the exporter is able to accumulate knowledge on how to identify and find reliable suppliers, how to go about prospecting for new foreign buyers and also on how to determine what products should go to which market. Groupage shipping organized by the exporters is normally used to take advantage of shipping by container which is a relatively cheaper mode of shipping. Often a container is too large for one exporter and groupage shipping therefore helps to overcome the problem. However, groupage shipping

92
is difficult to organize where destinations and delivery schedules differ to a large extent.
Only three (ten per cent) of the respondents export only what they manufacture. For the rest of the respondent firms, there are three alternative sources of the handicrafts they export. Production may be subcontracted to the independent artisans or to the producer co-operatives and self-help groups. The third alternative, is to buy from the middlemen who collect handicrafts mainly from the producers in the country side< • This latter alternative source of handicrafts, is relatively more expensive and exporters will usually prefer to buy directly from the producers or their co-operatives and self-help groups. Relying on producers or co-operatives however entails greater uncertainties as to whether supplies will be received in time, whether they will be made available in the desired quantities and whether the specifications agreed upon at the time of placing the order will be met. Failure on the part of the suppliers to fulfil these requirements may cause the exporter financial losses arising from the cancellation of orders or from the negative image about the exporter, that delays portray to the foreign buyer. The exporters were asked whether they experience any problems from the supply side.The responses of the exporters about these problems are presented along with the other problems currently being

93
faced by the exporters. This information is summarisediin Table 4.10, The problems are grouped into three• Im a m categories.
The problems of lack of working capital and unfair business practices amongst Kenyan exporters featured most in the exporters' responses. Unfair business practices take the form of unfair price competition, spying and luring the foreign customers of other exporters and also competing for buyers during international exhibitions organised by the KETA. Price competition mainly takes the form of exporters undercutting one another's prices. This price competition, it was argued by some of those who had pulled out of the business, was deliberately being undertaken by some exporters in order to expand their operations at the expense of the small exporters who cannot cope with low prices. As a result some of the small firms had lost their overseas buyers to the large exporters. Three of the firms which were forced out of the business, pointed out that they had decided to concentrate on selling handicrafts locally to the tourist, who it was said, offer much better prices than those obtainable from the exporters.
Ten out of the 28 exporters stated that they experience problems on the supply side. It was pointed out that some handicrafts such as the sisal baskets are

94
TABLE 4.0.0: CURRENT MAJOR PROBLEMS FACING}Handicraft exporters in kenya
The Problems
Number out of the 2 8 Exporters stating the problem
Percentage out of the Total
A. PROBLEMS ON THE 'SUPPLY SIDE
1. Unreliable Supplies 10 35.72. Quality not
Satisfactory 7 25
B. PROBLEMS ARISINGFROM SHIPPING
3. Airfreight too Expensive 8 32
4. Orders not Large Enough to enable the Exporter make use of Container Shipping
9 32
C. EXPORT MARKETINGPROBLEMS
5. Delayed Payments 4 14.36. Defaults 3 10.71

95
TABLE 4.10 CONTD
C. EXPORT MARKETINGPROBLEMS CONTD.....
7. Lack of MarketInformation
8. Unfair Business4 14.8
Practices Amongst the Kenyan Exporters
9. Lack of Export
13 46.4
Incentives10. Excess Supply in
9 32
the Foreign Markets11. Depreciation of the Kenya
Shilling Against Major Foreign 1 Currencies Increasing the Costs of Under-
6 21.4
taking Private Promotions Abroad
12. Lack of Incentives for Manufacturing
4 14.3
and Product Development
13. Lack of Working
6 21.4
Capital14. Stiff Competition
18 64.3
From Asian Countries 6 21.4
Source: Field Survey.

96
difficult to obtain in large quantities during the wetseasons. The production of wood carvings was said tobe erratic due to the strict forest conservationscurrently being undertaken by the Government. The woodused for wood carvings is also usually smuggled fromTanzania and the Kenyan gazetted forests but this hashad the negative impact of increasing production costs.Lack of market information was also said to be aproblem particularly when a regular importer suddenlyclaims that exporters from a competing country can offerhim a better price. Such claims are usually unfoundedand adequate information which is lacking at present,is required to verify such claims. It was howeverpointed out that the most pressing problem for exporterswas the lack of an organized supply side to ensure areliable supply of handicrafts. The exporters thereforehave to maintain an inventory of handicrafts to avoidthe problem of having to postpone or cancel exportorders. However, a large capital outlays are requiredto finance an adequate stock of handicrafts. Scarcityof good quality leather for finishing the sisal basketsis also a problem due to the large quantities of rawhides leaving the country. The large raw hides exportshave for some time forced the local tanning factoriesto operate at less than full capacity thereby causing
39a shortage of finished leather.
The handicraft exporters were asked to state how- <- - - 1 - - r - ■ j . r n e ,

97
they obtained their first export order. Eleven exports received their initial export orders from tourists '
itvisiting Kenya, forty per cent of the exporters obtained their first export order through the KETA, eight per cent of them obtained their first orders during their participation in international trade fairs and twelve per cent obtained their orders through diplomatic missions in Kenya or through their friends and relatives living in foreign countries. The tourists therefore constitute an important source of export orders in the handicraft sector.
None of the firms undertake any form of market research. The firms rely on their foreign clients to furnish them with details and feed-back on foreign demand tastes etc. Some exporters rely on information gathered from the current fashion magazines. Others obtain information during their business trips abroad and during their participation in trade exhibitions.
The common mode of communication between the firms and their clients is mainly in writing and talk over the telephone. Only 32 per cent of the exporters undertake business trips overseas to acquaint themselves with their existing and new buyers.
All the handicraft exporters interviewed undertake some form of sales promotion either through correspondence, attending trade fairs, sending samples

98
or by using relatives and friends living in the foreign countries to find new foreign customers on their behalf. Forty-six per cent of the respondent firms have participated in the KETA's trade exhibitions, 32 per cent have never applied to participate in the fairs.The information about the exporters participation is presented in Table 4.11.
TABLE 4.11; PARTICIPATION OF THE EXPORTING FIRMS IN THE KETA'S HANDICRAFT FAIRS
Situation Number of Firms
Percentage of the Total
Has Participated , 13 46%
Has never participated but has applied for participation
9 32%
Has never participated and has never applied 6 22%
Total that has never participated 15 54%
Total Number of respondents 28 100%
Source: Field Survey.
re*~T V*£r- •

99
Out of the respondent firms interviewed, forty per cent undertake their own private promotional activities such as advertising, participation in international exhibitions and the distribution of promotional materials and product samples. The common types of promotional materials used are catalogs, price lists, and coloured pohotographs of his products. Only one of the exporters, advertises his business in a world trade journal. Some of the exporters also advertise their business in the "Kenya Export News" and other foreign magazines. However, it was pointed out that the cost of undertaking private promotions abroad was becoming too prohibitive due to the depreciating value of the Kenya shilling against the major foreign currencies.
Table 4.12, shows the promotional, expenditures and export sales realised by the respondents in 1987.There appears to be some positive correlation between the levels of export sales and the levels of expenditure, on export market publicity. However, the correlation does not appear strong because some firms were able to generate high export sales in 1987 without spending much on market promotion. Examples of such firms are firms number 9, 10, 12, 14, 16 and 23. The differences in experience appear to explain well for the varying levels in export sales as the firms with a much longer experience also realised higher export sales in 1987.

\
However, it also appears that firms such as 20 ad 21 which have the least experience also recorded relatively higher export sales in 1987. This difference are accounted for by the types of handicrafts traded and whether the firm has additional experienced gained from other export import trade. Firm 21, for instance was able to export handicrafts worth Ksh.500,000 after only being in the business for six months. This situation, is explained by the fact that firm 21 is owned by an exporter who also undertakes a Clearing and Forwarding business which has probably enabled him to take a greater advantage of the market within a short time.
Export sales and expenditures on product design and development depend on the commodities being traded. Some handicrafts are high value goods and therefore generate relatively higher export sales. Jewellery, for instance, is a high value item which to some extent does not require much product improvement after the production process is complete. Sisal baskets on the other hand entail heavier expenditures on finishing and design improvement while items such as ethnographs require less expenditure on product design and development.For wood carvings and the sisal baskets expenditure on product design and development will depend on the state of the item. A finished item will entail less expenditure whereas an unfinished item will entail more expenditure on finishing.
- 100 -

f
TABLE 4.12: PRIMARY DATA FOR REGRESSION ANALYSIS
ExportFirm
Experience No. of Years (Ei)
Institutional Support
from the KETA (I)
FirmExpenditure on PDD in
1987 (Kshs. Million)
FirmExpenditure on Px in
1987 (Kshs. Million)
1 15 5 2,000,000 800,0002 10 20 1,500,000 300,0003 45 - 50,000 1,000,0004 4 - 500,000 1,000,0005 9 - 40,000 80,0006 10 12 100,000 250,0007 11 10 500,000 1,000,0008 6 7 - 70,0009 8 - 40,000 20,00010 10 - - 50,00011 11 10 85,000 80,00012 4 4 10,000 20,00013 3 - 30,000 75,00014 9 - 30,000 3,00015 4 12 20,000 120,00016 10 - 6,000 10,00017 5 1 5,000 100,00018 10 5 50,000 140,00019 5 5 10,000 50,00020 0.9 - 10,000 70,00021 0.5 - - 50,00022 • 1 - - 50,00023 2 - 5,000 2,40024 16 - 10,000 ' 30,00025 2 - ' 10,000 4,00026 1 1 - -
27 6 1 18,00028 3 - _____I-----
FirmExport Sales (Sx) in
1987 (Kshs. Million)
Nature of Ownership (African or Non-African)
9,000,000 Non-African8,000,000 II7,000,000 It6,000,000 -------4,500,000 II4,000,000 African3,000,000 II3,000,000 II2,000,000 Non-African2,000,000 II1,800,000 African1,450,000 II1,440,000 II1,200,000 Non-African1,200,000 African1,000,000 II
800,000 II600,000 II600,000 II600,000 II500,000 II200,000 II200,000 II200,000 II97,500 /75,000. / /60,000 / J
i
101

102
A firm's annual export sales also depends on;
the size of the export orders and their fjreqeuncy.A firm which exports handicrafts on a whdjlesale basis can be expected to have higher export sales. The first three firms in Table 4.12 export handicrafts to large scale importers.
Only three firms out of the 28 have an export manager employed specifically to handle handicrft exports. These three firms are first three firms in Table 4.12 which also are large exporters. For the rest of the firms the owners or general managers are directly in charge of handling handicraft exports.
Eight six per cent of the respondent firms listed the U.S.A. as theiri main foreign market and for the remaining firms, the European countries and Japan were listed as the main markets. Only three firms reported trade with an African country. The three African countries listed were Botswana, Djibouti and Zimbabwe. None of the handicraft exporters reported trade with the socialist countries.
The respondent firms deal in a wide range of goods, very few are specialised in exporting only a single product. Only three firms export only a single product and all the three export jewellery. It was observed that the Mombasa firms export mostly wood carvings on a large scale basis whereas the Nairbi firms

103
export a wider range of goods mainly on a small scale basis. Almost all the handicraft exporters export sisal baskets. Only one firm out of the 28 respondent firms exports ethnographs. None of the respondents exports fish flies.
The exporters were asked whether they participated in any joint marketing efforts with other handicraft exports. Seven of the firms reported that in the past they have organized groupage shipping with other exports but this is no longer done. Each firm undertakes all its export marketing the help of other exporters. None of the exporters find the idea of joint export marketing attractive. The exporters pointed out that joint marketing activities would be difficult to organize as the Kenyan exporters were generally divided amongst themselves. Some exporters noted that even organizing for groupage shipping is not easy because each exporter prefers to be secretive about his export orders and his foreign clients in order to safeguard oneself against price undercutting.
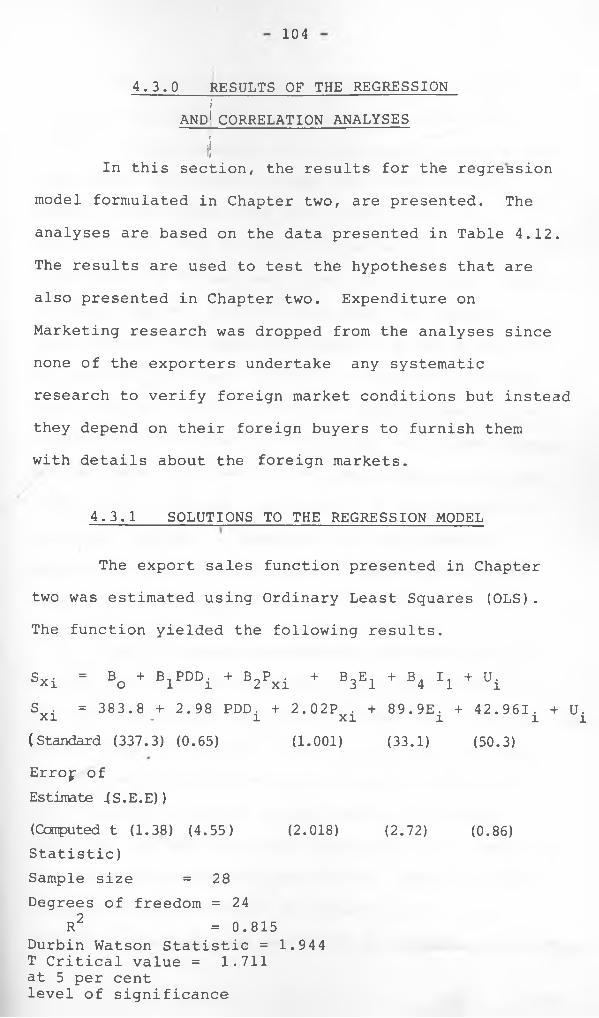
104
4.3.0 RESULTS OF THE REGRESSIONi
AND1 CORRELATION ANALYSES
IIn this section, the results for the regression
model formulated in Chapter two, are presented. The analyses are based on the data presented in Table 4.12.The results are used to test the hypotheses that are also presented in Chapter two. Expenditure on Marketing research was dropped from the analyses since none of the exporters undertake any systematic research to verify foreign market conditions but instead they depend on their foreign buyers to furnish them with details about the foreign markets.
4.3.1 SOLUTIONS TO THE REGRESSION MODEL
The export sales function presented in Chapter two was estimated using Ordinary Least Squares (OLS).The function yielded the following results.
Sv- = B + B.PDD. + B~P . + B,E. + B. I, + U.xi o l i 2 xi 3 1 4 1 lS . = 383.8 + 2.98 PDD. + 2.02P . + 89.9E. + 42.961. + U.xi . 1 XI 1 1 1
(Standard (337.3) (0.65) (1.001) (33.1) (50.3)Errof of Estimate fS.E.E))(Computed t (1.38) (4.55) (2.018) (2.72) (0.86)Statistic)Sample size = 28Degrees of freedom = 24
R2 = 0.815Durbin Watson Statistic = 1.944 T Critical value = 1.711at 5 per cent level of significance

105
All the regression coefficients are positive thereby confirming the hypotheses that there is a positive correlation between firm export sales and the independent variables. Except for institutional support whose effects on firm export sales are insignificant, all the other variables are statistically significant at 95 per cent level of confidence. This finding, however, does not mean that the KETA's assistance to the handicraft exporters has so far made no substantial impact. In this connection, it should also be noted that the proxy for institutional support suffers from shortcomings because it only takes account of the number of times of firm has participated in the KETA trade exhibitions and fairs. It is difficult to quantify the KETA' !a assistance to each exporter because of the lack of financial information on this aspect.
From the views expressed by the exporters, it appears that they are generally happy with the support from the Authority. The impact of the KETA in increasing export sales#can be seen from the fact that the KETA has devoted a special section for handicrafts which deals only with matters pertaining to handicrafts.Each year the KETA organises participation in about 3 to 5 exclusive handicraft exhibitions. Each exhibition costs the KETA an average of Ksh. 1.5 million to organize. One third of the KETA's promotional expenditure

106
is spent on promoting Kenyan handicrafts in foreign countries. The Authority has no doubt had a large impact on Kenya's handicraft export but it is difficult to capture this due to lack of information.
2The R in the regression analysis is 0.815, which indicates that the linear regression model accounts for about 82 per cent of the variations in export sales of the handicraft exporters in the sample. The R2 is a statistic which summarizes the explanatory power of an equation. It is the proportion of the variation in the dependent variable which is accounted for by the explanatory variables. Thus R2 lies between zero and unity and the closer it is to one the higher the explanatory power.
The Durbin-Watson Statistic is a statistic whichdiagnoses the problem of serial correlation between error
40terms in a regression. According to Pearce (1983), Durbin- Watson value of around 2 usually indicates that there is no problem. Hence, the problem of serial correlation is absent in this analysis since the Durbin-WatsonStatistic is 1.944.
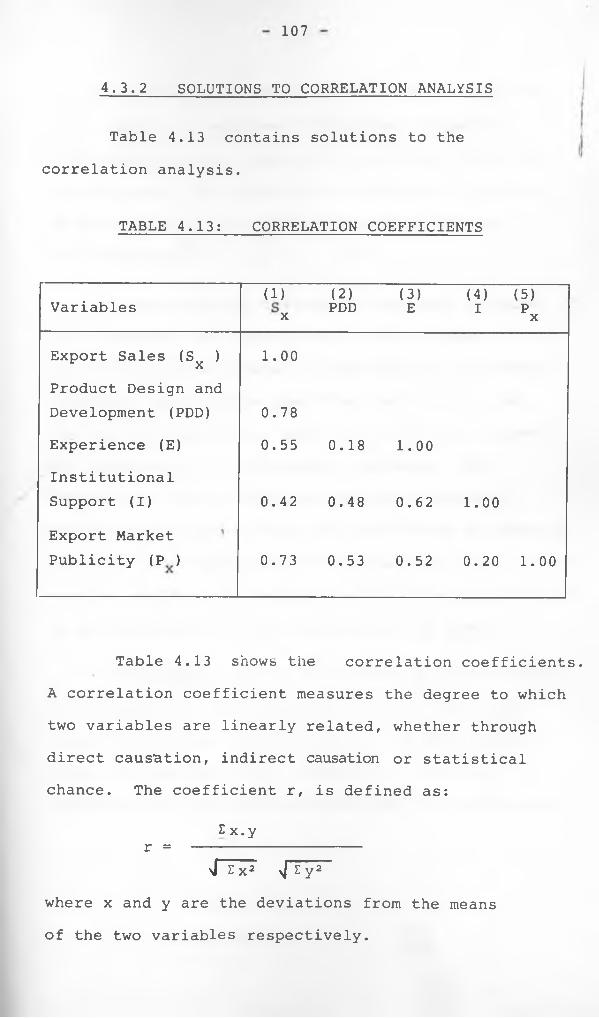
107
4.3.2 SOLUTIONS TO CORRELATION ANALYSIS
Table 4.13 contains solutions to the correlation analysis.
TABLE 4.13: CORRELATION COEFFICIENTS
Variables (1) (2) (3) (4) (5)PDD E I P x X
Export Sales (Sx ) 1.00Product Design andDevelopment (PDD) 0.78Experience (E) 0.55 0.18 1.00InstitutionalSupport (I) 0.42 0.48 0.62 1.00Export MarketPublicity (P ) 0.73 0.53 0.52 0.20 1.00
Table 4.13 shows the correlation coefficients. A correlation coefficient measures the degree to which two variables are linearly related, whether through direct causation, indirect causation or statistical chance. The coefficient r, is defined as:
2 x.yr = -----------------
>/ E x2 \| I y2where x and y are the deviations from the means of the two variables respectively.

108
The coefficient can take on values between plus andminus unity. A negative r indicates a negativerelationship while a positive r indicates a positiverelationship. The closer the coefficient is to plusor minus unity, the greater the strength of the
41relationship.
The results of correlation analysis in Table 4.13 indicate that there exists a high degree of correlation between export sales and the independent variables (this can be seen from the first column).The rest of the columns show the relationship between the explanatory or independent variables. The correlation coefficients between the explanatory variables are used’to find out whether the explanatory variables are highly correlated with each other. Since none of coefficients are high as indicated in columns 2 to 4, the problem of multicollinearity is absent.
The results of the correlation analysis confirm the findings of the regression analysis that there exists a positive relationship between firm export sales and the explanatory variables. Thus the hypotheses of the study are confirmed by the analyses.

109
iiENDNOTES j
I!36. Barve, A.G., The Foreiqn Tra^e of Kenya,
Transafrica Press, Nairobi, 1984. page 55.
37. The Kenya External Trave Authority, KenyaExport News, Vol.36 No.367, 1985. page 1.
38. Benjamin, M., "Market Development and Developmentof Export Industries'! Kenya External Trade Authority, Nairobi, 1982. page 21.
39. Daily Nation, "Export Ban Draws Protest".Written by Kamau Kaniaru, Thursday 10th,June, 1982.
40. Pearce, D.W,. , (ed.), The Dictionary ofModern Economics, London, 1983. page 126.
41. Pearce, D.W. (ed.), op. cit. page 85.

CHAPTER FIVEfj II
CONCLUSIONS AND IMPLICATIONS OF THE STUDY j— --------------------------------------- if
This study is concluded in five sections. In the first section, the results and findings of the study are discussed. The second contains the conclusions drawn from the study and the third, discusses the limitations of the study. The last two sections contain recommendations and suggestion for future research.
5.1 RESULTS AND DISCUSSION
The theoretical concept of the product life cycle (PLC) as it is discussed in theory of marketing and the theory of international trade was used in this study to underscore the role of marketing efforts in export marketing, in a situation of stiff competition both at home and in the foreign market.
The PLC concept is the proposition that the most successful new products follow a characteristic pattern of market introduction, growth, maturity and decline. In the introductory phase there is only one selling firm or country with a monopoly position.Sales begin to grow rapidly but in the second stage other firms or countries begin to sell the product thereby beginning to displace the initial seller in the market. In the third stage or maturity phase, the initial seller's sales begin to level off as the

Ill
products of otfyer sellers become more competitive.!
In the decline phase, sales begin to decline as demandJfor the product falls or is transferred to other products.
The PLC has important implications for marketing because for a firm or a country to remain in business, it has to undertake research and development efforts in order to extend the product life cycle of its product.Research and development efforts have to be undertaken to formulate new products or redesign the existing ones in order to generate more revenues and maintain the market shares.
The performance of Kenyan handicraft exports are somewhat consistent with the predictions of the PLC. Kenyan handicraft exporters are currently faced with stiff competition not only amongst themselves
\but also from other countries which have started to displace Kenya's handicraft exports in the foreign markets. The aim of this study was to investigate how the exporters are coping with the new market situation and also to find out whether the varying levels of their export’ sales are explained by the differences in their marketing efforts.
The study confined itself to exporters in the private sector only. The study's findings are based on data collected from a sample of handicraft exporters in Kenya selected randomly from a list of privately

112
owned handicraft exporting firms. Correlation andI
regression analyses were used to determine theijrelationship existing between the export sales of the handicraft exporters and their marketing expenses on export marketing research, export sales promotion and product design and development.
Analyses of the results in general indicated that firms which incurred higher marketing expenses on export sales promotion and product design and development in 1987, also reported to have made relatively higher export sales in 1987. None of the handicraft exporters, however, undertakes export marketing research but instead rely on their foreign customers and relatives abroad to furnish them with details about the foreign market conditions. Also it was found that there exists a high positive correlation between the export sales of the handicraft exporters in Kenya and their experience in exporting handicrafts. The study also reveals that there is a positive correlation between handicraft exports at the firm level and the previous institutional support received from the KETA by each firm. However, the impact of the proxy for institutional support from the KETA on firm export sales, using ordinary least squares was found to be statistically insignificant.
These results particularly support the study by Kathuria (1986) on the Indian situation. Kathuria found that those handicraft exporters in India who

113
had made substantial investment in product design and development were relatively more successful.
The other objective of this study was to identify the marketing strategies used by the handicraft exporters in Kenya to cope with the stiff competition prevailing in the international market. The evidence gathered indicates that the common ways of securing larger export sales was by participating in international trade fairs and exhibitions, undertaking business trips abroad to meet new and old buyers, using friends and relatives abroad and using promotional materials such as catalogues, brochures and coloured photographs.Price undercutting amongst the Kenyan handicraft exporters was claimed to be a major problem thus indicating that price competition is one of the methods used to secure larger export sales.
Product competition is not extensively used because except for hand-made jewellery, most of the production is subcontracted to the independent artisans.It is generally difficult for the handicraft exporters to protect their original designs from being copied by other handicraft dealers since there is no legal framework in Kenya for protecting new innovations.Only one firm has tried in the past to put up a manufacturing unit for soapstone carvings in a bid to protect- its own designs which are developed by its

114
qualified designers. This firm, however,has been unableto protect its designs because it is not difficult
Ifor other artisans to replicate its new designs. This firm is the only firm in the sample that produces an assortment of handicrafts besides jewellery. It produces wood-carvings, traditional furniture and other items such as decorated and painted calabashes, besides jewellery.
The other objective of the study was to identify the constraints hampering the growth of handicraft exports from Kenya. The study found that the KETA's promotional activities have not only helped to step
fup Kenya's handicraft exports but also to indigenize the handicrafts export trade. 71% of the exporters interviewed were Africans. However, it was observed that the KETA's offices are all based in Nairobi thus raising doubt whether the businessmen in the country side are well catered for in terms of assistance. As a result of this lack of decentralization on the part of the KETA, the handicrafts export business in Kenya is very urban oriented. 86% of the handicraft exporters are based in Nairobi while the remaining firms are mainly located in Mombasa. This urban orientation of the handicrafts export business in Kenya has had the negative effect of attracting the handicraft production units to shift to the major urban centres.The following problems listed in their order of importance

115
were found to be the major constraints:
1. Lack of access to export credit
2. Erratic production of handicrafts
3. Shortage of production and finishing materials
4. Improper business practices amongst the Kenyan exporters
5. Lack of adequate market information about foreign market conditions and demand
6. Lack of incentives for handicraft exports
7. Lack of incentives for manufacturing and for product development in the handicraft sector. ,
This study demonstrates that a positive correlation does exist between export sales of handicrafts and expenditures on export promotion and product design and development. Particular attention, therefore, has to be paid to these marketing strategies and efforts should be made to assist the handicraft exporters undertake more marketing efforts on their own. However, successful promotion of handicraft exports will also depend on other factors such as the degree of organization on the production side, the marketing skills of the exporters and their ability to offer competitive payment terms to the handicraft importers.

116
The exporters pointed out that they face problems on the supply side which have in the past been affecting their ability to execute export orders in time. In order to be competitive in the international market, Kenyan handicraft exporters have to improve their delivery schedules. Supply constraints such as scarcity of raw materials like wood and finishing materials like leather were said to be most constraining. Also the production of many handicrafts tends to be erratic because production of handicrafts in the rural areas is pursued more or less as part-time activity.
For Kenya handicrafts to remain attractive to the high income consumers of the developed countries, product development’is imperative. The absence of a legal framework for the protection of new designs in Kenya is a major disincentive against product development by the individual handicraft exporting firms. The provision of legal protection for genuine innovations in the handicraft sector, can go along way to encourage product development and also to protect Kenyan handicrafts from being imitated by other competing countries.
Marketing research is an important ingredient in product development. For handicrafts, export marketing research would go a long way to help the handicraft exporters keep in pace with the changing foreign market conditions and the changing preferences of the high

117
income consumers in the developed countries. Sinceithese two keep on changing export marketing researchijhas to be a continuous activity on the part of the
KETA and that of the handicraft exporting firms. Local sales to tourists cannot be used as a basis of judging what is best for the export market (Hughes 1981).
This study demonstrates that there exists a positive correlation between handicraft export sales at the firm level and expenditure on export promotion.This indicates that larger handicraft export sales can be secured through market promotions in the foreign countries. Particular attention therefore, should be given to ensuring flexibility in the allocation of foreign exchange to the handicraft exporters to enable them undertake more business travel. Business travel can generate more export sales than written correspondence which currently is the major means of communication between the Kenyan exporters and the foreign buyers. Market premotions in the foreign countries may be used as an opportunity to launch new designs and products. However, in order for the new 'handicrafts to remain appealing to the high income consumers in the export markets, the distribution channels and quantities have to be limited so that the new fashionable products are not killed prematurely through excess supply.

118
Successful promotion of handicraft exports will not only depend on quality, prices and the exporters' delivery schedules, but will also depend on the capacity of the exporters to offer deffered payment or credit terms to importers. The exporters' ability to offer competitive terms of credit depends on the availability of export financing and export credit insurance schemes in the country. In Kenya, banks are not prepared to provide export financing on the strength of commercial papers alone and insist on other collateral. Lack of export credit insurance facilities in Kenya is also a problem. The handicraft exporters therefore needto be provided with adequate financing and export credit
1insurance facilities to make them more competitive.However, such a policy has to be pursued with caution as export credit can create serious strains on the country's balance of payments.
5.2 CONCLUSIONS OF THE STUDY
This study concludes that those handicraft exporting firms which’undertake greater marketing efforts on promotion and product design and development have higher export sales. This therefore, indicates the need for handicraft exporting firms to undertake more marketing efforts at the firm level to boost theirown exports sales. The study also indicates that/
firms with more experience in exporting handicrafts also

119
have higher export sales. It lso indicates that firmsjthat have received more assistance from the KETA, also have higher export sales.
i
Analyses of data gathered from the handicraft exporters also indicated that the differences in the levels of handicraft export sales between the firms is explained by the differences in their levels of experience and marketing efforts on promotion and product design and development. However, the impact of institutional support from the KETA was found to be statistically insignificant.
5.3 LIMITATIONS OF THE STUDY/
One of the limitations of this study is the use of each firm's past attendance in the KETA's international trade fairs and exhibitions as a proxy for institutional support. However, one can speculate on the reasons why the export sales of those handicraft exporting firms which have attended more of the KETA's trade events did not have significantly higher export sales. It Was found for instance that the exporters undertake their own export promotion without the assistance of the KETA. This probably explains why there was no significant difference between those firms which have participated in more or fewer of the KETA'strade events.

120 «*r* o*&
0 $ '
Another methodological weakness of the study Jtis that its findings are based on information reported by the handicraft exporters. Since the firms do not publish their annual accounts, it is difficult to verify the information provided. However, the respondents were asked to refer to their commercial records before providing the quantitative information required for the study.
5.4 RECOMMENDATIONS
In view of the study's findings and the discussion of the results, the following proposals for accelerating handicraft exports from Kenya are made:
1. Promotional assistance offered by the KETA to handicraft exporters and producers co-operatives : should be continued and expanded to involve even businessmen outside Nairobi.Plans should therefore be made to have the KETA's Handicraft Section decentralize its officers in order to cater closely for the businessmen in the country side.At present, the handicraft export business is mainly concentrated in Nairobi and Mombasa. This concentration has the effect of encouraging the artisans to move to Nairobi and Mombasa. The exporters have alsoijt 7JT 4.
encouraged this rural-urban shift because

121
it enables them deal directly with the artisan thus eliminating the middlemen's margin. The rural based handicraft exporters can be more effective in getting a wide variety of handicrafts from the rural areas because of their proximity and familiarity with the producers.
In order to get more businessmen in the country side venture into exporting handicrafts from Kenya, there is a need to reduce the complexity in exportprocedures and to decentralize export
1licensing facilities at the district level . The signing of Certificates of Origin for handicrafts destined for countries offering preferential treatment, should also be decentralized away from Nairobi.
.The KETA should continue participating in exclusive international trade fairs and exhibitions for handicrafts. Focus however should be directed to opening new markets especially in the African and the socialist European countries. The organization of the KETA's participation in international

122
trade events should jbe constantly>
reviewed to take into account the5
constructive suggestions from the exporters. The selection of exhibitors for instance, should be seen to be fair by having different exhibitors participate in different events. The policy of having the exhibitors share part of the costs of participating in the events, has been preventing some exporters from declaring the interest to participate in the events. It is however, recognized that cpst sharing is imperative given the heavy financial commitments the Government already has. However, wherever possible additional financing may be sought from the import agencies of the developed countries so that such additional financing may be used to reduce costs for the Kenyan exhibitors.
4. The KETA should also make efforts toprovide a continuous market intelligence service to the handicraft exporters. This service may be provided by the KETA with the assistance of import agencies of the developed countries.

123
5. The handicraft sector in Kenya, should receive special Government assistance through legislation governing taxation, investments and export incentives. The Government, should consider for instance reinstating handicrafts in the Export Compensation Schedule.
6. There is need to improve export credit facilities and to ask the local commercial banks not to discriminate against the small handicraft exporters most of whom are indigenous Kenyans. Export credit insurance facilities should also be made available to insure the exporters against non-payment.Such a scheme is already under consideration by the Government since the KETA prepared a recommendation that a national export credit Insurance Scheme be introduced in Kenya.
7. There is need also to improve rural infrastructure in order to reduce the internal handling costs and to enable the middlemen to cover wider

124
ii|apeas. By expanding the rural infrastructural network, the handicraft dealers would be in a better position to exploit the country's large production potential which is afforded by the diverse cultural heritage existing in Kenya.
8. There is also a need for handicraftexporters in Kenya to intensify product competition rather than price competition in the export market. The Government should consider developing a patent scheme to protect genuine innovations.The handicraft exporters should be taught how to use the concept of the product cycle in planning their business. They snould also be taught how to build prestige for their handicrafts by undertaking quality control and signing their handicrafts or simply stamping them with a mark of distinction. Each firm may then use advertising to publicize the special aspects of its handicrafts. *
*

125
9. The Government should establish some institutional infrastructure for developing handicrafts. This could be achieved through the establishment of a National Handicrafts Design and Development Centre. The proposed Centre could seek to overcome the problems currently affecting the production of handicrafts. Together with the Ministries of Agriculture and Natural Resources, the centre could organize programmes to ensure the availability of indigenous raw materials necessary for the production of handicrafts. The centre should basically be a research and development institution to develop new designs, new products and improved production techniques. The centre could work in liaison with the existing Christian and non-governmental training institutions to provide adequate training programmes for the artisans. The proposed centre could also work with the Central Bureau of Statistics to generate statistical data on employment and production in the handicraft sector. The

126
proposed centre can act as an advisor to the Government on matters affecting efficiency within the handicraft sector.Technical and financial assistance for the centre, may be sought from the International Trade Centre (ITC), the EEC, the World Bank and import agencies of the developed countries such as the CBI of Netherlands and the JETRO of Japan.
10. The Kenyan exporters should work tostrengthen their National Handicraft /*Organization that was formed under the auspices of the Kenya National Chamber of Commerce. The organization should be specialized and streamlined so as to cater only for the interests of the handicraft exporters. The producers and other handicraft dealers can best be served by their respective co-operatives or self-help groups. The new organization of exporters should undertake efforts to ensure that only the high quality products are exported. This could be achieved by monitoring the exports so that the cheap quality handicrafts or junks are

127
not allowed to leave the country.The organization can, for instance, certify the quality of handicrafts, by stamping goods that meet quality standards with its own mark of identification. The organization of exporters can undertake grading of handicrafts before they are exported.A grading system for handicrafts should encourage the artisans to turn out higher quality products. The organization should safeguard the interests of its members and lobby for governmental support and assistance It can also impose controls on quantity exported and on prices whenever such measures are deemed necessary. Towards achieving its objectives, the new organization of exporters should work in collaboration with the KETA, the Central Bank, the Customs, the KNCCI and the proposed National Handicrafts Design and Development Centre. The organization could also undertake market intelligence abroad on behalf of its members and provide consumer education abroad on the special aspects

128
of Kenyan handicrafts bearing its stamp of approval. It could also work with the relevant governmental authorities to develop a patent scheme for handicrafts.
5.5 SUGGESTIONS FOR FUTURE RESEARCH
This study only examines the factors influencing export sales of handicrafts at the firm level. It also identifies the problems facing the export side of the handicraft sector. The export side of the handicraft sector is, however, only a small portion of the handicrafts market. Studies are therefore required to examine? the tourist market for handicrafts in detail and also the entire domestic market for handicrafts in Kenya. There is need to study the tourists' expenditure behaviour with a view of ascertaining the amount of indirect foreign exchange earned through the sale of handicrafts to tourists. There is need also to study the entire handicraft sector and to generate statistics on employment, the type of employment whether seasonal, full-time or part-time, production training and skill acquisition. There is also the need to carry out product specific researches on handicrafts and to identify factors limiting the expansion of exports in each particular product line.
129
BIBLIOGRAPHY {i1IAfrica-Carribean-Pacific-European Economic Community,|The Courier, No. 68, July-August, 1981.
Barve, A.G., The Foreign Trade of Kenya, Transafrica Press, Nairobi, 1984.
Benjamin, M.R., "Handicrafts Export Marketing". Report to the Kenya External Trade Authority, Nairobi 1977.
______________, "Market Development and Developmentof Export Industries". Report to the Kenya External Trade Authority, Nairobi 1982.
Cateora, P., International Marketing,Richard, D. Irwin, ftomewood, 1971.
Centrum tot Bevordering Van de Import uit Ontwikkelingslanden (Centre for the Promotion of imports from Developing
Countries), The Market for Handicrafts in the Netherlands, CBI, Rotterdam, 1985.
Chesaro, L.T., "A Dissertation on Handicraft Marketing Activities of Women in Kikuyu Division of Kiambu District". Dissertation,Diploma of Education, University of Nairobi, 1981.
Department of External Trade, "Kenya Export News".Journal of the Kenya External Trade Authority, Nairobi, various Issues.

130
Fayerweather, D., International Marketing, Prentice- Hall, Engelwood Cliffs, 1970.
l!Freeman, D.B., Rural Enterprise in Kenya. Research
Paper No. 214, University of Chicago, 1985.
Glover, F.J., The International Trade Centre UNCTAD/GATT1964-1984, ITC UNCTAD/GATT, Geneva, 1984.
Hakemulder, R., "Potters: A Study of Two Villages inEthiopia". United Nations Economic Commission for Africa, Addis Ababo, 1980.
Hirsch, S., The Export Performance of Six Manufacturing Industries, Praeger, New York, 1972.
)Ho Y.M. and Huddle D., "Traditional and Small Scale
Cultural Goods in International Trade and Employment", Paper No. 35, Rice University, Houston, 1972.
Hodges, T.M., Selling in the Export Market, Sir Pitman and Sons Limited, London, 1967.
Institute of Adult Education, A Survey of Handicrafts In North-East District, Technical Paper No. 4, Institute of Adult Education,Botswana, 1980.

131
i!International Labour Office, Report to the Government
of Jordan on the Development of Handicrafts, ILO, Geneva, 1958.
______________________, Report to the Government ofThailand on Handicrafts Training in Chacho- Engsao Pilot Project, ILO, Geneva, 1960.
International Trade Centre UNCTAD/GATT, HandicraftsMarketing, ITC UNCTAD/GATT, Geneva, 1971.
______________ , Export Financing, ITC UNCTAD/GATT,Geneva, 1974.
Lemmers, A. and Hoenns, J., New Handicrafts in Developing Countries, Centrum tot Bevordering Van de Import uit Ontwikkelingslanden (CBI), Rotterdam, 1985.
LLyold, P.J., International Trade Problems of Small Nations, Durham N.C., Duke U.P., 1968.
Lwanga, C.G.M., "Export Marketing Research for Africa:The Kenyan Experience", MBA Thesis,University of Nairobi, 1980.
Malumo, S., Introduction to Marketing in Africa,MacMillan Publishers, London, 1986.
Moore, J.M., Mini Regression: A Small Computer Program for Performing Multiple Regression Analysis,
-'-Community and Family Centre, University of Chicago, 1974.
132
Mueller, J.H., Statistical Reasoning in Sociology,t
Houghton Mifflin Company, Boston 1970.
Organization of African Unity, "Workmaship of Handicrafts and Small-scale Industries Development for Women in Franco-Phone Countries".OAU, Addis Ababa, 1976.
Pearce, D.W., The Dictionary of Modern Economcis, MacMillan Press, London, 1983.
Porter, R.C., "Some Doubts About Kenya's Future asan Exporter of Manufactures", Discussion Paper No. 177, Institute for Development Studies, University of Nairobi, 1973.
Pye, E.A., "Handicraft Industries in the EconomicDevelopment Process in Asia". International Development Research Centre, Singapore, 1983.
_________ , "Artisan Inudstries in Asia: RegionalComparisons and Trends". International Development Research Centre, Singapore,1986.
Republic of Kenya, Development Plan, 1979-1983,Government Printer, Nairobi 1979.
______________ , Development Plan, 1984-1988, GovernmentPrinter, Nairobi, 1984.

133
Republic
Shapiro,
Schadler,
The Kenya
Wells, L.
Wonnacot,
of Kenya, Sessional Paper No. 1 of 1986 on Economic Management for Renewed Growth, Government Printer, Nairobi, 1986.
S. J. (ed), Marketing Management Harper andRow Publishers, New York, 1974.
K., Crafts, Small-Scale Industries and Industrial Education in Tanzania,Weltttforum Verlag, Munchen, 1968.
Export Promotion Council, "Survey of Kenya Exporters: Their Markets Problems and Potential", Nairobi, 1972.
r., (ed.),1 Product Life Cycle and International Trade, School of Business Administration, Harvard University, 1972.
T. M., Introductory Statistics, John Wiley and Sons, New York, 1972.

134 -
APPENDICES
APPENDIX I : CERTIFICATE OF ORIGIN
1. Good* consigned from (Exporter's box inass nams, ed- dress, country)
S. Goods consigned to (Consigrtss's name, addrsat, country)
S. Meant of transport and routa (as far as known)
S. ft amnum-bar
Reference No ' "
GENERALISED SYSTEM OF PREFERENCES
CERTIFICATE OF ORIGIN (Combinad dadaratlon and certificate)
FORM A
Issued i n _______ __ __________(country)
S M N 0 t» S O v * r l« » f
4. For official usa
4- Marks and numbers of padtagaa
7. Number and kind of packages; description of goods
11.It is hereby qertified, or the bans of control carried out, that the declaration by the exporter is correct.
Fisc* sad Sets, tipnarurs end clsnp 01 CSrtib'rs anth#rity
A Origin criterion (aaa Notes overleaf)
Groat
or othar quantity
IS. Number and dataof invoice
12. Declaration by the exporter
The undersigned hereby declarer that the above details and statements ere correct; that all the good, w. „ ptoduced in
(csvnlryland that they comply «.th the origin r.quiremenls specified for those goods in the Generalised System of Preferences for goods sxportod to
(im p ortin g eou iti^ j
Pl»c* and da*« snslu/s of auMtorisad si

135
APPENDIX I CONTD.
APPLICATION FOR CERTIFICATE OP OftKMN Pon* B
The undersigned, being the exporter of the good* described overleaf, D ECLAR ES that theae good*were produced in ................. .... ........................................................................ (country)
SP ECIFIES a* follow* the ground* on which the good* are claimed to comply with G S P oirigin requirements')
SU BM ITS the following aupporting document*7)
U N D E R TA K E S to submit, at the request of the appropriate authorities of the exporting country, any additional supporting evidencp which these authorities may require for the purpose of issuing a certificate of origin, and undertakes, if required, to agree to any inspection of his accounts and any check on the processes of manufacture of the above goods, carried out by the said authorities. R E Q U E S TS the iasue of a certificate of origin for these goods.
1Place and date .... ..... ...............................
(signature ol authorized signatory)
‘I To be completed if materials or components originating in another country have been used in the manufacture of the goods in question. Indicate the materials or components used, their Brussels N o menclature tariff heading, their country of origin and, where appropriate, the manufacturing processes qualifying the goods as originating in the country of manufacture (application of List B or of the special conditions laid down in List A ), the goods produced and their Brussels Nomenclature tariff heading.W here the origin criteria involve a percentage value, give information enabling this percentage to be verified — for example the value of imported materials and components and those of undetermined origin and the ex-factory price of the exported goods, where applicable
') Por example import documents, invoices, etc., relating to the materials or components used.
NOTESA. Procedure for claiming preference. A declaration on the certificate of origin form must be prepared
by th* exporter of the goods and submitted in duplicate, together with a G S P application form, to the certifying authority of the country of exportation which will, if satisfied, certify the top copy of the certificate of origin and return It to the exporter for transmission to the importer in the country of destination. TH* certifying authority will at the same time return to the exporter to ' his retention the duplicate copy of th* certificate of origin, but will itself retain th* G S P application form duly completed and signed by the exporter.
B. Sanctions. Persons who furnish, or cause to be furnished, information which relates to origin or consignment, and which is untrue in a material particular are liable to legal penal’ ies and to the suspension of facilities for their goods to obtain preference.

136 -
APPENDIX I CONTD.
APPLICATION FOR A MOVEMENT CERTIFICATE1. Exporter (Nam e, full address, country) EUR. 1 A
See notes overleaf before completing this form
.V Consignee (Nam e, full address, country) (O ptional)
2. Application for a certificate to be used In preferential trndc between
and
(insert appropriate countries, groups ofcountricsor territories!
4. Country, group of countries or territory in which the products are considered as oo'ginating
5. Country, Rroup of countries or territory of destination
6. Transport details (Optional) 7. Remarks
R. Item number; marks and numbcrs/Number and kind of packages*; description of goods 9. Gross weight (kg.) or other measure (litres, cu. m., etc.)
10. Invoices (Optional)

137
APPENDIX I CONTD.
N O T E S
1 Countries which accept this p u rp o tn of the G w w iU s e d System Of Preferences (GSP1)Austialia Norway European Economic Community: IrelandAustria Sweden Belgium ItalyCanada Switzerland Denmark LuxembourgFinland United Stales of America France NetherlandsJ*P*n Federal Republic ol Germany United KingdomDetails of the rules governing admission to GSP in these counlr-es are obtainable from the Customs authorities there The main elements of the rules are indicated in the following paragraphs.
2 Conditions. The main conditions for admission to preference are that goods sent to any of the countries listed above(i) must fall within a description of goods eligible lor preference in the country of destination, and
(ii) muet comply with the consignment conditions specified by the country of destination. In general, goods must be consigned direct from the country of exportation to the country of destination, but in most cases passage through one or more intermediate countries, with or without transhipment, is accepted provided that at the time they are exported the goods are clearly intended for the decia'cc country of destination and that any intermediate transit, transhipment or temporary warehousing arises only from the requirements of transportation; and
(iii) must comply with tha origin criteria specified for those goods by the country of destination. A summary indication of the rules generally applicable Is given in paragraphs 3 and 4
> Ortglfi Criteria. For exports to the above-mentioned countries, with the exception ol Australia* Canada and the USA, the position is that either
(i) the goods shaU be wholly produced in the country ol exportation, that is, they should fell within s description of goods which is accepted as "wholly produced" under the rules prescribed by the country of destination concerned or
(ii) alternatively, if tha goods are manufactured wholly or partly from materials or components Imported into the country of exportation or of undetermined origin these materials or components must have undergone a substantial transformation there into a different
Kroduct. It-is important to note that all materials and components which cannot be shown to be of that country's origin must • treated as. if they were imported. Usually the transformation must be such as to lead to the exported goods being classified
under a Customs Co-operation Council Nomenclature Tariff heading other than that relating to any of the above materials or components used. In addition, special rules are prescribed lor various classes of goods in Lists A and B of certain countries' rules of origin and othar subsidiary provisions and these should be carefully studied.
If the goods qualify under the above criteria, the exporter must indicate in Box 8 of the form the origin criteria on the basis of which ha claims that his goods qualify for the GSP, in the manner shown in the following table:
Circumstances o» production or manufacture in the first country named in Box 12 of the form
Insert in Box 8
(a) Goods, worked upon but not wholly produced in the exporting country, which were produced in conformity with the principles of pare 3 (ii). which fall under a C C C Nomenclature tariff heading specified in Column 1 of List A and which satisfy any conditions in Columns 3 snd 4 of List A which are relevant to these goods.
-A », followed by the Customs Co-operation Council Nomenclature heading number of the exported goods
example: -A - 74 07
(b) Goods, worked upon but not wholly produced In the exporting country, which fall within an item in Column 1 of List B and which comply with the provisions of that Item
-B -, followed by the Customs Co-operation Council Nomenclature heading number of the exported goods
example: -B -73.15
(c) Goods, worked upon but not wholly produced In the exporting country, which were produced In conformity with principles' of para. 3 (ii), which are not specifically referred to in List A, and which do not contravene a general provision of List A )
•X», followed by the Customs Co-operation Council Nomenclature heeding number of the exported goods
example:98 02
(d) Goods wholly produced In the country of exportation (see para. 3 (i) above)
-P -
NO TE "List A " and "List B " refer to the lists of qualifying processes specified by the countries of importation concerned.
4. Origin criteria for exports to Canada and the United States of America. For export to these two countries the position is that either(i) the goods shiTTl>e wholly produced in the country o f exportation that is they should fail within s description of goods which is
accepted at "wholly produced" under the rules prescribed by the country of destination concerned, or(ii) alternatively. If the goods ere manufactured wholly or partly from materials or components imported into the country of exportation
or of undetermined origin, those materials or components must have undergone a substantial transformation there into a differentproduct. It is important to note that all materials end components which cannot be shown to be of that country's origin must betreated at If they were Imported(e) In the case of Canada the value of such materials and components (excluding any that ere of Canadian origin) must,not
exceed 40 per cent of the ex-factory price of the exported article(b) In the case of the United States the cost or value of materials produced in th# beneficiary country plus the direct coat of
processing performed there, should not be less then 35 per cent lor tingle countries, or 50 per cent, when an association of countries is treated at one country, of the appraised value of si*h article at the time of its entry into the U.S. Materials Imported into the beneficiary country and then substantially transformed into constituent materials of which the eligible article is composed may be included In calculating the minimum percentages The phrase "direct cost of processing" includes coats directly Incurred or reasonably allocated the the processing, such as all actual labor costs; dies, molds, tooling, end depreciation; research end development, inspection end testing, but does not include business overhead, administrative expenses end salaries, or profit. *
If the goods qualify under the above criteria, the exporter must indicate in Box 8 of the forfn the origin criteria on the basis of which he claims that hie goods qualify for the GSP. in the manner shown in the following table.
Countries Applicable Clrcumstancas of production or manufacture in the first country named in Box 12 of the form
Insert in Box 8
Canada end United States
(a) Goods wholly produced In the country of exportation (see pare. 4 (i) above)
•P.
Canada (b) Goods which are covered by the value added rule described in pare. 4 (Ii) (a) above
«Y>, followed by th# value of materials and components Imported (excluding any that are of Canadian origin) or of undetermined origin, expressed as a percentage of the ex-factoryprice of the expoied goods example: «Y»
36 V.
United Staatee c) Goods which are covered by the value added rule described In pare. 4 (II) (b) above
For singlt country shipments insert «Y» or for shipments from an association of countries •Z». followed by the sum of the cost or value of the materials and the direct cost of processing, expressed as a percentage of the ex-factory price of the exported goods example: «Y » 36 V. or
•Z- S3 •/•
5 iireh article wnuet qualify, it should be noted that aft tha goods irf a consignment must qualify separately in their own right. This is of particular relevance when elmilar articles of different eize« or spare parts are aant.
• Description of goods. Tha daacription of goods must ba sufficiently detailed to anabla tha goods to ba Identified by tha Customs “OMTcer examining ihem.
* For Australia, mam raquirement la axportar'a declaration on normal commarciai invoice Form A ia an acceptable alternative, but official certification is not required. Direct consignment ia not necessary.
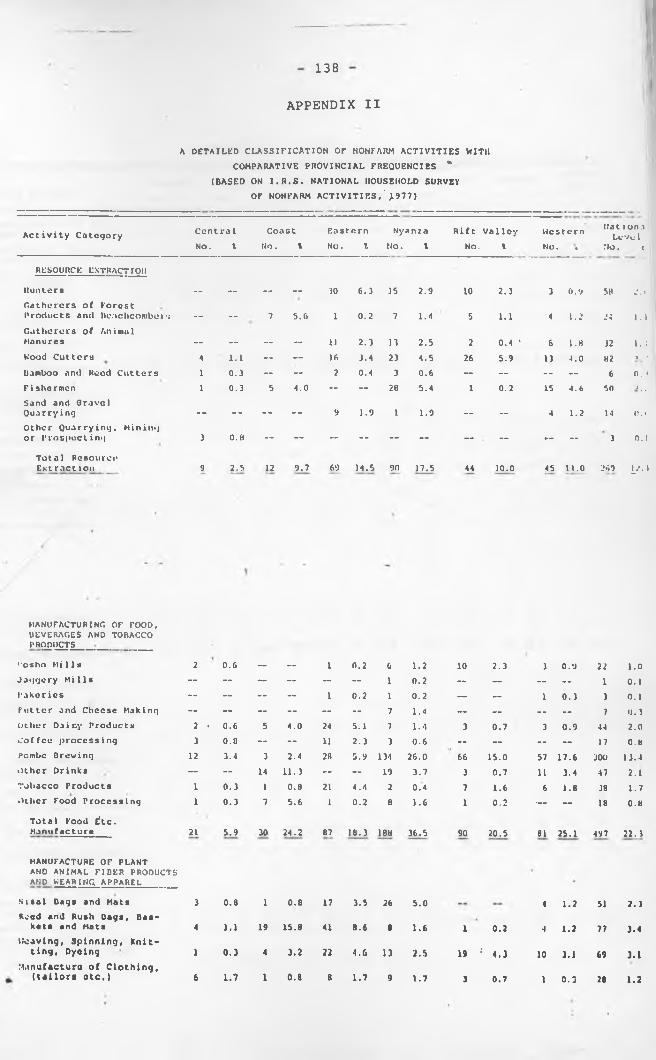
138
APPENDIX II
A D E T A I L E D C L A S S I F I C A T I O N O F N O N F A R M A C T I V I T I E S W I T H C O M P A R A T I V E P R O V I N C I A L F R E Q U E N C I E S *
(BASED O N I.R.S. N A T I O N A L H O U S E H O L D SURV E Y O F N O N F A R M A C T I V I T I E S , ’ 1977)
A c t i v i t y C a t e g o r y C o n t r o l C o a s t E a s t e r n N y a n z a Rift V a l l e y W e s t e r n (.'at ion a Level
NO. t Ho. l No. l NO. l No. l No. • No. t
R E S O U R C E E X T R A C T I O N
Hunters 30 6.3 15 2.9 10 2.3 3 O.V 5H 2. iG a t h e r e r s of Forest P roducts and B e a c h c o m b e r s __ __ 7 5.6 1 0.2 7 1.4 5 1.1 4 1.2 24 1.1G a t h e r e r s of Animal M a n u r e s 11 2.3 13 2.5 2 0.4 ‘ 6 l.H 32 1.4W ood C u t t e r s 4 i.i — — 16 3.4 23 4.5 26 5.9 13 4.0 82 ■» *
Bam b o o and Reed C u t t e r s i 0.3 — — 2 0.4 3 0.6 — — — — 6 0. «F i s h e r m e n 1 0.3 5 4.0 — — 28 5.4 1 0.2 15 4.6 50 i _ _
Sand and Gravel Q u a r r y i n g 9 1.9 1 1.9 — _ 4 1.2 14 O.i,O t her Q u a r r y i n g , M i n i n g or P r o s p e c t i n g 3 0.8 — — 3 0.1
Total R esource Ex t r a c t i o n 9 2.5 12 9.7 69 14.5 90 17,5 44 10.0 45 11.0 269 L«*. i
M A N U F A C T U R I N G OF FOOD, B E V E R A G E S A N D T O B A C C O P R ODUCTS
,%o s h o Mills 2 0.6 — — 1 0.2 6 1.2 10 2.3 3 0.9 22 1.0J a g g e r y Mills i 0.2 — ~ — — i 0.1Pak o r i c s 1 0.2 i 0.2 — — 1 0.3 3 0.1Putt e r and C h e e s e M a k i n g 7 1.4 — — — — 7 0. 3O t h e r Dair.y Products 2 ■ 0.6 5 4.0 24 5.1 7 1.4 3 0.7 3 0.9 44 2.0C o f f e e p r o c e s s i n g 3 0.8 — — ii 2.3 3 0.6 — — — — 17 o.bPombe D rowing 12 3.4 3 2.4 28 5.9 134 26.0 66 15.0 57 17.6 300 13.4• >lhcr Drinks — — 14 11.3 — — 19 3.7 3 0.7 11 3.4 47 2.1T o b a c c o Products 1 0.3 1 0.8 21 4.4 2 0.4 7 1.6 6 1.8 38 1.7either Food Pr o c e s s i n g 1 0.3 7 5.6 1 0.2 8 ) .6 i 0.2 — — 18 0.8
Total F ood £tc. M a n u f a c t u r e 21 5.9 30 24.2 87 18.3 188 36.5 90 20.5 81 25.1 497 22. 1
M A N U F A C T U R E O F PLA N T AND A N I M A L F I B E R P R O D U C T S A N D W E A R I N G A P P A R E L
Sisal Dags and Mats 3 0.8 1 0.8 17 3.5 26 5.0 4 1.2 51 2. JReed and Rush Dags, B as-
k.ts and M at. 4 1.1 19 15.8 41 8.6 8 1.6 1 0.2 4 1.2 77 3.4Weaving, Spinning, K n i t
ting, Dyolng i 0.3 4 3.2 22 4.6 13 2.5 19 1 4.3 10 3.1 69 3.1M a n u f a c t u r e of C l o thing,
(tailora otc.) 6 1.7 1 0.8 8 1.7 9 1.7 3 0.7 1 0.3 28 1.2

A P P E N D I X I I cont
A c t i v i t y C a t e g o r yC e n t r a lNo, %
C o ast No. 1
E a s t e r nNo. 1
Nya n i aN o . t
Rift V a l l e y No. t
W e s t e r nNo. %
N ational Lo vol
>IO. 1
D e a d w o r k N e c k l a c e s and O t h e r J e w e l r y
>i 0.2 5 i.i 6 0.3
P r e p a r a t i o n of S h e e p skins and G o a t s k i n s _ _ _ _ _ __ 2 0.4 3 0.6 26 5.9 i 0.3 32 1.4
L e a t h e r w o r k i n g (belts, bags, harness) — _ 1 0.8 _ _ i 0.2 4 0.9 i 0. 3 7 0.3
Shoes i 0.3 — — 2 0.4 i 0.2 — — i 0.1 5 0.2O t h u r A n i m a l S k i n
p r o d u c t s 2 0.4 — — ____ — 2 0.1
T o tal M a n u f a c t u r e of P l ant l A n i m a l F i b e r etc. 15 4.2 26 21.0 93 19.6 63 12.2 58 13.2 22 6.8 277 12.4
M A N U F A C T U R E O F W O O DP R O D U C T S
S a w m i 1 1 s 6 1.7 1 0.2 4 0.8 2 0.4 1 0.3 14 0.6C h a r c o a l M a k i n g 24 6.7 2 1.6 34 7.2 31 6.0 32 7.3 13 ■ 4.0 : ut' 6.1B u i l d i n g Poles i 0.3 i 0.8 10 2.1 10 1.9 4 0.9 3 0.9 29 l. JFu r n i t u r e 7 2.0 i 0.8 6 1.3 7 1.4 4 0.9 8 2.5 3) 1.6W o o d C a r v i n g s — — 2 1.6 6 1.3 — — — — — — 8 0.4W o o d e n H a n d l e s for
Tools, etc. 2 0.6 2 1.6 5 1.0 4 0.8 _ „ 9 2.8 22 1.0O t h e r W o o d P r o d u c t s 5 1.0 i 0.2 — — — — 6 0.1
• 1'
G o u r d s and C a l a b a s h e s 1 0.3 — — 14 3.0 30 5.8 7 1.6 9 2.8 61 2.7
C o n t a i n e r s and C r a t e s 1 0.3 — 2 0.6 3 0.1
Total W o o d M a n u f a c t u r e 42 11.8 8 6.4 81 17.0 87 16.9 49 11.2 45 14.0 312 14.0
POT T E R Y P R O D U C T S
P o t t e r y Plates, Bowls, Pots, etc. — — 1 0.8 5 1.0 28 5.4 1 0.2 3 0.9 38 1.7
Total__Pot t e r v — — 1 0.8 5 l._0 28 5.4 i 0.2 3 0.9 38 1_.7.
M A N U F A C T U R E O F M E T A L P R O D U C T S ,
lllacksmith 2 0.6 1 0.8 — — 2 0.4 - — i 0.3 6 0. 3
F arm I m p l ements and T o ols 1 0.2 1 0.2 — " i 0.3 3 0.1
H o u s e h o l d U t e n s i l s (Jikos, Pans, etc.) 4 i.i — — 4 0.8 5 1.0 3 0.7 2 0.6 18 0.8
Total Metal M a n u f a c t u r e 6 1.7 0.8 5 1.0 8 1.6 3 ■ <L2 4 1.2 27 1.2
C O N S T R U C T I O N
M a n u f a c t u r e of C e m e n t Dloc k s 2 0.4 6 1.2 — — — — 8 0.4
S t o n e B u i l d i n g Blo c k s 2 0.6 i 0.8 4 0.8 6 1.2 2 0.4 2 0.6 17 0.8
O t h e r B u i l d i n g Materi a l s , c.g. H ard Core, Bricks, etc. 1 0.3 23 4.8 8 1.6 5 1.5 37 l.C

140
A P P E N D I X I I cost.
A c t i v i t y C a t e g o r y C o n t r a l C o nst E a s t e r n N y a n z a Rift V a l l e y W o s t o r n ' ^ V v o 1*1No. % No. \ No. \ No. . % NO. % NO. t Mo. l
fltiililimi a n d C o n s t r u c t i o n — — 2 1.6 16 3.4 15 2.9 2 0.4 8 2.5 43 1.9
Tot.i) C o n s t m e t ion
WIliX.CSAl.K A N D R K T A 1 L T H A O INC,
Wh o l e s a l e T r o d liu) 4 1.1 2 0.4 7 1.4 n 0.6Agents (Selling on
t’oir.ini ssion) i 0.3 2 1.6 ___ ___ 7 1.4 _ _ » 0.3 n 0.5C l o t h i n g V o n J o r s 3 0.8 — — 2 0.4 5 1.0 1 0.2 -- — n 0.5Dui.is ( C o n e m l Retailors) 12 3.4 1 0.8 19 4.0 20 3.8 14 3.2 16 5.0 82 1.7fa tellers 4 i.i 1 0.8 9 1.9 11 2.1 9 2.0 8 2.5 42 1.9S p e c i a l i z e d Rutoil S t o r e s — — 1 0.8 — — — — 1 0.1iviiol S t a t i o n s \ 1 0.2 — — — — — .. 1 0.1llavkcrs and I t i nerant •
Ven d o r s i •0.3 2 1.6 1 0.2 8 1.6 2 0.4 9 2.8 *23 • 1.0Dea l e r s in S e c o n d h a n d
G o o d s / J u n k i 0.3 __ _ 2 0.4 4 0.8 __ __ 2 0.6 9 0.4R e t ailimi o r Sel l i n g — — i 0.8 2 0.4 8 1.6 — -- 3 0.9 14 0.6
T»>t .11 W h o l o s a l c / R o t a i l_
4
26 7.3 8 6.4 30 8.0 70 13.7 26 SJ> 39 12.1 207 'Ll
R E P A I R I N G
liicyclc R e p a i r
V
2 1.6 6 1.3 6 1.2 2 0.4 1 .0.3 17 0.8
Motor C a r and T r uck Itepai rs 2 0.6 — — 2 0.4 7 1.4 1 0.2 4 1.2 16 0.7
Repair of O t h e r V e h i c l e s 2 0.4 2 0.4 — — — 4 0.2
E arn M a c h i n e r y and Tool Repairs 1 0.3 — — 2 0.4 — — — — — — i 0.1
H o u s e h o l d Utensil Rep a i r s -- — 1 0.8 2 0.4 — 1 0.2 2 0.6 6 0.1
fu r n i t u r e Repairs 3 0.8 — -- 9 1.9 11 2.1 2 0.4 3 0.9 28 1.2Shoes and F o o t w e a r Rep a i r s - - 1 0.8 9 1.9 6 1.2 1 0.2 5 1.5 22 1.0C l o t h i n g Rep a i r s and
Men d i n g 5 1.4 — — 7 1.5 13 2.5 4 0.9 3 0.9 32 r.4Other R e p a i r i n g and
Re n o v a t i n g 1 0.2 — — 2 0.6 3 0.1
Total Re p a i r i n g 11 3.1 4 3.2 39 8.2 46 8.9 ii 2.5 20 6.2 131 5.4
SERVICES!T R A N S P O R T , S T O R A G E A N DC O M M U N I C A T I O N
C o u n t r y Dus O p e r a t o r s 1 0.2 1 0.2 2 0 . 1
M a t a t u T axi O p a r a t o r a 7 2.0 — — S 1 . 0 2 0.4 3 0.7 5 1.5 22 1 . 0
Wat e r C a r r i e r s 2 0.6 — — • 18 3.7 1 0.2 — — 1 0.3 22 1 . 0
Truck t L o r r y O p e r a t o r s 4 1.1 — “ 6 1.3 - - — 3 0.7 2 0.6 15 0.7
Other T r a n s p o r t O p e r a t o r s 2 0.6 — — 2 0.4 — — • 4 0.9 6 1.8 14 0 . 6
M e s s e n g e r S e r v i c e s — — 4 3.2 — — 5 1 . 0 5 1.1 — — 14 0 6

141
A P P E N D I X I I • w r -
A c t i v i t y C a t e g o r y C o n t r a l C o n s t
— — — — — — — No. i NO. 1
S t o r a g e for A g r i c u l t u r a l o r O t h e r P r o d u c e
Total Trnnsi>ort etc. 15 4.3 4 3.2
S E R VICESlA C C O M M O D A T I O N , F O O D A N D jlEVERAC.E S E R V I C E S
C.ii’c u , H o s u i m n t sroo.l Kio:;ku l . i.i __ __Hi m * R o a s t e r s 2 0.6 __ __;Kur. •1 1.1 __ _Mot** 1 s 3 0.8 ___ ___
:<o.l;in*j or B o a r d i n g lloivs , 1 0.3 ___ _
_^ccoiwi©d«it ion utc. 3.9 — __
SE R VICES:F I N A N C I A L I N S U R A N C E A N D H U S !N E SS S E RVIC E S
.Money L e n d e r s ', 2 0 6•'entinq of G o o d s t E q u i p
ment
E a s t e r n NO. 1
NyanzaNo. \
R ift V a l l e y NO. t
Wot tornNo. \
N a t i o n a l Level
No. \
2 0.4 __ __ i 0.3 3 0.132 6J> 11 2.2 15 3 J 15 4.5 92 ■1.1
1 0.2 — — -- — — - - 1 0.12 0.4 14 2.7 2 0.4 1 0.3 23 1.07 1.5 1 0.2 l 0.2 2 0.6 1 l 0.612 2.5 3 0.6 1 0.2 2 0.6 22 1.021 4.4 5 1.0 4 0.9 2 0.6 15 l.l»
5 1.0 1 0.2 — — — — 7 0. J48 10.0 24 4.7 8 1.7 7 2.1 jiih . 4.0
2 0.4 - - — 6 0. 3
0.2 1 0.2 . . — — 2 0 . 1
1
Let t e r W r i t e r s 1 0.3 — — 1 0.2 - — 2 0.4 . . 4 0.2•*r*»ns 1 a tors — — 11 fl.O " — 2 0.4 - - - — 13 0.(,
Total F i n ancial etc. 3 0.9 13 10.5 2 0.4 5 1.0 2 0.4 11 — 25 1.2
SLIUMCrS:C O M M U N I T Y , S O C I A L ANDm qriAL. s i .h v i c k s
f .luc.it ion.il S e r v i c e s — — 1 0.8 4 0.8 — — 1 0.2 1 0.3 7 0.1V.wlwi von — — 1 0.8 5 1.0 — — 1 0.2 1 n. i H 0.41 i n i c s 1 0.2 1 0.2 3 0.7 __ __ 5 0.2.'radii tonal H e a l e r s — — 6 4.8 12 2.5 21 4.1 2 0.4 6 1.8 47 2.1*I'i'St e x t e r m i n a t o r s 2 0.4 — — — — _ __ 2 0. 1'Mdt; (takers — — 2 1.6 6 1.3 2 014 1 0.2 i 0. 3 12 0.5A m e e r s , E n t e r t a i n e r s 2 0.6 1 0.8 1 0.2 3 0.6 13 3.0 2 0.6 22 1.0Lau n d r y (Cleaners) — — 1 0.8 — — 3 0.6 _ • __ 4 0.23 i r b e r s / H a i r d r e s s e r s 1 0.2 3 0 9.Viooshino S e r v i c e s 2 0.4 — — 2 0. 1A s t r o l o g e r s — — 1 0.8 — — 2 0.6 3 0. 1
Total C o m m u n i t y etc. 2 0.6 13 10.4 33 6.8 30 5.9 22 4,8O t h e r S e r v i c e s n 4.8 1 0.8 9 L 2 4 0.8 1 0.2 31 9.6 61 2.8Total S e r v i c e s 51 14.3 31_ 25.0 124 26.2 74 lie ? 48 '10.9 69 2J._4 397 17.8

A P P E N D I X I I c o n t .
A c t i v i t y C a t e g o r y . Cen t r a l
No. %
C o a s t E a s t e r n N y a n z aNo. % No. % No. %
Rift V a l l e yNo. \
W e s t e r n
Mo. I
N a t i o n a 1 Level
Mo. I
T O T A L A L L C A T E G O R I E S 184 * -12G * 506 # 689 * 334 * 343 • 7260
• Docs not sum to I00\ duo to multiple occurrences of activites in some household*;.
\ Occurrences as percent of households.
IhlTKi The following activity categories employed in l.l»e original survey were found to contain zero frequcn.'ic-.i in all provinces! I.ime making; Tarpaulins. Tents and Canvas U kxIhj hags and Sacks for Maize and Produce; other Ornament t. and Apparel; Class Products; Carved Kisii Stone Ware; Other Metal Products; Dealers in Automobile Spare Paits; Other Machinery Repairs; Maize Itoasturs; Other Financial or llusinens Services.
Source: Freeman, D.BV and Norcliffe, G.B. RuralEnterprise in Kenya, Research Paper No.214 University of Chicago, 1985.

143
QUESTIONNAIRE FOR HANDICRAFT EXPORTERS
EXPORT MARKETING OF HANDICRAFTS
A. GENERAL INFORMATION
1. (a) Name of establishment? _(b) Location of establishment?________________
2. Position of respondent in the firm?___________ ____3. For how long has the firm been exporting
handicrafts? _______________________________ ______4. What is the nature of ownership?
fl Joint stock company p individual trader
□ partnership p other (specify)
5. What other business besides exporting handicraftsdo you operate?
APPENDIX III
6. (a) What were the major problems you faced whilestarting the business of exporting handicrafts?
(b) How did you try to overcome those problems?
144
7. Name the types of handicrafts exported (in order of importance)
8. How were you able to obtain the initial export order?
9. Currently, how do you obtain your export orders?
10. How do you export your handicrafts
□ Directly to importers
O Indirectly through export agents
□ Other (specify)
11. From which sources do you obtain your handicrafts?
□ Buying agents □ Co-operatives
□ Producers □ Other (specify)
12. Do you produce some of the handicrafts youexport? _________________________________________(b) Explain why ________________________________
What are the purchasing arrangements with the different sources?
13.

145
14. In terms of the handicrafts bought, are theyof good quality? ________________________________
Are they adequate in quantity? __________________Do the supplies arrive on time?___________________Do the suppliers meet order specifications on colour, design, shape and size? _________________
15. If the handicrafts sent to you an order do not meet your specifications, what do you do? Explain.
16. How do you ensure that your suppliers supply you with what you want?
17. What efforts do you make to ensure that you receive handicrafts on time?

146
B. EXPORT MARKETING
18. Listing in descending order of importance, which countries form your export market destinations?
19. (a) What has been the behaviour of your exportrevenues from the different handicrafts for the last five years?
(b) Provide reasons for any observed changes.
20. Do the prices you charge on the handicrafts covertransportation charges or does the importer take care of the transportation costs? _______________
21. Are there specific problems experienced with regard to packaging and transportation of handicrafts?
22. How do you price your export?

147
(b) What are your terms of payment?
23. Are all handicrafts available all year round?
24. (a) Do you have any special sales staff orsection dealing with overseas sales of handicrafts? ___________________________________
(b) How much on average does it cost you per year to maintain the staff and/or the sectionKshs.___________________________________ _________
(c) How much did it cost you last year to maintain the staff and/or the section?Kshs.____________________________________________1
25. (a) Do you carry out promotional activities (e.g.advertising, catalogs, exhibitions, promotional tours and shows) in order to boost your sales abroad? _____________________________
(b) If yes, specify the type of promotional activities you undertake _______________
(c) How much money on average do you set aside forthe purpose of carrying out these activities? Kshs.____________________________________________
(d) How much did you spend last year on promotional activities? Kshs.

148
26. (a) Do you export handicrafts just the same waythey are received from the suppliers?
(b) If you undertake quality and design improvement on the handicrafts you export, how much (including labour and materials) does it cost you per year. Kshs.____________________________
(c) How much did you spend last year on improving the quality of handicrafts and also on design. Kshs. _________________________________
27. (a) Do you attempt in any way to obtain marketinformation about foreign tastes and needs with regard to handicrafts? __________________
(b) How do you go about this?
(c) How much per year do you spend on obtaining and analysing such market information?Kshs. ___________________________________________
(d) How much did you spend last year on this.Kshs.____________________________________________
What is your evaluation of the results of your marketing efforts (i.e. market research, promotion, product improvement, design etc). _________________
28.
Do you find it necessary to spend
□ more Q less
£□ the same Q nothing
□ on boosting overseas sales?
What are currently the major problems limitingy.ou from realising as much revenue as possible from handicraft exports.
Has the firm participated in KETA sponsored trade fairs, exhibitions and courses ___________________
If yes, how many fairs and exhibitions have you attended?
NAME THE ACTIVITY DATE COUNTRY
1.
2 . /3.
4.
(a) Is KETA able to furnish you with all thenecessary help you may require, in the course of your export business? ______________________
in rlTV OF NAIROBI

150
(b) What comments do you make about KETA.
33. What other official or institutional support(e.g. from embassies, organizations etc) do you receive?
34. (a) Do you participate in joint marketing effortwith other handicraft exporters?
(b) Do you think that you would be able to benefit more by carrying out joint marketing activities with other handicrafts?Explain. ________________________________________
35. (a) How much on average do you realise fromhandicraft exports per year?Kshs._____________________________________
(b) How much did you realise last year from handicraft export sales?Kshs.
C. INTERVIEWER'S NOTES