exponential functions using growth and decay factors
TRANSCRIPT

Exponential Functions
Using Growth and Decay Factors

Clara invests $5000 in an account that pays 6.25% interest per year. After how many years will her investment be worth $10,000?
Example 2: Economics Application
Step 1 Write a function to model the growth in value of her investment.
f(t) = a(1 + r)t Exponential growth function.
Substitute 5000 for a and 0.0625 for r.
f(t) = 5000(1 + 0.0625)t
f(t) = 5000(1.0625)t Simplify.

Example 2 Continued
Step 2 When graphing exponential functions in an appropriate domain, you may need to adjust the range a few times to show the key points of the function.
Example 2 Continued
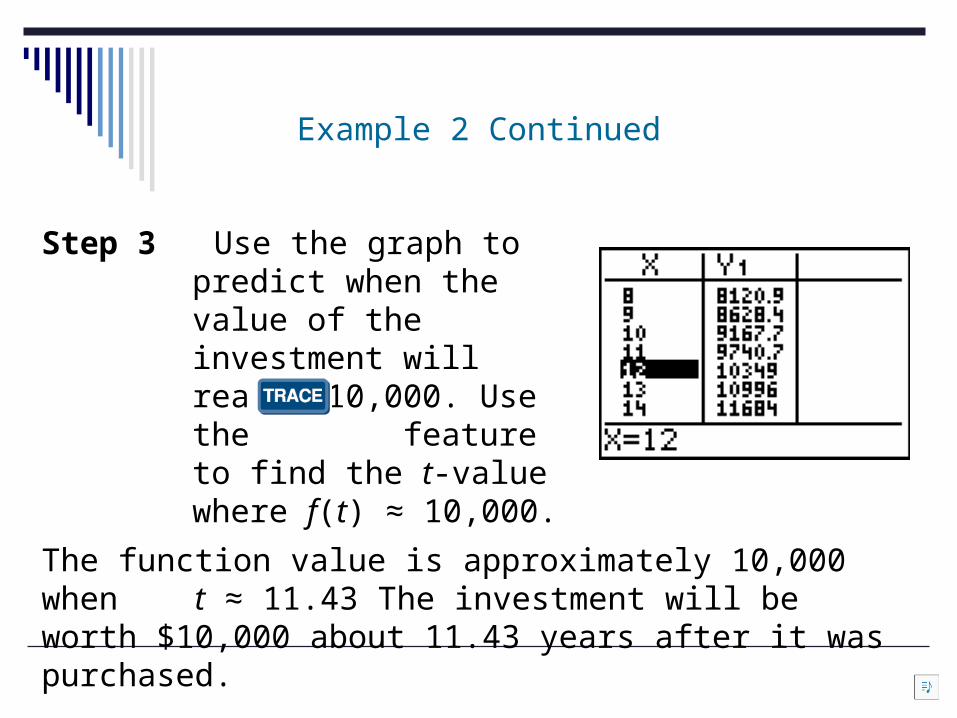
Step 3 Use the graph to predict when the value of the investment will reach $10,000. Use the feature to find the t-value where f(t) ≈ 10,000.
The function value is approximately 10,000 when t ≈ 11.43 The investment will be worth $10,000 about 11.43 years after it was purchased.

In 1981, the Australian humpback whale population was 350 and increased at a rate of 14% each year since then. Write a function to model population growth. Use a graph to predict when the population will reach 20,000.
P(t) = a(1 + r)t
Substitute 350 for a and 0.14 for r.
P(t) = 350(1 + 0.14)t
P(t) = 350(1.14)t Simplify.
Exponential growth function.
Check It Out! Example 2

Graph the function. Use to find when the population will reach 20,000.
It will take about 31 years for the population to reach 20,000.
Check It Out! Example 2 Continued

A city population, which was initially 15,500, has been dropping 3% a year. Write an exponential function and graph the function. Use the graph to predict when the population will drop below 8000.
Example 3: Depreciation Application
f(t) = a(1 – r)t
Substitute 15,500 for a and 0.03 for r.
f(t) = 15,500(1 – 0.03)t
f(t) = 15,500(0.97)t Simplify.
Exponential decay function.

Example 3 Continued
Graph the function. Use to find when the population will fall below 8000.
It will take about 22 years for the population to fall below 8000.
10,000
1500
0

A motor scooter purchased for $1000 depreciates at an annual rate of 15%. Write an exponential function and graph the function. Use the graph to predict when the value will fall below $100.
f(t) = a(1 – r)t
Substitute 1,000 for a and 0.15 for r.
f(t) = 1000(1 – 0.15)t
f(t) = 1000(0.85)t Simplify.
Exponential decay function.
Check It Out! Example 3