exploring the potential of physical visualizations
TRANSCRIPT

EXPLORING THE POTENTIAL OF
PHYSICAL VISUALIZATIONS
DISSERTATION
an der Fakultät für Mathematik, Informatik und Statistikder Ludwig-Maximilians-Universität München
eingereicht vonDiplom-Medieninformatiker
SIMON STUSAK
München, den 02. August 2016

Erstgutachter: Prof. Dr. Andreas ButzZweitgutachter: Prof. Dr. Sheelagh Carpendale
Tag der mündlichen Prüfung: 18.11.2016
Abstract
ABSTRACT
The goal of an external representation of abstract data is to provide insights and convey in-formation about the structure of the underlying data, therefore helping people execute tasksand solve problems more effectively. Apart from the popular and well-studied digital visual-ization of abstract data there are other scarcely studied perceptual channels to represent datasuch as taste, sound or haptic. My thesis focuses on the latter and explores in which wayshuman knowledge and ability to sense and interact with the physical non-digital world canbe used to enhance the way in which people analyze and explore abstract data. Emergingtechnological progress in digital fabrication allow an easy, fast and inexpensive production ofphysical objects. Machines such as laser cutters and 3D printers enable an accurate fabrica-tion of physical visualizations with different form factors as well as materials. This creates,for the first time, the opportunity to study the potential of physical visualizations in a broadrange.
The thesis starts with the description of six prototypes of physical visualizations from staticexamples to digitally augmented variations to interactive artifacts. Based on these explo-rations, three promising areas of potential for physical visualizations were identified andinvestigated in more detail: perception & memorability, communication & collaboration,and motivation & self-reflection.
The results of two studies in the area of information recall showed that participants who useda physical bar chart retained more information compared to the digital counterpart. Particu-larly facts about maximum and minimum values were be remembered more efficiently, whenthey were perceived from a physical visualization.
Two explorative studies dealt with the potential of physical visualizations regarding com-munication and collaboration. The observations revealed the importance on the design andaesthetic of physical visualizations and indicated a great potential for their utilization by au-diences with less interest in technology. The results also exposed the current limitations ofphysical visualizations, especially in contrast to their well-researched digital counterparts.
In the area of motivation we present the design and evaluation of the Activity Sculpturesproject. We conducted a field study, in which we investigated physical visualizations ofpersonal running activity. It was discovered that these sculptures generated curiosity andexperimentation regarding the personal running behavior as well as evoked social dynamicssuch as discussions and competition.
Based on the findings of the aforementioned studies this thesis concludes with two theoreti-cal contributions on the design and potential of physical visualizations. On the one hand, itproposes a conceptual framework for material representations of personal data by describinga production and consumption lens. The goal is to encourage artists and designers workingin the field of personal informatics to harness the interactive capabilities afforded by digitalfabrication and the potential of material representations. On the other hand we give a firstclassification and performance rating of physical variables including 14 dimensions grouped
iii

Abstract
into four categories. This complements the undertaking of providing researchers and de-signers with guidance and inspiration to uncover alternative strategies for representing dataphysically and building effective physical visualizations.
iv
Zusammenfassung
ZUSAMMENFASSUNG
Um aus abstrakten Daten konkrete Aussagen, komplexe Zusammenhänge oder überraschen-de Einsichten gewinnen zu können, müssen diese oftmals in eine, für den Menschen, an-schauliche Form gebracht werden. Eine weitverbreitete und gut erforschte Möglichkeitenist die Darstellung von Daten in visueller Form. Weniger erforschte Varianten sind das Ver-körpern von Daten durch Geräusche, Gerüche oder physisch ertastbare Objekte und Formen.Diese Arbeit konzentriert sich auf die letztgenannte Variante und untersucht wie die mensch-lichen Fähigkeiten mit der physischen Welt zu interagieren dafür genutzt werden können, dasAnalysieren und Explorieren von Daten zu unterstützen. Der technische Fortschritt in derdigitalen Fertigung vereinfacht und beschleunigt die Produktion von physischen Objektenund reduziert dabei deren Kosten. Lasercutter und 3D Drucker ermöglichen beispielswei-se eine maßgerechte Fertigung physischer Visualisierungen verschiedenster Ausprägungenhinsichtlich Größe und Material. Dadurch ergibt sich zum ersten Mal die Gelegenheit, dasPotenzial von physischen Visualisierungen in größerem Umfang zu erforschen.
Der erste Teil der Arbeit skizziert insgesamt sechs Prototypen physischer Visualisierungen,wobei sowohl statische Beispiele beschrieben werden, als auch Exemplare die durch digi-tal Inhalte erweitert werden oder dynamisch auf Interaktionen reagieren können. Basierendauf den Untersuchungen dieser Prototypen wurden drei vielversprechende Bereiche für dasPotenzial physischer Visualisierungen ermittelt und genauer untersucht: Wahrnehmung &Einprägsamkeit, Kommunikation & Zusammenarbeit sowie Motivation & Selbstreflexion.
Die Ergebnisse zweier Studien zur Wahrnehmung und Einprägsamkeit von Informationenzeigten, dass sich Teilnehmer mit einem physischen Balkendiagramm an deutlich mehr In-formationen erinnern konnten, als Teilnehmer, die eine digitale Visualisierung nutzten. Ins-besondere Fakten über Maximal- und Minimalwerte konnten besser im Gedächtnis behaltenwerden, wenn diese mit Hilfe einer physischen Visualisierung wahrgenommen wurden.
Zwei explorative Studien untersuchten das Potenzial von physischen Visualisierungen imBereich der Kommunikation mit Informationen sowie der Zusammenarbeit. Die Ergebnisselegten einerseits offen wie wichtig ein ausgereiftes Design und die Ästhetik von physischenVisualisierungen ist, deuteten anderseits aber auch darauf hin, dass Menschen mit gerin-gem Interesse an neuen Technologien eine interessante Zielgruppe darstellen. Die Studienoffenbarten allerdings auch die derzeitigen Grenzen von physischen Visualisierungen, ins-besondere im Vergleich zu ihren gut erforschten digitalen Pendants.
Im Bereich der Motivation und Selbstreflexion präsentieren wir die Entwicklung und Aus-wertung des Projekts Activity Sculptures. In einer Feldstudie über drei Wochen erforschtenwir physische Visualisierungen, die persönliche Laufdaten repräsentieren. Unsere Beobach-tungen und die Aussagen der Teilnehmer ließen darauf schließen, dass die Skulpturen Neu-gierde weckten und zum Experimentieren mit dem eigenen Laufverhalten einluden. Zudemkonnten soziale Dynamiken entdeckt werden, die beispielsweise durch Diskussion aber auchWettbewerbsgedanken zum Ausdruck kamen.
v

Zusammenfassung
Basierend auf den gewonnen Erkenntnissen durch die erwähnten Studien schließt diese Ar-beit mit zwei theoretischen Beiträgen, hinsichtlich des Designs und des Potenzials von physi-schen Visualisierungen, ab. Zuerst wird ein konzeptionelles Framework vorgestellt, welchesdie Möglichkeiten und den Nutzen physischer Visualisierungen von persönlichen Daten ver-anschaulicht. Für Designer und Künstler kann dies zudem als Inspirationsquelle dienen, wiedas Potenzial neuer Technologien, wie der digitalen Fabrikation, zur Darstellung persönli-cher Daten in physischer Form genutzt werden kann. Des Weiteren wird eine initiale Klas-sifizierung von physischen Variablen vorgeschlagen mit insgesamt 14 Dimensionen, welchein vier Kategorien gruppiert sind. Damit vervollständigen wir unser Ziel, Forschern undDesignern Inspiration und Orientierung zu bieten, um neuartige und effektvolle physischeVisualisierungen zu erschaffen.
vi
Disclaimer
DISCLAIMER
Publications and Own Contribution
During the past four years of my time as Ph.D. student I worked together with many col-leagues and students on various projects. To appreciate this collaboration, I decided to usethe scientific plural in this thesis. The following sections will provide further information aclear overview of my personal contribution to each of the projects.
Chapter 5 - Beyond Physical Bar ChartsThe content of this chapter is based on six main projects that, in turn, consist of six student’stheses.
Subsection 5.1.1 - Threaded Bar-Star-Plot is based on the paper “Beyond Physical BarCharts: An Exploration of Designing Physical Visualizations” by Stusak and Aslan [2014]and on a bachelor thesis by Ayfer Aslan [2013]. Subsection 5.1.2 - Layered Physical Visual-izations is based on the paper “Can Physical Visualizations Support Analytical Tasks?” byStusak, Tabard, and Butz [2013] and on a bachelor thesis by Lena Streppel [2014]. Sub-section 5.2.1 - Layered Physical Visualizations on Tabletops based on the paper “Interactingwith Layered Physical Visualizations on Tabletops” by Stusak [2014] and on a bachelor the-sis by Maximilian Kreutzer [2014]. Subsection 5.2.2 - Projection Augmented Physical Visu-alizations is based on the paper “Projection Augmented Physical Visualizations” by Stusakand Teufel [2014] and on a master thesis by Markus Teufel [2014]. Subsection 5.3.1 - DataExploration Matrix is based on a project thesis by Elisabeth Engel [2014]. Subsection 5.3.2- Swirlization is based on a bachelor thesis by Barbara Schindler [2014].
The ideas for all theses were developed by me. The work was conducted in a collaborativemanner with the students and each step in the project was jointly discussed in weekly meet-ings. However, all key decisions in which ways to proceed in the project, e.g., regarding theprototype design, study procedure and analysis of the results, were done by me. The maincorpus of all papers were written by me and revised by the co-authors.
Chapter 6 - Potential for Perception & MemorabilityThe content of this chapter is based on two main projects, consisting of two student’s theses,which were partly published at international peer-reviewed conferences.
Section 6.1 - Static Physical Bar Charts is based on the paper “Evaluating the Memorabilityof Physical Visualizations” by Stusak, Schwarz, and Butz [2015] and a master thesis byJeannette Schwarz [2014]. Section 6.2 - Modular Physical Bar Charts is based on the paper“If Your Mind Can Grasp It, Your Hands Will Help” by Stusak, Hobe, and Butz [2016] andon a bachelor thesis by Moritz Hobe [2015].
The ideas for both projects were developed by me and I supervised the thesis and constantlyprovided input and feedback on the key decisions. We planned, conducted, and analyzed theevaluations in close collaboration. The main corpus of both publications were written by meand revised by the co-authors.
vii

Disclaimer
Chapter 7 - Potential for Communication & CollaborationThe content of this chapter is based on two main projects that, consisting of two student’stheses.
Section 7.1 - PopUpData is partly based on a bachelor thesis by Arnold Schefner [2014].The initial idea of the project was developed by Andreas Butz and me. I elaborated theconcept and supervised the thesis, which resulted in the final design of the prototypes. Theevaluation and analysis was done by me.
Section 7.2 - Collaborative Physicalizations is based on a project thesis by Xaver Loeffel-holz and Peter Arnold [2015]. The initial idea of the project was developed by me and theproject was supervised by Sarah Tausch and me. The work was conducted in a collaborativemanner with the students and each step in the project was jointly discussed in weekly meet-ings. However, all key decisions in which ways to proceed in the project, e.g., regarding theprototype design, study procedure and analysis of the results, were done by me.
Chapter 8 - Potential for Motivation & Self-ReflectionThe content of this chapter is based on the paper “Activity Sculptures: Exploring the Impactof Physical Visualizations on Running Activity” by Stusak, Tabard, Sauka, Khot, and Butz[2014] and a master thesis by Franziska Sauka [2014]. The idea of the project was developedby me and the thesis was supervised by me. The work was conducted in a collaborative man-ner with the student and each step in the project was jointly discussed in weekly meetings.We planned, conducted, and analyzed the evaluation in close collaboration. The main partof the publication was written by me, but in close collaboration with the co-author AurélienTabard.
Chapter 9 - Materialized SelfThe content of this chapter is based on an intensive collocated collaboration with RohitAshok Khot for three months. We both contributed equally to the entire project, while RohitAshok Khot had a stronger focus on the “consumption lens” (see Section 9.4 - ConsumptionLens) and my focus was on the “production lens” (see Section 9.3 - Production Lens).
Chapter 10 - Physical VariablesThe content of this chapter is based on an intensive collaboration with Aurélien Tabard,consisting of discussions in biweekly meetings. However, the main part of the literaturereview and the proposition of the categories and variables was done by me.
Pictures and IllustrationsDue to the support by students, I did not create all images and illustrations of this thesis.In this case, I mention the name of the author in the corresponding caption. I created allpictures and illustrations that are not followed by such a statement.
Statistical AnalysisAll statistical analyses in this thesis are based on estimation, i.e., effect sizes with confidenceintervals. We decided to do this because of growing concerns regarding the limits of null
viii

Disclaimer
hypothesis significance testing for reporting and interpreting study results in the field of HCI(e.g., Kaptein and Robertson [2012]; Dragicevic [2016]; Kay et al. [2016b,a]) as well as inother research fields (e.g., Kline [2004]; Cumming [2014]).
ix

Disclaimer
x

Acknowledgments
ACKNOWLEDGMENTS
First and foremost, I would like to thank my supervisor Andreas Butz for all the encourage-ment during my time as a doctoral student, especially when I was struggling with the entireundertaking. Thank you also for supporting lab visits abroad, trips to scientific conferenceseven in Hawaii and for dancing in the front row at one of my concerts. I also thank Shee-lagh Carpendale for all her time and effort being my second supervisor and Peer Krögerfor agreeing to be my committee chair. A big thank you in particular to Aurélien Tabardfor helping me find a topic, building first prototypes and his assistance in writing my firstscientific papers.
I will always look back at an incredible time working at the Media Informatics and Human-Computer Interaction Group, primarily because of all my great colleagues. I would like tothank Emanuel von Zezschwitz for your positive vibe, your DJ skills and endless parties,Sarah Tausch for being a beNUTS fan from the very beginning and always being friendlyand happy even after “mean” jokes, Alina Hang for never being unforgiving and establish-ing the “Waffel-Gang”, Julie Wagner for always thinking outside the box and organizingcurious activities, Henri Palleis for your deadpan humor and assisting my students with 3Dgraphics, Hanna Schneider for your honesty and fun parties ending up at the “Shakira Bar”,Sebastian Löhmann for your enthusiasm in sports and hip-hop and showing my studentshow to do hardware prototyping properly, Bernhard Slawik for the assistance in assemblingthe Ultimaker and always being helpful with tips and tricks for the best 3D print, Axel Höslfor showing me how to execute a proper high five and staying up all night at IDC Venice,Tobias Seitz for your high spirits and your enthusiasm in making music, Alexander Wi-ethoff for introducing me to the world of tangibles, Alexander De Luca for showing mehow the world of research works, Max Maurer for introducing me to the art of being astudent tutor and Daniel Buschek for taking over my duties. I also want to thank RonaldEcker again for supervising my diploma thesis, where you proved that being a doctoral stu-dent and supervising students can be a lot of fun. Thanks as well to Michael Sedlmairfor guidance and honest feedback at the very beginning of my time as a doctoral studentand sorry that we never succeeded in writing a paper together. I also want to thank formerand current colleagues as well as our external doctoral students Hendrik Richter, FabianHennecke, Doris Hausen, Florian Alt, Renate Häuslschmid, Bastian Pfleging, Chris-tian Mai, Maria Fysaraki, Malin Eiband, Ceenu George, Mariam Hassib, MohamedKhamis, Daniel Ullrich, Felix Lauber, Sonja Rümelin, Martin Knobel, and Nora Broy,for insightful presentations at our IDC, exciting discussions or amusing conversations at theone or the other coffee break.
Moreover, I want to thank Heinrich Hussmann for the helpful feedback during my IDCpresentations and for always taking the time when I had questions as a student tutor. I wantto give my special thanks to Franziska Schwamb; together we managed to answer even themost unusual requests by our students, and without you, I probably would have spent mostof my vacation time in Cuba organizing a room for my thesis defense. Many thanks also goto Rainer Fink; I just hope that all sysadmins out there are as competent as you and share
xi

Acknowledgments
the same dry humor. I also want to thank Florian “Floyd” Mueller and Rohit Ashok Khotfor inviting me to the Exertion Games Lab at the RMIT in Melbourne and the inspiring andvery good time I had in your lab.
During my time I had the pleasure to work with many fantastic students, who all contributedto this thesis. I want to thank Franziska Sauka for 3D printing day and night, even on week-ends, Jeannette Schwarz for keeping track of endless data source files, Arnold Schefnerfor the assistance in creating 400 pop-up cards, Xaver Loeffelholz and Peter Arnold fortheir great teamwork, Moritz Hobe for conducting a study that ended up in a best paper,Ayfer Aslan for your creativity and building the first physicalizations, Lena Streppel forcombining old school visualization techniques and physicalizations, Barbara Schindler forbringing Swirly to life, Elisabeth Engel for moving LEDs, at least a little bit, MaximilianKreutzer for bringing the Surface back to life and Markus Teufel for amazing coding skillsand fascinating discussions far away from your thesis’ topic.
Finally, a big thank you to all my friends and my band colleagues from beNUTS and Rapid,the rehearsals and concerts were always a perfect compensation to the research world. I amdeeply grateful for all the support of my parents, Erika Stusak and Hans Stusak, my sisterCarolin Stusak, and my brother Steffen Stusak. It helped a lot to know, that you are alwaysthere for me no matter what. Last but not least, I want to say thank you to Tessa-VirginiaHannemann. Thanks for all the proof-reading and discussions on study design or statistics,but also for philosophizing and listening to music night after night with a Cuba Libre in ourhands and mostly for standing by my side even in tough times. Thank you very much foryour love, support and optimism.
xii
TABLE OF CONTENTS
List of Figures xix
List of Tables xxiii
List of Abbreviations xxv
1 Introduction 11.1 Motivation . . . . . . . . . . . . . . . . . . . . . . . . . . . . . . . . . . . 2
1.2 Research Objectives & Research Questions . . . . . . . . . . . . . . . . . 4
1.3 Research Approach . . . . . . . . . . . . . . . . . . . . . . . . . . . . . . 4
1.4 Contributions . . . . . . . . . . . . . . . . . . . . . . . . . . . . . . . . . 5
1.5 Thesis Overview . . . . . . . . . . . . . . . . . . . . . . . . . . . . . . . . 6
I BACKGROUND 9
2 Embodied Interaction & Haptic Perception 112.1 Embodied Interaction . . . . . . . . . . . . . . . . . . . . . . . . . . . . . 11
2.1.1 Ubiquitous Computing & Tangible Interaction . . . . . . . . . . . . 122.1.2 Embodiment & Embodied Cognition . . . . . . . . . . . . . . . . . 14
2.2 Haptic Perception . . . . . . . . . . . . . . . . . . . . . . . . . . . . . . . 152.2.1 Object and Material Properties . . . . . . . . . . . . . . . . . . . . 152.2.2 Manual Exploration . . . . . . . . . . . . . . . . . . . . . . . . . . 182.2.3 Performance, Integration and Interaction . . . . . . . . . . . . . . . 202.2.4 Haptic Phenomena . . . . . . . . . . . . . . . . . . . . . . . . . . 22
3 Digital Fabrication 253.1 Personal Fabrication . . . . . . . . . . . . . . . . . . . . . . . . . . . . . . 26
3.1.1 Tools & Techniques . . . . . . . . . . . . . . . . . . . . . . . . . . 26
xiii

TABLE OF CONTENTS
3.1.2 Maker Movement . . . . . . . . . . . . . . . . . . . . . . . . . . . 28
3.2 Digital Fabrication in HCI . . . . . . . . . . . . . . . . . . . . . . . . . . 303.2.1 Method . . . . . . . . . . . . . . . . . . . . . . . . . . . . . . . . 303.2.2 Quantitative Overview . . . . . . . . . . . . . . . . . . . . . . . . 323.2.3 Categories . . . . . . . . . . . . . . . . . . . . . . . . . . . . . . . 343.2.4 Conclusion & Reflection . . . . . . . . . . . . . . . . . . . . . . . 37
4 Data Physicalization 394.1 History of Physical Data Representations . . . . . . . . . . . . . . . . . . . 40
4.2 Information Visualization & Tangible Interaction . . . . . . . . . . . . . . 42
4.3 Physicalization . . . . . . . . . . . . . . . . . . . . . . . . . . . . . . . . 454.3.1 Definitions . . . . . . . . . . . . . . . . . . . . . . . . . . . . . . 454.3.2 Physicalization Pipeline . . . . . . . . . . . . . . . . . . . . . . . . 484.3.3 Examples for Physicalizations . . . . . . . . . . . . . . . . . . . . 50
II PROTOTYPING PHYSICAL VISUALIZATIONS 59
5 Beyond Physical Bar Charts 615.1 Static Physical Visualizations . . . . . . . . . . . . . . . . . . . . . . . . . 62
5.1.1 Threaded Bar-Star-Plot . . . . . . . . . . . . . . . . . . . . . . . . 625.1.2 Layered Physical Visualizations . . . . . . . . . . . . . . . . . . . 67
5.2 Digitally Augmented Physical Visualizations . . . . . . . . . . . . . . . . . 745.2.1 Layered Physical Visualizations on Tabletops . . . . . . . . . . . . 745.2.2 Projection Augmented Physical Visualizations . . . . . . . . . . . . 79
5.3 Dynamic Physical Visualizations . . . . . . . . . . . . . . . . . . . . . . . 845.3.1 Data Exploration Matrix . . . . . . . . . . . . . . . . . . . . . . . 855.3.2 Swirlization . . . . . . . . . . . . . . . . . . . . . . . . . . . . . . 88
6 Potential for Perception & Memorability 956.1 Static Physical Bar Charts . . . . . . . . . . . . . . . . . . . . . . . . . . . 96
6.1.1 Motivation & Background . . . . . . . . . . . . . . . . . . . . . . 976.1.2 Design Process . . . . . . . . . . . . . . . . . . . . . . . . . . . . 996.1.3 Study Design . . . . . . . . . . . . . . . . . . . . . . . . . . . . . 1036.1.4 Results . . . . . . . . . . . . . . . . . . . . . . . . . . . . . . . . 1056.1.5 Discussion . . . . . . . . . . . . . . . . . . . . . . . . . . . . . . . 108
xiv

TABLE OF CONTENTS
6.2 Modular Physical Bar Charts . . . . . . . . . . . . . . . . . . . . . . . . . 1116.2.1 Motivation & Background . . . . . . . . . . . . . . . . . . . . . . 1116.2.2 Design Process . . . . . . . . . . . . . . . . . . . . . . . . . . . . 1136.2.3 Study Design . . . . . . . . . . . . . . . . . . . . . . . . . . . . . 1146.2.4 Results . . . . . . . . . . . . . . . . . . . . . . . . . . . . . . . . 1186.2.5 Discussion . . . . . . . . . . . . . . . . . . . . . . . . . . . . . . . 121
7 Potential for Communication & Collaboration 1257.1 PopUpData . . . . . . . . . . . . . . . . . . . . . . . . . . . . . . . . . . 126
7.1.1 Motivation & Background . . . . . . . . . . . . . . . . . . . . . . 1267.1.2 Design Process . . . . . . . . . . . . . . . . . . . . . . . . . . . . 1287.1.3 Study Design & Results . . . . . . . . . . . . . . . . . . . . . . . . 1327.1.4 Discussion . . . . . . . . . . . . . . . . . . . . . . . . . . . . . . . 133
7.2 Collaborative Physicalizations . . . . . . . . . . . . . . . . . . . . . . . . 1347.2.1 Motivation & Background . . . . . . . . . . . . . . . . . . . . . . 1347.2.2 Design Process . . . . . . . . . . . . . . . . . . . . . . . . . . . . 1367.2.3 Study Design . . . . . . . . . . . . . . . . . . . . . . . . . . . . . 1397.2.4 Results . . . . . . . . . . . . . . . . . . . . . . . . . . . . . . . . 1407.2.5 Discussion . . . . . . . . . . . . . . . . . . . . . . . . . . . . . . . 146
8 Potential for Motivation & Self-Reflection 1498.1 Motivation & Background . . . . . . . . . . . . . . . . . . . . . . . . . . 150
8.1.1 From Lifelogging to Quantified Self . . . . . . . . . . . . . . . . . 1518.1.2 Motivating Physical Activity . . . . . . . . . . . . . . . . . . . . . 152
8.2 Design Process of Activity Sculptures . . . . . . . . . . . . . . . . . . . . 1538.2.1 Initial Concepts . . . . . . . . . . . . . . . . . . . . . . . . . . . . 1538.2.2 Design Decisions . . . . . . . . . . . . . . . . . . . . . . . . . . . 1558.2.3 Fabrication Process . . . . . . . . . . . . . . . . . . . . . . . . . . 158
8.3 Study Design . . . . . . . . . . . . . . . . . . . . . . . . . . . . . . . . . 1608.3.1 Participants . . . . . . . . . . . . . . . . . . . . . . . . . . . . . . 1618.3.2 Setup . . . . . . . . . . . . . . . . . . . . . . . . . . . . . . . . . 1618.3.3 Procedure . . . . . . . . . . . . . . . . . . . . . . . . . . . . . . . 162
8.4 Results . . . . . . . . . . . . . . . . . . . . . . . . . . . . . . . . . . . . . 1638.4.1 Participants Overview . . . . . . . . . . . . . . . . . . . . . . . . . 1648.4.2 Questionnaires . . . . . . . . . . . . . . . . . . . . . . . . . . . . 1648.4.3 Interviews . . . . . . . . . . . . . . . . . . . . . . . . . . . . . . . 165
8.5 Discussion . . . . . . . . . . . . . . . . . . . . . . . . . . . . . . . . . . . 1728.5.1 Sculptures as Personal Data Representations . . . . . . . . . . . . . 172
xv

TABLE OF CONTENTS
8.5.2 Challenges of Static Representations . . . . . . . . . . . . . . . . . 1738.5.3 Scalability . . . . . . . . . . . . . . . . . . . . . . . . . . . . . . . 1738.5.4 Sustainability . . . . . . . . . . . . . . . . . . . . . . . . . . . . . 1748.5.5 Reflection and Self-Expression . . . . . . . . . . . . . . . . . . . . 1748.5.6 Limitations . . . . . . . . . . . . . . . . . . . . . . . . . . . . . . 1758.5.7 Conclusion . . . . . . . . . . . . . . . . . . . . . . . . . . . . . . 176
III REFLECTING ON THE DESIGN OF PHYSICALVISUALIZATIONS 179
9 Materialized Self 1819.1 Motivation & Background . . . . . . . . . . . . . . . . . . . . . . . . . . 182
9.2 The “Materialized Self” Framework . . . . . . . . . . . . . . . . . . . . . 184
9.3 Production Lens . . . . . . . . . . . . . . . . . . . . . . . . . . . . . . . . 1849.3.1 Function . . . . . . . . . . . . . . . . . . . . . . . . . . . . . . . . 1869.3.2 Form . . . . . . . . . . . . . . . . . . . . . . . . . . . . . . . . . 1869.3.3 Fabrication . . . . . . . . . . . . . . . . . . . . . . . . . . . . . . 187
9.4 Consumption Lens . . . . . . . . . . . . . . . . . . . . . . . . . . . . . . 1879.4.1 Identity . . . . . . . . . . . . . . . . . . . . . . . . . . . . . . . . 1879.4.2 Meaning . . . . . . . . . . . . . . . . . . . . . . . . . . . . . . . . 1889.4.3 Ecology . . . . . . . . . . . . . . . . . . . . . . . . . . . . . . . . 189
9.5 Discussion . . . . . . . . . . . . . . . . . . . . . . . . . . . . . . . . . . . 189
10 Physical Variables 19110.1 Motivation & Background . . . . . . . . . . . . . . . . . . . . . . . . . . 192
10.1.1 Visual Perception . . . . . . . . . . . . . . . . . . . . . . . . . . . 19210.1.2 Visual Marks & Variables . . . . . . . . . . . . . . . . . . . . . . . 19310.1.3 Disclaimer . . . . . . . . . . . . . . . . . . . . . . . . . . . . . . . 194
10.2 Description of Variables . . . . . . . . . . . . . . . . . . . . . . . . . . . . 19410.2.1 Geometric Variables . . . . . . . . . . . . . . . . . . . . . . . . . 19510.2.2 Color Variables . . . . . . . . . . . . . . . . . . . . . . . . . . . . 19610.2.3 Tactile Variables . . . . . . . . . . . . . . . . . . . . . . . . . . . 19710.2.4 Kinesthetic Variables . . . . . . . . . . . . . . . . . . . . . . . . . 200
10.3 Performance of Variables . . . . . . . . . . . . . . . . . . . . . . . . . . . 20010.3.1 Geometric Variables . . . . . . . . . . . . . . . . . . . . . . . . . 20110.3.2 Color Variables . . . . . . . . . . . . . . . . . . . . . . . . . . . . 202
xvi

TABLE OF CONTENTS
10.3.3 Tactile Variables . . . . . . . . . . . . . . . . . . . . . . . . . . . 20210.3.4 Kinesthetic Variables . . . . . . . . . . . . . . . . . . . . . . . . . 203
10.4 Discussion . . . . . . . . . . . . . . . . . . . . . . . . . . . . . . . . . . . 203
11 Summary and Future Work 20511.1 Contribution Summary . . . . . . . . . . . . . . . . . . . . . . . . . . . . 206
11.1.1 Design of Physicalizations . . . . . . . . . . . . . . . . . . . . . . 20611.1.2 Potential for Physicalizations . . . . . . . . . . . . . . . . . . . . . 207
11.2 Limitations and Future Work . . . . . . . . . . . . . . . . . . . . . . . . . 20811.2.1 Perceiving Physicalizations . . . . . . . . . . . . . . . . . . . . . . 20811.2.2 Interacting with Physicalizations . . . . . . . . . . . . . . . . . . . 20811.2.3 Collaborating with Physicalizations . . . . . . . . . . . . . . . . . 20911.2.4 Communicating with Physicalizations . . . . . . . . . . . . . . . . 20911.2.5 Personal Physicalizations . . . . . . . . . . . . . . . . . . . . . . . 21011.2.6 Dynamic Physicalizations . . . . . . . . . . . . . . . . . . . . . . 21011.2.7 Multi-Sensory Data Representations . . . . . . . . . . . . . . . . . 211
11.3 Closing Remarks . . . . . . . . . . . . . . . . . . . . . . . . . . . . . . . 211
Bibliography 213
xvii

TABLE OF CONTENTS
xviii

LIST OF FIGURES
1.1 Hans Rosling using physical visualiaztions . . . . . . . . . . . . . . . . . . 2
2.1 Radical Atoms . . . . . . . . . . . . . . . . . . . . . . . . . . . . . . . . . 132.2 Exploratory procedures . . . . . . . . . . . . . . . . . . . . . . . . . . . . 192.3 Exploratory procedures performance . . . . . . . . . . . . . . . . . . . . . 21
3.1 Example for laser cutter and 3D printer . . . . . . . . . . . . . . . . . . . . 273.2 Examples for physical visualizations from Thingiverse . . . . . . . . . . . 293.3 Digital Fabrication: Most cited papers . . . . . . . . . . . . . . . . . . . . 313.4 Digital Fabrication: Number of relevant papers from 2009 to 2015 . . . . . 333.5 Digital Fabrication: Papers sorted by conference and categories . . . . . . . 34
4.1 Examples of clay tokens . . . . . . . . . . . . . . . . . . . . . . . . . . . 404.2 Examples of quipus . . . . . . . . . . . . . . . . . . . . . . . . . . . . . . 414.3 Examples of physical models of atoms and molecules . . . . . . . . . . . . 424.4 Examples of historic physicalizations . . . . . . . . . . . . . . . . . . . . . 434.5 Tangible controllers used in visualization systems . . . . . . . . . . . . . . 444.6 Tangible displays used for visualization systems . . . . . . . . . . . . . . . 454.7 Models of physical representation of data and embodiment in data sculpture 474.8 InfoVis Pipeline . . . . . . . . . . . . . . . . . . . . . . . . . . . . . . . . 484.9 Extended InfoVis Pipeline . . . . . . . . . . . . . . . . . . . . . . . . . . 494.10 Examples of Data Sculptures . . . . . . . . . . . . . . . . . . . . . . . . . 514.11 Examples of physicalizations encoding activity data . . . . . . . . . . . . . 514.12 Examples of palatable physicalizations encoding activity data . . . . . . . . 524.13 Examples of Data-Objects . . . . . . . . . . . . . . . . . . . . . . . . . . 534.14 Examples of physicalizations using multiple modalities . . . . . . . . . . . 544.15 Examples of physicalizations for visually impaired . . . . . . . . . . . . . 554.16 Examples of physicalizations for Scientific Visualization (SciVis) . . . . . . 554.17 Evaluating the efficiency of physicalizations . . . . . . . . . . . . . . . . . 564.18 Examples of dynamic physicalizations . . . . . . . . . . . . . . . . . . . . 57
5.1 Threaded bar-star-plot: Sketches and low-fidelity prototypes . . . . . . . . 635.2 Threaded bar-star-plot: Low-fidelity prototypes and final design . . . . . . 645.3 Threaded bar-star-plot: Screenshots of the digital counterparts . . . . . . . 655.4 Threaded bar-star-plot: Results for average task completion time . . . . . . 665.5 Threaded bar-star-plot: Likert scale questionnaire . . . . . . . . . . . . . . 675.6 Layered: Illustrations of prototypes . . . . . . . . . . . . . . . . . . . . . . 695.7 Layered: Final prototypes . . . . . . . . . . . . . . . . . . . . . . . . . . . 705.8 Layered: Apparatus . . . . . . . . . . . . . . . . . . . . . . . . . . . . . . 715.9 Layered: Evaluation results . . . . . . . . . . . . . . . . . . . . . . . . . . 72
xix
LIST OF FIGURES
5.10 Layered: Handling . . . . . . . . . . . . . . . . . . . . . . . . . . . . . . 735.11 Tabletop: Fixations and possibilities to articulate . . . . . . . . . . . . . . . 755.12 Tabletop: Interaction possibilities . . . . . . . . . . . . . . . . . . . . . . . 765.13 Tabletop: Prototype . . . . . . . . . . . . . . . . . . . . . . . . . . . . . . 775.14 Projection: Design process . . . . . . . . . . . . . . . . . . . . . . . . . . 815.15 Projection: Final prototype . . . . . . . . . . . . . . . . . . . . . . . . . . 825.16 Matrix: Final prototype . . . . . . . . . . . . . . . . . . . . . . . . . . . . 865.17 Matrix: Components and setup . . . . . . . . . . . . . . . . . . . . . . . . 865.18 Matrix: Evaluation and results . . . . . . . . . . . . . . . . . . . . . . . . 875.19 Swirlization: Final prototype . . . . . . . . . . . . . . . . . . . . . . . . . 895.20 Swirlization: Hardware components and setup . . . . . . . . . . . . . . . . 905.21 Swirlization: Legends . . . . . . . . . . . . . . . . . . . . . . . . . . . . . 92
6.1 Memorability static: Digital and physical static bar charts . . . . . . . . . . 966.2 Memorability static: Digital representation in detail . . . . . . . . . . . . . 1016.3 Memorability static: Physicalization in detail . . . . . . . . . . . . . . . . 1036.4 Memorability static: Likert scale questionnaires . . . . . . . . . . . . . . . 1066.5 Memorability static: Recall performance . . . . . . . . . . . . . . . . . . . 1076.6 Memorability static: Memorability score . . . . . . . . . . . . . . . . . . . 1086.7 Memorability modular: wood and paper-based bar charts . . . . . . . . . . 1126.8 Memorability modular: creation of the physicalizations . . . . . . . . . . . 1156.9 Memorability modular: Study apparatus . . . . . . . . . . . . . . . . . . . 1176.10 Memorability modular: Likert scale questionnaires . . . . . . . . . . . . . 1196.11 Memorability modular: Recall performance in total . . . . . . . . . . . . . 1206.12 Memorability modular: Recall performance for extreme values . . . . . . . 1206.13 Memorability modular: Recall performance depending on presentation order 120
7.1 PopUpData: Final prototypes . . . . . . . . . . . . . . . . . . . . . . . . . 1277.2 PopUpData: Design of the ground plates . . . . . . . . . . . . . . . . . . . 1317.3 PopUpData: Fabrication . . . . . . . . . . . . . . . . . . . . . . . . . . . 1317.4 PopUpData: Hands-on evaluation . . . . . . . . . . . . . . . . . . . . . . . 1327.5 Collaboration: Final prototypes . . . . . . . . . . . . . . . . . . . . . . . . 1357.6 Collaboration: Digital prototype . . . . . . . . . . . . . . . . . . . . . . . 1387.7 Collaboration: Physical prototype . . . . . . . . . . . . . . . . . . . . . . 1387.8 Collaboration: Rating of teamwork aspects . . . . . . . . . . . . . . . . . . 1417.9 Collaboration: Rating of modality aspects . . . . . . . . . . . . . . . . . . 1427.10 Collaboration: perspective distortion of the physical line chart . . . . . . . 1437.11 Collaboration: Participants interacting with the representations . . . . . . . 144
8.1 Activity Sculptures: Examples of final sculptures . . . . . . . . . . . . . . 1508.2 Activity Sculptures: Sketchs of early concepts . . . . . . . . . . . . . . . . 1548.3 Activity Sculptures: Jar . . . . . . . . . . . . . . . . . . . . . . . . . . . . 1578.4 Activity Sculptures: Lamp . . . . . . . . . . . . . . . . . . . . . . . . . . 1578.5 Activity Sculptures: Necklace . . . . . . . . . . . . . . . . . . . . . . . . 158
xx

LIST OF FIGURES
8.6 Activity Sculptures: Figure . . . . . . . . . . . . . . . . . . . . . . . . . . 1598.7 Activity Sculptures: Fabrication Pipeline . . . . . . . . . . . . . . . . . . . 1608.8 Activity Sculptures: Likert scale questionnaires . . . . . . . . . . . . . . . 1658.9 Activity Sculptures: Sculptures embedded in everyday life . . . . . . . . . 170
9.1 Materialized Self: Diagrammatic overview . . . . . . . . . . . . . . . . . . 182
10.1 Physical Variables: Examples . . . . . . . . . . . . . . . . . . . . . . . . . 198
xxi

LIST OF FIGURES
xxii

LIST OF TABLES
8.1 Activity Sculputres: Demographic details of the participants . . . . . . . . 1628.2 Activity Sculptures: Study setup for every participant . . . . . . . . . . . . 164
9.1 Materialized Self: Comparison of the systems . . . . . . . . . . . . . . . . 1839.2 Materialized Self: Tabular overview . . . . . . . . . . . . . . . . . . . . . 185
10.1 Physical Variables: Performance . . . . . . . . . . . . . . . . . . . . . . . 202
xxiii

LIST OF TABLES
xxiv

LIST OF ABBREVIATIONS
ACM Association for Computing Machinery
API Application Programming Interface
ASTM American Society for Testing and Materials
BC Before Christ
BELIV BEyond time and errors: novel evaLuation methods for Information Visualization
C&C Creativity & Cognition
CAD Computer-Aided Design
CBA Center for Bits and Atoms
CNC Computer-Numeric Controlled
CSCW Computer-Supported Cooperative Work
CSG Constructive Solid Geometry
CHI Human Factors in Computing Systems
DIS Designing Interactive Systems
DIY Do-It-Yourself
FabLab Fabrication Laboratory
FDM Fused Deposition Modeling
FFF Fused Filament Fabrication
GDP Gross Domestic Product
GPS Global Positioning System
GUI Graphical User Interface
HCI Human-Computer Interaction
HDR Human Development Report
IDC Interaction Design and Children
InfoVis Information Visualization

LIST OF ABBREVIATIONS
LED Light-Emitting Diode
LMU Munich Ludwig-Maximilians-Universität Munich
MIT Massachusetts Institute of Technology
MRI Magnetic Resonance Imaging
OECD Organisation for Economic Co-operation and Development
PLA PolyLactic Acid
PRIO Peace Research Institute Oslo
RGB Red Green Blue
SALW Small Arms and Light Weapons
SciVis Scientific Visualization
SDK Software Development Kit
SIGCHI Special Interest Group on Computer-Human Interaction
SMA Shape Memory Alloy
STL STereoLithography
TUI Tangible User Interface
TED Technology, Entertainment, Design
TEI Tangible, Embedded, and Embodied Interaction
UIST User Interface Software and Technology
USA United States of America
USB Universal Serial Bus
xxvi

Chapter1Introduction
The goal of an external representation of data is to provide insights and convey informa-tion about the underlying data, therefore helping people execute tasks and solve problemsmore efficiently, comprehend contexts and relations or express emotion and provoke thought.However, the question in which ways data should be represented to be of value for humansis not easy to answer. Marr [1982] gives a simple but demonstrative example by means ofthe different formal systems for representing numbers, e.g., the Arabic, Roman, and binarynumeral system. While all representations can encode the same number, the degree of acces-sibility for specific information, such as the powers of ten, varies considerably [Carpendale,2003].
The visual representation of data on paper and digital screens has a long history and hasproven its value to communicate abstract numbers in a simple and understandable formthrough bar and line graphs since the 18th century [Playfair, 1801]. Over time, especiallythrough the adoption of the computer, visualizations have raised further attention and inter-est which led to the research field of Information Visualization (InfoVis). Amongst others,research in this area has investigated the efficiency of single visual variables as well as typesof visualizations, developed novel interaction techniques for visualization systems and ex-plored the value of visual representations for various audiences.
The findings have revealed, that an external representation can facilitate human capabilities,such as internal cognition and memory [Munzner, 2014]. Even though Munzner argues thatexternal representations can take many forms, including physical objects, this opportunityhas been mostly disregarded in the field of InfoVis. Therefore, this thesis aims to investigatethe ways in which the experience and perception of data are influenced by representationmodalities, and explores the benefits of encoding data physically.

1 Introduction
Figure 1.1: Hans Rosling uses physical visualizations to explain the global population growth(left, image © TED) and the Syrian refugee situation in 2015 (right, image © Gapminder Foun-dation).
1.1 Motivation
Using physical objects and properties to represent data is not a new idea, as various examplesbuilt by artists and designers show [Dragicevic and Jansen, 2012]. Physical visualizationsare often used as artistic artifacts to attract attention, convey meaning and messages be-yond the data itself and provoke thought. Compared to their digital counterparts physicaldata representations have the advantage of being “touched, explored, carried, or even pos-sessed” [Vande Moere, 2008]. Furthermore, Jansen et al. [2015] argue, that physicalizationscan “offer potential perceptual, cognitive, and communicative value that neither paper norcomputer displays may be able to offer.”
A vivid example of the ways in which physical representations can be used to explain dataand emphasize messages are the presentations by the medical doctor and public speaker HansRosling. Figure 1.1-left shows an example of his Technology, Entertainment, Design (TED)talk on “religions and babies”. By using card boxes, each representing one billion people, heillustrates what he calls “the big fill-up,” which describes the prediction of the United NationsPopulation Division that the population growth will stop at 10 billion people. Another case isshown in Figure 1.1-right, in which he explains the Syrian refugee situation in 2015. Againhe uses physical boxes, each representing one million people, to exemplify the migration ofSyrians that have left their homes. As the boxes are placed on an interactive tabletop, hemixes analog and digital visualization techniques, resulting in a gripping story.
Those examples suggest that physical visualizations are useful and efficient to communicateand present information in a comprehensible form. However, data representations are notonly used for communicating information but also for discovering new insights that werenot previously known, for pure enjoyment and out of curiosity [Munzner, 2014]. It is stillunclear and rarely studied which characteristics physical visualizations actually have, inwhich ways these can be used and for which purposes they are suitable.
2

Motivation
Use All Our Senses
By approaching or touching objects, we can estimate its temperature, by lifting a milk cartonwe can draw conclusions about its fill level and by squeezing an avocado we can makeinferences about its ripeness. Humans have learned for centuries the ways in which to senseand manipulate the physical world. Hiroshi Ishii has been fighting against the “pixel empire”for many years, as he argues that the Graphical User Interfaces (GUIs), commonly used forelectronic devices, do not take full advantage of human capabilities [Ishii and Ullmer, 1997;Ishii et al., 2012]. Although multi-touch devices are considered more direct and physical,as they allow to “touch” interface elements and also support gestures, this is only a smallsubset of the expressive power of the human hand, not to mention the entire body. Whilea growing number of projects looked into interaction techniques beyond the desktop in thefield of InfoVis [Lee et al., 2012], only little research has focused on the idea of encodingdata into material and object properties [Jansen, 2014].
Emerging Technologies
With decreasing costs for digital fabrication technologies such as laser cutters or 3D printers,their distribution and adoption has increased greatly [Mota, 2011]. They allow an accuratefabrication of physical objects with different form factors and materials in a reasonable timeframe and for a small budget. This creates the opportunity to study the potential of physicalvisualizations for various purposes in a broad range, for the first time. Also, the technicalprogress in research areas such as shape-changing interfaces lead to the questions in whichways such novel techniques can be integrated into everyday life and in which ways theycan complement traditional 2D displays [Rasmussen et al., 2012]. While technologies forshape-changing interfaces are rapidly evolving, our understanding of their apparent benefitsis still limited. Positive findings of the ways in which physically encoded data can influenceindividual’s perception and experience can motivate further research in this area and canserve as an application scenario.
Physical Data Representations
Before the written word, humans used physical objects such as clay tokens as data repre-sentations, e.g., to organize and store economic data [Schmandt-Besserat, 1986]. With theinvention of paper and much later on digital screens, data representations moved from three-dimensional physical objects to two-dimensional graphics on flat surfaces. Compared tophysical data representations, which take time and material to build and are typically static,visualizations on digital screens are dynamic and support interactive exploration such as fil-tering or updating the dataset. Bearing in mind the costs and limitations of physicalizations,their adoption depends on providing clear benefits. Jansen et al. [2013] showed that movinga 3D bar chart from the digital into the physical world can improve efficiency at informationretrieval tasks. Physicalizations may have many possible benefits, e.g., on perceptual or cog-nitive levels, but further research needs to provide evidence for or against these assumptionsand address the multiple challenges and opportunities of this field.
3

1 Introduction
1.2 Research Objectives & Research Questions
Most work in the area of physical data representations was done by designers and artists witha focus on aesthetic and impressive artistic installations. Data physicalization as a new andemerging field of research was proposed recently by Jansen et al.. Researchers are assuredthat physical data representations have the quality of evoking fascination and curiosity oreven turn data exploration into an educational, enjoyable experience [Vande Moere, 2008].However, those expectations are often not backed with research results. In addition, thecreation of effective physical visualizations and their analytical value remain to be explored.Those considerations lead to two widespread research questions:
(RQ1) How do physicalizations influence the perception and experience of dataexploration (compared to traditional data representations)?
(RQ2) How can and should physicalizations be designed to fulfill specific pur-poses?
To tackle these rather broad research questions in the yet open field of data physicaliza-tion we started with conducting an exploratory research through design. In several projectsphysical data representations were designed and built for a range of different datasets and invarious form factors based on several materials. All had the common goal of exploring theways in which physical visualization can be designed, to investigate in which ways peopleuse and interact with them and to establish a basic understanding of their potential and limi-tations. The collected experiences and learned lessons in this exploration phase lead to threepromising directions for physical visualizations and three related research questions:
(RQ3) How do physicalizations impact the recall of information?
(RQ4) How do physicalizations impact communication and collaboration pro-cesses?
(RQ5) How do physicalizations impact motivation and self-reflection?
1.3 Research Approach
To find answers for the above formulated research objectives, I pursued the following ap-proach:
Literature Review
To establish a theoretical basis for the design and evaluation of physical visualizations aliterature review was performed covering three aspects: (1) background on psychological
4

Contributions
and physical human capabilities to gain a deeper understanding of the ways in which thesense of touch and physicality can be used for the representation of data; (2) overview ofdigital fabrication technologies such as laser cutters or 3D printers, which allow an easy,fast and precise creation of physical visualizations; and (3) an introduction into the historyof physical data representations and examples of installations and systems that were createdand developed in related fields.
Exploration
To explore the rather new research area of physical visualizations, various prototypes werecreated, based on tools and methods known from the field of Human-Computer Interac-tion (HCI), such as user-centered design or low-fidelity prototyping. This practical approachwas inspired by the research through design method [Zimmerman et al., 2007], the inten-tion and expected final output of which is a series of prototypes and a documentation of thedesign process, that can help to specify a context of use and set of target audiences. Bydesigning and building a broad spectrum of physical data representations, from static to dig-itally augmented to dynamic prototypes, three promising directions for the value of physicalvisualizations could be identified.
Evaluation
To analyze the benefits of physical visualizations, several prototypes were evaluated for thethree areas of perception & memorability, communication & collaboration and motivation& self-reflection. Controlled, lab-based studies were conducted and two in-the-wild studies[Rogers, 2011] to explore in which ways physical visualizations are used in day-to-day life.In these studies, participants used and interacted with the created physical visualizations andreported on their experiences through questionnaires and semi-structured interviews.
Retrospective
To recapitulate on the design, creation and evaluation of the built prototypes of physicalvisualizations, the collected experiences and learned lessons are discussed on an abstractlevel. The outcome is a conceptual framework for material representations of personal dataand an initial characterization of physical variables.
1.4 Contributions
This thesis focuses on the investigation of ways in which information can be perceivedthrough physical artifacts and material properties and thereby uncover its potential as well ashighlight challenges and limitations. Based on the previously mentioned research questionsthis thesis offers two main contributions to the field of data physicalization.
5
1 Introduction
Design of Physical Visualizations
In the course of this thesis, eleven prototypes of physical visualizations were built. A lasercutter, 3D printer, and classical workshop tools, as well as various materials such as paper,wood, acrylic glass and PolyLactic Acid (PLA), were used for their creation. While thefocus was on static physical visualizations inspired by traditional 2D graphs, four projectsexplored digitally augmented and dynamic physical visualizations. This thesis provides de-tails on the design process and the evaluation of all prototypes. Based on the findings andcollected experiences through the creation and evaluation of these prototypes, two theoreti-cal contributions to the design and potential of physical visualizations are proposed. On theone hand, it proposes a conceptual framework for material representations of personal databy describing a production and consumption lens. The goal is to inspire designers workingin the field of personal informatics to harness the interactive capabilities afforded by digitalfabrication and material representations. On the other hand, it gives a first classification ofphysical variables to guide designers and researchers in building effective physical visual-izations.
Potential of Physical Visualizations
Based on the initial design and evaluation of six prototypes three promising areas of potentialfor physical visualizations were identified and investigated in more detail. The results of twostudies in the area of perception & memorability showed that facts about maximum andminimum values were be remembered more efficiently when they were perceived from aphysical visualization. Two explorative studies in the area of communication & collaborationhighlighted the importance of the design and aesthetic of physical visualizations and revealeda polarization: Participants either strongly enjoyed working with the physicalizations orrejected them and described them as inconvenient compared to their digital counterparts. Afield study in the area of motivation & self-reflection uncovered that physical visualizationsof personal running activity generate curiosity and personal experimentation as well as socialdynamics such as discussions or competition and therefore revealed additional benefits ofphysical visualizations compared to their digital counterparts.
1.5 Thesis Overview
This thesis is divided into three main parts. The first part provides an overview of the relatedwork in the fields of haptic perception, digital fabrication and data physicalization. The sec-ond part describes several initial prototypes of physical visualizations and introduces threepromising areas for physical visualization, which are investigated in more detail. The thirdpart contains two theoretical considerations derived from the results and insights gathered inthe evaluations of the prototypes. The thesis concludes with a statement about the limitationsof the work and an outlook on future work. The three parts contain the following chapters.
6

Thesis Overview
Chapter 1 - IntroductionChapter 1 grounds the thesis topic and provides details about the motivation for researchingphysical data representations. Furthermore research questions are formulated, the researchapproach is presented, and the contributions to the field are stated.
Part I: Background
The first part provides an overview of the related work relevant for the field of physicalvisualizations.
Chapter 2 - Embodied Interaction & Haptic PerceptionChapter 2 introduces the ideas of embodied interaction and the theory of embodied cognition.Moreover, research done in the field of haptic perception is discussed including object andmaterial properties, their manual exploration and performance characteristics.
Chapter 3 - Digital FabricationChapter 3 reviews projects regarding digital fabrication technologies. The section on per-sonal fabrication describes application examples in a private or industrial setting. The sec-ond section focuses on research projects referring to digital fabrication and explains in whichways the research fields of digital fabrication and physical visualizations are associated witheach other.
Chapter 4 - Data PhysicalizationChapter 4 offers an overview of work that is related to the physical representation of data.After a short introduction to its history, the focus of the chapter lies on the definition ofthe term physicalizations as well as the listing and categorization of research projects thatexperimented with physical data representations.
Part II: Prototyping Physical Visualizations
The second part describes several initial prototypes of physical visualizations and introducesthree promising areas for physical visualization.
Chapter 5 - Beyond Physical Bar ChartsChapter 5 presents initial prototypes of static, digitally augmented and dynamic physicalvisualizations. Based on the exploration and evaluation of these prototypes, three promisingareas of potential for physical visualization were identified. Their investigation in moredepth is the content of the following three chapters.
Chapter 6 - Potential for Perception & MemorabilityChapter 6 describes two projects studying the perception and recall of information. Whilethe first project compared a digital bar chart to a physical one, the second project left outthe digital counterpart and focused on the comparison of the dimensionality of physicalvisualizations.
Chapter 7 - Potential for Communication & CollaborationChapter 7 summarizes two explorative studies dealing with physical visualization used by
7
1 Introduction
multiple individuals. The first study explored whether the act of assembling a personalvisualization engages participants and leads to sharing and discussing the data. The secondstudy investigated the collaboration of groups when solving information visualization taskswith physical and digital visualizations.
Chapter 8 - Potential for Motivation & Self-ReflectionChapter 8 gives a summary of the Activity Sculptures project, where we 3D printed physical-izations based on personal running data. A three-week field study was conducted to explorethe impact of such physicalizations on participant’s behavior and their running activity.
Part III: Reflecting on the Design of Physical Visualizations
Chapter 9 - Materialized SelfChapter 9 proposes the conceptual framework materialized self, which focuses on materialrepresentations of personal data. By looking into such artifacts from a production and con-sumption lens, it offers designers working in the field of personal informatics inspiration andguidance for creating personal physicalizations.
Chapter 10 - Physical VariablesChapter 10 gives a preliminary categorization of physical variables, which is based on re-lated work and the experiences collected during the design and evaluation of the prototypes.Going beyond the perception of material properties also emotional associative aspects arediscussed.
Chapter 11 - Summary and Future WorkChapter 11 concludes the thesis by providing a summary of the contents of the previouschapters. Besides the limitations of the work it also provides starting points for future workin the area of physical visualizations to encourage researcher to explore this fascinating andyet little-researched field.
8

IBACKGROUND


Chapter2Embodied Interaction & Haptic
Perception
This chapter first gives a short introduction to the design approach of “embodied interaction”and corresponding research areas such as tangible and ubiquitous computing and aims toillustrate the idea and vision of user interfaces and interactive experiences that go “beyondthe desktop” (Section 2.1). The second part gives a brief overview of relevant research thatwas done in the area of haptic perception to emphasize human capabilities apart from thevisual sense (Section 2.2). It further demonstrates the possibilities of physical objects toencode data that is perceivable by humans.
The purpose of this chapter is not an exhaustive account of all relevant work that was donein these areas of research but to present the broader motivation and inspiration behind thethesis’ topic. The brief excursion into haptic perception illustrates first directions for possiblebenefits of physical visualizations.
2.1 Embodied Interaction
The term “embodied interaction” was introduced by Dourish [2001], as he proposed “em-bodiment” as a new design approach to HCI by drawing upon and bringing together theresearch areas of tangible and social computing. It focuses on everyday tasks and mundaneexperiences as well as the understanding of the world through practical activities. By gradu-ally incorporating a wider range of human skills and abilities the interaction with computingdevices can become easier and more widely accessible. Since its publication, the concept ofembodied interaction is increasingly used for designing, analyzing and evaluating interactivesystems [Marshall et al., 2013]. The Association for Computing Machinery (ACM) Confer-ence on Tangible, Embedded, and Embodied Interaction (TEI), established in 2007 with a

2 Embodied Interaction & Haptic Perception
focus on tangible and embedded interaction, for example, integrated embodied interaction inits title with its fourth edition in 2010, in order to invite research on whole-body or gesturalinteraction more explicitly [Hornecker, 2010]. While it still seems unclear whether embod-ied interaction is as a single concept in HCI or rather a number of distinct perspectives,most work shares the reflection on the design possibilities offered by whole body interaction[Marshall et al., 2013].
The following section gives a brief overview of the field of embodied interaction, whilefocusing on the aspects that are most relevant to the thesis’ topic. In particular it describesthe visions of ubiquitous and tangible computing as one foundation behind the motivationand inspiration for investigating physical visualizations. Additionally, theories of embodiedcognition are introduced that describe cognitive representations as “less abstract and lessbrain-based and more embodied, embedded, extended, or enactive” [Marshall et al., 2013].
2.1.1 Ubiquitous Computing & Tangible Interaction
Dourish’s focus in his book “Where the Action is: The Foundations of Embodied Interac-tion” was on the area of tangible computing to describe one example of a phenomenologi-cally inspired program of research. He later questions whether the use of the more generalterm of ubiquitous computing would have been a better choice than tangible computing[Dourish, 2013].
The term ubiquitous computing was introduced by Weiser in 1991 with his article “Thecomputer for the 21st century”. The distinction of ubiquitous computing to the traditionaldesktop computing is the concept that computing can occur everywhere at anytime, fromthe classical desktop or laptop, to various mobile devices to everyday objects. In followingarticles by Weiser and Brown [1996, 1997] they introduced, among other things, the “Dan-gling String”, which was created by the artist Natalie Jeremijenko. The “Dangling String”can be seen as a physical visualization for network traffic as a physical string is rotated de-pending on the number of bits running through an Ethernet cable. They argue that whiledigital representations of network traffic are common, their symbols require interpretationand attention. In contrast, the Dangling String offers a peripheral perception to the formerlyinaccessible network traffic and can be both seen and heard. This example illustrates theconnection of the thesis’ topic and the area of ubiquitous computing, in particular regardingthe aspect of prototyping interactive systems that go beyond the desktop. It should be notedthat the Dangling String was described as an example for calm technology and belongs to thearea of ambient visualizations [Skog et al., 2003]. This thesis also explores more pragmaticvisualizations [Kosara, 2007] that aim at actively analyzing and understanding abstract data.
Ubiquitous computing and tangible interaction share the common interest regarding themovement and configuration of computing devices and their carrier in the physical space,while tangible interaction in particular relies on tangibility and whole-body interaction[Shaer and Hornecker, 2010]. New developments in the area of ubiquitous computing, e.g.,sensing techniques, also contribute through enabling technologies to the field of tangible
12

Embodied Interaction
interaction. The first prominent notion of tangible interaction in the area of HCI was thevision of “Tangible Bits” by Ishii and Ullmer [1997]. They argue that GUIs do not takeadvantage of the humans abilities to sense and manipulate the physical world. Their conceptof Tangible User Interfaces (TUIs) expand the affordances of physical objects, surfaces, andspaces to support a direct interaction with the digital world. As TUIs are limited regardingthe adjustment of the form or properties of physical objects in real time, Ishii et al. proposedtheir new vision of “Radical Atoms” in 2012. In their iceberg metaphor (see Figure 2.1)they describe GUIs as a submerged iceberg that is only controllable remotely, e.g., through amouse, keyboard or a touchscreen. TUIs are described as the tip of iceberg, in which a partof the digital emerges beyond the surface of the water and allows a direct interaction. Thevision of “Radical Atoms” finally assumes a material that “can change form and appearancedynamically, so they are as reconfigurable as pixels on a screen”.
GUI TUI RADICAL ATOMSPAINTEDBITS
TANGIBLEBITS
THE DIGI AL WORLD
THE PHYSICAL WOR D
T
L
Figure 2.1: The iceberg metaphor by Ishii et al. [2012]: from GUIs to TUIs to Radical Atoms.
While physical visualizations could highly benefit from the realization of “Radical Atoms”,this thesis fits into the area of tangible interaction. Hornecker and Buur [2006] broadlysummarize tangible interaction as an approach to designing interactive systems that focuson tangibility and materiality of the interface, physical embodiment of data, whole-bodyinteraction as well as the embedding of the interface and the individual’s interaction in realspaces and contexts. All these points are relevant for the design of physical visualizations,especially the physical embodiment of data. It is worth mentioning that most prototypes inthis area use physical objects for controlling a system (see also Section 4.2 - InformationVisualization & Tangible Interaction) or displaying a specific state of a system, but not forvisualizing abstract datasets.
13

2 Embodied Interaction & Haptic Perception
2.1.2 Embodiment & Embodied Cognition
Dourish [2001] describes embodiment not as a physical reality but as a form of participativestatus and as all the things that are embedded in the world. This applies to a computer screen,a bookshelf but also to spoken conversations. Dourish specifies three ways in which embodi-ment is applicable to the design of interactive systems. First, by highlighting that interactionis intimately connected to the environment in which it occurs, e.g., to make certain kinds ofactivities easier or more difficult. Second, by considering the ways in which computationshapes the world we live in, e.g., is used in different ways for various activities in diversephysical environments. Third, by emphasizing observational techniques that focus on realpeople, in real settings, doing real tasks.
The latter show the link to the philosophical and psychology field of phenomenology, whichis primarily concerned with “how we perceive, experience, and act in the world around us”[Dourish, 2001]. While phenomenology and related theories such as ethnomethodology andits observation methods are only mentioned in passing in this thesis, they motivated theevaluation of projects not only in lab studies but also “in the wild” through field studies[Rogers, 2011] (see for example the field studies within the Activity Sculptures project inChapter 8 or the PopUpData project in Section 7.1).
In the rather large and diverse set of perspectives on embodied interaction, the theories ofembodied cognition (e.g., Wilson [2002]) sees particularly relevant for this thesis. Embod-ied cognition belongs to the theory of distributed cognition [Hollan et al., 2000] and assumesthat thinking is not limited to the brain, but to the entire body and that body parts behavelike cognitive components, that shape in which ways we think (Clark [1996]; Kirsh [1995,1996, 2013]). Interesting for the area of physical visualizations is that besides body partsand body movements, the handling of physical objects and tools can also enhance cognitiveprocesses. Moving an object around, for example, and attending to what that action revealscan encourage considering an idea from a new point of view. Under this assumption “think-ing with things” or physical tools goes beyond off-loading working memory (e.g., Clark andChalmers [1998]). Hollan et al. [2000] describes it as a coordination and cooperation ofinternal processes, such as memory, attention or executive function, and external resources,such as the objects, artifacts, and materials surrounding us.
Kirsh [2013] describes these “cognitively gripped objects” not as tools that simplify or speedup tasks but let us do things we cannot do without them. He further states that these objectschange the ways in which we perceive the world as they affect the way we act and performtasks. Kirsh illustrates his theory with an example of a person who smokes cigarettes andwill, therefore, see most physical environments as filled with things that can act as an ash-tray. Non-smokers are blind to them. Similarly, individual’s skills and experiences willaffect their perception and action in given situations.
By breaking down this theory to the area of physical visualizations, it seems valid to assumethat their physical nature can extend or influence our perception and cognitive process andtherefore, offer a new perspective on the exploration and analysis of data. It is neither the
14
Haptic Perception
goal to replace traditional information visualizations on digital screens with physical visual-ization nor is there the assumption that physical visualizations are “better” than their digitalcounterpart. Physical visualizations are as an additional technique to represent data, andthe purpose of this thesis is rather to explore their strengths and the ways in which physicaland digital visualizations can complement each other. Kirsh [2013], for example, observedprofessional dancers and noticed their ability to engage their various senses. He concludesthat kinesthetic perception reveals different properties than visual perception and that thesekinesthetic properties “make it easier to recognize the validity of inferences that would benear impossible to infer from vision alone if one did not also move the body”.
2.2 Haptic Perception
Terms and descriptions in the area of haptic perception vary between research areas. Mostliterature (e.g., Richter [2013]; Geldard [1972]; Loomis and Lederman [1986]) sub-divideshaptic perception into three physiological concepts: interoception (feeling of internal organs,hunger, internal temperature), proprioception (movement and orientation of the body) andexteroception (tactile perception of surfaces, temperature, and pain on the skin). The “senseof touch” is based on proprioception as well as exteroception [Loomis and Lederman, 1986].The cutaneous subsystem of touch uses sensory information derived from receptors embed-ded in the skin to sense characteristics such as roughness or compliance (tactile perception),thermal qualities (thermoreception) but also pain (nociception) [Richter, 2013]. The kines-thetic subsystem uses receptors embedded in muscles, tendons and joints and enables withlimb movement and position the evaluation of geometric features such as orientation, shape,and size. In addition to these sensory mechanisms, it is important to consider in which waysthe manual exploration of physical objects takes place and which object characteristics andmaterial properties can be explored and identified [Lederman and Klatzky, 1987].
2.2.1 Object and Material Properties
The description and terms of material properties vary between researchers and research fieldsand show a lack of a defined classification, especially for the area of texture. The followinggives a brief overview of the most common physical properties based on literature frompsychophysical and neuroscientific research as well as areas such as architecture or productdesign.
In 1925 Katz (English translation by Katz and Krueger [2013]) already distinguished be-tween two types of surface properties: “Modifikationen (qualities)” and “Spezifikationen(identifying characteristics)”. “Qualities” are described as specific tactile surface featuresand “identifying characteristics” as the overall feel of the surface. Lederman and Klatzky[2009b] split the features of an object into material properties and geometric properties.
15

2 Embodied Interaction & Haptic Perception
While the material properties (e.g., roughness or compliance) are independent of the partic-ular object, the geometric properties describe the structure of the object (e.g., shape or size).In the area of physics, a general characterization is a distinction between intensive and ex-tensive properties [Tolman, 1917; Redlich, 1970]. While extensive properties depend on theamount of material (e.g., mass, length, shape), intensive properties stay the same regardlessof the quantity of matter (e.g., density, color, temperature). In contrast Zuo et al. [2001]differentiate on the one hand between objective and subjective properties and, on the other,hand propose physical-chemical attributes (perceived as e.g., warm, cold, soft, moist) andalso geometric properties regarding the material (perceived as e.g., fine, granular, linear). Inthis section the initial focus will be on the objective properties, which can be controlled andmeasured for study purposes and, therefore, are most studied in the haptics research. Thenless studied physical properties and the area of (perceived) textures will be described.
Roughness: Roughness received the most attention in the field of haptics research. In addi-tion, it seems to be one the most important features for the distinction of haptically exploredsurfaces [Tiest, 2010]. As a physical concept, roughness is the amount of height and widthdifferences on the surface. In manufacturing roughness is together with lay and wavinessone of three main terms to describe a surface texture or surface finish [De Garmo et al.,2011]. While lay indicates the direction of the predominant surface pattern, roughness andwaviness refer to surface irregularities. Roughness is the amount of fine height and widthdifferences on the surface, expressed in micrometers, while waviness describes irregularityof greater spacing, partly referring to the shape.
Perceived roughness seems to be stronger affected by the height differences while the widthhas a smaller effect [Taylor and Lederman, 1975]. The perception of roughness is equalwhether the surface is fixed and the hand moves or vice versa [Lederman and Klatzky,2009b]. Perceived roughness can vary between static and dynamic touch [Hollins and Ris-ner, 2000] and is associated with the spatial and temporal context. Surfaces can be perceivedsmoother or rougher depending on whether a smoother or rougher surface had been previ-ously felt [Kahrimanovic et al., 2009].
Compliance: Compliance is as an umbrella term for physical properties such as elasticity,viscosity or softness, and hardness. Physically it can be expressed by the object’s stiffness,which is defined as the ratio between a force that is on the object and the resulting dis-placement [Tiest, 2010]. This is also influenced by the object’s dimensions, e.g., its shape.Studies found a relationship between perceived hardness and softness and physical stiffnessand showed that softness and hardness are direct opposites [Harper and Stevens, 1964]. Forsoftness perception and discrimination, cutaneous information is both necessary and suf-ficient [Srinivasan and LaMotte, 1996], but kinesthetic force information can influence it[Friedman et al., 2008].
Coldness: The coldness of an object at room temperature is distinct from the object’s tem-perature, which has nothing to do with the material [Tiest, 2010]. Although materials areat room temperature, we can perceive them as “cold”, because of the heat that is being ex-tracted from our body when we touch them. Perceived coldness seems to be directly related
16

Haptic Perception
to the amount of heat extraction [Sarda et al., 2004]. This depends not only on the material’sthermal properties but also on the object’s geometry [Tiest and Kappers, 2008]. While it isclear that coldness can be used to identify different materials, it is not yet possible to givea precise description of the processes that are involved in the perception of coldness [Tiest,2010].
Slipperiness / Friction: When sliding a finger over a surface people can feel clear differencesin resistance for different materials, therefore, perceived slipperiness can be used for hapticmaterial identification [Tiest, 2010]. The perceived slipperiness has a correlation to thefriction of a surface and depends on humidity, force, and speed of movement [Griersonand Carnahan, 2006]. Slipperiness is perceived through a combination of both kinesthetic(forces) and cutaneous (skin stretch) channels [Tiest, 2010]. Movement over the surface isessential for an accurate perception of slipperiness, whereas an action such as picking up anobject can determine slipperiness statically [Grierson and Carnahan, 2006].
Weight: Physically the weight of an object is defined as the force of gravity. Weight can beperceived optimally when the object is actively explored, e.g., by lifting and handling theobject [Lederman and Klatzky, 2009a]. There is an ongoing discussion about the processesinvolved regarding the perceived weight, such as cognitive expectations based on prior ex-perience or the integration of sensory cues regarding the object’s volume [Lederman andKlatzky, 2009b]. It has for example been demonstrated that a small object feels heavier thana large object of the same mass [Charpentier, 1891; Murray et al., 1999]. Similar illusionswere shown for temperature and weight [Stevens, 1979] as well as material and weight [Ellisand Lederman, 1999]. These discrepancies show that the perceived weight depends on awide variety of mechanisms [Lederman and Klatzky, 2009a].
Size and Shape: Size and shape of objects can be considered in various ways. Apart fromthe exact shape of an object, there is also a global shape, which related to the area or volumeof an object. Furthermore, an object can fit within a grasp or extend beyond the grasp and,therefore, also uses kinesthetic input for exploration. Most research has focused on objectlength and width and showed excellent correspondence between the perceived and physicalvalue when the object was held between two index fingers. Contrary research investigatingthe relationship between texture and length of an object, concluded that objects with a finetexture were perceived as being longer than coarse textured objects [Corsini and Pick, 1969].
Research in the area of shape focused most notably on curvature. Humans are capable ofdistinguishing angular differences while the performance depends on cutaneous and kines-thetic input, whose contribution varies with the scale of the curved surface [Lederman andKlatzky, 2009b]. Humans have problems haptically exploring and identifying the shape oflarge objects made of a single material. This is, amongst others, caused by the sequentialnature of haptic manual exploration, which is slow and creates demands on memory andtemporal integration. In general humans process an object not by its global shape but ratherby its local features [Lederman and Klatzky, 2009b].
Orientation: There are a few works that studied the haptic perception of orientation. Exper-iments in which the participants had to position a test bar parallel to a reference bar presented
17

2 Embodied Interaction & Haptic Perception
simultaneously within a planar workspace showed that both vertical and horizontal lines arehaptically perceived better than oblique lines [Lechelt et al., 1976; Lechelt and Verenka,1980]. Furthermore the orientation is influenced by other factors, e.g., the location of thebars within the plane [Lederman and Klatzky, 2009b].
Subjective description of texture: Texture serves as a general term for the visual and tactilequality of a surface and its definition varies regarding research fields such as material scienceor cognitive psychology. Apart from the afore mentioned properties of texture (e.g., rough-ness, compliance, slipperiness) on the objective side, there is also the question in which wayspeople subjectively perceive textures, especially on a not easily quantifiable emotional level[Zuo et al., 2001].
Zuo et al. [2001] found four dimensions in their study about subjective texture perception:geometrical, physical-chemical, emotional, and associative. The first two dimensions standin close relation to the previously listed properties studied in haptic perception. The geo-metrical dimension describes the geometrical configuration of a material surface with termssuch as smooth/rough, plain/bumpy and regular/irregular. The physical-chemical dimen-sion specifies the physical or chemical attributes of a surface with terms such as warm/cold,moist/dry or shining/unshining.
The last two dimensions are unrelated to the quantifiable properties and focus on the indi-vidual “feeling” of a texture. The emotional dimension describes the hedonic and affectivesensations provoked by touching the surface. Most used words in this dimension were com-fortable/uncomfortable, cheerful/dull and elegant/ugly. The associative dimension describesthe most personal characteristics of a surface. This includes, for example, that the perceivermight compare a texture to other materials and existing experiences. Example terms are rub-bery, plastic-like, metallic, leather-like or silky. The characteristic “feeling” of a surface orobject seem to depend on the combination of various properties, rather than on one uniqueproperty [Hollins et al., 1993]. The findings by Zuo et al. [2001] are in line with the resultsof previous studies with similar objectives (e.g., Ohno [1979]; Ozawa et al. [1996]; Tanaka[1998]; Terauchi et al. [1997]; Aoki et al. [1985a,b]).
2.2.2 Manual Exploration
The last subsection described the properties that materials and objects can be made of. Thissubsection gives an introduction whether, and in which ways such properties can be distin-guished by humans. In contrast to the visual sense, in which object recognition happensinternal, and the external observation is restricted to eye fixations and movements, the hapticsense provides a rich domain of external observation [Lederman and Klatzky, 1987]. Hu-mans use stereotypical hand-movement patterns to explore objects and surfaces that Leder-man and Klatzky [1987] classified as exploratory procedures. They found eight exploratoryprocedures by focusing on generally observable movements that are related to the explo-ration of object properties and excluding object-specific actions, e.g., pencil-sharpening.
18

Haptic Perception
Lateral Motion(Roughness)(Slipperiness)
Pressure(Compliance)
Static Contact(Coldness)
Unsupported Holding(Weight)
Enclosure(Global Shape)
(Size)
Contour Following(Global Shape)(Exact Shape)
Function andMotion Test
Figure 2.2: Illustrations of the exploratory procedures and their associated material and objectproperties, adapted and redrawn based on Lederman and Klatzky [2009a].
Lateral motion: Sideways movement, in which skin touches a surface, often a quick back-and-forth movement on a small area. This provides the most precise perception of the textu-ral properties of a surface, including roughness.
Pressure: Applying normal pressure or torque to a surface or part of an object. Often theother hand stabilizes the object or applies opposing pressure. This provides the most preciseperception of properties related to compliance.
Static contact: One hand passively rests on an object while this is supported externally,e.g., by a surface or the other hand. This provides the most precise perception of thermalqualities.
Unsupported Holding: An object is lifted away from a supporting surface and held in thehand without any pressure on the object but often combined with rotating and jiggling. Thisprovides the most precise perception regarding weight.
Enclosure: Simultaneous contact with as much surface of the object as possible by graspingit with the entire hand. Often it is combined with the effort to mold the hand precisely to theobject’s contours or shift the object in the hand(s). This provides the most precise perceptionof an object’s size and general shape.
Contour following: Involves the tracing around an object’s contour. The movement is usu-ally smooth and nonrepetitive and does not occur on a homogeneous surface. This providesthe most precise perception of an object’s size and exact shape.
Function and motion test: These two exploratory procedures are more object-specific thanthe afore mentioned as they describe movements that perform a particular function or the actof making a part of the object move. Both exploratory procedures are often excluded in fol-lowing works as they seem very specific and only applicable when the object has a functionor a moving part. It seems that these characteristics will gain importance for more sophisti-cated physicalizations, that are dynamic or interactive, as these exploratory procedures serveto examine in which ways a physicalization can be used and which functionality it provides.
While all these movements can be described in further detail, especially the area of enclosureor grasping, gained a lot of attention in research, including the field of human-computerinteraction [Wimmer, 2015]. Various definitions and taxonomies have been proposed for
19

2 Embodied Interaction & Haptic Perception
describing grasps (e.g., Feix et al. [2009]; Napier [1956]; Cutkosky and Wright [1986]). Awidely accepted classification of grasps discriminates between power/precision distinction(emphasis on stability or sensitivity), opposition type, thumb position, and involved fingers[Feix et al., 2009]. In the light of physical visualizations, it is worth mentioning that thechoice of grasp in everyday tasks is effected to a greater extent by the task people wantto accomplish than by the size or shape of an object [Cutkosky and Wright, 1986]. Thesame applies to other procedures, as specific movements are chosen for optimally extractingthe desired information [Klatzky et al., 1987]. This leads to the assumption that physicalvisualizations can encode data in various ways, which will still be perceivable by humans ifthey know where and how to look for the underlying information.
2.2.3 Performance, Integration and Interaction
We summarized knowledge on the properties of materials and objects as well as the humancapabilities to explore these characteristics. Physical visualizations are only adopted whenthe exploration and analysis of the underlying data are possible within a reasonable timespan and with suitable precision. Furthermore, physical visualizations rarely consist of onlyone property and are seldom only explored via the sense of touch. They can be explored withall senses, predominantly the visual sense and they can consist of several physical propertiesto map multiple data variables. Therefore, it is important to consider how different physicalbut also visual or auditory properties integrate and interact with each other and influence theperception and performance.
Figure 2.3 shows an illustration by Lederman and Klatzky [2009a] in which they summa-rized exploratory procedures and the most common object properties with three performancecharacteristics:
• Precision of information: Each property has one exploratory procedure that leads togreater accuracy than any other and is therefore considered optimal. Half of the com-binations of exploratory procedures and properties perform the task at above chancelevels (sufficient). For one-third of the combinations the designated exploratory proce-dure results in only chance performance for providing any information about the targetproperty. The contour following procedure is the only one that is classified as neces-sary, as it is the only one to produce above chance performance for the perception ofthe exact shape.
• Breadth of object property information: This performance characteristic describes thenumber of properties which can be perceived through a particular exploratory proce-dure at a rough level. While lateral motion or pressure only offer information abouta few types of properties, enclosure and contour following provide information aboutboth material and geometric object properties.
20
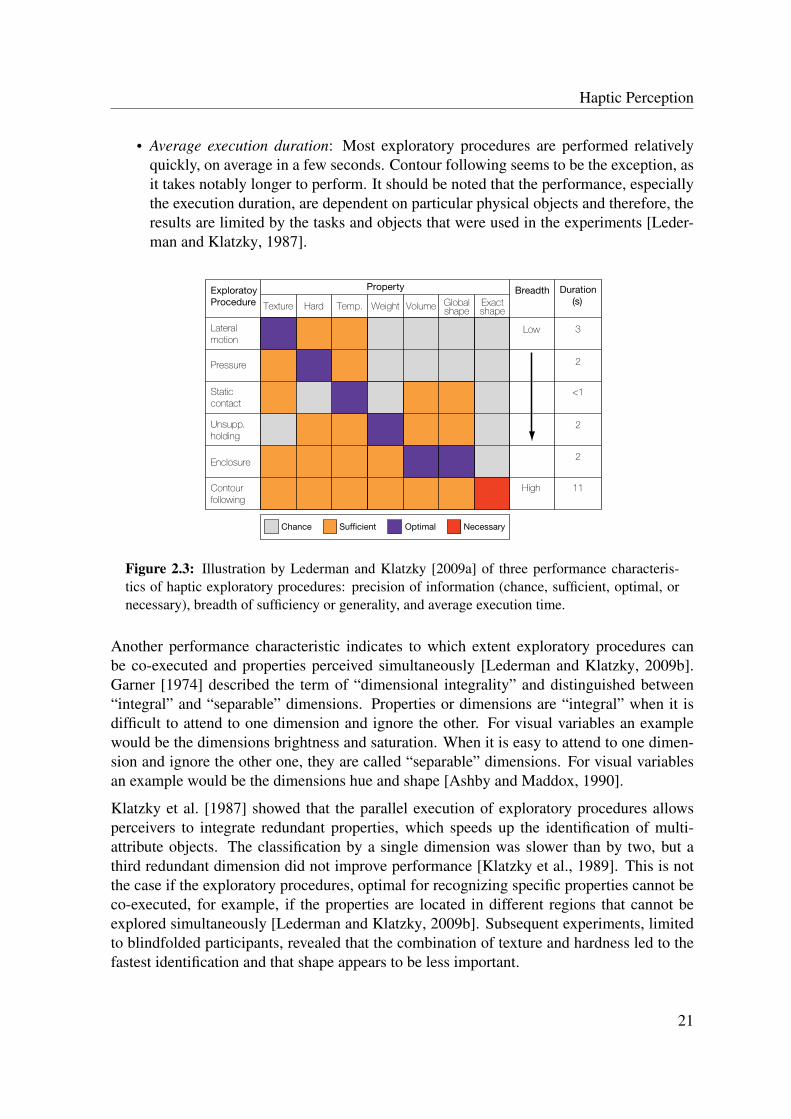
Haptic Perception
• Average execution duration: Most exploratory procedures are performed relativelyquickly, on average in a few seconds. Contour following seems to be the exception, asit takes notably longer to perform. It should be noted that the performance, especiallythe execution duration, are dependent on particular physical objects and therefore, theresults are limited by the tasks and objects that were used in the experiments [Leder-man and Klatzky, 1987].
ExploratoyProcedure
Property Breadth
Low 3
2
11High
2
2
<1
Duration(s)
Lateralmotion
Pressure
Staticcontact
Contourfollowing
Enclosure
Unsupp.holding
Chance Suf�cient Optimal Necessary
Texture Hard Temp. Weight Volume Globalshape
Exactshape
Figure 2.3: Illustration by Lederman and Klatzky [2009a] of three performance characteris-tics of haptic exploratory procedures: precision of information (chance, sufficient, optimal, ornecessary), breadth of sufficiency or generality, and average execution time.
Another performance characteristic indicates to which extent exploratory procedures canbe co-executed and properties perceived simultaneously [Lederman and Klatzky, 2009b].Garner [1974] described the term of “dimensional integrality” and distinguished between“integral” and “separable” dimensions. Properties or dimensions are “integral” when it isdifficult to attend to one dimension and ignore the other. For visual variables an examplewould be the dimensions brightness and saturation. When it is easy to attend to one dimen-sion and ignore the other one, they are called “separable” dimensions. For visual variablesan example would be the dimensions hue and shape [Ashby and Maddox, 1990].
Klatzky et al. [1987] showed that the parallel execution of exploratory procedures allowsperceivers to integrate redundant properties, which speeds up the identification of multi-attribute objects. The classification by a single dimension was slower than by two, but athird redundant dimension did not improve performance [Klatzky et al., 1989]. This is notthe case if the exploratory procedures, optimal for recognizing specific properties cannot beco-executed, for example, if the properties are located in different regions that cannot beexplored simultaneously [Lederman and Klatzky, 2009b]. Subsequent experiments, limitedto blindfolded participants, revealed that the combination of texture and hardness led to thefastest identification and that shape appears to be less important.
21

2 Embodied Interaction & Haptic Perception
The availability and salience of object properties differ when haptic exploration is donewith and without vision. The haptic and visual systems seem to have distinct encodingpathways, in which haptic exploration is oriented towards encoding information about anobject’s texture and material rather than its size or shape [Klatzky et al., 1991]. People’sjudgments of object similarity, for example, differed whether the instructions they were givenwere biased towards visual of haptic exploration, as the latter increased the importance ofmaterial properties [Lederman et al., 1996]. In contrast, vision-based instructions led to anemphasis on shape, which can result in an exclusion of almost every other perceived propertyof an object [Klatzky et al., 1987]. Katz [1925] also stressed the importance of the intentionbehind a haptic exploration, e.g., to perceive material properties or the global shape of anobject. Klatzky et al. [1987] stated that vision does not work as a substitution for touch andthat the two modalities are useful to perceive different aspects of an object. They concludedby describing the role of vision as “providing a preview that is used to determine whetherand when touch should be initiated.”
2.2.4 Haptic Phenomena
In the area of information visualization, visual phenomena such as the very rapid detection ofspecific visual properties (pre-attentive processing) are used to build effective representations(e.g., Munzner [2014]). Designers of visualizations should also be aware of optical illusions,e.g., change blindness. In the area of haptic perception, similar effects relevant in creatingeffective physical visualizations can occur and will therefore, be briefly discussed in thischapter.
Although research in the area of haptic pop-out effects is not as comprehensive as in itsvisual counterpart, there are a few works in this field that have provided evidence for theexistence of a haptic version of the pop-out effect. In information visualization, a pop-outeffect usually describes the effect of that a target element producing a high level of activationwith little influence of distractor elements. Plaisier et al. [2008a] showed that under specificconditions (target item is rough sandpaper, distractor item is fine sandpaper) blindfoldedsubjects only needed a single-hand sweep to detect if a target item was present, which theyinterpret as a haptic version of the pop-out effect. They further showed that search for acube among spheres is more efficient than vice versa [Plaisier et al., 2008b]. A follow-upexperiment looked into haptic search tasks for target and distractor items with various 3Dshapes (cube, sphere, tetrahedron, cylinder, and ellipsoid) and led to the conclusion that suchsearch tasks can be performed very efficiently and that edges and vertices are the most salientfeatures [Plaisier et al., 2009].
Recent work furthermore indicated pop-out effects for properties that are unique to touchsuch as temperature and movable elements. An experiment by Plaisier and Kappers [2010]in which participants reported whether a cold sphere (22°C) was present among warmerones (38°C) showed that cold objects pop out. They concluded that the high saliency of acold item among warm items and the fact that variations in subjects hand temperature did
22

Haptic Perception
not affect the result, which “make temperature differences useful as encoding variables inhaptic interfaces.” Van Polanen et al. [2012] argue that movability is a salient object feature,as their experiments showed that movable objects pop-out between anchored objects. If thetarget was a loose ball, the reaction times were independent of the number of distractors(anchored balls) but increased when the target was the anchored ball. They explain theirresults with shorter hand movement paths and narrower direction distribution as well as ahigher average movement speed of the hand.
Similar to the pop-out effect perceptual illusions involving the haptic system have receivedless focus than its visual counterpart. A thorough overview can be found in a work by Leder-man and Jones [2011], in which they organize tactile and haptic illusions in two categories:illusions related to the haptic space such as the observer’s body and the external space, andillusions related to objects and their properties.
Haptic illusions that are related to the spatial representation of the body generally resultfrom interactions between the perception of temporal and spatial properties [Lederman andJones, 2011]. Most illusions involve distortions of the perceived distance between severalstimuli or the location of tactile or thermal stimulation on the skin of the body. A popularexample, which can also occur for visual and auditory stimuli, is the so-called “tau effect”,which arises when observers have to judge the distance between three consecutive stimuli ina stimulus sequence. The perceived distance between three tactile stimuli is affected by thetime interval of the stimuli and can lead to an overestimation of the spatial distance [Helsonand King, 1931]. Furthermore, the perception of distance is also influenced by the part ofthe body that is stimulated [Anema et al., 2008]. Regarding the localization of stimuli hapticillusion can result in the perception of stimuli at body parts that received no stimulation. Ingeneral, it can be noted, that when “two events occur within certain spatial and temporalbounds, the localization of one event in space or time is influenced by the presence of theother” [Lederman and Jones, 2011].
Corsini and Pick [1969] found that the perceived length of different textures that weremounted on cardboard increased when it was of a smooth texture. Charpentier [1891] in-vestigated that a smaller object is perceived heavier than a larger one, although they hadan identical mass. Interestingly no such size-weight illusion occurred when no visual cuesabout the size of the object were available when it was lifted [Masin and Crestoni, 1988]. Theso-called “golf-ball illusion” by Ellis and Lederman [1998] showed that previous knowledgeand experiences can influence weight perception. Expert golfers perceived real golf balls toweigh less than practice golf balls that have been engineered to be of the same mass. Thiswas not the case for novice golfers. Further illusions regarding the perception of weighthave been found, e.g., that cold objects felt heavier than warm objects (e.g., Weber [1846];Stevens [1979]) and that objects with a rough surface were perceived lighter than those witha smooth surface (e.g., Flanagan et al. [1995]; Rinkenauer et al. [1999]). These variationsin the perception of physical properties “reflect a wide variety of mechanisms, ranging fromlow-level receptor responses all the way to high-level cognitive expectations” [Ledermanand Klatzky, 2009a].
23

2 Embodied Interaction & Haptic Perception
24
Chapter3Digital Fabrication
Digital fabrication enables the participation in the design and creation process of physicalobjects by directly interacting with the hardware and software used for producing these ob-jects. In general, it can be described as the production of material artifacts using computer-controlled tools. Gershenfeld already predicted in 2007 that personal fabricators will becomeaccessible to ordinary people and stressed their impact “because what’s being personalizedis our physical world of atoms rather than the computer’s digital world of bits.” Chris An-derson [2010], the former chief editor of WIRED magazine and the reputable economic andsocial theorist Jeremy Rifkin [2011] called this progress the third industrial revolution, afterthe first typified by the steam-engine and the second embodied through the moving assemblyline.
The relevance for this thesis lies in the rise and accessibility of digital fabrication tech-nologies and the opportunity they create for building and studying the potential of physicalvisualizations in a broader range, for the first time. The following chapter is divided intothe sections of personal fabrication (Section 3.1) and digital fabrication in the area of HCI(Section 3.2). The former confirms that it is reasonable to believe that private persons as wellas companies will soon be able to create and use physical visualizations for various purposesif they provide clear benefits. The latter strengthens this assumption as the growing interestof research projects in the field of digital fabrication, especially in HCI, will simplify the useof digital fabrication machines and specialized software. Additionally, more advanced tech-niques will ease the creation of interactive physical visualizations, e.g., by enabling visualoutput or touch recognition.

3 Digital Fabrication
3.1 Personal Fabrication
Gershenfeld coined the term “personal fabrication” with his work in 1999 and 2007 in whichhe specifies the coming revolution of “personal computers to personal fabrication.” Thisrevolution brings the programmability of the digital world to the physical world. He, there-fore, envisioned personal fabrication not as the production of three-dimensional mechanicalstructures, but as fully functioning systems with the integration of sensing, actuation, logicand display.
A paper by Mota [2011] described “the rise of personal fabrication” and highlighted that“a growing number of individuals now has access to sophisticated production tools andthe knowledge to manufacture objects for artistic, personal or commercial purposes.” Thiswidespread access to digital fabrication technologies will challenge and change traditionalmodels of business, foreign aid, and education [Gershenfeld, 2012]. He argues that a drivinginspiration for the profound human desire to create things is communication. When accessto tools for technological development is achieved, a priority should be “to apply them toaccessing and exchanging information.”
The following section will give an introduction into the currently most common tools andtechniques in the area of digital fabrication, focusing on the tools that were extensively usedin the thesis’ projects. Thereafter relevant application areas that changed or arose throughthe opportunities of digital fabrication, will be discussed.
3.1.1 Tools & Techniques
The first machine in the field of digital fabrication was created at the Massachusetts Insti-tute of Technology (MIT) in 1952 and was a Computer-Numeric Controlled (CNC) millingmachine [Pease, 1952]. Subsequently, a variety of computer-controlled cutting tools havebeen developed, including plasma, lasers, mills (hot-)wires, waterjets or ice particles. Thesetechniques are called subtractive manufacturing as they use a block of material and removeor subtract unnecessary parts until only the desired object remains. They can be further sepa-rated into techniques, in which an actual cutting tool is present, e.g., a CNC milling machine,or not, e.g., a laser cutter. The advantage of an cutting tool with an end, e.g., a mill, is thepossibility of a carefully controlled depth [Gershenfeld, 2007]. In contrast to a beam of lightor a jet of water, it allows to contour precise three-dimensional shapes, with a fine surfacefinish.
In addition to subtractive manufacturing a further principal method for rapid prototypingis called additive manufacturing. The first machine in this field was developed in 1981 byKodama. In contrast to subtractive manufacturing, additive manufacturing fuses layers ofmaterial together to build the object. The machines commonality is a flexible part, e.g., theprinting head in the case of a 3D printer. This part moves on a specific geometrical pathto create the final object. Both methods have their own advantages and are appropriate for
26

Personal Fabrication
different circumstances. Therefore, they are also used in combination, which lead to the termof hybrid manufacturing. Gershenfeld [2012] also stresses that the revolution is not aboutadditive versus subtractive manufacturing, but “the ability to turn data into things and thingsinto data.”
Figure 3.1: Left: the laser cutter Epilog Zing 6030 as an example for subtractive manufacturing.Right: the 3D printer Ultimaker Original as an example for additive manufacturing.
Currently the most common digital fabrication technologies are laser cutters and CNC millsfor subtractive manufacturing and 3D printer for additive manufacturing. Figure 3.1 showsthe laser cutter Epilog Zing 6030 and the 3D printer Ultimaker Original, both used for fabri-cating the prototypes in this thesis. The Epilog Zing 6030 is equipped with a laser wattage of30 watts and enables cutting 2D shapes out of wood and acrylic glass with a thickness of upto one centimeter. Stronger lasers and other techniques can cut thicker and harder materialssuch as metal or granite and more complex models, e.g., through multi-axis cutting [Apro,2008].
Regrading additive manufacturing the American Society for Testing and Materials (ASTM)group “ASTM F42 – Additive Manufacturing” developed seven categories as a standard ter-minology for additive manufacturing technologies [ASTM, 2012]. The Ultimaker Originaluses the Fused Deposition Modeling (FDM) technology, also called Fused Filament Fab-rication (FFF), which was invented by Crump [1991] and is categorized under “materialextrusion.” This technology creates an object by extruding melted material, such as plasticfilament, through a nozzle to form layers as the material hardens immediately after extrusion,comparable to a glue gun.
All these machines have in common, that they create material objects from digital designs,i.e., “turn bits into atoms” [Mota, 2011]. The digital models can be created through the useof software for Computer-Aided Design (CAD) or through the help of 3D scanning (e.g.,Levoy et al. [2000]). There are machines for 2D fabrication, e.g., a laser cutter and 3Dfabrication, e.g., a 3D printer. Accordingly there is CAD software targeted for the design of2D and 3D models. The complexity of professional CAD software is one of the challenges
27
3 Digital Fabrication
to overcome to reach a broader audience for personal fabrication [Mota, 2011]. Gershenfeld[2007] suggest to make a stronger use of humans’ physical capabilities to interact with CADsoftware, i.e., “two hands that work in three dimensions, with eyes to match [instead of] onehand that works in two dimensions.”
Apart from the grade of the digital model, the machine’s capabilities in handling it are themain factors determining the quality of the finished physical object. The individual size ofthe digital fabrication technologies limit the size of the final object. The Ultimaker Original,for example, can produce objects with a volume of up to 223 x 223 x 205 mm. Solutions forthis restriction are a manual or automatic decomposition of the original object into a set ofinterlocking pieces (e.g., Vanek et al. [2014]; Alemanno et al. [2014]). Geometrical precisionand freedom are further challenges, especially if the object is small and delicate. Although itis part of active research (see Subsection 3.2 Digital Fabrication in HCI), it is beyond mostcommercial machine’s capabilities to create objects with various colors or combinations ofmaterial and surface properties. Similarly, fulfilling Gershenfeld’s vision of fabricating anentirely functioning system, e.g., with one print, seem to be a long way ahead.
3.1.2 Maker Movement
Mota [2011] describes the period around 2007 as the starting point towards a democratizationof manufacturing. She explains it with a cultural trend: “a renaissance of the Do-It-Yourself(DIY) movement with a hi-tech facet” [Mota, 2011]. Self-reliance and self-improvementthrough the acquisition of new knowledge and skills are at the basis of this movement. AmySpencer [2005] summarizes that the “enduring appeal of this movement is that anyone canbe an artist or creator. The point is to get involved.” The maker movement or community isa subset of the DIY community, whose members, in particular, create and modify soft- andhardware [Mota, 2011]. The term maker refers to the Make magazine and website1, whichis regarded as the point of when the DIY mindset was brought to technology in 2005.
Another development that helped the community’s popularity was the growing distributionof digital fabrication technologies through the introduction and expansion of FabricationLaboratories (FabLabs) and online fabrication services. The sinking prices of the machines,e.g., personal 3D printers, provided a furthering factor [Mota, 2011]. FabLabs are workshopsequipped with essential fabrication tools such as 3D printers and laser cutters as well asanalog tools such as saws and drills. Their goal is to provide communities around themwith the tools for manufacturing new things, that cannot be found in commercial stores. Thefirst FabLab was set up in 2003 in Boston by Sherry Lassiter and her team from the Centerfor Bits and Atoms (CBA) at MIT [Gershenfeld, 2012]. Towards the end of 2015, the FabFoundation2 already lists 593 FabLabs in 83 countries.
1 http://makezine.com/ (accessed 2015-12-15)2 http://www.fabfoundation.org/ (accessed 2015-12-15)
28

Personal Fabrication
Online services such as Shapeways3 or Ponoko4 provide on-demand 3D printing and lasercutting services to individuals and offer marketplaces for designers to sell their unique ob-jects. An important feature of most of such web-based creators and configurators is theopportunity to customize and personalize the designs and objects. Design studios such asNervous System5 or Kwambio6 use digital fabrication to realize products individualized bythe user, such as jewelry, lighting or vases. The startups Meshu7 and Flying8 use personaldata such as travel routes and turn them into sculpture and jewelry. As Gershenfeld [2012]described, personalization is the “killer app” in digital fabrication, i.e., “producing productsfor a market of one person.”
Online communities, and databases, in which designers and non-designers upload, mod-ify and share models for digital fabrication play a significant role in the rise of the makermovement, in addition to the aforementioned online services. The most prominent of suchplatforms is Thingiverse9, which in 2015 contained almost 450.000 models, ranging fromkitchenware, toys and jewelry to machine parts and architectural models. Members are alsointerested in transforming their personal or abstract data into physical representations. Fig-ure 3.2 shows three examples of physical visualizations, whose source code or data fileswere uploaded by members of the Thingiverse platform.
Figure 3.2: Examples for physical visualizations from Thingiverse. Left: Visualization of a runbased on GPS tracking data by snrk [Thingiverse, 2014a]. Center: 3D bar chart of the incomedistribution by household in the USA by Griffin_Nicoll [Thingiverse, 2011]. Right: Volumetricvisualization of 3D printer sales under 5000 from 2007 through 2013 by WSJ [Thingiverse,2014b]
3 http://www.shapeways.com/ (accessed 2015-12-15)4 https://www.ponoko.com/ (accessed 2015-12-15)5 https://n-e-r-v-o-u-s.com/ (accessed 2015-12-15)6 http://www.kwamb.io/ (accessed 2015-12-15)7 http://meshu.io/ (accessed 2015-12-15)8 http://flyingfrom.to/ (accessed 2015-12-15)9 http://www.thingiverse.com/ (accessed 2015-12-15)
29

3 Digital Fabrication
Although the maker movement “challenge traditional conceptions of the technology user”and lead to “an explosion in both hobbyist and entrepreneurial experimentation”, there isalso a growing awareness of the challenges and dangers regarding digital fabrication tech-nologies [Tanenbaum et al., 2013]. Critical points are safety and quality regulations, e.g.,who is responsible and liable if someone gets injured by objects individuals fabricate them-selves [Mota, 2011]? Other serious questions are the legal implications related to these trendsand technologies, e.g., theft of intellectual property, but also the controversy and threat of 3Dprintable gun files (e.g., Joy [2000]; Greenberg [2015]). Sustainability is another importantaspect, as the simple and quick creation of physical objects may lead to increased waste, po-tentially creating an attitude that regards these objects as disposable and easily replaceable(see also Chapter 8 - Potential for Motivation & Self-Reflection).
3.2 Digital Fabrication in HCI
While the previous section focused on the manufacture of products at home and personaldigital fabrication in general, this section investigates the adoption and distribution of digitalfabrication in research, particularly in the field of HCI. It gives a compact overview of re-search related to HCI on the topic of digital fabrication and the complimentary technologiesthat was published at conferences of the ACM Special Interest Group on Computer-HumanInteraction (SIGCHI) as of September 4th, 2015. Three discrete research categories relatedto digital fabrication were identified using a process of open coding.
The workshop “FAB at CHI” [Mellis et al., 2013] in 2013 confirmed the growing interestand popularity of digital fabrication technology in the CHI community and aimed to explorenew research directions and to reveal in which ways HCI can have a positive impact onthe maker culture. The extended abstract surveys major topics on the relationship betweendigital fabrication and HCI and gives a brief overview of related work. However, this is thefirst specific, systematic and comprehensive literature review of digital fabrication in HCI,including 158 papers.
The following sections explain the method used to find and review relevant literature anddescribe the categories and corresponding subcategories which resulted from the analysis.We conclude with a reflection in which ways these findings can help identify and understandresearch trends regarding the interplay of HCI and digital fabrication, especially for the fieldof physical visualizations.
3.2.1 Method
To identify the relevant papers for this literature review, we used the search string “digitalfabrication” in the ACM Digital Library. This search identified all publications at confer-ences of the ACM SIGCHI as of September 4th, 2015 that have the associated term “digital
30

Digital Fabrication in HCI
fabrication” in any part of the paper. With this method, we were able to include articles that,despite not using the particular term “digital fabrication” in the content of the document,referenced corresponding work.
Figure 3.3: Representative photos of the most cited papers of each of the main categories fromour analysis. Digital fabrication technologies are used as a tool, e.g., to create physical visual-izations [Jansen et al., 2013] (left), being enhanced through software or hardware modifications,e.g., by building a user interface for sketching one’s own chair [Saul et al., 2011a] (center) orstudied in the wild, e.g., by investigating in which ways the technology is adopted [Buechleyand Hill, 2010] (right).
As this single search term may have overlooked a number of relevant papers (e.g., papersthat only mention a specific technology and not the broader term), we further searched forpapers with a phrasing of “3D print”, “laser cut” or “CNC mill” in the title or abstract. Welimited the search for these terms to the title and abstract as we wanted to focus on papers inwhich the use of a digital fabrication technology played a significant role. It should be notedthat this search method still excluded work that was published outside of the ACM DigitalLibrary.
Our search resulted in 178 papers that were published between 2006 and 2015. In a first,manual analysis we removed 11% (19) of the papers that were not relevant to our literaturereview. Most of these papers were identified by the first full-text search for “digital fabrica-tion” and referenced an article with the term in its title. Others mentioned the term brieflyin the introduction or future work section. These papers were discarded whenever the actualtopic of the work had no association to digital fabrication and did not use any correspondingtechnologies.
In the next step, we performed an iterative open coding [Anselm and Corbin, 1998] on theremaining 159 papers to identify different categories of research. We grouped papers basedon a similar general topic and also looked at the paragraphs that included one of the searchterms in more detail in order to identify the context in which the terms were used.
31

3 Digital Fabrication
3.2.2 Quantitative Overview
Figure 3.4 shows the number of papers from 2009 to 2015 that used the term “digital fabri-cation” or named corresponding technologies, sorted by conferences. The main conferenceswere the ACM Conference on Human Factors in Computing Systems (CHI), ACM Confer-ence on Tangible, Embedded, and Embodied Interaction (TEI), ACM Symposium on UserInterface Software and Technology (UIST), ACM Conference on Designing Interactive Sys-tems (DIS), ACM Conference on Creativity & Cognition (C&C) and ACM Conference onInteraction Design and Children (IDC), which in total accounted for 86% or 136 of the 158papers (see also Figure 3.5-left). In “Other” we summarized papers published at DESIRE,ACE, OzCHI, NordiCHI, ICMI, UbiComp, LAK, BodyNets, ITS, CSCW, PerDis, ASSETS,and SUI. Please note that our search did not include the proceedings of UIST 2015 and thatDIS was a biannual event until 2016.
We only found one paper before 2009 that mentioned desktop fabrication techniques such as3D printing and laser cutting [Song et al., 2006] which was published at UIST 2006 (note thatwe excluded this paper in Figure 3.4 and 3.5 to enhance readability). A paper at the doctoralconsortium at C&C [Mainstone, 2009] and a work-in-progress at CHI [Villalon et al., 2009]document the first use of the term “digital fabrication” in the field of HCI research in 2009.
The stacked area charts in Figure 3.4 show that TEI 2010 and 2011 seem to be the pioneeringconferences for research in the field of digital fabrication while UIST started to pick up thistrend in 2012. In 2013, the interest started in the CHI community, and 2014 can be seenas the year in which digital fabrication became a “mainstream” topic by almost tripling theamount of papers published at CHI compared to the year before (2013: 6; 2014: 17). Also,the setback of publications at TEI 2014 (2013: 6; 2014: 3; 2015: 11) might be attributed to arethinking phase, because this area of research was outgrowing its “niche existence”. Giventhe small absolute numbers, this is speculative and might also simply be noise in the data.
Another minor trend can be recognized by the use of the generic term “digital fabrication”and specific fabrication technologies. In recent years more specific terms such as “personalfabrication” (e.g., Lau et al. [2013]; Mota [2011], see also Section 3.1 - 3.1) or “interactivefabrication” (e.g., Gardiner et al. [2011]; Mueller et al. [2012]; Willis et al. [2011]) arose andwere used instead of the more generic term “digital fabrication”. An interesting observationwas that while these newer terms were defined and referenced in the papers, the term “digitalfabrication” seemed to be considered general knowledge by then.
The growing popularity of digital fabrication and corresponding technologies becomes ap-parent through two keynotes [Gross, 2013; Blikstein, 2014] including the term as well asthe ongoing increase of published papers in 2015. The CHI conference, for example, hadan increase of 9 papers in digital fabrication alone (2014: 17; 2015: 26), while the overallnumber of articles only increased by 21 (2014: 465; 2015: 486). The high number of 13workshop/tutorial/studio papers [Alexander et al., 2015; Cangiano and Fornari, 2014; Diezand Posada, 2013; Krannich et al., 2012; Lau et al., 2013; Leduc-Mills et al., 2013, 2012;Mellis et al., 2013; Mueller et al., 2014b; Sarik et al., 2012; Saul et al., 2011b, 2013; Young
32
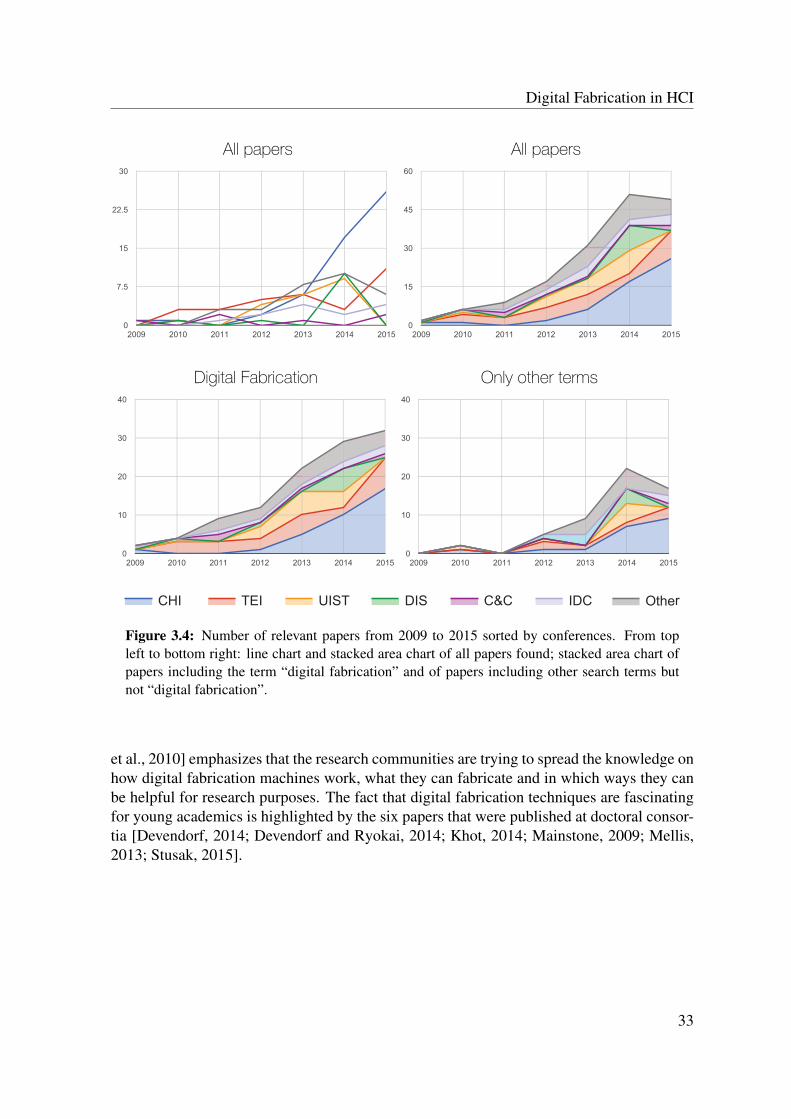
Digital Fabrication in HCI
2009 2010 2011 2012 2013 2014 20150
15
30
45
60
2009 2010 2011 2012 2013 2014 20150
10
20
30
40
2009 2010 2011 2012 2013 2014 20150
10
20
30
40
2009 2010 2011 2012 2013 2014 20150
7.5
15
22.5
30
rOtheIDCCC&DISUISTTEICHI
All papers All papers
Digital Fabrication Only other terms
Figure 3.4: Number of relevant papers from 2009 to 2015 sorted by conferences. From topleft to bottom right: line chart and stacked area chart of all papers found; stacked area chart ofpapers including the term “digital fabrication” and of papers including other search terms butnot “digital fabrication”.
et al., 2010] emphasizes that the research communities are trying to spread the knowledge onhow digital fabrication machines work, what they can fabricate and in which ways they canbe helpful for research purposes. The fact that digital fabrication techniques are fascinatingfor young academics is highlighted by the six papers that were published at doctoral consor-tia [Devendorf, 2014; Devendorf and Ryokai, 2014; Khot, 2014; Mainstone, 2009; Mellis,2013; Stusak, 2015].
33
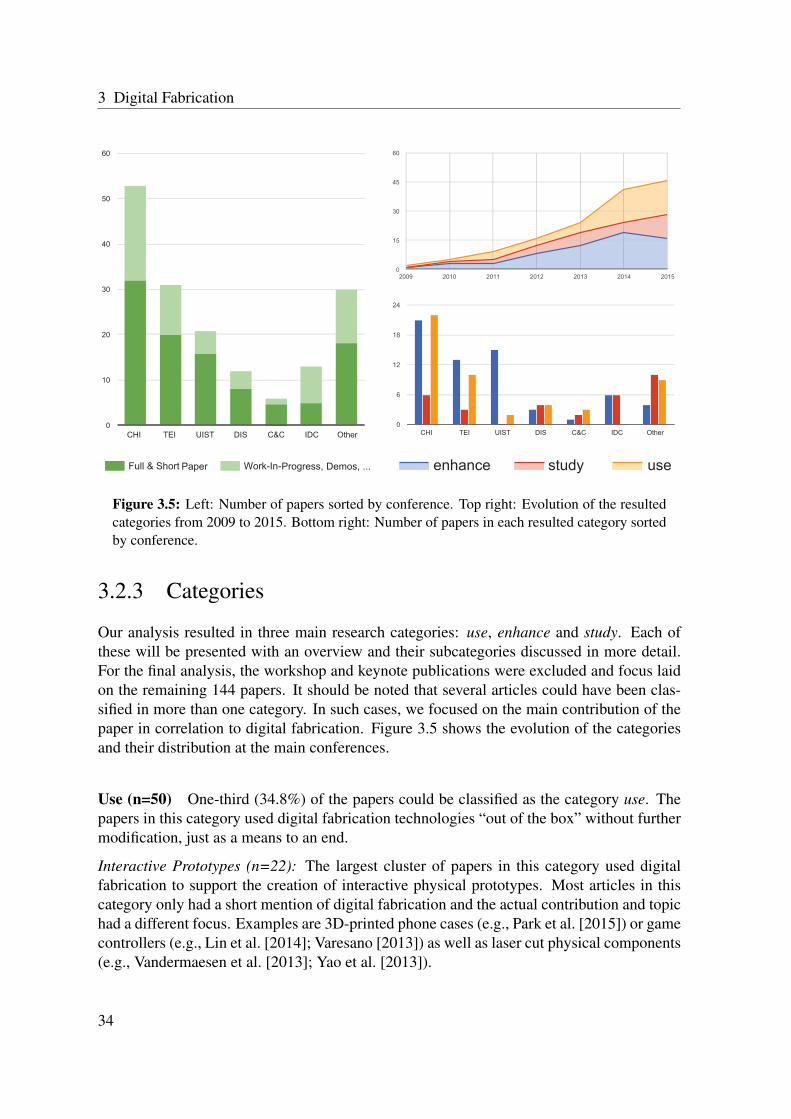
3 Digital Fabrication
2009 2010 2011 2012 2013 2014 2015
15
30
45
60
0
Work-In-Progress, Demos, ...Full & Short Paper
0
10
20
30
40
50
60
CHI TEI UIST DIS C&C IDC Other
studyenhance use
CHI TEI UIST DIS C&C IDC Other0
6
12
18
24
Figure 3.5: Left: Number of papers sorted by conference. Top right: Evolution of the resultedcategories from 2009 to 2015. Bottom right: Number of papers in each resulted category sortedby conference.
3.2.3 Categories
Our analysis resulted in three main research categories: use, enhance and study. Each ofthese will be presented with an overview and their subcategories discussed in more detail.For the final analysis, the workshop and keynote publications were excluded and focus laidon the remaining 144 papers. It should be noted that several articles could have been clas-sified in more than one category. In such cases, we focused on the main contribution of thepaper in correlation to digital fabrication. Figure 3.5 shows the evolution of the categoriesand their distribution at the main conferences.
Use (n=50) One-third (34.8%) of the papers could be classified as the category use. Thepapers in this category used digital fabrication technologies “out of the box” without furthermodification, just as a means to an end.
Interactive Prototypes (n=22): The largest cluster of papers in this category used digitalfabrication to support the creation of interactive physical prototypes. Most articles in thiscategory only had a short mention of digital fabrication and the actual contribution and topichad a different focus. Examples are 3D-printed phone cases (e.g., Park et al. [2015]) or gamecontrollers (e.g., Lin et al. [2014]; Varesano [2013]) as well as laser cut physical components(e.g., Vandermaesen et al. [2013]; Yao et al. [2013]).
34

Digital Fabrication in HCI
Data-Driven Material Representations (n=17): In contrast to the previous subcategory thefabricated physical prototypes in these publications are based on abstract data. There issome work that focuses on the evaluation of efficient and effective physical visualizations(e.g., Brown and Hurst [2012]; Jansen et al. [2013]; Stusak et al. [2015]), as well as moreexploratory approaches such as personalized souvenirs (e.g., Nissen and Bowers [2015]; Nis-sen et al. [2014]) or the visualizations of physical activity through engravings in leather [Leeet al., 2015], thermoplastics [Khot et al., 2014] or even chocolate [Khot et al., 2015a].
Explore Possibilities (n=11): Papers in this subcategory focused on digital fabrication, butused standard technology and aimed at exploring their possibilities and finding their lim-itations. Examples are fabricating do-it-yourself electronic products (e.g., Mellis [2013];Mellis and Buechley [2014]; Mellis et al. [2011]), exploring design challenges with 3Dprinting technology [Vázquez et al., 2015] as well as analyzing the potential of digital fabri-cation technologies for crafting [Tsaknaki et al., 2014] and product development processesin general [Beaudette et al., 2014].
Enhance (n=63) The biggest group of papers found (43.75%) dealt with enhancing theway, individuals interact with digital fabrication technologies. Please note that several ar-ticles in this category could have been classified into more than one subcategory. In suchcases, we tried to identify the primary focus of the project.
Graphical User Interfaces (n=14): This subcategory includes all papers that developednovel GUI to interact with digital fabrication machines. Most of them had the general goalto simplify the use of digital fabrication technologies for novice users (e.g., Agrawal et al.[2014]; Hurst and Kane [2013]; Jacobs and Buechley [2013]; Saul et al. [2011a]) while somehad more concrete use cases such as the fabrication of physical visualizations [Swaminathanet al., 2014a], the construction of architectural models [Villalon et al., 2009] or enablingthe design of expressive 3D models [Torres and Paulos, 2015]. Others tried to improve theactual fabrication process with suitable interfaces that helped to increase object fabricationspeed [Beyer et al., 2015; Mueller et al., 2014] or assisted users in packing tasks for manu-facturing [Saakes et al., 2013].
Non-Graphical User Interfaces (n=22): A large number of papers explored new ways ofinteracting with digital fabrication technologies that go beyond the classical graphical inter-face. The most popular direction is called Interactive Fabrication and allows real-time inputto fabricate physical forms [Follmer et al., 2010; Mueller et al., 2013, 2012, 2013; Peng et al.,2015b; Shen et al., 2013; Willis et al., 2011; Zoran et al., 2013]. Tangible input devices wereused to develop systems for children and novice users [Follmer and Ishii, 2012; Huang andEisenberg, 2012; Leduc-Mills and Eisenberg, 2011; Leduc-Mills et al., 2012; Te, 2015] andalso more experienced ones [Schneegass et al., 2014; Weichel et al., 2015; Yamamoto et al.,2014]. Others experimented with gestural [Johnson et al., 2012; Song et al., 2006; Williset al., 2010] and bare hand input [Gannon et al., 2015; Zheng, 2015].
35
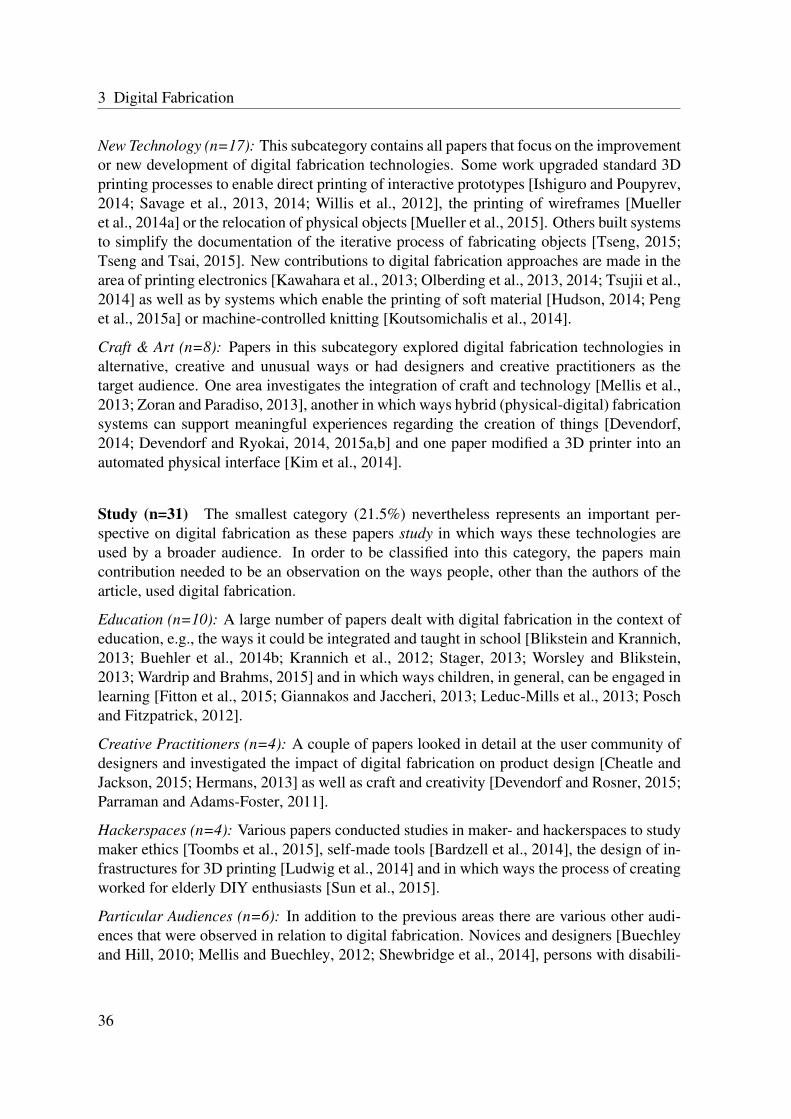
3 Digital Fabrication
New Technology (n=17): This subcategory contains all papers that focus on the improvementor new development of digital fabrication technologies. Some work upgraded standard 3Dprinting processes to enable direct printing of interactive prototypes [Ishiguro and Poupyrev,2014; Savage et al., 2013, 2014; Willis et al., 2012], the printing of wireframes [Muelleret al., 2014a] or the relocation of physical objects [Mueller et al., 2015]. Others built systemsto simplify the documentation of the iterative process of fabricating objects [Tseng, 2015;Tseng and Tsai, 2015]. New contributions to digital fabrication approaches are made in thearea of printing electronics [Kawahara et al., 2013; Olberding et al., 2013, 2014; Tsujii et al.,2014] as well as by systems which enable the printing of soft material [Hudson, 2014; Penget al., 2015a] or machine-controlled knitting [Koutsomichalis et al., 2014].
Craft & Art (n=8): Papers in this subcategory explored digital fabrication technologies inalternative, creative and unusual ways or had designers and creative practitioners as thetarget audience. One area investigates the integration of craft and technology [Mellis et al.,2013; Zoran and Paradiso, 2013], another in which ways hybrid (physical-digital) fabricationsystems can support meaningful experiences regarding the creation of things [Devendorf,2014; Devendorf and Ryokai, 2014, 2015a,b] and one paper modified a 3D printer into anautomated physical interface [Kim et al., 2014].
Study (n=31) The smallest category (21.5%) nevertheless represents an important per-spective on digital fabrication as these papers study in which ways these technologies areused by a broader audience. In order to be classified into this category, the papers maincontribution needed to be an observation on the ways people, other than the authors of thearticle, used digital fabrication.
Education (n=10): A large number of papers dealt with digital fabrication in the context ofeducation, e.g., the ways it could be integrated and taught in school [Blikstein and Krannich,2013; Buehler et al., 2014b; Krannich et al., 2012; Stager, 2013; Worsley and Blikstein,2013; Wardrip and Brahms, 2015] and in which ways children, in general, can be engaged inlearning [Fitton et al., 2015; Giannakos and Jaccheri, 2013; Leduc-Mills et al., 2013; Poschand Fitzpatrick, 2012].
Creative Practitioners (n=4): A couple of papers looked in detail at the user community ofdesigners and investigated the impact of digital fabrication on product design [Cheatle andJackson, 2015; Hermans, 2013] as well as craft and creativity [Devendorf and Rosner, 2015;Parraman and Adams-Foster, 2011].
Hackerspaces (n=4): Various papers conducted studies in maker- and hackerspaces to studymaker ethics [Toombs et al., 2015], self-made tools [Bardzell et al., 2014], the design of in-frastructures for 3D printing [Ludwig et al., 2014] and in which ways the process of creatingworked for elderly DIY enthusiasts [Sun et al., 2015].
Particular Audiences (n=6): In addition to the previous areas there are various other audi-ences that were observed in relation to digital fabrication. Novices and designers [Buechleyand Hill, 2010; Mellis and Buechley, 2012; Shewbridge et al., 2014], persons with disabili-
36
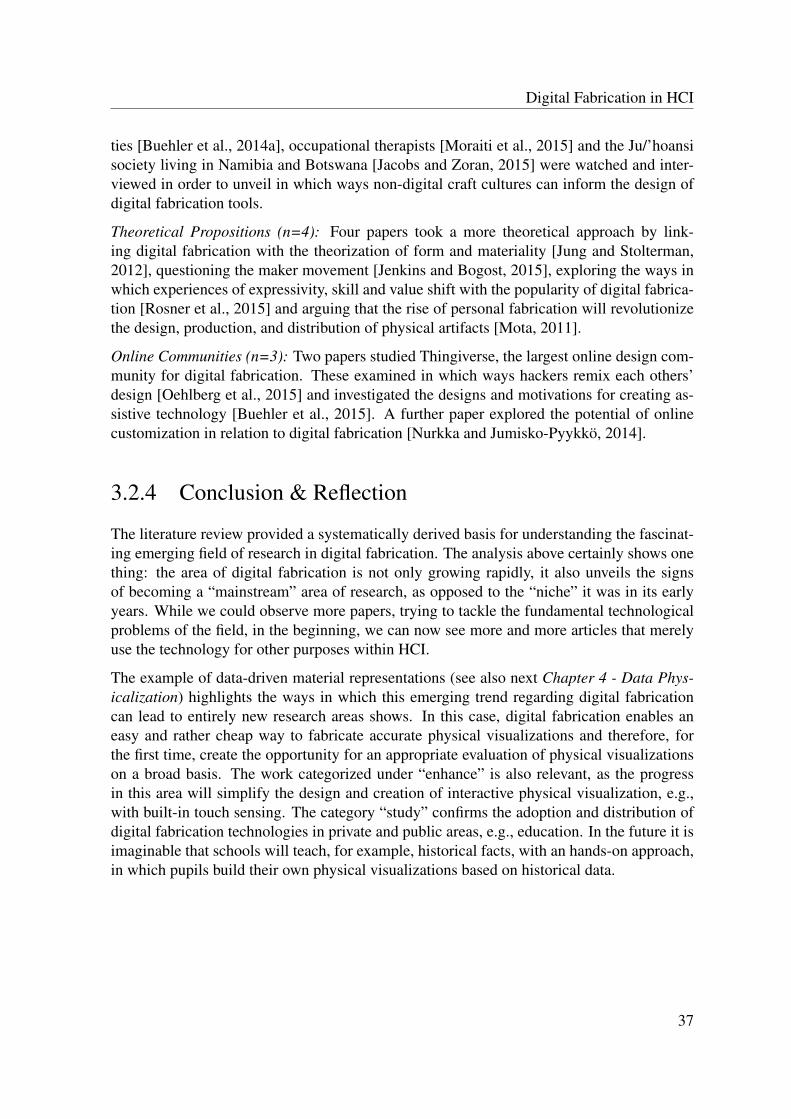
Digital Fabrication in HCI
ties [Buehler et al., 2014a], occupational therapists [Moraiti et al., 2015] and the Ju/’hoansisociety living in Namibia and Botswana [Jacobs and Zoran, 2015] were watched and inter-viewed in order to unveil in which ways non-digital craft cultures can inform the design ofdigital fabrication tools.
Theoretical Propositions (n=4): Four papers took a more theoretical approach by link-ing digital fabrication with the theorization of form and materiality [Jung and Stolterman,2012], questioning the maker movement [Jenkins and Bogost, 2015], exploring the ways inwhich experiences of expressivity, skill and value shift with the popularity of digital fabrica-tion [Rosner et al., 2015] and arguing that the rise of personal fabrication will revolutionizethe design, production, and distribution of physical artifacts [Mota, 2011].
Online Communities (n=3): Two papers studied Thingiverse, the largest online design com-munity for digital fabrication. These examined in which ways hackers remix each others’design [Oehlberg et al., 2015] and investigated the designs and motivations for creating as-sistive technology [Buehler et al., 2015]. A further paper explored the potential of onlinecustomization in relation to digital fabrication [Nurkka and Jumisko-Pyykkö, 2014].
3.2.4 Conclusion & Reflection
The literature review provided a systematically derived basis for understanding the fascinat-ing emerging field of research in digital fabrication. The analysis above certainly shows onething: the area of digital fabrication is not only growing rapidly, it also unveils the signsof becoming a “mainstream” area of research, as opposed to the “niche” it was in its earlyyears. While we could observe more papers, trying to tackle the fundamental technologicalproblems of the field, in the beginning, we can now see more and more articles that merelyuse the technology for other purposes within HCI.
The example of data-driven material representations (see also next Chapter 4 - Data Phys-icalization) highlights the ways in which this emerging trend regarding digital fabricationcan lead to entirely new research areas shows. In this case, digital fabrication enables aneasy and rather cheap way to fabricate accurate physical visualizations and therefore, forthe first time, create the opportunity for an appropriate evaluation of physical visualizationson a broad basis. The work categorized under “enhance” is also relevant, as the progressin this area will simplify the design and creation of interactive physical visualization, e.g.,with built-in touch sensing. The category “study” confirms the adoption and distribution ofdigital fabrication technologies in private and public areas, e.g., education. In the future it isimaginable that schools will teach, for example, historical facts, with an hands-on approach,in which pupils build their own physical visualizations based on historical data.
37

3 Digital Fabrication
38

Chapter4Data Physicalization
The term Data Physicalization was introduced by Jansen et al. [2015] in 2015. Hence, thistype of data representation is rather new and cannot look back onto a huge scope of researchand related work. Yet, related fields evolved in parallel inspiring the work in the area ofdata physicalization such as embodied and tangible interaction (see Chapter 2 - EmbodiedInteraction & Haptic Perception) or digital fabrication (see Chapter 3 - Digital Fabrication).Additionally data representations in material form have a long history and were used espe-cially in the time before the desktop computer era. Examples of early artifacts that encodedata are briefly described in Section 4.1 - History of Physical Data Representations.
Another important related area is the well-established research field of InfoVis, which sharesthe common goal of studying data representations of abstract data, while focusing on the vi-sual sense. Physical visualizations have so far received little attention in the field of InfoVis.Relevant projects are at the interplay of InfoVis and tangible interaction, which mainly focuson the interaction with InfoVis systems through tangibles. Examples of such prototypes arepresented in Section 4.2 - Information Visualization & Tangible Interaction.
Finally, the last and central section of this chapter describes physicalization as a new researchfield. Its strong connection and overlap to previous research done in InfoVis, especially re-garding the process of creating a visualization, is demonstrated through the physicalizationpipeline. Ultimately, we will give an overview of the related work in the field of data physi-calization that has been done thus far.
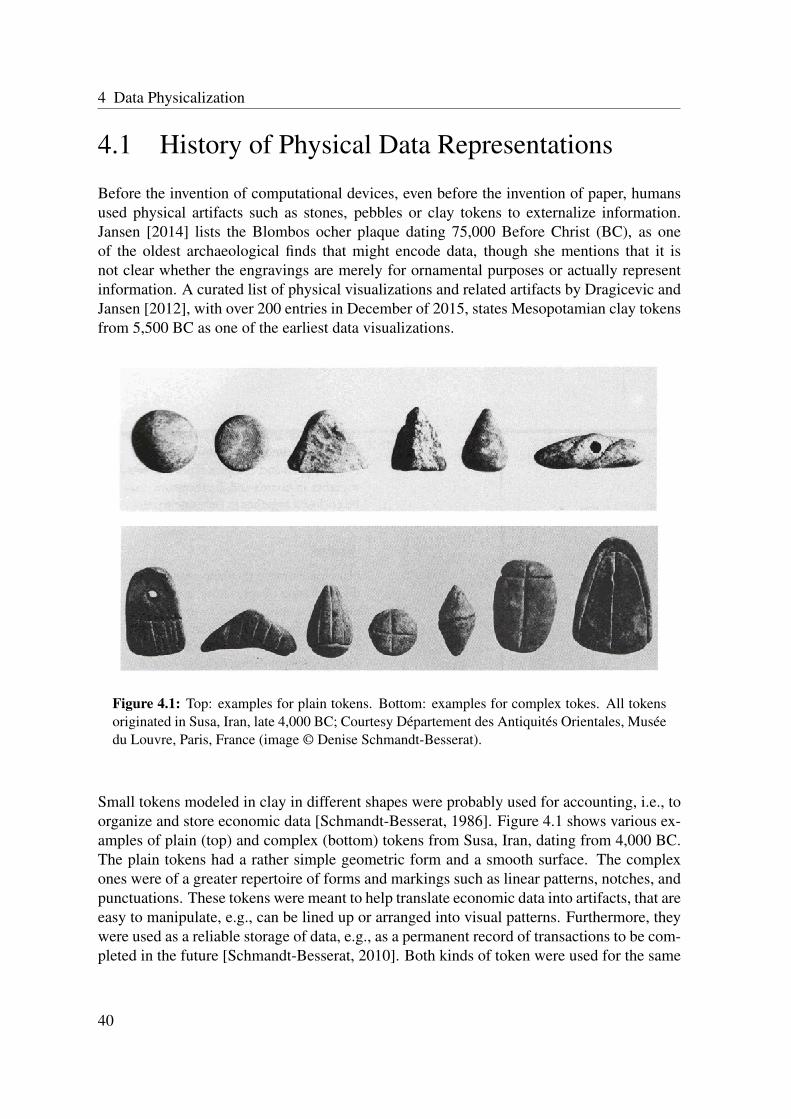
4 Data Physicalization
4.1 History of Physical Data Representations
Before the invention of computational devices, even before the invention of paper, humansused physical artifacts such as stones, pebbles or clay tokens to externalize information.Jansen [2014] lists the Blombos ocher plaque dating 75,000 Before Christ (BC), as oneof the oldest archaeological finds that might encode data, though she mentions that it isnot clear whether the engravings are merely for ornamental purposes or actually representinformation. A curated list of physical visualizations and related artifacts by Dragicevic andJansen [2012], with over 200 entries in December of 2015, states Mesopotamian clay tokensfrom 5,500 BC as one of the earliest data visualizations.
Figure 4.1: Top: examples for plain tokens. Bottom: examples for complex tokes. All tokensoriginated in Susa, Iran, late 4,000 BC; Courtesy Département des Antiquités Orientales, Muséedu Louvre, Paris, France (image © Denise Schmandt-Besserat).
Small tokens modeled in clay in different shapes were probably used for accounting, i.e., toorganize and store economic data [Schmandt-Besserat, 1986]. Figure 4.1 shows various ex-amples of plain (top) and complex (bottom) tokens from Susa, Iran, dating from 4,000 BC.The plain tokens had a rather simple geometric form and a smooth surface. The complexones were of a greater repertoire of forms and markings such as linear patterns, notches, andpunctuations. These tokens were meant to help translate economic data into artifacts, that areeasy to manipulate, e.g., can be lined up or arranged into visual patterns. Furthermore, theywere used as a reliable storage of data, e.g., as a permanent record of transactions to be com-pleted in the future [Schmandt-Besserat, 2010]. Both kinds of token were used for the same
40

History of Physical Data Representations
reckoning device, but the plain tokens represented products of a farm while the complex to-kens referred to goods manufactured in workshops. Schmandt-Besserat [2010] summarizesthat tokens “translated concrete information into abstract markings, removed the data fromtheir context, separated the knowledge from the knower, and increased objectivity.”
Another example of an ancient recording and visualization system is the quipu also knownas khipu, which was used by the Incas starting around 3,000 BC [Jansen, 2014]. A quipuconsists of a collection of threads of varying length, knots and color (see Figure 4.2). It isstill unclear whether quipu was a communication and information artifact or just a mnemonicdevice, which triggers the memory of a person. As an information tool, they were meant toencode signs in a defined way which was shared and known by a group of people [Beynon-Davies, 2009]. Research assumes that the Inka administrative system used quipus to syn-thesize, manipulate and transfer tribute and census data between different accounting levels[Urton and Brezine, 2005]. The encoding is based on the construction of the thread (e.g.,material or color), the placement of threads upon other threads as well as the structure of theknots and their placement upon the threads [Beynon-Davies, 2009].
Figure 4.2: Example of quipus from the Inca Empire (image © Wikimedia Commons).
With the invention of paper around 100 BC, it became the favored medium to externalizeinformation. In the mid-eighteenth and early nineteenth centuries, the first graphical methodsfor displaying data emerged. The work by Playfair [1786, 1801] is credited as the earlieststatistical graphics, already including line graphs, bar charts, and pie graphs. Humans stillused physical representations to externalize information. One example is the fabrication ofphysical models of atoms and molecules (see Figure 4.3). In the mid-1950s, one of themany challenges regarding protein structures was finding ways to represent these visually.Apart from drawing the structures, scientists carved structures out of balsa wood, engraveddata onto transparent plastic sheets and used rulers and plumb lines for further exploration[Everts, 2013]. The picture at the center of Figure 4.3 is a nice example in which waysphysical objects or in this case models, can enhance the thinking process (see also Subsection2.1.2 Embodiment & Embodied Cognition). The complex structure of the molecule becamemore accessible to Perutz and his team as they were able to manipulate the model physically[Jansen, 2014].
41

4 Data Physicalization
Figure 4.3: Examples of physical models of atoms and molecules structures. Left: Spiral peri-odic table designed by Sir William Crookes and constructed in 1898 by his assistant:, Gardiner(image © Museum of History of Science, Oxford). Center: Model of hemoglobin created bybiochemist Max Perutz in 1968 (image © Life Sciences Foundation). Right: Electron densitymap and model of Penicillin fabricated by Dorothy Crowfoot Hodgkin in 1945 (image © ScienceMuseum, London).
It is worth mentioning that the previous examples are models, i.e., reproductions of real ob-jects, typically at a different scale or with a different level of abstraction [Jansen, 2014].A visualization on the other hand includes the process of visual mapping (see also Subsec-tion 4.3.2 Physicalization Pipeline), i.e., assigning visual variables such as color or positionto data attributes [Chi, 2000]. Figure 4.4 shows three examples of historical physical vi-sualizations that ran through the process of visual mapping. The left image shows a three-dimensional curve of the 1935 electricity load of the Detroit Edison Company. Each woodenslice represents one day and each day was split into 30 min intervals. The image in the centershows a physical flow chart created with a cosmograph consisting of one thousand strips ofpaper. By clamping strips of paper into position and inserting wedge and bar spacers be-tween them, various data flows could be visualized. The right image visualizes the carriedpassengers on the street-car lines of Frankfurt am Main, Germany. Strips of wood, alter-nately black and white, are glued on top of each other along the streets having a car line.Each of the wooden strips represents 4.000 passengers carried on the lines in 24 hours.
4.2 Information Visualization & Tangible Interac-tion
The approaches and ideas of the tangible interaction research field (see Subsection 2.1.1Ubiquitous Computing & Tangible Interaction) partially entered the area of InfoVis [Leeet al., 2012]. Jansen [2014] divides visualization systems using tangible elements roughlyinto the categories of tangible controllers and tangible displays. This section lists variousprojects of both groups to give an illustration in which ways tangible interaction was used inthis domain.
42
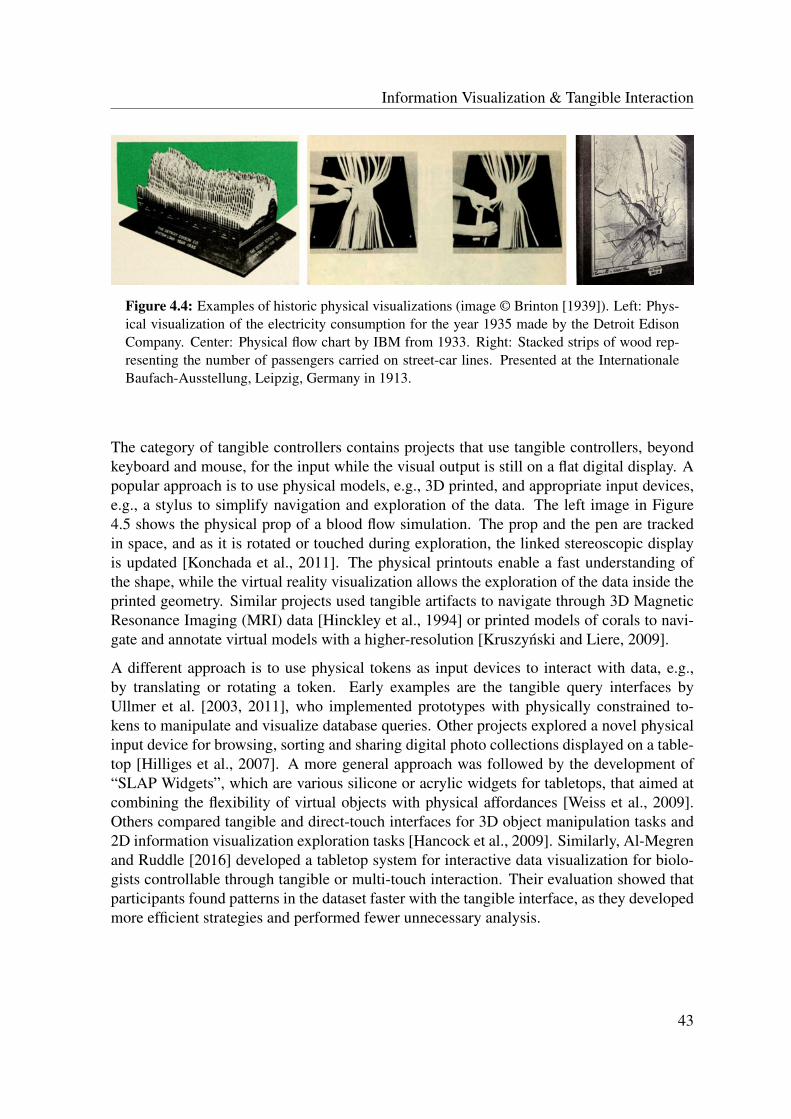
Information Visualization & Tangible Interaction
Figure 4.4: Examples of historic physical visualizations (image © Brinton [1939]). Left: Phys-ical visualization of the electricity consumption for the year 1935 made by the Detroit EdisonCompany. Center: Physical flow chart by IBM from 1933. Right: Stacked strips of wood rep-resenting the number of passengers carried on street-car lines. Presented at the InternationaleBaufach-Ausstellung, Leipzig, Germany in 1913.
The category of tangible controllers contains projects that use tangible controllers, beyondkeyboard and mouse, for the input while the visual output is still on a flat digital display. Apopular approach is to use physical models, e.g., 3D printed, and appropriate input devices,e.g., a stylus to simplify navigation and exploration of the data. The left image in Figure4.5 shows the physical prop of a blood flow simulation. The prop and the pen are trackedin space, and as it is rotated or touched during exploration, the linked stereoscopic displayis updated [Konchada et al., 2011]. The physical printouts enable a fast understanding ofthe shape, while the virtual reality visualization allows the exploration of the data inside theprinted geometry. Similar projects used tangible artifacts to navigate through 3D MagneticResonance Imaging (MRI) data [Hinckley et al., 1994] or printed models of corals to navi-gate and annotate virtual models with a higher-resolution [Kruszynski and Liere, 2009].
A different approach is to use physical tokens as input devices to interact with data, e.g.,by translating or rotating a token. Early examples are the tangible query interfaces byUllmer et al. [2003, 2011], who implemented prototypes with physically constrained to-kens to manipulate and visualize database queries. Other projects explored a novel physicalinput device for browsing, sorting and sharing digital photo collections displayed on a table-top [Hilliges et al., 2007]. A more general approach was followed by the development of“SLAP Widgets”, which are various silicone or acrylic widgets for tabletops, that aimed atcombining the flexibility of virtual objects with physical affordances [Weiss et al., 2009].Others compared tangible and direct-touch interfaces for 3D object manipulation tasks and2D information visualization exploration tasks [Hancock et al., 2009]. Similarly, Al-Megrenand Ruddle [2016] developed a tabletop system for interactive data visualization for biolo-gists controllable through tangible or multi-touch interaction. Their evaluation showed thatparticipants found patterns in the dataset faster with the tangible interface, as they developedmore efficient strategies and performed fewer unnecessary analysis.
43

4 Data Physicalization
“Facet-Streams” by Jetter et al. [2011], which is shown in the right image in Figure 4.5, com-bined approaches of tangible controllers and tangible displays. While tangible controllersonly expand the control of a visualization system into the physical world, tangible displaysrepresent systems in which controls and displays are closely connected [Jansen, 2014], e.g.,through projections and touch interaction. “Facet-Streams” used circular glass discs as to-kens to materialize co-located collaborative search on an interactive tabletop. While thetokens primarily served as input devices, they were also used for data or settings storage andtheir transparent appearance allowed an augmentation with content and functionality. Theirstudies revealed that the prototype allowed a great variety of search strategies as well as col-laboration styles and that the participants perceived the use as a fun and social experience.
Figure 4.5: Left: Interface that combines physical 3D prototypes with complementary virtualreality visualizations of the data inside the printed geometry [Konchada et al., 2011]. Center andRight: “Facet-Streams” uses tangible tokens to materialize collaborative search on interactivetabletops [Jetter et al., 2011].
The left image in Figure 4.6 shows the urban planning tool “Urp” by Underkoffler and Ishii[1999]. In this application physical, architectural models can be placed on a table surface andare augmented with projected forms, such as shadows or wind flow. By moving the tangibles,it is possible to explore different alternatives of urban planning and to simulate effects ofchanges in real-time. The center image of Figure 4.6 displays the project “Tangible Views”by Spindler et al. [2010]. With lightweight displays that can be moved through the physicalspace on or above a tabletop, this introduced new ways of visualizing and directly interactingwith information by no longer restricting the interaction to the display surface alone. Theauthors concluded that their system enables a direct mapping of classical InfoVis techniquessuch as focus+context or overview+detail and that the bimanual interaction provides excitingalternatives to traditional desktop interfaces. Based on this Spindler et al. [2012] developedthe concept of “Tangible Windows” which allows the interaction with 3D information spacesby combining tangible interaction, head tracking and multi-touch.
A fascinating area of research in which physical visualizations could serve as applicationscenario is the field of shape displays (e.g., Leithinger et al. [2011, 2015, 2014]; Rasmussenet al. [2012]). The right image in Figure 4.6 shows the “inFORM” by Follmer et al. [2013],a state-of-the-art shape display, which offers variable stiffness rendering and real-time userinput through direct touch and tangible interaction. As the image demonstrates simple data
44
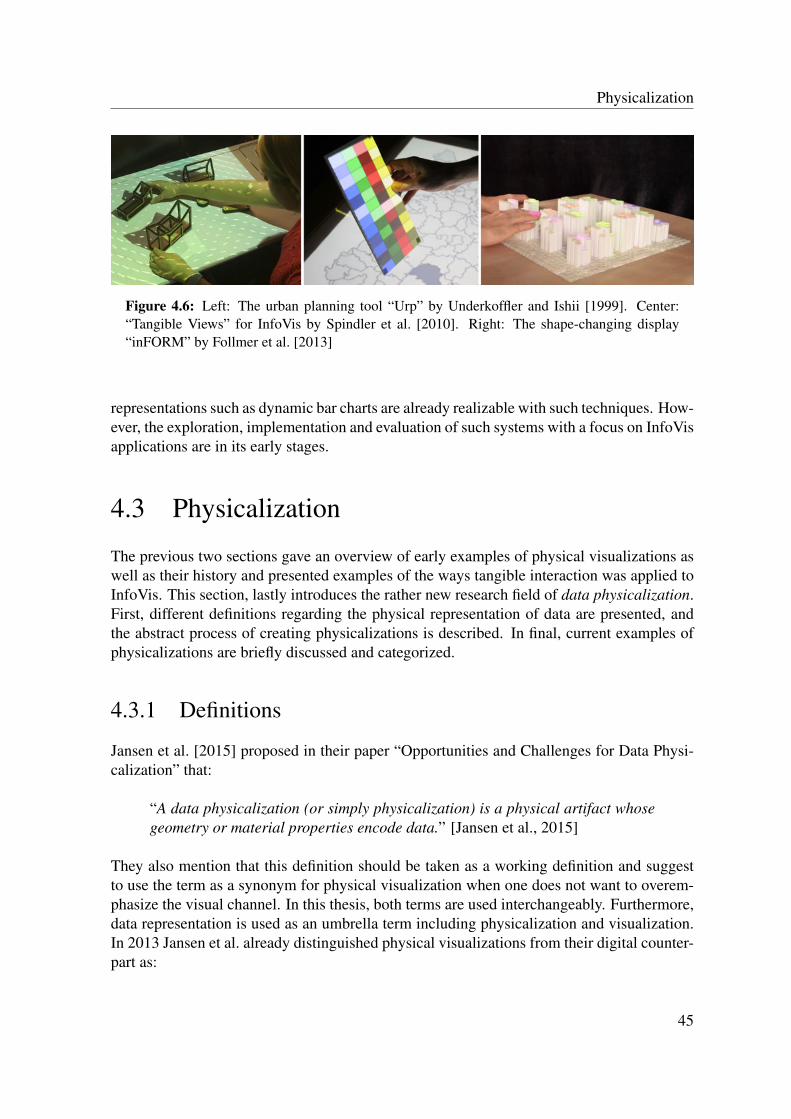
Physicalization
Figure 4.6: Left: The urban planning tool “Urp” by Underkoffler and Ishii [1999]. Center:“Tangible Views” for InfoVis by Spindler et al. [2010]. Right: The shape-changing display“inFORM” by Follmer et al. [2013]
representations such as dynamic bar charts are already realizable with such techniques. How-ever, the exploration, implementation and evaluation of such systems with a focus on InfoVisapplications are in its early stages.
4.3 Physicalization
The previous two sections gave an overview of early examples of physical visualizations aswell as their history and presented examples of the ways tangible interaction was applied toInfoVis. This section, lastly introduces the rather new research field of data physicalization.First, different definitions regarding the physical representation of data are presented, andthe abstract process of creating physicalizations is described. In final, current examples ofphysicalizations are briefly discussed and categorized.
4.3.1 Definitions
Jansen et al. [2015] proposed in their paper “Opportunities and Challenges for Data Physi-calization” that:
“A data physicalization (or simply physicalization) is a physical artifact whosegeometry or material properties encode data.” [Jansen et al., 2015]
They also mention that this definition should be taken as a working definition and suggestto use the term as a synonym for physical visualization when one does not want to overem-phasize the visual channel. In this thesis, both terms are used interchangeably. Furthermore,data representation is used as an umbrella term including physicalization and visualization.In 2013 Jansen et al. already distinguished physical visualizations from their digital counter-part as:
45

4 Data Physicalization
“Traditional visualizations map data to pixels or ink, whereas physical visual-izations map data to physical form.” [Jansen et al., 2013]
They argue that physicalization aligns with neologisms such as sonification and haptifica-tion but without favoring one particular sense. They further suggest to distinguish betweendata physicalization as a data-driven physical artifact, data physicalization as the process ofproducing physicalizations, i.e., to physicalize means to give data a physical shape and DataPhysicalization as a research area (with capitalization to amplify when referencing to theresearch field). Jansen et al. [2015] propose to think of Data Physicalization:
“a research area that examines how computer-supported, physical represen-tations of data (i.e., physicalizations), can support cognition, communication,learning, problem solving, and decision making.” [Jansen et al., 2015]
It is worth mentioning that the use of a computer, either for the creation of the physicaliza-tion or their actuation, is explicitly referred to in this description. Jansen et al. [2015] high-light that new developments in digital fabrication, actuated tangible interfaces, and shape-changing displays (see also previous chapters) are a driving force behind the emerging re-search field of Data Physicalization. While research in these areas, from new theories totechnological advancements, will be important both for the creation and design of physical-izations it is important to mention their focus distinctions, in particular regarding TUIs. TUIsfocus on information input and manipulation tasks, whilst Data Physicalization focuses oninformation output and exploration tasks [Jansen et al., 2015].
In addition to the research field of TUI, Data Physicalization has a strong relation to thedomain of InfoVis and SciVis. Common goals and approaches (see also next Subsection4.3.2 Physicalization Pipeline) are the use of a computer-supported external representation toenhance humans’ cognitive abilities to analyze and explore data [Card et al., 1999]. One keydifference is that Data Physicalizations does not explicitly focus on the visual channel butalso on haptic, audio, smell or taste [Jansen et al., 2015]. Another is that Data Physicalizationexcludes representations on flat visual displays if the geometry or material properties of thescreen surface do not encode data. Jansen et al. [2015] stress that in Data Physicalization“the focus is on the physicality of data representation, not on the physicality of interaction.”
It is worth mentioning that Andrew Vande Moere started in 2008 with a thorough review ofdata sculptures (e.g., Vande Moere [2008]; Vande Moere and Offenhuber [2009]; Vande Mo-ere and Patel [2010]), a sub-category of physicalizations. Jansen et al. [2015] describes suchdata sculptures as artifacts that are “built by artists and designers who seek to elicit emotionsand convey meaning beyond mere data.” Zhao and Vande Moere [2008] define data sculp-tures as “a data-based physical artifact, possessing both artistic and functional qualities,that aims to augment a nearby audience’s understanding of data insights and any sociallyrelevant issues that underlie it.” The left graphic in Figure 4.7 displays the a model devel-oped by Zhao and Vande Moere [2008] for physical representation of data. They identified
46

Physicalization
InfoVis, TUIs, visualization art, and interactive art as relevant areas of research for datasculptures. The model is defined by the attributes “focus”, which spans between artistic andfunctional, and “manifestation”, which distinguishes between virtual and physical. To cate-gorize types of data sculptures Zhao and Vande Moere [2008] further proposed a conceptualmodel of embodiment, in which they took into account both the “metaphorical distance fromdata” and the “metaphorical distance from reality” (see right graphic in Figure 4.7).
Figure 4.7: Model of physical representation of data (left) and embodiment in data sculptures(right) by Zhao and Vande Moere [2008].
Jansen et al. [2015] further proposed a research agenda for Data Physicalization and splitopen research questions in four main themes:
• Designing Physical Data Representations: To understand in which ways data canbe conveyed effectively, it is necessary to develop a design space for physical datarepresentations, to investigate the perceptual effectiveness of different approaches andto generate suitable processes to implement specific designs.
• Supporting Animation and Interactivity: Dynamic physicalizations could allow thereusability across datasets and support analytical and communication tasks. Again itis inevitable to explore the ways in which dynamic physicalizations can be realizedand what designs are effective.
• Application-Specific Challenges: Identification of application areas in which physi-calizations bring immediate benefit in relation to their creation costs and efforts.
• Evaluation-Specific Challenges: Development of evaluation methodologies that avoidexperimental bias and allow a fair comparison, in particular against their intensivelyresearched digital counterpart.
47
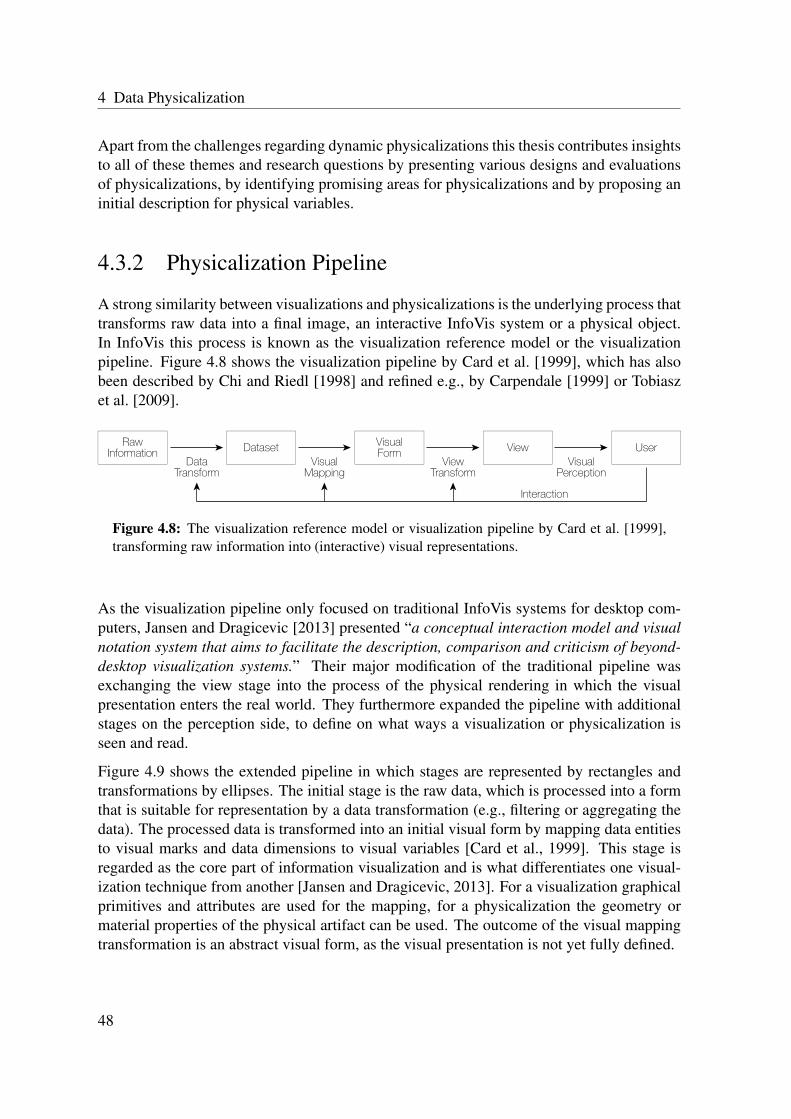
4 Data Physicalization
Apart from the challenges regarding dynamic physicalizations this thesis contributes insightsto all of these themes and research questions by presenting various designs and evaluationsof physicalizations, by identifying promising areas for physicalizations and by proposing aninitial description for physical variables.
4.3.2 Physicalization Pipeline
A strong similarity between visualizations and physicalizations is the underlying process thattransforms raw data into a final image, an interactive InfoVis system or a physical object.In InfoVis this process is known as the visualization reference model or the visualizationpipeline. Figure 4.8 shows the visualization pipeline by Card et al. [1999], which has alsobeen described by Chi and Riedl [1998] and refined e.g., by Carpendale [1999] or Tobiaszet al. [2009].
RawInformation
DataTransform
Dataset
Interaction
View UserVisualForm
VisualMapping
ViewTransform
VisualPerception
Figure 4.8: The visualization reference model or visualization pipeline by Card et al. [1999],transforming raw information into (interactive) visual representations.
As the visualization pipeline only focused on traditional InfoVis systems for desktop com-puters, Jansen and Dragicevic [2013] presented “a conceptual interaction model and visualnotation system that aims to facilitate the description, comparison and criticism of beyond-desktop visualization systems.” Their major modification of the traditional pipeline wasexchanging the view stage into the process of the physical rendering in which the visualpresentation enters the real world. They furthermore expanded the pipeline with additionalstages on the perception side, to define on what ways a visualization or physicalization isseen and read.
Figure 4.9 shows the extended pipeline in which stages are represented by rectangles andtransformations by ellipses. The initial stage is the raw data, which is processed into a formthat is suitable for representation by a data transformation (e.g., filtering or aggregating thedata). The processed data is transformed into an initial visual form by mapping data entitiesto visual marks and data dimensions to visual variables [Card et al., 1999]. This stage isregarded as the core part of information visualization and is what differentiates one visual-ization technique from another [Jansen and Dragicevic, 2013]. For a visualization graphicalprimitives and attributes are used for the mapping, for a physicalization the geometry ormaterial properties of the physical artifact can be used. The outcome of the visual mappingtransformation is an abstract visual form, as the visual presentation is not yet fully defined.
48

Physicalization
Figure 4.9: The extended visualization pipeline by Jansen and Dragicevic [2013].
A fully-specified visual presentation, which can be displayed, printed or fabricated, isreached after the presentation mapping. This transformation includes operations such as spe-cialization (e.g., applying scaling functions), styling (e.g., assigning free visual variables),optimization (e.g., graph layout or matrix reordering), and decoration (e.g., gridlines, legendsor captions). Jansen and Dragicevic [2013] describe the output of the presentation mappingas a complete visual specification which can be thought of as a bitmap image, an interactivevisualization, or a 3D model in a computer implementation. The final transformation bringsthe visual presentation into existence in the physical world and therefore perceivable by hu-mans. The physical presentation is defined as a physical object or apparatus that makes thevisualization or physicalization observable, e.g., by displaying it on a digital screen, printingit on paper or presenting it on a shape display or as a 3D printed artifact.
The left side of Figure 4.9 shows the rough process of how physical presentations are readand used. The percept transformation defines the ways in which the physical presentationbecomes a percept, i.e., what an observer sees at a specific point in time. This transformationis outside of the visualization pipeline control and is influenced by the observer and environ-mental factors, e.g., position of the observer or light conditions. The percept is transformedinto a visual mental model by integrating previous percepts, e.g., different perspectives onthe presentation. Finally, information is extracted from the visual mental model which is
49

4 Data Physicalization
defined by the decoding and insight formation. Decoding requires an understanding of thevisual mapping and refers to the extraction of data values. Combining the gathered informa-tion and putting it into context can eventually lead to new insights.
The importance of the visualization pipeline for this thesis becomes evident when looking atthe descriptions of the single projects. All prototypes passed through the individual stagesof the pipeline, starting from the raw data, determining the visual mapping and finally creat-ing the physical artifact. By evaluating the various physicalizations, this thesis furthermoreprovides insights in which ways physicalizations are used and perceived.
4.3.3 Examples for Physicalizations
The previous sections described historic examples of physical data representations, in whichways TUIs were used for InfoVis systems and presented definitions for physicalizations aswell as their creation process. This subsection lists current examples of physicalizationsand associated projects, particularly those with a research background. A primary classifica-tion for physicalizations is to differ between static and dynamic data representations [Jansenet al., 2015]. As dynamic physicalizations are yet rather uncommon, the following projectsare roughly categorized into pragmatic and aesthetic or artistic purposes [Kosara, 2007].While the goal of a pragmatic physicalization is to explore, analyze, or present informationin an efficient way, artistic physicalizations are often not recognizable as such, and the un-derlying data is not readable by an observer. Furthermore, artistic data physicalizations seekto elicit emotions and convey meaning beyond the pure data [Jansen et al., 2013] and havea strong relationship to Casual InfoVis [Pousman et al., 2007]. There is a smooth transitionbetween these two categories, and various projects can be placed in between, as physical-ization with an artistic intent can still be informative (e.g., Skog et al. [2003]; Holmquistand Skog [2003]). Therefore, the projects are further grouped inspired by approaches fromInfoVis systems. Examples are a differentiation based on the underlying data (e.g., personal,scientific), the skills of the target audience (e.g., novice, savvy, expert) or their goals (e.g.,exploration, analysis, communication) [Heer et al., 2008].
Likely, the most popular category of physicalizations is the field of data sculptures (see alsosubsection 4.3.1 Definitions). Andrew Vande Moere studied these types of physicalizationsthoroughly, e.g., by analyzing a large collection of prototypes developed by design students[Vande Moere and Patel, 2009]. They proposed a representational fidelity, to describe theworks as symbolic, iconic or indexical. For symbolic representations (Figure 4.10-left) thedata-mapping has to be learned, while indexical representations (Figure 4.10-right) have adirect relationship between the data and the physical artifact. Iconic representations (Figure4.10-center) lie in between those two and often convey a metaphorical relationship.
A couple of recent projects with both aesthetic and pragmatic purposes focused on the rep-resentation of activity data. Khot et al. [2014] presented the “SweatAtoms” system whichtransformed physical activity data based on heart rate into 3D printed artifacts (see Figure4.11-left). The data influenced the shape and size of the artifacts. A field study showed that
50

Physicalization
Figure 4.10: Examples of Data Sculptures: symbolic (left), iconic (center), and indexical (right)sculptures created by design students in a two-week assignment [Vande Moere and Patel, 2009].
Figure 4.11: Examples of physicalizations encoding activity data. Left: The “SweatAtoms”system transforms physical activity data into 3D printed artifacts [Khot et al., 2014]. Right: The“Patina Engraver” system engraves patina-like patterns on a wristband according to a partici-pant’s activity logs [Lee et al., 2015].
the artifacts made participants more conscious about their involvement in physical activityand revealed participants’ different levels of engagemnt with the artifacts (see also Khot et al.[2013]; Khot [2014]; Khot and Mueller [2013]; Khot [2013]). Lee et al. [2015] developedthe “Patina Engraver” system which engraves patina-like patterns on a wristband of an ac-tivity tracker according to a participant’s activity logs (see Figure 4.11-right). More activityresulted in more aesthetic patterns with less noise. A field trial showed that the system had amotivational effect as participants increased their exercise effort to receive aesthetic patterns.It also triggered spontaneous social interactions in face-to-face situations.
While the previous two systems focused on the visual and haptic sense, the projects “Tasty-Beats” and “EdiPulse” had the approach to design palatable representations of physical activ-ity. “TastyBeats” by Khot et al. [2015a,b] is a fountain-based interactive system that createsa sport drink based on the heart rate data of physical activity (see Figure 4.12-left). The heartrate values were mapped to water with different flavors, colors and electrolyte supplements.The palatable representation increased the awareness of participants regarding their physicalactivity, and the prepared drink served as a hedonic reward that motivated participants to
51

4 Data Physicalization
Figure 4.12: Examples of palatable physicalizations encoding activity data. Left: The “Tasty-Beats” system mixes a sport drink based on heart rate data of physical activity [Khot et al.,2015b]. Right: The “EdiPulse” system 3D prints personalized messages and emoticons accord-ing to physical activity data [Khot et al., 2015a].
exercise more. The “EdiPulse” system by Khot et al. [2015b,a] followed a similar approach,but instead of a drink produced 3D printed chocolates (see Figure 4.12-right). The data-mapping is rather abstract as the heart rate data only influences the thickness of the printedletters and emoticons. The system was not evaluated, but the authors believe it will moti-vate and inspire participants to exercise differently or try out new forms to receive variousoccurrences of 3D printed chocolates.
The following projects are still in the interplay of artistic and pragmatic physicalizations butfollow a different approach as the previous described examples as they try to highlight thecontext between the data and how and where it is perceived. Zhu et al. [2015] argue that thereis often a “major disconnect between the medium of information representation and whatthe information is being represented about.” In their “Data-Objects” project they evaluatedthe effect of providing information about an object’s impact on an individual by physicallyembedding such information on that object itself. Figure 4.13-left shows two prototypes ofData-Objects phone cases which display data on the heart rate of the owner through heightand roughness variations on the case surface. The authors argue that such a representationimproves the understanding of the effects of using an object and that the physical presenceensures that people are more conscious of the data. Koeman [2014] proposes a similar ideawith her domestic data sculptures that represent personal data in everyday artifacts for thehome.
Nissen investigated the ways in which personalized souvenirs based on experience data canenrich an audience’s encounter with cultural events [Nissen et al., 2014; Nissen and Bowers,2015]. One example is a museum visitor’s wristband (see Figure 4.13-center), the shape ofwhich is mapped to the individual answers given in a questionnaire. Visitors also took anactive part in the souvenir-making activity for an additional individualization. The studiesshowed that physical artifacts facilitate social interaction and reflection upon activities andexperiences. Taylor et al. [2015] introduced the concept of “data-in-place” in which theyexplored the ways in which the production and use of data are connected to a place, both
52

Physicalization
Figure 4.13: Examples of Data-Objects. Left: “Data-Objects” phone cases which represent theheart rate data while a person used the phone through height and roughness variations on thecase surface [Zhu et al., 2015]. Center: Personalized souvenir for a museum visitor as the shapeof the wristband is mapped to the experience data of the visitor [Nissen et al., 2014]. Right:Physical bar graph displays community data in the environment where it was collected [Reganet al., 2015].
regarding physical and social geography. Physicalizations were used in a playful way ofestablished representations such as pie charts and bar graphs (see Figure 4.13-right). Theyhighlight the need to feed data back into the environment in which it was collected, intothe existing social and communication infrastructures of a community. They also recom-mend that such physicalizations should be responsive to the environments in which they areinstalled [Regan et al., 2015].
Another category of projects focused on physicalizations that encode data through multipleor non-traditional modalities. The “Physikit” system by [Houben et al., 2016] representsenvironmental data through ambient physicalizations using various modalities such as light,vibration, movement, and air flow (see Figure 4.14-left). The results of a field study showedthat participants developed an increased sense of the meaning of the data and customizedthe ambient physicalizations to fit their home decor. Barrass [2011, 2012] experimentedwith the idea of physical sonification by transforming acoustic dataforms into the shapesof bells. As the produced tones of the bells are perceptibly different from each other, heconcluded that these could provide useful information about the underlying dataset. Theright image in Figure 4.14 shows the usage of the crossmodal data-driven artifact “H3” byHogan and Hornecker [2013]. It represents live data streams of hydrogen levels in deep spaceusing haptic-auditory feedback. Observations of visitors of a space observatory indicatethat this kind of representation engaged visitors, and felt more real and less abstract thanpurely graphical representations. In a previous study, they had found clues that the modalityand modality combinations used to represent data can influence the experience [Hogan andHornecker, 2012].
Roberts and Walker [2010] encouraged the InfoVis community to develop a unified theorythat covers all human senses and allows the integration of multiple modalities. They furtherforesee visualizations beyond the desktop, which use different modalities to both perceiveand interact with information as “the next big thing” [Roberts et al., 2014]. Data representa-
53

4 Data Physicalization
Figure 4.14: Examples of physicalizations using multiple modalities. Left: The “Physikit”system represents data through ambient physicalizations using various modalities such as light,vibration, movement, and air flow [Houben et al., 2016]. Right: Visitor of a space observatoryuses the “H3” device to perceive live data streams of hydrogen levels in deep space throughhaptic-auditory feedback [Hogan and Hornecker, 2013].
tions that use additional senses to the visual one do not only influence the experience but canalso be beneficial for the understanding and analysis of the underlying data as the followingprojects in the field of more pragmatic physicalizations demonstrate.
Data representations in a physical form found early applications as an affordable and acces-sible solution for the target audience of people with limited or no vision. Vasconcellos [1991,1996], for example, explored the introduction of cartographic concepts through tactile mapsand Griffin [2001] developed a haptic variable syntax for the representation of geographicinformation. Rowell and Ungar [2003a,b] did a thorough review of projects in this area. Abroader analysis, that also included networks or images was done by Panëels and Roberts[2010]. Most of these systems used external haptic interfaces or devices, e.g., the PHAN-ToM (e.g., Massie and Salisbury [1994]; McGookin and Brewster [2007]; Yu and Brewster[2003]). Apart from simpler approaches, such as the corkboard construction technique (seeFigure 4.15-left), representing data for the visually impaired, researchers recently started toexperiment with 3D printing technologies. Brown and Hurst [2012] developed the VizTouchsoftware in a user-centered design, which allows the easy generation of 3D printable filesof physical line graphs (see Figure 4.15-center). Visually impaired participants were ableto read and understand the data being represented. Hu [2015] explored new paradigms for3D printed physical bar graphs by including guidelines or invisible textures, to increase theaccessibility of more complex charts (see Figure 4.15-right).
SciVis is another field in which various projects have been experimenting with physicalrepresentations. As in SciVis spatial representation is given [Munzner, 2008] and the fo-cus lies on 3D phenomena [Friendly and Denis, 2001], e.g., medical or biological, the useof 3D artifacts seems nearby. Again the emergence of 3D printing motivated researchersto investigate the ways this technology can be used to represent and interact with scien-tific data (e.g., Bailey [2005]; Gillet et al. [2005]). Both pictures on the left of Figure 4.16show a hemoglobin molecule with surface coloring to display electrical charges and a flex-
54

Physicalization
Figure 4.15: Examples of physicalizations for visually impaired. Left: Line graph constructedon a corkboard [McGookin et al., 2010]. Center: 3D printed line graph created with the Viz-Touch software [Brown and Hurst, 2012]. Right: 3D printed bar graphs with guidelines andtextures [Hu, 2015].
ible model of DNA with magnets representing hydrogen bond donors and acceptors. Themost common approach is to use such physical models to interact with computer models astangible interfaces (see also Section 4.2 Information Visualization & Tangible Interaction).Similar approaches aimed at teaching school children about graph theory through a tangibleconstruction kit [Schweikardt et al., 2009] or enhancing the understanding of statistical datathrough the creation of physical objects [Gwilt et al., 2012]. Physical models are also used toteach and illustrate geometry and mathematics (e.g., Segerman [2012]; Knill and Slavkovsky[2013a]). One example is the “drinkable Archimedes proof” (see Figure 4.16-right, for thedigital and physical model). The spherical reservoir at the top can be filled with water, whichthen drips down into the complement of a cone in a cylinder at the bottom. By getting filledwith water it demonstrates that both, the volume of the spherical reservoir and the cone in acylinder, match [Knill and Slavkovsky, 2013b].
Figure 4.16: Examples of physicalizations for SciVis. Left: Hemoglobin molecule with surfacecoloring to display electrical charges [Bailey, 2005]. Center: Flexible model of DNA withmagnets representing hydrogen bond donors and acceptors [Gillet et al., 2005]. Right: The“drinkable Archimedes proof” demonstrates the comparison of volumes [Knill and Slavkovsky,2013b].
55

4 Data Physicalization
In the field of InfoVis Jansen et al. [2013, 2012] conducted the first study comparing phys-icalizations to their on-screen counterparts. They focused on bar charts and compared anon-screen 2D version, 3D visualizations in mono and stereo to a physical representation (seeFigure 4.17). The results of two experiments revealed that the 2D version elicited betterresults than all 3D variations regarding low-level information retrieval tasks. However, thedata also showed that the 3D physical bar charts outperformed the 3D on-screen bar charts.The authors list visual realism, which is hard to reproduce in a virtual setup, as one factor forthe results and argue that physical touch seems to be a crucial cognitive aid. In a followingexperiment, Jansen and Hornbæk [2016] investigated size as a physical variable for bars andspheres. For the bars, the results were similar to 2D bars on a flat surface. For the spheres,the results show that data would be wrongly interpreted if it was encoded in the volume ofthe sphere, but the accuracy of sphere perception could be immensely improved if it wassurface-based.
Figure 4.17: Representations that were used in an experiment regarding the efficiency of physi-calizations: on-screen 2D bar chart; on-screen 3D bar chart; physical 3D bar chart [Jansen et al.,2013].
The MakerVis project by Swaminathan et al. [2014b,a] indicated the increasing interest andattention regarding physical representations of data. Their tool integrates the entire processof creating physicalizations to facilitate the otherwise laborious procedure, which requiresexpertise in both data representation and digital fabrication. Design sessions showed thatparticipants could easily create their own physicalizations. That the use of physical tokensto represent data can lead to insights for the entire field of data representation is demonstratedin the work of Huron et al. [2014b] on constructive visualizations (see also Huron [2014];Huron et al. [2014a]). By studying the ways in which people create, update and explain theirown data representations using only tangible tokens they developed a model for a visualmapping process including several logical tasks such as loading data or computing newvalues.
While there are a couple of art installations (see Figure 4.18-left) experimenting with dy-namic physicalizations (e.g., “pulse” by Markus Kison; “data morphose” by ChristianeKeller; “emoto” by Moritz Stefaner, Drew Hemment and Studio NAND; “drip-by-tweet”
56

Physicalization
by Domestic Data Streamers; “Datenreise” by Geiger et al. [2013]) research projects in thisfield are rather rare. Most work in this area can be categorized as ambient physicalizationsthat aim at changing human behavior in a positive way. Besides the “Dangling String” (seeSubsection 2.1.1 - Ubiquitous Computing & Tangible Interaction) another early example ofdynamic ambient physicalizations is “Breakaway” by Jafarinaimi et al. [2005]. The sensor-driven sculpture uses data from a people’s chair to suggest when it is time to take a breakby encoding it into its shape and movement (see Figure 4.18-center). Similar projects usedphysical avatars in form of a puppet [Daian et al., 2007], a flower [Haller et al., 2011; Honget al., 2015] or encoded data into the transparency of a lamp shape [Cha et al., 2016]. Thefirst project that looked into the role of physically dynamic data representations for the ex-ploration and analysis of datasets was EMERGE [Taher et al., 2015]: an interactive bar chart,equipped with plastic rods, RGB Light-Emitting Diodes (LEDs), a Microsoft Kinect® anda projector supported fundamental data representation tasks such as filtering or sorting (seeFigure 4.18-right). Observations in a study revealed that physical interactions were intuitive,informative, and enjoyable but also unfolded the limitations of working with physical data.
Figure 4.18: Examples of dynamic physicalizations. Left: The “data morphose” installationby Christiane Keller represents various data streams through spanned and moving sails. Center:“Breakaway” is an ambient sculpture that encodes data into its shape and movement based onsensors in a people’s chair [Jafarinaimi et al., 2005]. Right: The EMERGE project exploredinteractions with physically dynamic bar charts [Taher et al., 2015]
As the examples presented in this chapter illustrate, physicalizations have been created andused by various audiences for representing diverse datasets for several goals. Especiallythe rise of digital fabrication technologies simplified the creation of physicalizations and,therefore, increased the interest in studying their benefits, also regarding pragmatic purposes.Data physicalization research is still at its beginning, with many open research questions butalso challenges regarding their design and evaluation [Jansen et al., 2015]. The projectspresented in the following chapters seek to demonstrate in which ways physicalizations canenrich our thinking, learning, and communication.
57

4 Data Physicalization
58

IIPROTOTYPING PHYSICAL
VISUALIZATIONS


Chapter5Beyond Physical Bar Charts
The previous chapters gave an overview of related research areas. We started with embod-ied interaction and haptic perception, which motivates the general idea of the thesis’ topic(Chapter 2 - Embodied Interaction & Haptic Perception). The technical progress in digitalfabrication technologies forms the basis for the simplified creation of physical visualiza-tions (Chapter 3 - Digital Fabrication). The prior chapter gave an introduction into thenew research area of data physicalization and outlined the multiple research challenges andopportunities (Chapter 4 - Data Physicalization).
Data physicalization is a new exciting research area as it combines various disciplines suchas InfoVis, HCI, TUI, and psychology but also more technical-specific fields. This opens upa vast space to design for with almost uncountable questions to ask. But it also creates thedifficulty to set a solid starting point for a discussion on why to investigate physicalizationsand how to build them. Research in InfoVis demonstrated, that the design of visualizationsis full of trade-offs and that many possibilities in the design space are ineffective for a par-ticular purpose [Munzner, 2014]. Through the long history of research in InfoVis variousguidelines regarding the design have been developed, and standards in which ways to evalu-ate them have been established. While data physicalization can use those as orientation andinspiration it is necessary to investigate if they are also suitable for the field of physicaliza-tion or if new guidelines and methodologies have to be developed.
This chapter introduces six prototypes of physical visualizations. The prototypes are cate-gorized into the exploration of static, digitally augmented and dynamic physicalizations. Allprojects were inspired by traditional visualizations and followed a research through design
Personal contribution statement: The content of this chapter is based on six student’s theses by Ayfer Aslan[2013]; Lena Streppel [2014]; Maximilian Kreutzer [2014]; Markus Teufel [2014]; Elisabeth Engel [2014];Barbara Schindler [2014]. Part of it was published in articles by Stusak and Aslan [2014]; Stusak, Tabard,and Butz [2013]; Stusak [2014]; Stusak and Teufel [2014]. See Disclaimer for a detailed overview.
5 Beyond Physical Bar Charts
approach [Zimmerman et al., 2007]. One goal of the projects was to learn in which waysdigital fabrication technologies can be used for designing and building physicalizations andtherefore, exploring the design space. Another goal was to evaluate the prototypes to collectinitial experiences and statements of people seeing and interacting with physicalizations andtherefore, identifying promising directions for further research.
5.1 Static Physical Visualizations
The following section introduces two explorations of static physical visualizations. Inspiredby traditional 2D visualizations such as bar graphs and matrices we built and experimentedwith novel physicalizations for a range of different form factors and datasets, made withacrylic glass and a laser cutter. First, we present the so-called threaded bar-star-plot, thenprototypes of layered physical visualizations. We discuss the design process and the findingsof our initial evaluations.
5.1.1 Threaded Bar-Star-Plot
The threaded bar-star-plot is the result of an iterative design process, which started withsketches on paper, which led to low-fidelity prototypes out of cardboard and eventually de-fined the final design built with acrylic glass and thread. The idea was to combine well-known 2D visualizations, in this case, a bar graph and a star plot, into one compact physicalobject. To enable reordering and filtering of the data, we also created a modular versionof the threaded bar-star-plot. We compared the fixed and the modular physicalization toon-screen counterparts regarding information retrieval tasks.
Motivation & Background
As related work shows (see Chapter 4 - Data Physicalization), a large body aimed at con-veying messages beyond the data itself and elicit emotions or provoke thought. They didnot focus on the analytical value or the creation of effective physicalizations. As a startingpoint for an exploration into this direction, we investigated in which ways well-known 2Dvisualizations can be redesigned as physicalizations and in which ways the transformationfrom the digital into the physical world impacts basic information retrieval tasks. We furtherwere interested in the question how the design process for physicalizations could look like,not only regarding the used tools and materials but also whether methods from HCI, such aslow-fidelity prototyping or user-centered design are applicable.
62
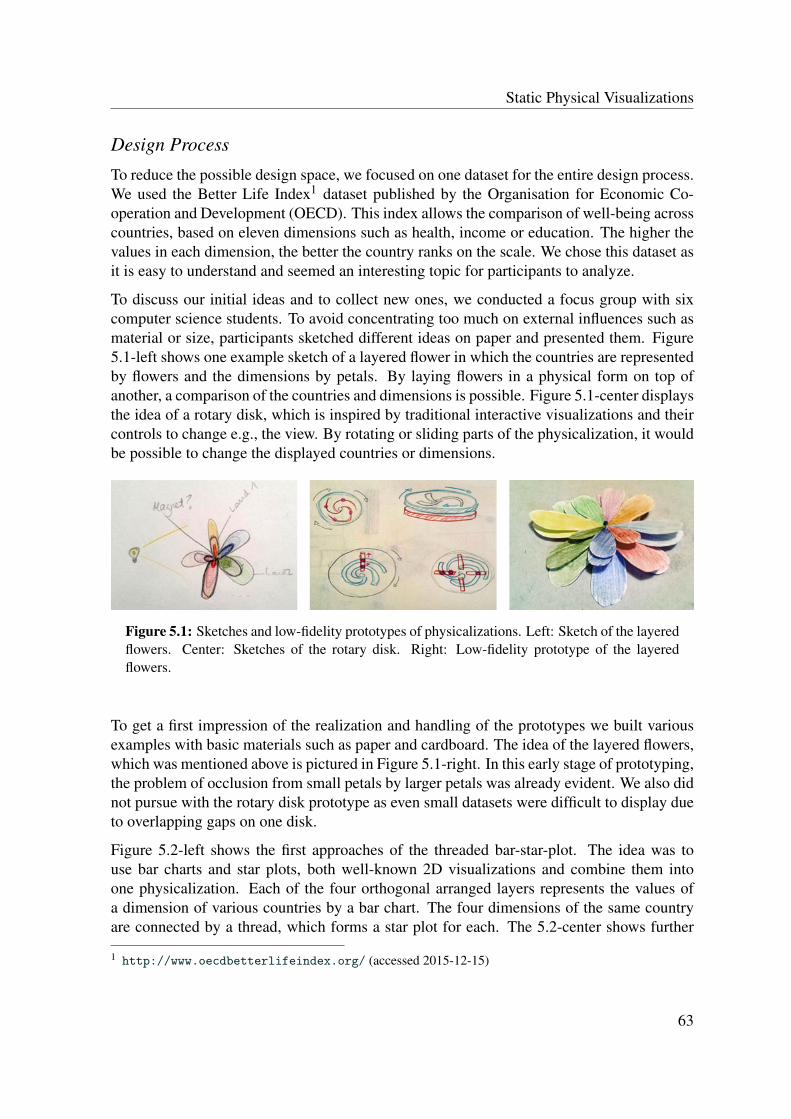
Static Physical Visualizations
Design Process
To reduce the possible design space, we focused on one dataset for the entire design process.We used the Better Life Index1 dataset published by the Organisation for Economic Co-operation and Development (OECD). This index allows the comparison of well-being acrosscountries, based on eleven dimensions such as health, income or education. The higher thevalues in each dimension, the better the country ranks on the scale. We chose this dataset asit is easy to understand and seemed an interesting topic for participants to analyze.
To discuss our initial ideas and to collect new ones, we conducted a focus group with sixcomputer science students. To avoid concentrating too much on external influences such asmaterial or size, participants sketched different ideas on paper and presented them. Figure5.1-left shows one example sketch of a layered flower in which the countries are representedby flowers and the dimensions by petals. By laying flowers in a physical form on top ofanother, a comparison of the countries and dimensions is possible. Figure 5.1-center displaysthe idea of a rotary disk, which is inspired by traditional interactive visualizations and theircontrols to change e.g., the view. By rotating or sliding parts of the physicalization, it wouldbe possible to change the displayed countries or dimensions.
Figure 5.1: Sketches and low-fidelity prototypes of physicalizations. Left: Sketch of the layeredflowers. Center: Sketches of the rotary disk. Right: Low-fidelity prototype of the layeredflowers.
To get a first impression of the realization and handling of the prototypes we built variousexamples with basic materials such as paper and cardboard. The idea of the layered flowers,which was mentioned above is pictured in Figure 5.1-right. In this early stage of prototyping,the problem of occlusion from small petals by larger petals was already evident. We also didnot pursue with the rotary disk prototype as even small datasets were difficult to display dueto overlapping gaps on one disk.
Figure 5.2-left shows the first approaches of the threaded bar-star-plot. The idea was touse bar charts and star plots, both well-known 2D visualizations and combine them intoone physicalization. Each of the four orthogonal arranged layers represents the values ofa dimension of various countries by a bar chart. The four dimensions of the same countryare connected by a thread, which forms a star plot for each. The 5.2-center shows further
1 http://www.oecdbetterlifeindex.org/ (accessed 2015-12-15)
63
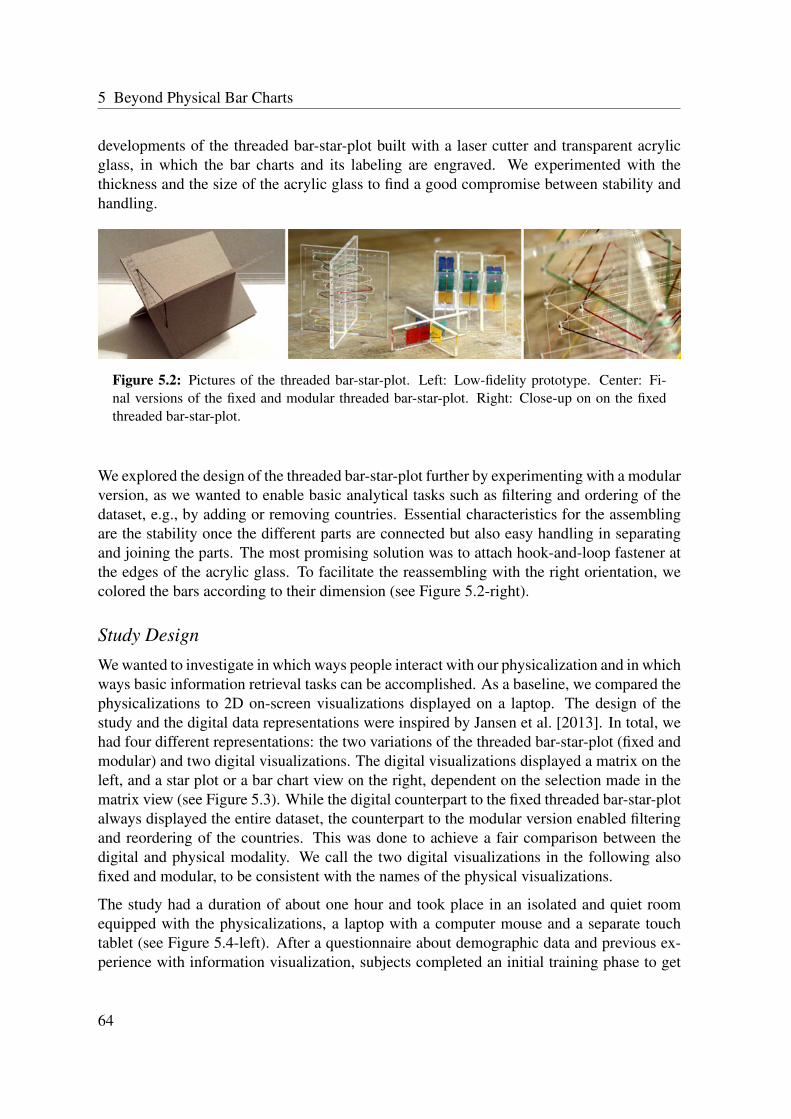
5 Beyond Physical Bar Charts
developments of the threaded bar-star-plot built with a laser cutter and transparent acrylicglass, in which the bar charts and its labeling are engraved. We experimented with thethickness and the size of the acrylic glass to find a good compromise between stability andhandling.
Figure 5.2: Pictures of the threaded bar-star-plot. Left: Low-fidelity prototype. Center: Fi-nal versions of the fixed and modular threaded bar-star-plot. Right: Close-up on on the fixedthreaded bar-star-plot.
We explored the design of the threaded bar-star-plot further by experimenting with a modularversion, as we wanted to enable basic analytical tasks such as filtering and ordering of thedataset, e.g., by adding or removing countries. Essential characteristics for the assemblingare the stability once the different parts are connected but also easy handling in separatingand joining the parts. The most promising solution was to attach hook-and-loop fastener atthe edges of the acrylic glass. To facilitate the reassembling with the right orientation, wecolored the bars according to their dimension (see Figure 5.2-right).
Study Design
We wanted to investigate in which ways people interact with our physicalization and in whichways basic information retrieval tasks can be accomplished. As a baseline, we compared thephysicalizations to 2D on-screen visualizations displayed on a laptop. The design of thestudy and the digital data representations were inspired by Jansen et al. [2013]. In total, wehad four different representations: the two variations of the threaded bar-star-plot (fixed andmodular) and two digital visualizations. The digital visualizations displayed a matrix on theleft, and a star plot or a bar chart view on the right, dependent on the selection made in thematrix view (see Figure 5.3). While the digital counterpart to the fixed threaded bar-star-plotalways displayed the entire dataset, the counterpart to the modular version enabled filteringand reordering of the countries. This was done to achieve a fair comparison between thedigital and physical modality. We call the two digital visualizations in the following alsofixed and modular, to be consistent with the names of the physical visualizations.
The study had a duration of about one hour and took place in an isolated and quiet roomequipped with the physicalizations, a laptop with a computer mouse and a separate touchtablet (see Figure 5.4-left). After a questionnaire about demographic data and previous ex-perience with information visualization, subjects completed an initial training phase to get
64

Static Physical Visualizations
Figure 5.3: Screenshots of the digital counterparts of the threaded bar-star-plot. Left: matrixand bar charts. Right: matrix and star plot.
familiar with the data representations and the tasks. Next, the representations were handedover to the participants in a counterbalanced order, and they were asked to complete thefollowing five tasks:
1. Which country has the highest value in [dimension]?
2. Order all countries descending by [dimension].
3. Order [four given countries] descending by [dimension].
4. Rank [four given countries] descending by all given dimensions.
5. Which are the countries with the highest and lowest values regarding all dimensions?
The input and output of the instructions, the tasks, and their responses were done on theseparate touch tablet. Participants were instructed to be as accurate and as fast as possible.We measured the task completion time (interval between the press on “start” and the presson “done” on the tablet) as well as the error rate. The study ended with a questionnaire anda semi-structured interview about the data representations.
Out of the 16 participants, six were female. The average age was 25 years (range: 13-41).Eight participants were students of computer science, two pupils, and six employees. Allwere right-handed, and two had experience with data representations. Participants receiveda 10 Euro voucher for an online shop.
Results
Figure 5.4-right summarizes the average task completion time per data representation andtask. Only task 1 shows a noticeable separation between the digital and the physical visu-alizations. The fixed digital visualizations had the fastest average completion time for alltasks. The fixed digital visualization seemed to be to most suitable to fulfill task 2 and 4,while the modular physicalization was clearly worse to accomplish task 2. The error ratewas similar and very low for all representations.
65

5 Beyond Physical Bar Charts
10
20
30
40
50
60
Task 1 Task 2 Task 3 Task 4 Task 5time
(s)
Fixed Digital
Modular Digital
Fixed Physical
Modular Physical
Figure 5.4: Left: Hardware setup that was used for the evaluation. Right: Results for theaverage task completion time in seconds per data representation and task (with 95% confidenceintervals).
We collected subjective data through questionnaires using 5-point Likert scales ranging from1=strongly agree to 5=strongly disagree (see Figure 5.5). Participants had the impressionthat the tasks were most easily fulfilled with the modular digital visualization. It was easierto interact with the digital variations than with the physical ones. This corresponds with par-ticipants’ statements that the physicalizations were more complicated to understand than thedigital visualizations. Also, the holding and rotating of the physicalizations were mentionedas laborious. The fixed physical visualization aided the completion of the tasks less than theother representations. The modular physical visualization was the most interesting one tointeract with, while the fixed physical visualization was the less interesting one. Participantsranked the modular digital visualization 13 times at position one when asked to rank thetechniques according to preference.
We observed differences between participants in the ways in which they used and interactedwith the physicalizations. Seven participants constantly used one hand to interact with thefixed physical visualizations, but all participants used both hands to interact with the modularone. Four participants did not disassemble the modular physical visualization, two becauseit seemed impractical, two because of fear to break something. Often the participants weretoo cautious at the beginning to undo the hook-and-loop fastener. However, one participantbroke several parts of the modular physical prototype while trying to demount it.
Discussion
Regarding the design process, it is worth to mention that the number of ideas generated dur-ing the focus group was rather low, especially compared to previous focus groups in a similarsetting but about other topics, e.g., software interface design. One reason could be that theparticipants had only little experience with visualizations and none with physicalizations.While we decided against providing materials such as Lego® or pipe cleaners as we thoughtthis could limit the creative output, the ideation process with pen and paper alone seemed tobe a bit too abstract.
66

Static Physical Visualizations
The tasks were easy to complete
6 8 2
2
10 6
FD
MD
4 10 2
15 8
FP
MP
12 3 1
114 1
FD
MD
The prototype was helpful for completing the tasks
286
313
FP
MP
Interacting with the prototype was easy
12 4
9 5 2
FD
MD
5 5 3 3
5 6 1 4
FP
MP
7 7 2
8 1
FD
MD 7
Interacting with the prototype was interesting
FP
MP
0% 25% 50% 75% 100%0% 25% 50% 75% 100%
31 2 4 5strongly agree strongly disagree FD = Fixed Digital / MD = Modular DigitalFP = Fixed Physical / MP = Modular Physical
4 264
511
Figure 5.5: Results of the 5-point Likert scale questionnaires for all tested prototypes (FD =Fixed Digital; MD = Modular Digital; FP = Fixed Physical; MP = Modular Physical)
However, the design process with low-fidelity prototypes showed that the use of simplematerial such as paper or cardboard and common tools such as pencils and scissors to buildphysicalizations can have advantages. In an early stage, it was possible to identify problemsregarding the design and get a good impression about the size and interaction possibilities.Limitations are stability and the general haptic characteristics, dependent on the material thefinal physicalization will be made of.
The study revealed that a sophisticated design is crucial if the physicalizations are aimed atsupporting analytical tasks. Especially stability and “affordances” are essential properties, asparticipants stated the handling of our prototypes was sometimes challenging and laborious.In general, the study showed that our physicalizations were suitable to fulfill the five tasks,but participants were not convinced of their practicability. Interestingly we distinguishedthe trend that participants with a background in computer science found the physicalizationsmore interesting than the other participants. It was stated by five participants that they couldnot imagine using this type of physicalization for data analysis. However, they liked thedesign and suggested the encoding of personal data to serve as a souvenir or piece of sceneryfor the shelf.
5.1.2 Layered Physical Visualizations
While the prototype in the previous subsection combined two well-known 2D visualizationsinto one physicalization, the goal of the prototype described in this subsection was to movea 3D visualization, such as a 3D matrix or a 3D scatterplot, into the physical world. Theoutcome was a physicalization consisting of multiple acrylic glass layers, which were hold
67

5 Beyond Physical Bar Charts
together but could be articulated in different ways. We evaluated two variations of suchlayered physical visualizations against a traditional representation in table form printed onpaper.
Motivation & Background
While the observations and study results for the threaded bar-star-plot were promising con-cerning the analytic value of physicalizations, participants found the handling rather labori-ous and preferred the digital representations for fulfilling the tasks. As the threaded bar-star-plot was only a specific instance of a much larger design space the goal of this project was todesign and evaluate another prototype to further explore the characteristics and possible ben-efits of physicalizations. We also wanted to investigate in which ways physical manipulationand simple mechanical movements can be integrated into physicalizations and distinguishunique physical characteristics.
As the combination of 2D visualizations into a physical object seemed less convincing to theparticipants, we focused on 3D visualizations for this project, as they have common problemson 2D digital screens, such as reduced depth perception and visual occlusion. During thesurvey of 3D visualizations we decided, that data and space-time cube representations wouldbe an exciting and promising type to transform into a physicalization. In the case of thespace-time cube, data is mapped onto two dimensions, while time is shown as a third spatialdimension. Such representations were, for example, used to explore relational databases[Stolte et al., 2003], geographic datasets [Kraak, 2003; Gatalsky et al., 2004] or dynamicnetworks [Bach et al., 2014].
Design Process
As underlying data, we used a dataset from the German Census Bureau2 consisting of causesof death in Germany for various ages groups starting in 1980. Bearing in mind a later evalu-ation, we expected these topics to be interesting to a wide audience and easy to understand.Furthermore, the dataset was big enough to choose a suitable subset of values of high vari-ances across years, age groups and causes of death.
The general idea behind the design of this physicalization was to stack multiple layers oftransparent acrylic glass, inspired by the space-time cube metaphor. Each layer representedone year and contained a matrix visualization with the age groups and causes of death asaxes. Each data point was represented by an engraved or cut circle in the respective layer.The area or radius of a circle represented the number of deaths in a respective age group fora given year.
We experimented with several possibilities to hold the single layers together and decided touse two different ways for the fixation. The first variation was to use a screw and a properhole to enable an independent rotation of each layer about the time axis. The rotation allows
2 https://www-genesis.destatis.de/genesis/online (accessed 2015-12-15)
68

Static Physical Visualizations1984
Age groups
Causes of death
Time
Age groups
Causes of death
Time
Slide
Rotate
Rotate
Figure 5.6: Top and right: Illustrations of the possibilities to articulate the final prototypes.Bottom: Laser stencil of the first layer.
a comparison of two layers but always twisted by a certain angle. Therefore, in the secondvariation, we changed the hole into a longish slot, which allowed a rotation and a verticalsliding of the layers (see Figure 5.6). Both simple mechanical movements can support theanalytics tasks of filtering and sorting.
We tried various shapes to represent single data points, such as lines, circles and squaresand used the laser cutter techniques of cutting and engraving. We also experimented withdifferent types and weights of strokes, the thickness of the acrylic glass and the depth of theengravings. The final design consisted of holes cut as circles (see Figure 5.7) into 5 mmthick transparent acrylic glass layers. To improve the readability and comparison of singlevalues we experimented with various techniques from classical 2D visualizations such asgraphical overlays (e.g., Kong and Agrawala [2012]) and symbols inspired by cartography(e.g., Hake [1970]). The outcome was to augment each circle with small guides (see Figure5.6-bottom), which seemed to be the best compromise between enhancing the readability ofexact values and not reducing the possibility to see through the single layers. We furtheradded a diagram with two semicircles encoding the maximum and average value for eachage group (see Figure 5.6-bottom).
69
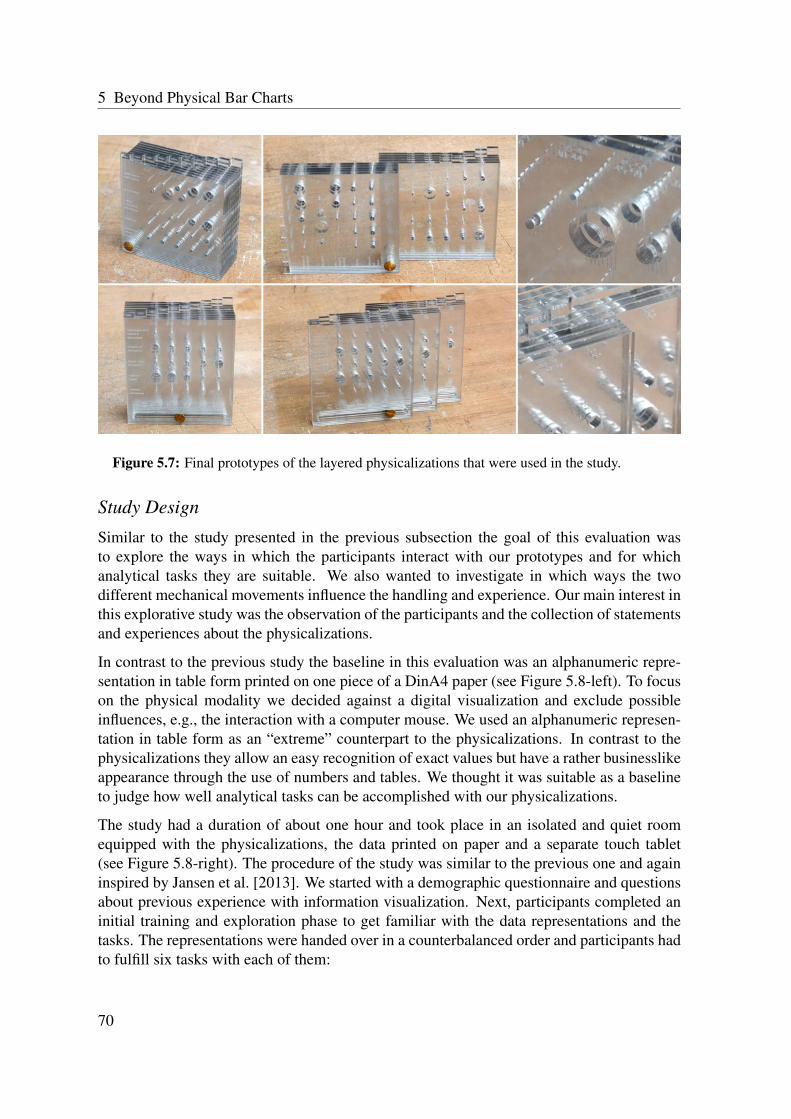
5 Beyond Physical Bar Charts
Figure 5.7: Final prototypes of the layered physicalizations that were used in the study.
Study Design
Similar to the study presented in the previous subsection the goal of this evaluation wasto explore the ways in which the participants interact with our prototypes and for whichanalytical tasks they are suitable. We also wanted to investigate in which ways the twodifferent mechanical movements influence the handling and experience. Our main interest inthis explorative study was the observation of the participants and the collection of statementsand experiences about the physicalizations.
In contrast to the previous study the baseline in this evaluation was an alphanumeric repre-sentation in table form printed on one piece of a DinA4 paper (see Figure 5.8-left). To focuson the physical modality we decided against a digital visualization and exclude possibleinfluences, e.g., the interaction with a computer mouse. We used an alphanumeric represen-tation in table form as an “extreme” counterpart to the physicalizations. In contrast to thephysicalizations they allow an easy recognition of exact values but have a rather businesslikeappearance through the use of numbers and tables. We thought it was suitable as a baselineto judge how well analytical tasks can be accomplished with our physicalizations.
The study had a duration of about one hour and took place in an isolated and quiet roomequipped with the physicalizations, the data printed on paper and a separate touch tablet(see Figure 5.8-right). The procedure of the study was similar to the previous one and againinspired by Jansen et al. [2013]. We started with a demographic questionnaire and questionsabout previous experience with information visualization. Next, participants completed aninitial training and exploration phase to get familiar with the data representations and thetasks. The representations were handed over in a counterbalanced order and participants hadto fulfill six tasks with each of them:
70

Static Physical Visualizations
Figure 5.8: Left: Example of the paper representation that was used in our evaluation. Right:Hardware setup for the evaluation.
1. Enter maximum value for given [year] and [age group].
2. Order values of all causes descending for given [year] and [age group].
3. Order values of [four given years] descending for given [cause] and [age group].
4. Order values of [four given age groups] descending for given [cause] and [year].
5. Enter causes with above average values for given [year] and [age group].
6. Enter value range of all years for given [cause] and [age group].
All instructions and tasks were displayed on the touch tablet, in which participants alsoentered their responses. Participants were instructed to be as fast and as accurate as possible.We measure the task completion time and error rates. We videotaped the study and theexperimenter observed the interactions of the participants with the data representations andtook notes. To collect qualitative data we ended the study with a questionnaire and a semi-structured interview.
Out of the 18 participants, eight were female. The average age was 23 years (range: 20-30). All were computer science students and right handed, four had experience with datarepresentations. Participants received a 10 Euro voucher for an online shop.
Results
Figure 5.9 shows the results for the total number of errors and the average task completiontime per data representation and task. The number of errors show clearly that the repre-sentation on paper was better for giving the correct answer. About half of the participantscould not fulfill task 3 or task 4 when interacting with one of the physicalizations and onlyone participant had the right answer for task 6. The results for the average completion time
71

5 Beyond Physical Bar Charts
5
10
15
20
25
30
Task 1 Task 2 Task 3 Task 4 Task 5 Task 6time
(s)
3
12
9
6
15
18
Task 1 Task 2 Task 3 Task 4 Task 5 Task 6#erro
rs
Paper
Layered physical (rotate)
Layered physical (rotate+move)
Paper
Layered physical (rotate)
Layered physical (rotate+move)
Figure 5.9: Left: Number of errors per data representation and task. Right: Average taskcompletion time in seconds per data representation and task (with 95% confidence intervals).
show a similar pattern. Most tasks could be fulfilled faster with the representation on paperand only task 1, 3 and 4 could be completed in a similar time frame for all representations.However, with much less accuracy regarding the two physicalizations.
The questionnaires and semi-structure interviews revealed that participants rated the physi-calizations as more playful and encouraging. They also had slightly more fun using them,as twelve and ten participants “strongly agreed” or “agreed” with the statement “I had funcompleting the tasks” for the physicalizations and eight for the representation on paper. Wealso asked participants to rank the representations which lead to a polarized result: the phys-icalization which could be rotated and vertically slid was ranked first by seven participants,the other physicalization by six and the representation on paper by five.
During the exploration phase, we encouraged participants to think aloud about interestingfacts in the data or discovered insights. We found the trend that participants stated moreexact values and compared single values when using the representation on paper. Whenusing one of the physicalizations they had a better overview of the data and focused more ontrends over the years.
Figure 5.10 shows that participants interacted with the physicalizations in various ways andhad different techniques to find or compare values. All participants used the table to ar-range the layers back into a block. It was also common to look at the physicalizations fromdifferent angles and perspectives. They were examined from the back by nine participants,based on the statement that it is easier to detect a trend from small to big circles. They werealso observed from the side by six participants which declared that this view eases the com-parison of the outer circles. The physicalizations were held up to the light to improve thereadability by four participants.
Participants stated that the physicalizations are something new and unfamiliar, which hasto be learned first but are easy to use afterward. They pointed out that the physicalizationsare most suitable for getting an overview of the data and spotting trends or outliers spreadover time. The fun factor was often mentioned, as the physicalizations are something playfuland nice, which encourages interaction. Most participants stated that sliding single layers ismore useful for comparison than rotating, but that the combination of both led to confusion
72

Static Physical Visualizations
Figure 5.10: Various examples of ways in which participants used and articulated our proto-types.
and disorganization of the layers. The factor of memorability was stated by seven partici-pants. One statement was that “the haptic prototypes generate a visual memory hook, whichquickens and eases an observation later on.” Another one was that “the sizes of the holesare kept in good memory as they make use of the spatial imagination and visual thinking.”
Discussion
The results of the study showed that our physicalization prototypes were suitable for accom-plishing analytical tasks. However, the high amount of errors for some tasks highlightedthe problems of our design. Participants had difficulties in retrieving exact values and com-paring values with small differences. It is worth mentioning that one cause for this is thathumans have a rather weak judgment comparing small changes in circle sizes or 2D shapesin general, which is independent of the physical or digital modality.
The study highlighted that the design of effective physical visualizations for data analysis ischallenging. While stability was not a crucial factor, this time, participants often mentionedproblems with reflections and perspective distortions. The study also pointed out, that phys-ical visualizations have the potential to engage people in exploring the physical object andalong with it the encoded data. It seemed natural for the participants to look at the physi-calization from all sides and therefore, to perceive the data from different perspectives. Infurther designs, this could be used to show and highlight other aspects of a dataset.
We learned from the initial designs and evaluations of our static physical visualizations, thatstudies focusing too much on the performance seemed a bit fruitless and that evaluationmethods “beyond time and error” could be more promising. Jansen et al. [2013] alreadymentioned that “cost-benefit analyzes involving factors other than pure performance areneeded to assess when physical 3D visualizations are most useful in practice.” Novel evalua-tion methods are not only necessary for physicalizations but are also a heavily discussed topicin the field of InfoVis, which is highlighted by the bi-annual workshop entitled “BEyondtime and errors: novel evaLuation methods for Information Visualization (BELIV)” [Bertiniet al., 2006, 2008, 2010, 2012; Lam et al., 2014]. Examples of evaluation methods are in-sight based studies or other metrics adapted to the perceptual aspects of data representationsas well as the exploratory nature of discovery. In our studies, participants stated, that theysee a potential for physicalizations in displaying personal data, e.g., as kind of a data sou-venir. They also mentioned the factor of memorability as they believe that data presented ina physical form could be remembered better or in different ways.
73
5 Beyond Physical Bar Charts
5.2 Digitally Augmented Physical Visualizations
The following section introduces two explorations of digitally augmented physical visual-izations. Based on the findings of the evaluations of our static prototypes the idea was toaugment physical visualizations with digital graphical overlays. The goal was to improvethe readability of exact values and to enable the display of greater details as well as a deeperexploration of the data. First, we present our considerations in which ways the previouspresented layered physical visualizations can be used for interactions on tabletops. Thenwe discuss our early approaches and experiences in combining physical visualizations withspatial augmented reality. We describe the design process of our initial prototypes and ourobservations during preliminary evaluations.
5.2.1 Layered Physical Visualizations on Tabletops
This subsection describes our considerations in which ways the layered physical visual-izations, that were introduced in the previous subsection (see subsection 5.1.2 - LayeredPhysical Visualizations) can be used for interactions on tabletops. As our prototypes can bearticulated in various ways, we discuss novel interaction possibilities. We implemented aninitial prototype, which we exhibited during an open lab day to students and other guests.
Motivation & Background
The evaluations of our static layered physical visualization showed that participants likedthe design and stated that it is a playful approach for data analysis and encourages a deeperexploration. However, the study also showed, that participants had difficulties in fulfillinganalytical tasks, especially retrieving and comparing exact values was error-prone. Also, ourstatic prototypes were limited by their fixed visual appearance. Therefore, the combinationof physical visualizations and interactive tabletops seemed to be a promising approach todata exploration. The idea is to use the physical visualizations to awake interest and to geta first overview of the data. Placing the physicalization on a tabletop with its large screenenables displaying greater details of the dataset and a deeper exploration. This follows thevisual information seeking mantra by Shneiderman [1996]: the physicalization allows a firstoverview, and the tabletop is used to show further details.
In the field of InfoVis several system have been proposed using tabletops and tangible ob-jects (see also section 4.2 - Information Visualization & Tangible Interaction). The physicalobjects that were involved in such systems were only used as an input device or were mod-els and not visualizations. Our goal was not to build a system for data analysis experts,but to focus on a broader audience, related to casual InfoVis [Pousman et al., 2007]. Aswe used transparent acrylic glass for our physicalizations, we were inspired by work thatused tangibles entirely made of transparent or translucent materials. Such tangibles allowdisplaying content directly below them and enable dynamic illumination as well as glowing
74

Digitally Augmented Physical Visualizations
Figure 5.11: Fixations of the layered physical visualizations and possibilities to articulate them.Left: Fixation of the layers with one screw, which allows rotating. Center: Fixation of the layerswith two screws, which allows sliding. Right: Fixation of the layers with tape on one side, whichallows flipping.
effects [Büschel et al., 2014]. The tracking of tangibles can be realized by using transparentmarkers [Frisch et al., 2013]. Furthermore, transparent objects also facilitate direct touchinteraction with the content below [Büschel et al., 2014] and even the acrylic carving couldbe used as an interactive surface [Mikubo et al., 2013].
Design Process
The design is based on the layered physical visualizations that were presented in the previoussubsection. The principal design questions were how the physicalization and its possibility tobe articulated can be used to interact with data and how and where the digital content shouldbe displayed. While both, the physicalization and the tabletop can be used for input andoutput, in our example the physicalization needed the tabletop as an external light source.
As the combination of layers that can be slid and rotated led to confusion and disarrangementin our previous study, we refined the fixation and also added a new one. Figure 5.11 showthree possible fixations. Already present in the last section is the fixation of the layers withone screw, which allows an independent rotation of each layer. As already mentioned, oneproblem of this variation is that the orientation of the representation changes with the rotationand comparisons of the single layers are difficult (see Figure 5.11-left). Instead of combiningrotation and sliding it is possible to achieve a sliding mechanism alone, by using two screws(see Figure 5.11-center). It is also possible to fixate single layers with tape at one side,similar to bookbinding (see Figure 5.11-right). By turning over a layer, a horizontal orvertical flipped representation is attained. It is worth noting that a fixed construction isalso possible, in which none of the layers can be articulated. The other extreme would beindependent layers without any fixation.
75
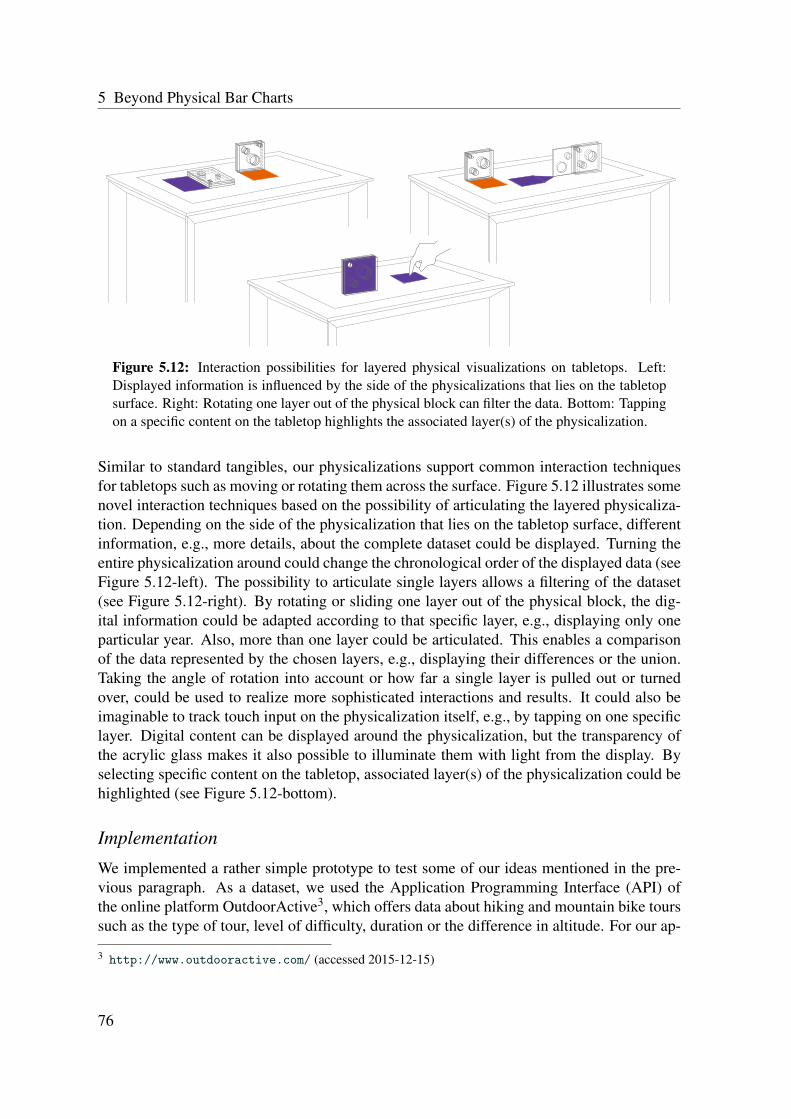
5 Beyond Physical Bar Charts
Figure 5.12: Interaction possibilities for layered physical visualizations on tabletops. Left:Displayed information is influenced by the side of the physicalizations that lies on the tabletopsurface. Right: Rotating one layer out of the physical block can filter the data. Bottom: Tappingon a specific content on the tabletop highlights the associated layer(s) of the physicalization.
Similar to standard tangibles, our physicalizations support common interaction techniquesfor tabletops such as moving or rotating them across the surface. Figure 5.12 illustrates somenovel interaction techniques based on the possibility of articulating the layered physicaliza-tion. Depending on the side of the physicalization that lies on the tabletop surface, differentinformation, e.g., more details, about the complete dataset could be displayed. Turning theentire physicalization around could change the chronological order of the displayed data (seeFigure 5.12-left). The possibility to articulate single layers allows a filtering of the dataset(see Figure 5.12-right). By rotating or sliding one layer out of the physical block, the dig-ital information could be adapted according to that specific layer, e.g., displaying only oneparticular year. Also, more than one layer could be articulated. This enables a comparisonof the data represented by the chosen layers, e.g., displaying their differences or the union.Taking the angle of rotation into account or how far a single layer is pulled out or turnedover, could be used to realize more sophisticated interactions and results. It could also beimaginable to track touch input on the physicalization itself, e.g., by tapping on one specificlayer. Digital content can be displayed around the physicalization, but the transparency ofthe acrylic glass makes it also possible to illuminate them with light from the display. Byselecting specific content on the tabletop, associated layer(s) of the physicalization could behighlighted (see Figure 5.12-bottom).
Implementation
We implemented a rather simple prototype to test some of our ideas mentioned in the pre-vious paragraph. As a dataset, we used the Application Programming Interface (API) ofthe online platform OutdoorActive3, which offers data about hiking and mountain bike tourssuch as the type of tour, level of difficulty, duration or the difference in altitude. For our ap-
3 http://www.outdooractive.com/ (accessed 2015-12-15)
76

Digitally Augmented Physical Visualizations
Figure 5.13: Implemented prototype for layered physical visualizations on a tabletop. Left:Initial physicalization placed on the tabletop. Center: Modified physical object to intensify theillumination effect on the top side of the object. Right: Through rotation of a layer the digitalcontent can be filtered. Image © Maximilian Kreutzer.
plication scenario, we reduced the dataset to four main categories, each including ten tours.For the prototype, we used only three plain acrylic glass layers without any engraved data,as we wanted to focus on the interaction possibilities and the implementation of the tracking.As an interactive tabletop we used the Microsoft Pixelsense®.
The application started by placing the layered physicalization with a bigger side on the table-top. Through rotation of the entire object, a category can be chosen, which are displayedaround the tangible. By turning the object into an upright position the single tours of thechosen category are displayed on the tabletop (see Figure 5.13). By rotating the object aspecific tour can be selected, and more detailed information about the tour will be displayedas text. Also, one layer will be illuminated in a color associated with the difficulty of theselected tour. By rotating a single layer out of the block, a filtering of the tours is possiblebased on the difficulty. As a result, all tours with a different difficulty will be colored in gray(see Figure 5.13-center).
We had to keep the prototype rather simple as we met a couple of problems during theimplementation but wanted to present it to a broader audience in an informal setting at anopen lab day (see next section). The biggest problem was the detection of single layers. Onthe one hand, we had to use rather thick acrylic glass layers (≈ 1 cm) to attach tags that arelarge enough to be recognizable by the Microsoft Pixelsense®. On the other hand cuttingsuch thick material with our laser cutter led to small deformations along the edges of theacrylic glass, as the top side is exposed to the laser for a longer time frame than the lowerside. This resulted in the issue that the acrylic layers did not stand precisely plain on thetabletop surface which complicated the recognition of the tags. We also experimented withother tracking techniques such as image processing and object recognition algorithms, butcould not achieve a satisfying tracking performance.
We modified the tangible as we were not convinced with the illumination effect on the topside of the object due to total reflection (see Figure 5.13-left). By exchanging the straightedges into jagged ones the illumination effect could be intensified (see Figure 5.13-center).This led to the idea to use the terrain profile of a mountain as inspiration for the out shapeand therefore, adapt the tangible to the topic of the application. The flat layer represents
77

5 Beyond Physical Bar Charts
the easier tours and the tallest one the most difficult ones (see Figure 5.13-center). It isworth mentioning that the physical object for this particular prototype cannot be called aphysicalization as it does not encode any abstract data but symbolizes the category of tourdifficulty. It corresponds rather to a tangible with the characteristic that it can be articulated.
Evaluation & Results
We presented our prototype at an open lab day of the Media Informatics and Human-Computer Interaction Groups of the Department of Informatics of the Ludwig-Maximilians-Universität Munich (LMU Munich). At the evening event around 100 visitors, mainly stu-dents of computer science or media informatics, interacted with our prototype or observed inwhich ways others used it (see Figure 5.13-right). Visitors shared their experience throughverbal conversations while interacting with our system. We also had brief discussions withsome visitors about possible application scenarios and what they liked and disliked about theconcept.
Although the system had an early prototype status, the overall response from the visitors waspositive. Participants appreciated the unusual and playful nature of the interaction with oursystem. This can be partly explained by a novelty effect as most visitors had no experienceneither with interactive tabletops nor with tangibles. The lack of experience also led toan initial fear of contact, as most visitors only started to interact with the system after ashort explanation and demonstration. The possibility of articulating the tangible fostered thecuriosity of the visitors, as many of them tried various possibilities to place the tangible onthe tabletop and were interested in the reaction of the system.
Often mentioned application scenarios were tourist information centers and museums withthe explanation that the playful interaction encourages a deeper exploration of the under-lying data. One visitor, a passionate mountain climber, had the idea to use the tangible asa souvenir representing personal data. Each acrylic glass layer would represent a reachedsummit of a mountain, and the layer could have the shape similar to the terrain profile of thatspecific mountain. By placing the object on the tabletop, he could retrieve more information,e.g., the date and duration of his tour or photographs he took.
The evaluation also revealed the limitations of the system. A few visitors stated that theyfound the interaction very cumbersome as the displayed content is rather little. We also hadproblems with the stability of the tangible with clear signs of use. The screw got loosenedseveral times, and the fixed tags got out of place. Both resulted in problems of recognizingthe tangible and its different states.
Discussion
Keeping in mind that we used an early prototype for an informal evaluation and rather atangible than a physicalization for the interaction, we have to be careful in drawing strongconclusions. It was interesting to see that the visitors liked the prototype and that it led toa playful exploration of its capabilities. After explaining the concept behind the prototype,
78

Digitally Augmented Physical Visualizations
several visitors became quite creative regarding ways in which this could be used for furtherprojects. We were excited by the notion of the souvenir that represents personal data, assimilar ideas were already mentioned in our previous studies. Related concepts, such aspersonal objects for memory recollection and sharing, also had been investigated in the fieldof HCI (e.g., van den Hoven and Eggen [2005]; Mugellini et al. [2007]).
In summary, the theoretical considerations regarding the combination of physicalizations andinteractive tabletops open up a large space for design and interaction possibilities. While wefocused with our layered physicalizations on one specific instance, the general concept canbe adopted to all kinds of physicalizations. Physicalizations can offer an overview of thedata and engage people, the tabletop can be used to display further details on demand. Oneaspect that could be worth further investigation is the illumination of the physicalizationthrough the tabletop. By using laser engravings inside a transparent glass object, e.g., withdifferent densities, it could be possible to highlight specific aspects inside the physicalizationon demand [Büschel et al., 2014]. We had the impression that the physicalization is degradedto a simple tangible once it is placed on the tabletop as its large digital screen attracts all theattention. Therefore, we had the idea to use projection augmentation as a digital overlay onthe physicalization itself to keep the focus on the physicalization, which will be discussed inthe following subsection.
5.2.2 Projection Augmented Physical Visualizations
This subsection describes the second project we made in the area of digitally augmentedphysicalizations. While in the previous subsection a tabletop was used to augment the phys-icalization in this project we experimented with spatial augmented reality through projec-tions. The final prototype was a physical area chart, and the projections were used to provideguides and display additional information. A study revealed that projection augmentationcan enhance otherwise static physicalizations and can help to overcome problems arisingfrom perspective distortion.
Motivation & Background
Similar to the motivation in the previous subsection the goal of this project was to over-come the limitations of static physicalizations, e.g., their fixed visual appearance or perspec-tive distortions. Our experiences and observations during the design and implementation ofphysicalizations on tabletops led to the impression that the digital layer should focus strongeron the physicalization itself. Instead of displaying most of the additional content around thephysicalization it would be beneficial to present it on the actual physicalization.
Spatial augmented reality can be used to extend arbitrary physical objects with a digital layer.One popular example in which a projector is used to augment the look graphically as wellas animate real world objects is “Shader Lamps” by Raskar et al. [2001]. The basic ideais to use a white object which is augmented with a texture by a projector. The quality of
79

5 Beyond Physical Bar Charts
the augmentation is dependent on the light condition of the environment and limited by thebrightness, dynamic range and pixel solution of the projector. A couple of projects relatedto the field of physicalizations used projections to augment their physical models and proto-types. Both, “PARM” [Gary et al., 2012] and “Illuminating Clay” [Piper et al., 2002] usedprojections to augment landscape models, e.g., with satellite or historical imagery. Researchprojects in the field on shape displays also often use projections to support visual feedback(e.g., Leithinger et al. [2011]; Follmer et al. [2013]).
Design Process
The design of projection augmented physical visualizations can be split into several dimen-sions. The physical visualization itself is the characteristic element, and its material (e.g.,plastic, wood), fabrication (e.g., 3D printers, laser cutters), size and space for the projectionshould be taken into account. The projection can differ by its position (e.g., direct projec-tion on the physicalization, projection near the physicalization) and its purpose (e.g., show-ing additional information, enabling interaction with the data or improving the readability).Furthermore, the input modality should be considered (e.g., touching, disassembling andreassembling the physicalization, control by a remote device).
Figure 5.14 shows various stages and prototypes from our design process. We started withsketching ideas for various types of data representations, such as map, area and bar charts(see Figure 5.14-top). We designed different digital 3D models for the projection mapping(see Figure 5.14-center) and experimented with physical models created with a 3D printerand a laser cutter (see Figure 5.14-bottom).
We used for all prototypes a dataset on the export of Small Arms and Light Weapons (SALW)from the Peace Research Institute Oslo (PRIO)4, an organization which researches on theconditions for peaceful relations between states, groups and people. The dataset consistedof data about the exportation of SALW, e.g., the value in US$, for various countries fordifferent years. The subject SALW was chosen because of the daunting role these weaponsplay in nowadays warfare. Bearing the later evaluation in mind, we thought it would be animportant but also interesting topic to explore for the attendees.
Implementation
While the 3D printed models were more precise than the laser cut models, the printingprocess was very time-consuming and had constraints regarding the resulting models size.Therefore, we used a laser cutter to fabricate the final prototype consisting of an area chart,as this type offers a large surface for augmentation (see Figure 5.15). It was built out ofbirch wood, as this type of wood is easily processed with a laser cutter and its bright tint iswell-suited for projection augmentation. The single area chart slices, each representing theannual value of sold weapons for one country from 1992 to 2010, were stuck into the slotsof a wooden floor plate (30 cm x 60 cm).
4 http://www.prio.no (accessed 2015-12-15)
80

Digitally Augmented Physical Visualizations
Figure 5.14: Sketches (top), 3D models (center) and early physical prototypes (bottom) fromthe design process for projection augmented physical visualizations. We experimented with mapcharts (left), area charts (center) and bar charts (right). Image © Markus Teufel.
The projection was used for various purposes, first of all for labeling the axis with the corre-sponding countries and years. The single slices could be augmented with additional detailsabout the data in the form of stacked area charts, showing the split by the type of exportedarms or buyer region (see Figure 5.15-top). To improve the comparison of different dataitems, we implemented vertical and horizontal guides (see Figure 5.15-bottom).
Interaction, e.g., moving the guides or changing the data for the stacked area chart, wasrealized through a remote tablet device. The gray colored touch areas at the bottom and onthe right side of the tablet screen were used to activate and control the horizontal and verticalguides. The black square in the lower right corner was used to cycle through different stackedarea charts. The size proportions of the different areas were chosen to facilitate eyes-freeinteraction. The remaining screen space was used to display exact values or relevant 2Dvisualizations (see Figure 5.15-bottom).
81

5 Beyond Physical Bar Charts
Figure 5.15: Final prototype for the projection augmented physical visualization. Additionalinformation is projected (top-left) and can be controlled by an external tablet (top-right). Toimprove readability vertical and horizontal guides can be displayed (bottom). Image © MarkusTeufel.
For the client and server applications we built on web technologies and JavaScript frame-works such as three.js5, node.js6 or raphael.js7. For the calibration process, which ensuresthe correct mapping of the 2D image, we used mapamok8 by Kyle McDonald.
Study Design
The overall goal of the evaluation was to investigate in which ways participants would reactand interact with the projection augmented area chart. We wanted to see what participantsappreciated in particular when exploring data in unusual ways but also observe the lim-itations of our prototype. We further were interested in statements about possible usagescenarios and potential benefits of such types of data representation, but also in ideas forimprovements and extensions of the system.
5 http://threejs.org/ (accessed 2015-12-15)6 https://nodejs.org/ (accessed 2015-12-15)7 http://raphaeljs.com/ (accessed 2015-12-15)8 https://github.com/YCAMInterlab/ProCamToolkit/wiki/mapamok-(English) (accessed 2015-
12-15)
82

Digitally Augmented Physical Visualizations
The study took place in an isolated, quiet and dim lighted room equipped with our prototypeconsisting of the physicalization, a projector (1366 x 768 pixel), a tablet device and a com-puter. It had a duration of about one hour and started with a demographic questionnaire andquestions about previous experience with information visualization. The central part wasan exploration phase, in which participants had to interact with the prototype without anyfurther instructions. They were encouraged to think aloud about their experiences with thesystem and discovered insights in the dataset. After that, participants had to fulfill some ba-sic information retrieval tasks, such as sorting and comparing values or specifying the rangeof values, to test if our system supports these tasks. The study ended with a semi-structuredinterview in which participants were asked about their opinion regarding the prototype.
We had 23 participants (nine female) with an average age of 27 years (range: 20-39). While17 participants had a high level of experience with computers and digital visualizations,only eight were familiar with physical visualizations. The majority came from an academicenvironment (13 computer science students, four research assistants). Others reported tobe barkeeper, geographer, media creator, project manager, software developer and socialworker. Participants received a 10 Euro voucher for an online shop.
Results
Participants enjoyed using the prototype, as 22 participants stated they had fun using the aug-mented physicalization after the exploration phase. One statement was, “I don’t know why,but it is pure fun to use the guide tool.” Interestingly only 16 participants repeated their ini-tial statement after they had to fulfill the given tasks, which leads to the assumption that ourphysicalization is more suitable for an open and unforced exploration of data. Participantscould accomplish basic information retrieval tasks with our prototype. Most wrong answerscould be traced back to a general problem of stacked area charts, in which small values resultin thin lines, which in turn hinders the readability or comparison of exact values.
Most participants found the visual feedback on the tablet device unnecessary or even con-fusing. By 18 participants it was only used for controlling the projection but not to receivefurther details, e.g., exact values. For eleven participants the separate touch tablet seemedto be too much, as they stated that they had difficulties to decide where to look at. Somestated that all information should be projected onto the physicalization and that the tabletshould only be used as an input device. Surprisingly only two participants mentioned thatthey would like to touch the physicalization to trigger certain functions.
An unexpected finding was that only eleven participants found the horizontal guide as usefulwhile 21 participants stated that the vertical guide is helpful to compare values as it over-comes the problem of perspective distortions. While exploring the data, three participantsreported that they would appreciate a way to get background information regarding certaindata points they discovered. One participant stated the interesting idea to apply a sorting al-gorithm, which would try to arrange small values in the center of the area chart. This wouldoptimize their readability as they would not be distorted due to possible calibration errors atthe models edges. However, only two participants noticed the problem of “pixel bleeding.”
83
5 Beyond Physical Bar Charts
All participants stated that such a spatial augmented physicalization would be interesting forpublic spaces, e.g., a museum in order “to bring an individual dataset closer to the visitors”,as one participant specified. Other ideas were meeting rooms, presentation stages, schoolsand waiting areas.
Discussion
Our exploration revealed that spatial augmented reality seems to be a promising way to over-come some limitations and problems of static physical visualizations. Guides, for example,help to overcome problems arising from perspective distortion. The augmentation of thephysicalization with additional information can compensate its static nature without losingthe advantages of physical objects, which can be touched and explored with all senses.
It is worth mentioning that our prototype did not support any direct-touch input but wascontrolled by an external tablet device. Our evaluation revealed that most participants wereconcentrated solely on the physicalization and stated that the additional device led to a con-fusing situation. Therefore, it could be worth considering the implementation of direct touchinteraction on the physicalization or integrate interaction techniques such as rotating, movingor disassembling the physicalization.
While all our previous prototypes of physicalizations were rather small and could be easilyheld in one hand, this was the first larger prototype. It was interesting to see that this led toa full body exploration of the physicalization, as participants walked around the prototype,knelt down and changed the position of their heads. One participant mentioned that he likedthe fact to move the entire body to explore data, in contrast to moving your hand and a mouseto control traditional digital visualizations. By providing multiple projections from differentsides and by integrating the position of the onlookers and adapting the projections dependingon their movements this could be further encouraged.
Another exciting direction for further investigations is the area of communicating and pre-senting data. Almost all participants named museums, schools and public places as promis-ing places for projection augmented physicalizations or physicalizations in general. Othersmentioned meeting rooms and presentation stages as application scenarios, which providesmotivation for research on possible benefits of physical visualizations for communicationand collaboration purposes.
5.3 Dynamic Physical Visualizations
The first section of this chapter introduced two static physicalizations and in the previoussection, we explored in which ways various limitations of such static prototypes can bereduced through the augmentation with a digital layer. In the following section, we presenttwo explorations in the area of dynamic or articulated physicalizations. The idea was toobserve in which ways people interact with data representations in which not only the digital
84

Dynamic Physical Visualizations
layers change but also the physical form. The first project investigates a physical data matrixthat allows small height changes for each data point. The second project follows a ratherartistic approach and explores in which ways a water swirl can be transformed into a datarepresentation.
5.3.1 Data Exploration Matrix
This subsection describes our initial prototype in the area of dynamic physical visualizations.The outcome is a physical 5x5 LED data matrix equipped with various tangible interfaceelements and LEDs, which can be changed slightly in its height. We presented our prototypeat an open lab day to collect early feedback and ideas for further developments.
Motivation & Background
After the investigation of static physicalizations and ways to digitally augment them, wewanted to explore and collect experiences of designing and building dynamic physicaliza-tions. Bearing in mind that it was our first contact with hardware prototyping and electronicswe wanted to keep the complexity and costs for the prototype on a low level. Therefore, thegoal was to design and build a proof of concept and not a sophisticated system for data rep-resentation. We were inspired by early and rather simple shape displays, such as “Lumen”[Poupyrev et al., 2004] or “Glowbits” [Hirschmann, 2004], both focusing on an ambient andcalm representation of information. In contrast, we wanted to investigate in which ways suchsystems can be used for the representation of abstract data. While articles about shape dis-plays often focus on technical aspects, we wanted to evaluate in which ways people interactwith our prototype and observe if it encourages the exploration of a dataset through a playfuland unusual way.
Design Process
As mentioned earlier, we were inspired by first shape displays, which can encode multi-dimensional datasets, similar to 3D bar charts. For our prototype, we decided to use a countryindicator dataset from Gapminder9 about power generation. The dataset included the valuesof different types of electricity generation, such as wind energy or fossil fuels, for variouscountries in different years.
The final prototype of the data exploration matrix is displayed in Figure 5.16. The datasetcan be displayed by a 5 x 5 matrix of RGB LEDs. Therefore, the color and brightness ofthe LEDs can be used to encode data. Furthermore, the LEDs have two different heightpositions, which can be used to highlight single data points, such as the maximum value(see Figure 5.16-center). Interaction possibilities were realized through tangible controlelements (see Figure 5.16-right). The knob allowed switching between different years and
9 http://www.gapminder.com (accessed 2015-12-15)
85

5 Beyond Physical Bar Charts
Figure 5.16: Final prototype of the data exploration matrix (left) with actuated LEDs (center)and tangible control elements (right). Image © Elisabeth Engel.
Figure 5.17: Used components and the setup of the data exploration matrix (image © ElisabethEngel).
the switches enabled a view change between relative and absolute values as well as therepresentation of one year or its trend compared to five years before. We used tangiblecontrol elements instead of an external device, such as a mobile phone or tablet, to designthe physicalization as one compact unit (30 cm x 26 cm x 15 cm).
The physicalization is composed of 25 LEDs, each mounted on a solenoid, which can moveup and down a distance of 5 mm. The knob is realized through a potentiometer. An Ar-duino10 Mega 2560 functions as a microcontroller that runs the program code and reacts oninputs through the tangibles by controlling the LEDs and solenoids. All components includ-ing an external power supply were assembled and hid in a colored laser cut box (see Figure5.17).
10https://www.arduino.cc/ (accessed 2015-12-15)
86

Dynamic Physical Visualizations
31 2 4 5Strongly disagree Strongly agree
It was easy to interact with the data exploration matrix
2 3 12 13
I had fun using the data exploration matrix
2 15 13
1
I gained new insights using the data exploration matrix
2 14 13
0% 25% 50% 75% 100%
Figure 5.18: Left: The data exploration matrix was exhibited during an open lab day (image ©Elisabeth Engel). Right: Results of the questionnaire answered by visitors.
Evaluation and Results
As we were curious in which ways people without any specific previous knowledge or inter-est in data representations would interact with our data exploration matrix, we exhibited itduring an open lab day of the Media Informatics and Human-Computer Interaction Groupsof the Department of Informatics of the LMU Munich. At the evening event around 100visitors, mainly students of media informatics or computer science but also professors andthe interested public, interacted with our prototype (see Figure 5.18-left). We observed theparticipants, took notes and had informal discussions with them. We also encouraged themto fill out a short questionnaire, which 30 of them did.
Most participants agreed that the data exploration matrix is fun to use (93.3%) and easy tointeract with (83.3%). The results are illustrated in Figure 5.18-right. The main point of criticregarding the usability was the sparse labeling, especially of the tangible control elements.It was mentioned by three participants that the distance the LEDs can move up and downshould be increased and allow intermediate stages. The request for a larger matrix with moreLEDs and the possibility to touch them was made by two participants. The observations anddiscussions revealed that participants, in particular, liked the tangible control elements andthe direct feedback. It was also intriguing to see that the prototype led to a discussion aboutthe dataset and encouraged participants to collaborate and explore the data together.
The physicalization is suitable for exploring data and gaining new insights, as 27 participantsagreed to this statement. It was encouraging to see that 15 of them could name specific factsthey learned, e.g., that France generated less electricity with nuclear power in 2010 than in2005. In summary, this leads to the assumption that the majority of people understood howto use and read the data exploration matrix to gain new insights, all joined with a playfuland fun experience.
87
5 Beyond Physical Bar Charts
Discussion
The informal evaluation of our first prototype in the area of dynamic physical visualizationsshowed that they are a promising way of representing abstract data. Participants had funexploring the data and could gain new insights. It was in particular interesting to see in whichways they enjoyed playing around with the tangible control elements. The positive feedbackwas only little related to the aspect that the physicalization was dynamic. Our setting seemedto encourage participants to explore both, the options and interaction possibilities of the dataexploration matrix as well as the underlying dataset in a collaborative manner. This leadsto the assumption that physicalizations, in general, have the potential to foster collaboration,similar to tangible user interfaces (e.g., Schneider et al. [2011, 2012]).
It is worth mentioning that our prototype of a shape display was kept rather simple, especiallycompared to state-of-the-art 2.5D shape displays (e.g., Leithinger et al. [2011]; Follmer et al.[2013]; Leithinger et al. [2015]). This could explain the moderate and little feedback par-ticipants gave related to the possibility of the LEDs to move up and down. The design andimplementation of our prototype illustrated that the required technological complexity ishigh, closely related to the costs. Bearing this in mind it seemed more exciting and alsoimportant to focus on the investigation of human aspects related to physicalizations, e.g., inwhich ways the physical modality influences the perception and experience of data explo-ration. Therefore, concentrating less on tackling technical aspects. Findings in the area ofperception can, in addition, provide motivation for further research on shape displays.
5.3.2 Swirlization
This subsection describes the second project we designed in the area of dynamic physicaliza-tions. In the last subsection we introduced a prototype which was inspired by simple shapedisplays and a traditional matrix visualization. In this project we followed a more artisticapproach. The final prototype explored in which ways a water swirl can be transformedinto a data representation, e.g., by changing its depth. We were interested to see in whichways people would interact with our Swirlization, whether it supports the retrieval and ex-ploration of the underlying data and which application scenarios seem suitable for such adata representation.
Motivation & Background
Our initial prototype of a dynamic physicalization was inspired by 2.5D shape displays andwas based on changing the physical geometry, i.e., modifying the height position of sin-gle LEDs. As we tried to keep the technological complexity and general costs on a smalllevel, the outcome seemed to be a bit unimpressive for our participants, especially comparedto state-of-the-art 2.5D shape displays. Participants were rather fascinated by the tangiblecontrol elements and the LEDs matrix in general than by the possibility that the LEDs canmove up and down. Therefore, the motivation for the second project was to turn away from
88
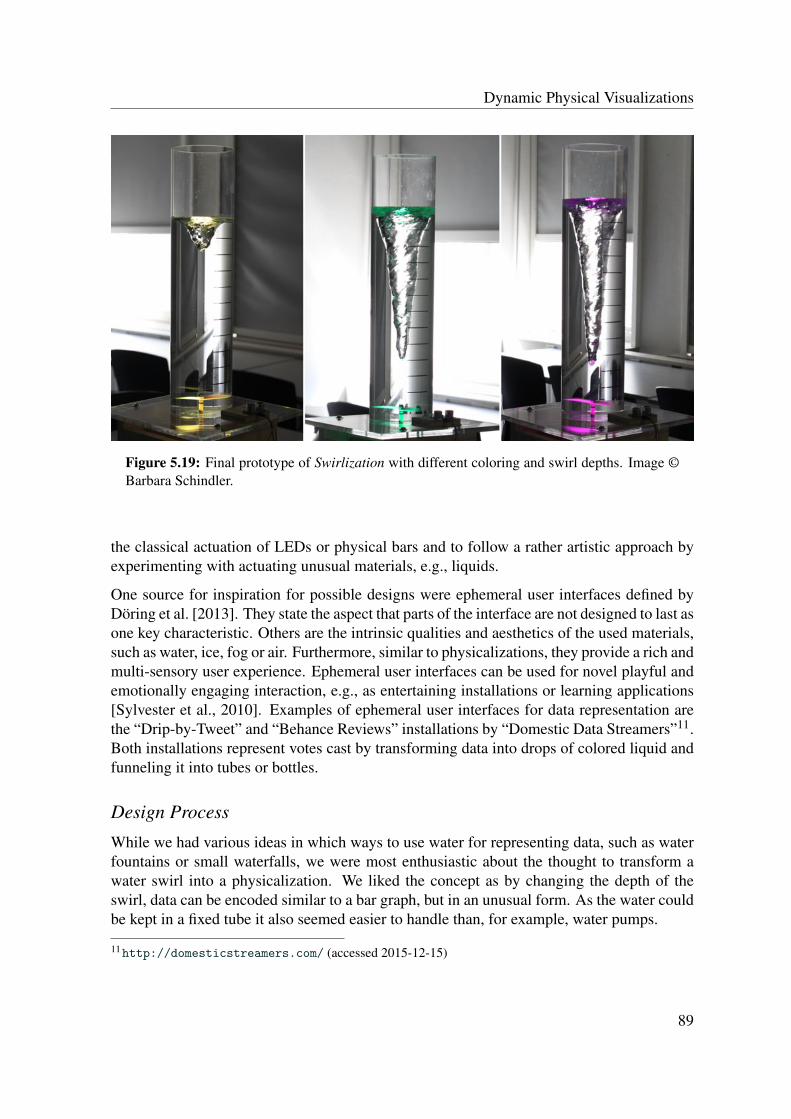
Dynamic Physical Visualizations
Figure 5.19: Final prototype of Swirlization with different coloring and swirl depths. Image ©Barbara Schindler.
the classical actuation of LEDs or physical bars and to follow a rather artistic approach byexperimenting with actuating unusual materials, e.g., liquids.
One source for inspiration for possible designs were ephemeral user interfaces defined byDöring et al. [2013]. They state the aspect that parts of the interface are not designed to last asone key characteristic. Others are the intrinsic qualities and aesthetics of the used materials,such as water, ice, fog or air. Furthermore, similar to physicalizations, they provide a rich andmulti-sensory user experience. Ephemeral user interfaces can be used for novel playful andemotionally engaging interaction, e.g., as entertaining installations or learning applications[Sylvester et al., 2010]. Examples of ephemeral user interfaces for data representation arethe “Drip-by-Tweet” and “Behance Reviews” installations by “Domestic Data Streamers”11.Both installations represent votes cast by transforming data into drops of colored liquid andfunneling it into tubes or bottles.
Design Process
While we had various ideas in which ways to use water for representing data, such as waterfountains or small waterfalls, we were most enthusiastic about the thought to transform awater swirl into a physicalization. We liked the concept as by changing the depth of theswirl, data can be encoded similar to a bar graph, but in an unusual form. As the water couldbe kept in a fixed tube it also seemed easier to handle than, for example, water pumps.
11http://domesticstreamers.com/ (accessed 2015-12-15)
89

5 Beyond Physical Bar Charts
Figure 5.20: Left: Used hardware components and setup of Swirlization. Right: A participantuses the ultrasonic sensor to interact with our prototype. Image © Barbara Schindler.
As a container, we used a transparent acrylic glass tube with a height of 50 cm and a diameterof 11.4 cm, which was mounted on a wooden rack for stability. The swirl was generated bya rotor conjoined with a drive shaft which was powered by a motor (see Figure 5.20-left).By controlling the motor speed and therefore the number of revolutions the depth of thewater swirl could be controlled (see Figure 5.19). We experimented with different motorsand drive shafts to realize a quick and direct feedback of the swirl as well as a high depth.For aesthetic reasons and to add another dimension for data encoding we attached 16 RGBLEDs at the bottom side of the tube. Our final prototype with different coloring and swirldepths is displayed in Figure 5.19.
As underlying dataset, we used again the Better Life Index12 published by the OECD, whichwe already used for the threaded bar-star-plot (see subsection 5.1.1 - Threaded Bar-Star-Plot). The topic seemed interesting for participants to analyze and the dataset had normalizedvalues ranging from 0 to 10 to rank the different countries. Bearing in mind that the depth ofthe swirl is not precisely controllable, one characteristic of ephemeral user interfaces [Döringet al., 2013], it seemed reasonable to limit the range of values to allow a bit of tolerance inthe representation of the data. As a legend for the dataset, we used laser cut external displays(see Figure 5.21-left), which could easily be removed and therefore allow an experience ofthe Swirlization without a specific dataset.
12http://www.oecdbetterlifeindex.org/ (accessed 2015-12-15)
90

Dynamic Physical Visualizations
We discussed various ideas on how to interact with the Swirlization. As we used a cylindricaltube as a container which easily can be circled by people, one idea was to use the position ofa visitor as input. Other concepts included the use of tangible tokens, external touch devicesor touch sensing on the tube itself. In the end, we decided to investigate during the evaluationwhether and how participants would like to interact with our prototype and used easily toimplement mid-air gestures as the basic interaction technique.
We used an ultrasonic sensor and a “Leap Motion”13 for the tracking of the mid-air gestures.With the ultrasonic sensor, it was possible to control the depth of the swirl by varying thedistance between the sensor and the hand. In this mode, the bottom of the swirl was onthe same level than the hand. To navigate through the dataset, we used standard gesturesprovided by the API of the “Leap Motion” Software Development Kit (SDK). A circlegesture changed the category and a swipe gesture the selected country. The swirl was thencolored analogous to the category color, and the country name was highlighted on the legend.
A “Raspberry Pi”14 functioned as a microcontroller that ran the main program code, re-acted on input by the ultrasonic sensor and controlled the LEDs and the speed of the motor.The “Leap Motion” was plugged into a laptop because of performance issues. Recognizedgestures were then transferred via WiFi to the “Raspberry Pi”.
Study Design
Similar to the previous evaluations the primary goal was to observe in which ways partici-pants experience the physicalization. We were also interested in participants ideas regardingpossible interaction techniques for the Swirlization. We also wanted to know if such a sys-tem actually has a potential for representing abstract data and what participants consider aspossible usage scenarios.
The study took place in an isolated, quiet and dim lighted room equipped with our prototypeconsisting of the physicalization and the legends, which were hidden at the beginning justas the laptop and the “Leap Motion”. It had a duration of about 30 minutes and begun withquestions about demographics and previous experience with data representations. The mainpart of the study was a presentation phase, in which were ran an auto program that displayedthe possibilities of the physicalization, such as changing the coloring and the depth of theswirl, but without any specific dataset. Participants were encouraged to think aloud aboutpossible usage scenarios and interactions but also about the entire experience. In the secondpart, we added all external devices and gave participants a short explanation about the datasetand the interaction techniques. Participants were asked to explore the physicalization and tofulfill a few information retrieval tasks to evaluate if they understood the data representation.The study ended with a questionnaire and a semi-structured interview about participant’sopinions regarding the prototype.
13https://www.leapmotion.com/ (accessed 2015-12-15)14https://www.raspberrypi.org/ (accessed 2015-12-15)
91

5 Beyond Physical Bar Charts
Figure 5.21: Left: Legends for the underlying dataset were presented on external displays.Right: Participants experimented with unusual interaction techniques. Image © BarbaraSchindler.
We had ten participants (five female) with an average age of 27 years (range: 22-36).While four participants were students of media informatics, the remaining studied educa-tion, medicine, history of art, romance philology, experimental physics, and American his-tory, culture and society. Therefore only three participants stated that they had experiencewith data representations. Participants received a 5 Euro voucher for an online shop.
Results
All participants found the Swirlization as visually pleasing as well as fun to use. One partic-ipant stated: “It just looks cool. It is hard to look the other way.” Another attributed “somekind of hypnotic effect” and a “visual attraction.” Participants also understood how to readthe underlying dataset, as nine participants mentioned that the data representation was easyto understand, and 88% of the tasks were fulfilled correctly. They also rated the interactiontechniques as comfortable and appropriate.
The most mentioned ideas regarding interaction possibilities were touching and rotating thetube or the water itself (see Figure 5.21-right). Some mentioned that the distance between avisitor and the physicalization could have an effect. Others preferred voice control and a fewalready noted mid-air gestures. Almost all participants mentioned the possibility to throwsomething into the tube, e.g., little plastic beads, to start a program or display a particulardata point. One participant suggested physical tokens for each country and category and bythrowing a combination of them into the tube, the particular data would be displayed.
92

Dynamic Physical Visualizations
It was rewarding to see that our physicalization stimulated participant’s creativity as theylisted various usage scenarios. Several participants associated the water swirl with the gen-eral area of weather and therefore proposed to display wind forces or the intensity of tor-nadoes or hurricanes. Because of its aesthetics, others thought of an informative piece ofscenery, which could be used in a foyer, a yoga studio or a doctor’s office to visualize thetime or the waiting period. One participant even mentioned that it could be used as a fuelindicator in an electric car. The most mentioned application scenario was education, e.g.,kindergarten, school, or museum, in which it could be used as a playful alternative to presentand explore data.
The largest point of critique were the external laser cut legends. All participants mentionedthat they would prefer a display more close to the physicalization, i.e., to the tube and theswirl. They also mentioned that the wood optic would not fit the acrylic glass tube. Someparticipants suggested using projections for the display of more detailed information.
Discussion
The design process and evaluation of Swirlization showed that moving from rigid materialsto liquids for representing data is an exciting possibility for physicalizations. It demonstratedthat a playful interaction with diverse materials is a promising way for representing abstractdata. Our results strengthen the promises that physicalizations have the quality of evokingfascination and curiosity as well as turning data exploration into an enjoyable experience.
It is worth mentioning that such fascination is always generated by the novelty effect on somelevel. If those physicalizations as our Swirlization will be more common, e.g., as a classicalinstallation in a museum, their power to provoke a memorable experience will probablydecrease. In contrast to our previous prototype, our second prototype in the area of dynamicphysical visualization illustrated the opportunities and possible benefits of actuating physicalmaterials for the representation of data.
It also showed that such physicalizations benefit from their “uniqueness”, which is hardto measure and therefore, challenging to compare to other data representations. Based onthese findings and our general experiences with designing and evaluating physicalizationswe decided to focus on static physicalizations instead of technological complex dynamicphysicalizations. We also wanted to concentrate on physicalizations that are related to tra-ditional types of 2D visualizations. This allowed a rather fair comparison of representationmodalities and thereby seemed to offer the chance to draw stronger conclusions about thebenefits of encoding data in a physical form.
93

5 Beyond Physical Bar Charts
94

Chapter6Potential for Perception &
Memorability
The decision to focus on the question how the physical modality affects the perception andmemorability of data were mainly based on the statements made by participants in our earlyevaluations as well as our collected experiences and observations (see Chapter 5 - BeyondPhysical Bar Charts). Several participants mentioned memorability aspects when askedabout possible benefits of physicalizations. During the evaluation of the layered physicalvisualizations (see Subsection 5.1.2 - Layered Physical Visualizations and textitSubsectionrefsubsec:LayeredPhysicalVisualizationsonTabletops - Layered Physical Visualizations onTabletops) participants stated that they believe they could remember data better when itis encoded in a physical form. They motivated their assumptions with the natural thirddimensionality which is provided by physicalizations as well as the direct haptic feedbackand the fact that they make use of spatial imagination.
Our early evaluations focused on time and error or general observations on ways in whichparticipants use and interact with novel physicalizations. While the results showed that phys-icalizations are suitable for analytical tasks, it usually took more time to fulfill tasks with thephysicalizations compared to 2D visualizations. Therefore, it seemed a promising approachto explore areas that go “beyond time and error”. We also learned about the challengesof evaluating physicalizations, especially to only manipulate the presentation modality toachieve a fair comparison and to avoid experimental bias [Jansen et al., 2015]. These ex-periences led to the decision to concentrate on traditional and well-known bar charts asvisualization type.
Personal contribution statement: The content of this chapter is based on two student’s theses by JeannetteSchwarz [2014] and Moritz Hobe [2015]. Part of it was published in two articles by Stusak, Schwarz, andButz [2015] and Stusak, Hobe, and Butz [2016]. See Disclaimer for a detailed overview.

6 Potential for Perception & Memorability
This chapter presents two studies, which are based on these considerations and evaluatedthe information recall of data perceived with physicalizations. The first study compareda static physical bar chart to a bar chart displayed on a tablet screen in a between-groupdesign. The information recall of 40 participants was measured by a questionnaire about therepresentation’s content, once immediately after exploration, and again after two weeks. Thesecond study evaluated 2D and 3D modular physical bar charts, in particular, a paper-basedrepresentation and a version built with wooden blocks. In a repeated measures study with 16participants, the memory performance was recorded immediately after the exploration andwith a delay of one week.
6.1 Static Physical Bar Charts
Our first study that evaluated memorability aspects of physicalizations compared digital andphysical static bar charts. The digital representation was displayed on a tablet screen, and thephysicalization was built with colored laser cut acrylic glass (see Figure 6.1). Based on theexperiences collected in a pre-study we conducted a study with 40 participants in a between-group design and measured the recall performance immediately after exploration and witha delay of two weeks. The questionnaires to test the recall performance consisted of threequestion categories: extreme values, numeric values, and general facts. The results revealedthat participants who perceived the data with the physicalization forgot less informationabout maximum and minimum values within two weeks.
Figure 6.1: The static bar charts in the digital and physical modality which were used in ourstudy.
96

Static Physical Bar Charts
6.1.1 Motivation & Background
Our initial motivation to investigate in which ways the physical modality influences theperception and memorability of data are based on our early explorations with different pro-totypes of physicalizations. Multiple participants stated during the studies that they see a po-tential for physicalization in memorability aspects. In informal discussions with colleaguesand on conferences at which we presented our early prototypes, this topic was mentionedconsistently. Finally, Jansen et al. [2013] suggested, that future studies should investigateother factors than pure performance and named in a later article memorability as one rele-vant criterion [Jansen et al., 2015]. This subsection briefly motivates the decision to lookinto memorability aspects of data representations. It also gives further indications that thereare justified expectations that the physical modality can influence the perception and memo-rability of information.
Perception & Data Representation
As it is not possible to cope the entire research area regarding the perception of data repre-sentations, we only briefly discuss related studies. Compared to a 2D bar chart on a digitalscreen, a physical bar chart has by nature a third dimension, which can be seen as a visualembellishment. The “data-ink ratio” by Tufte [1986] proposes that all ink that is not usedto present data should be removed. Similarly, Cleveland [1985] recommends a minimalistapproach, to reduce interpretation effort and to increase accuracy. However, study results inthis area are undecided.
Studies found negative effects when adding a third dimension to a bar or pie chart, e.g., re-garding the accuracy or evaluation time [Siegrist, 1996; Zacks, 1998; Schonlau and Peters,2012]. Visual embellishments, e.g., rounded tops for bar charts, can impact absolute andrelative judgments negatively [Skau et al., 2015]. While one study found a relation betweena high data-ink ratio and faster response times as well as greater accuracy under specific con-ditions [Gillan and Richman, 1994], others could not confirm these results [Spence, 1990;Blasio and Bisantz, 2002; Kulla-Mader, 2007; Moere et al., 2012]. Other studies revealedthat participants seemed to prefer non-minimalist graphs [Levy et al., 1996; Inbar et al.,2007], e.g., for showing information to others. They also found that adding “visual difficul-ties” might enhance comprehension of the data [Hullman et al., 2011; Borgo et al., 2012].
In our opinion, the third dimension in a physical bar chart is no visual embellishment, asphysical objects have a third dimension by nature. For physicalizations this should not berated as a distractor, although it encodes data in a redundant way. It should rather be assessedas “properly designed chart junk”. Therefore, we do not believe that the physical modalityimpacts the accuracy of data perception compared to the digital counterpart, assuming bothhave the same visual mapping.
97
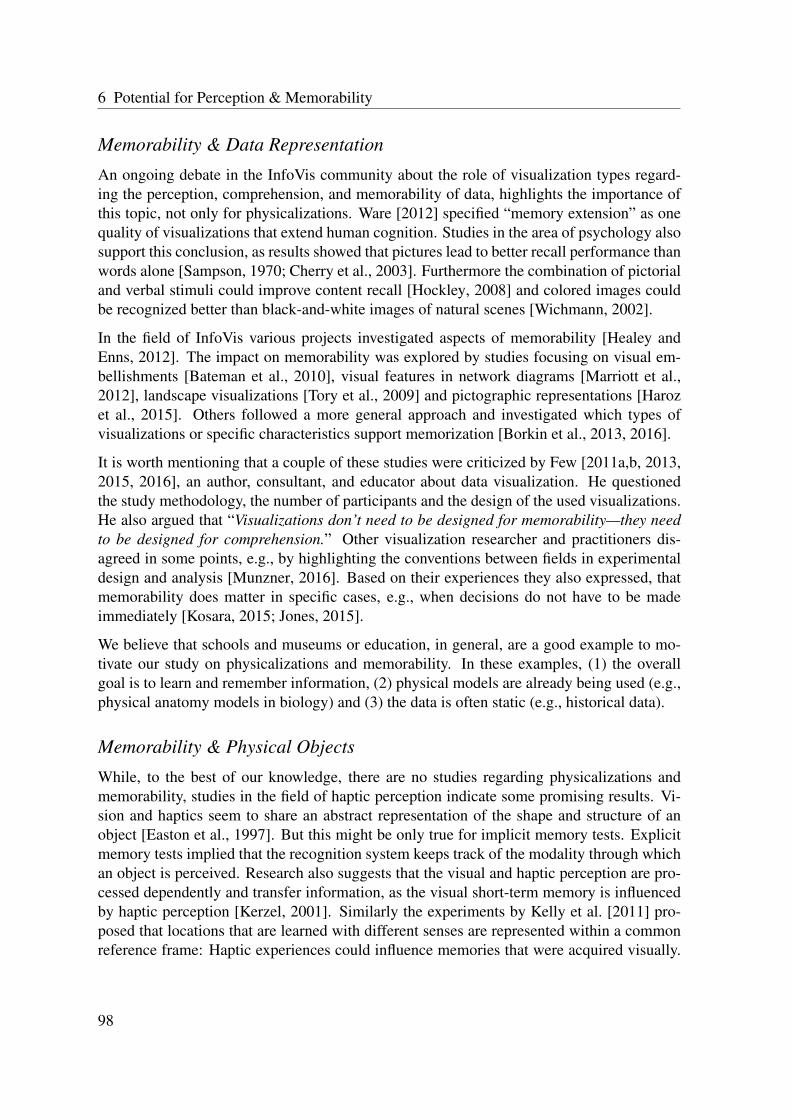
6 Potential for Perception & Memorability
Memorability & Data Representation
An ongoing debate in the InfoVis community about the role of visualization types regard-ing the perception, comprehension, and memorability of data, highlights the importance ofthis topic, not only for physicalizations. Ware [2012] specified “memory extension” as onequality of visualizations that extend human cognition. Studies in the area of psychology alsosupport this conclusion, as results showed that pictures lead to better recall performance thanwords alone [Sampson, 1970; Cherry et al., 2003]. Furthermore the combination of pictorialand verbal stimuli could improve content recall [Hockley, 2008] and colored images couldbe recognized better than black-and-white images of natural scenes [Wichmann, 2002].
In the field of InfoVis various projects investigated aspects of memorability [Healey andEnns, 2012]. The impact on memorability was explored by studies focusing on visual em-bellishments [Bateman et al., 2010], visual features in network diagrams [Marriott et al.,2012], landscape visualizations [Tory et al., 2009] and pictographic representations [Harozet al., 2015]. Others followed a more general approach and investigated which types ofvisualizations or specific characteristics support memorization [Borkin et al., 2013, 2016].
It is worth mentioning that a couple of these studies were criticized by Few [2011a,b, 2013,2015, 2016], an author, consultant, and educator about data visualization. He questionedthe study methodology, the number of participants and the design of the used visualizations.He also argued that “Visualizations don’t need to be designed for memorability—they needto be designed for comprehension.” Other visualization researcher and practitioners dis-agreed in some points, e.g., by highlighting the conventions between fields in experimentaldesign and analysis [Munzner, 2016]. Based on their experiences they also expressed, thatmemorability does matter in specific cases, e.g., when decisions do not have to be madeimmediately [Kosara, 2015; Jones, 2015].
We believe that schools and museums or education, in general, are a good example to mo-tivate our study on physicalizations and memorability. In these examples, (1) the overallgoal is to learn and remember information, (2) physical models are already being used (e.g.,physical anatomy models in biology) and (3) the data is often static (e.g., historical data).
Memorability & Physical Objects
While, to the best of our knowledge, there are no studies regarding physicalizations andmemorability, studies in the field of haptic perception indicate some promising results. Vi-sion and haptics seem to share an abstract representation of the shape and structure of anobject [Easton et al., 1997]. But this might be only true for implicit memory tests. Explicitmemory tests implied that the recognition system keeps track of the modality through whichan object is perceived. Research also suggests that the visual and haptic perception are pro-cessed dependently and transfer information, as the visual short-term memory is influencedby haptic perception [Kerzel, 2001]. Similarly the experiments by Kelly et al. [2011] pro-posed that locations that are learned with different senses are represented within a commonreference frame: Haptic experiences could influence memories that were acquired visually.
98

Static Physical Bar Charts
It has also been shown that physical objects could be remembered better than pictures, andpictures better than words [Bevan and Steger, 1971].
Jones et al. [2005] compared the presentation of written content, such as advertising or con-sumer information, on printed paper and a digital screen. The results suggested that printoutperforms the screen modality on recall but not on recognition. A study with a strongerrelation to data representations, but focusing on spatial memory and item retrieval times, wasconducted by Cockburn and McKenzie [2002]. They investigated the effectiveness of spatialmemory for physical and digital arrangements of images in 2D and 3D. The participantsfound interfaces with more dimensions less efficient, but the physical modality performedbetter than the on-screen modality.
Therefore, we believe that the additional natural dimension of a physicalization and theirunique characteristics can provide value as an aesthetic property, but also for comprehensionand memorability. With their perfect visual realism and their opportunity to be touchedor grasped, physicalizations could generate a more detailed representation in the subjects’memory, which could lead to a better memorability compared to their digital counterparts.
6.1.2 Design Process
Here we motivate our choices for the dataset and type of representation and describe thedesign of the digital and physical representations. We also present the procedure and resultsof a pre-study. The goal of the pre-study was to discover first tendencies, collect experiencesabout different study procedures and spot potential problems.
Datasets
We had two main decision criteria regarding the underlying dataset: (1) the topic shouldbe interesting to a wide audience, but at the same time not too popular, to minimize theeffect of previous knowledge and to allow a reception and memory of new information; (2)the complexity of the dataset should be on the one hand at a level at which the recall ofthe entire content is hardly possible. On the other hand, if the number of distinct piecesof information was too small, remembering the content might be too easy. Similarly, if thedataset was too complex, reading difficulties might distract from the actual content.
Therefore, we used country indicator data of two newsworthy topics from the Human Devel-opment Report (HDR)1, an annual report about the development of the world’s countries andtheir impact on individual lives. The first topic on social integration dealt with issues suchas trust and perceived safety in individual countries. The second topic on population trendsaddressed problems in the demographic change of countries. For both topics we extracteda subset, consisting of the values for six countries and six different subtopics per country(2x36 values in total).
1 http://hdr.undp.org/ (accessed 2015-12-15)
99

6 Potential for Perception & Memorability
Data Representation Type
We chose vertical 2D bar charts as the type of representation. They are well-known andconceptually easy to understand by people without experience in InfoVis. We decided touse 2D bar charts instead of 3D versions and static ones instead of dynamic or interactiveprototypes to focus solely on effects of the modality of the representation. The experiment’sresults should therefore not be influenced by a novelty effect, a difficulty in interpretation orspecific interactions. Furthermore, such bar charts can be made perceptually similar for thedigital and physical modality using standard software and digital fabrication technology.
Data Representation Modalities
The general visual design was based on the visualizations that are available on the HDRwebsite, which is generated by the visualization tool socrata2. This way we could excludeinherent biases through the design, as colors, guides and most of the labeling was predefined.
The final design of the digital bar chart for the social integration dataset is displayed inFigure 6.2-left. The only changes for the pre-study we made within the original visualiza-tion taken from the HDR website was an adaption of the legend. We switched the languagefrom English to German, added little descriptions for each category and applied minor de-sign changes (see Figure 6.2-right). The visualization was shown on an Apple iPad Air(2048*1536 px., 264 ppi) in full-screen display (see Figure 6.1). By choosing a tablet de-vice instead of a classic desktop setting, we could enable similar conditions between thetwo modalities. Both had a similar size (physical: 28.5 cm x 17.0 cm; digital: 23.9 cm x16.8 cm), weight (physical: ≈350 grams; digital: 454 grams) and could be held convenientlyin one or both hands.
The single bars of the physical bar chart (see Figure 6.3) were built from 8 mm transparentacrylic glass using a laser cutter and were colored with acrylic paint. They were glued ontoa base acrylic glass layer, which contained the labels for countries and the legend printedon self-adhesive foil. The colors and general layout of the physicalization matched those ofthe digital visualization. The single bars had engraved lines as a reading aid and numericvalues which were also attached to the bars with self-adhesive foil. A transparent acrylicglass panel (28.5 cm x 17.0 cm x 0.2 cm) with engraved numeric values and lines served asa background.
Pre-Study
To discover first tendencies and test the study procedure, we conducted a pre-study with abetween-groups design and three independent variables: modality (physical, digital), mem-orization (implicit, explicit) and time (immediately, delayed).
2 www.socrata.com (accessed 2015-12-15)
100

Static Physical Bar Charts
Figure 6.2: Left: The static digital bar chart for the social integration dataset. Right: Theoriginal labeling from the visualization on the HDR website for the social integration dataset(top) and our changes for the pre-study (center) and main study (bottom).
Method We chose a between-groups design instead of a between-subject design to avoida potential novelty effect that might occur when participants are not familiarized with phys-icalizations. Our concern was that due to its novelty the physicalization could draw moreattention and in the worst case influence or overrule the memory of the digital representation.
We looked at implicit and explicit memorization as we were interested in how large the dif-ference of remembered information would be. While we preferred an evaluation of implicitmemorization, as this seemed a more frequent use case, we worried that participants wouldonly recall the most obvious facts about a dataset, when not told to explicit memorize thecontent.
For an equal reason, we wanted to have a look at the effect of the time when participants hadto recall the information. In the immediate recall condition, the received information couldbe similarly “present” in both modalities and a potential benefit of the physical modalitycould become only noticeable after a period of time. We chose a delay of one day, to keepthe total study period rather short. Also, research assumes that already after one day only30% of received information can be remembered. However, this is based on memorizingnonsense syllables [Ebbinghaus, 1885]. We focused on (cued) recall instead of recognitionas this type of memory retrieval seemed more related to our motivation example of educationand museums.
Participants We had 24 participants (eight women) with an average age of 25 years (range:23-27). All except one were students, of which 22 studied computer science or media in-formatics and one theater-science. One participant worked as a user-experience designer.Participants received a 10 Euro voucher for an online shop.
101

6 Potential for Perception & Memorability
Procedure The pre-study took place in an isolated and quiet room equipped with a laptopand the two representations. It had a duration of about one hour and started with a demo-graphic questionnaire and questions about previous experience with data representations. Inthe reading phase, one of the representations were presented to each participant in a coun-terbalanced order. The study leader encouraged the participants to explore the visualizationand think aloud about all insights and content-related issues. The participants in the explicitmemorization group were told to memorize as much as possible, as they had to answer ques-tions about the content afterward. For the implicit memorization group, this ahead warningwas not given.
While a participant was exploring the representation, the study leader checked a list of pre-defined facts (e.g., all country names and categories) which every participant was supposedto speak out loud during the reading phase. After the participant had finished reading, a fixedset of questions (e.g., which countries are shown in the representation?) were asked whilethe representation was still available to complete participant’s knowledge, if necessary. Afterthe reading phase, participants had to fill out a questionnaire collecting qualitative data.
The recall phase started either directly after the questionnaires or during a session on thefollowing day. Participants were asked to recall freely everything they remembered aboutthe representations. All answers were noted, and when the participants did not know anymore facts, predefined questions were asked to support the recall phase. We videotaped therecall phase, which was transcribed by two researchers. We calculated a recall score whichwas inspired by Bateman et al. [2010], in which one point was given for each correct fact and0.5 points if facts were not completely right or remembered after the predefined questions.
Results As we had three independent variables, a between-groups design, but a smallgroup size, the results of the pre-study should be considered with caution and can only re-veal first tendencies. Participants using the physicalization seemed to remember more factsin total (physical: M=29.58, SE=8.54; digital: M=22.25, SE=6.42), but the scores con-verged if only looking at the delayed recall (physical: M=22.58, SE=9.22; digital: M=19.5,SE=7.96). This was contrary to our assumption that the physical modality could have advan-tages for a postponed recall. The aspect of telling participants to remember the content didnot seem to have any effect (explicit: M=25.95, SE=3.22; implicit: M=25.875, SE=2.49).This was also contrary to our assumption that subjects would recall fewer facts when notexplicitly told to memorize them.
The pre-study also led to insightful observations and feedback from the participants. Partici-pants did not frequently interact haptically with the physicalization, as most participants didnot pick up the physicalization and neither used both hands for holding nor traced the barswith their fingers. Participants tended to tilt the physicalization to have a better perspectiveand to make use of the guides on the background panel. Two participants complained thatreadability for the physicalization was only granted when looking from the front and notfrom above. They suggested decreasing the space between the background panel and thebars. Three participants stated that the two-row design of the legend was confusing.
102

Static Physical Bar Charts
Figure 6.3: The static physical bar chart which was used in our study and a close-up on thebars’ labeling and the background panel.
6.1.3 Study Design
The pre-study revealed first tendencies and gave us confidence in the general study design.Therefore, the main study was based on the procedure of the pre-study but was modifiedaccording to the observations from the pre-study. We also adapted the designs of the rep-resentations based on participants’ suggestions. All modifications will be described in thefollowing.
Method
We kept the between-groups design but focused only on one independent variable: repre-sentation modality (physical, digital). As we could not found any trends between implicitand explicit memorization and participants could remember enough information without ex-plicitly being encouraged to do so, we only tested implicit memorization. As the pre-studyrevealed that the physicalization can have advantages for immediate recall, we kept the con-dition to test participants directly after the exploration. We added a long-term memory testfor all participants with a delay of two weeks.
Recall Performance
One mayor change compared to the pre-study was done regarding testing the recall perfor-mance. While the study leader encouraged participants in the pre-study to tell all remem-bered facts verbally, in the main study, we used an online quiz. This was done to gain amore comparable memory score and to exclude possible influences by the study leader (e.g.,differently phrased or leading questions).
103

6 Potential for Perception & Memorability
The quiz contained a free recall and a cued recall test. In the free recall, participants hadto fill out free text fields with all remembered information based on three questions for eachrepresentation:
• Which countries were shown?
• Which categories were included?
• What other facts do you remember about the representation?
The cued recall consisted of three question categories with 50 questions in total:
• extreme values: Questions related to minimum/maximum values of countries for var-ious categories, in total 24 questions (e.g., “Which country has the most trust in itsgovernment?”. Answers were chosen from a list of the six used countries, as well as“I don’t know.”
• numeric values: Questions related to specific numeric values, in total 12 question (e.g.,“In Brazil, only 15% have trust in their government.”). Answers were chosen from adropdown list including “true”, “false” and “I don’t know.”
• facts: Questions related to general facts of the underlying data, in total 14 questions(e.g., “Germany has more trust in its government than Brazil.”). Answers were chosenfrom a dropdown list including “true”, “false” and “I don’t know.”
The score for the free recall was calculated similarly to the pre-study. The given answerswere analyzed by two researchers, and each correct answer gave one point, too vague an-swers 0.5 points. The calculation for the cued recall was easier, as there were only rightor wrong answers. We decided for both scores to not subtract points for false statements.We further defined a memorability score as the ratio between the scores for the delayed andimmediate recall. If, for example, a subject recalled 60% immediately and 45% after twoweeks, this resulted in a memorability score of 0.75.
Representations
We used the same dataset as in the pre-study and made only little changes to the represen-tations. The legend’s layout was changed for both representations from a two-row design toa one-row design to better correspond to the order of the differently colored bars (see Fig-ure 6.2-right). We also adapted the descriptions and added the unit in which each categorywas measured to the legend, to avoid any lack of clarity which we observed once in a whileduring the pre-study.
To minimize perspective distortion effects of the physicalization we moved the single barscloser to the background panel, as suggested by some participants. As we observed in the
104

Static Physical Bar Charts
pre-study that participants did hardly interact haptically with the physical bar chart, we triedto improve the affordance of a haptic exploration. The massive base of the visualization wassplit into two parts: the legend and the bar graph (see Figure 6.3). Latter consisted out of asmall base which contained all the bars as well as the labels and the background panel. Itcan be removed and held comfortably in one hand while using the other hand to explore thebars. Meanwhile, participants can still read the legend that remains on the table.
Participants
We had 40 participants (17 women) with an average age of 23.5 years (range: 18-32). Theparticipants consisted of students only, of which 37 were Computer Science or Media Infor-matics students, three studied Economics. Participants received a 15 Euro voucher for anonline shop.
Procedure
The study procedure was based on the pre-study. We shortened the qualitative questionnairesat the beginning and the end of the study to reduce the study duration. The reading phase waskept similar to the pre-study, but some of the predefined questions to complete participants’knowledge were rephrased. The reading phase was videotaped, and we also measured thetotal time participants were exploring the representations.
Before starting the immediate recall quiz, participants answered a qualitative and subjectivememory questionnaire to clear the visual and linguistic memory. The online quiz was filledout on a laptop in the study room. Participants did not receive any feedback on their per-formance, nor were they told the correct answers to the quiz. They were informed that theywould have to fill out another quiz in two weeks, but not that it would be the same. Someparticipants suspected there would be another memory test. For testing the delayed recall,participants received a link to the same quiz via e-mail two weeks later and had to completeit at home.
6.1.4 Results
This chapter summarizes our results concerning the evaluation of memorability aspects forstatic physical bar charts. In addition to the performance for immediate and delayed recall,we present qualitative data about participants’ experience and memorization techniques aswell as our observations regarding a haptic exploration of the representations.
Qualitative Questionnaires
After the reading phase, participants had to rate various characteristics of the representationson 5-point Likert scales, ranging from 1=strongly agree to 5=strongly disagree (see Figure6.4). Participants who interacted with the physical bar charts rated the perceived information
105

6 Potential for Perception & Memorability
0% 25% 50% 75% 100%
0% 25% 50% 75% 100%
31 2 4 5strongly agree strongly disagree4
The presented information was well readable
12 4 2
5 11
Phy.
Dig.
11
The presented information was easy to remember
3 12 4
5
Phy.
Dig. 12
1
3
Interacting with the prototype was fun
3124
8
Phy.
Dig. 9
1
3
Figure 6.4: Results of the 5-point Likert scale questionnaires participants filled out after thereading phase, split into the two groups which either interacted with the physical or digitalvisualization.
as more memorable than those who used the digital version. Regarding the aspect of howreadable they found the representations, the group of participants with the physicalizationalso gave higher ratings than the ones with the digital bar charts. Finally, participants withthe physicalizations seemed to have more fun exploring the data than the participants withthe tablet device.
Immediate Recall
For the immediate recall, the total results as the percentage of correct answers were for both,the free recall and the cued recall, slightly higher for the digital modality. A breakdownof the results of the cued recall into the three question categories revealed that the digitalmodality had little advantages for extreme values and the physical for numeric values. Thehighest percentage of correct answers had the digital modality for the category facts, whichalso led to the biggest difference between the modalities. In summary, the immediate recallperformance showed no clear trends regarding one modality. The mean scores for the imme-diate free recall, and all results as the percentage of correct answers for the immediate cuedrecall are displayed in Figure 6.5.
Delayed Recall
For the delayed recall the total results as the percentage of correct answers were for both,the free recall and the cued recall, slightly better for the physical modality. A detailed lookat the results of the each question category revealed that the digital modality had a higherpercentage of correct answers for the facts category. The physical modality had slightlyhigher values for numeric values and reached a higher difference for extreme values. Allresults for the delayed recall are presented in Figure 6.5.
Memorability Score
We also looked at the memorability score for the cued recall, to put the results of the immedi-ate and delayed recall in relation. In total, the score for the physicalizations was a bit higher.The score for the facts and numeric values categories were similar and did not identify any
106
Static Physical Bar Charts
Cued Recall Total
Free Recall Total
Extreme Values
Numeric Values
General Facts
im.
de.im
.de.
im.
de.im
.de.
im.
de.
Physical Modality
Digital Modality
im. = immediate
de. = delayed
50%25%0% 75% 100%50%25%0% 75% 100%
20100 30 40
Figure 6.5: Results of the main study. Top: Mean score for the immediate and delayed freerecall. Bottom: The percentage of correct answers for immediate and delayed cued recall intotal and for each question category (all with 95% CIs).
trend. The score for the category of extreme values showed a quite distinct difference infavor for the physical modality. All results of the calculated memorability score for the cuedrecall in total and for each question category are displayed in Figure 6.6.
Memorization Techniques
We asked participants after each quiz if they used any specific techniques to answer the ques-tions and in which ways they tried to remember the content of the representations. Multipleanswers could be typed into a free text field.
After the immediate recall the most often statements were “visual imagination of the repre-sentation” (24), “association with previous knowledge” (19), “facts that were surprising ordiffered from expectations” (16), “extreme values” (12), “association with newly acquiredknowledge” (19), and “verbally expressed facts” (9). Two participants stated they recalledspecific facts through the given options in the quiz and two others were able to recall factsthrough a personal connection with the country the fact was referring to. Regarding thestatement of “visual imagination”, the amount was split into 14 participants who used thedigital representation and 10 participants who had the physical one.
The statements after the delayed recall were similar and included “visual imagination of therepresentation” (23), “association with newly acquired knowledge” (12), “facts that weresurprising or differed from expectations” (11), “verbally expressed facts” (8), “associationwith previous knowledge” (7), and “extreme values” (6). Two participants stated that they
107

6 Potential for Perception & Memorability
Cued Recall Total
Extreme Values
Numeric Values
General Facts
Physical Modality Digital Modality
0.750.25 0.50.0 1.0 1.250.750.25 0.50.0 1.0 1.25
Figure 6.6: Results of the main study. Calculated memorability score (delayed recall/immediaterecall) for the cued recall in total and for each question category (with 95% CIs).
memorized the answers they gave in the first quiz. Participants regarding the statement of“visual imagination” were again split into 13 participants who used the digital representationand 10 participants who had the physicalization.
Haptic Exploration
Although the physical visualization has been altered to encourage haptic exploration andthe study leader suggested to the participants to hold either representation in their hands,only half of the participants followed this invitation. In the physicalizations group, twelveparticipants touched, held or pointed at the physicalization, while eight looked at it withouthaptic or manual involvement. For the digital modality, eight participants touched or held thetablet device and twelve only looked at the visualization while the tablet laid on the table. Wecould not find any trends in the recall performance between the participants who used hapticexploration and those who only looked at them. Participants spent slightly more time withthe physicalization (M=19.27m, SE=1.50) than with the digital representation (M=17.62m,SE=1.00).
6.1.5 Discussion
Our results suggest that physicality alone was able to increase the memorability of data rep-resentations for a particular kind of information. Here we try to outline possible explanationsbut also discuss general observations and the limitations of our study.
Recall Performance
The percentage of correct answers for the cued recall did hardly differ between groups ineach single comparison. These results are similar to the findings of related studies, which
108

Static Physical Bar Charts
reported that physical and virtual instruction materials are equally effective for learning (e.g.,Triona and Klahr [2003]; Marshall et al. [2010]; Zacharia and Olympiou [2011]). However,participants who used the physicalization forgot clearly fewer facts about maximum andminimum values within two weeks. It is worth mentioning that the digital visualization hada rather low memorability score for the category of extreme values compared to the othertwo question categories. While in the categories of numeric values and facts the modalitywith a higher value for the immediate recall also had a better value for the delayed recall,for extreme values the order swapped.
One explanation is that the visually recalled and imagined shape and position of very highand low bars can be remembered better in the physical modality. This is based on the as-sumption that spatial layouts can be memorized better in a physical setting [Kelly et al.,2011]. Scott [1967] argues that pictures of objects are better remembered than their names,as they are more distinctive. It could be argued, that a physicalization is in general more dis-tinctive than their digital counterpart. We think this could particularly apply to the extremevalues because of the vivid physical height of the bars. Similarly, physicalizations can pro-vide a higher degree of detail and visual realism which is related to the aspect that physicalobjects can be remembered better than their pictures.
As we used a rather simple static bar graph built from acrylic glass, without any actuation orsophisticated interaction possibilities, we believe that a novelty effect hardly could impactthe results. Also, in our opinion, it seems implausible that this caused such a large effectonly for the memorability of extreme values. The same is true for the slightly longer readingtimes for the physicalizations. While we cannot exclude it as an explanation for the reduceddecay, it seems unlikely that this only had an effect on the delayed recall. It is also worthmentioning that the results of the pre-study and main study did differ in some aspects. Theresults of the pre-study, for example, did suggest that physicalizations can have advantagesfor immediate recall, which could not be confirmed in the main study. While we believethat this can be explained by the lower number of participants and the higher number ofindependent variables, this should be investigated in further studies.
General Observations
Surprisingly, two cases in the physical modality group actually gained scores and overallbecame better over time. There are several explanations for this phenomenon. It might havebeen a matter of coincidence and participants have simply guessed wrong in the immediaterecall but guessed right in the delayed recall. Another explanation could be that participantsmight have looked up the data out of interest since it was freely available on the internet. Thisseems unlikely as to display the exact combination of categories and countries, a relativelylarge search effort would have been required. Hypermnesia could also be an explanation,which leads to an increased performance for a repeated recall after a larger time interval.Hypermnesia seems to occur only with images and not with words and therefore, could be aphenomenon in the field of physicalizations.
109

6 Potential for Perception & Memorability
Although the average rating for the readability of the physicalization was higher than for thedigital visualization, three participants found the physical bar chart not readable at all. Acircumstance that did not occur in the digital modality group. This indicates that physicalitymight be a problem for some people, who have, for example, a strong association with thedigital domain. This could also be due to the novel experience and might vanish throughfamiliarization.
It was intriguing to see, that the physicalization was experienced as more fun and more mem-orable although it had only been a physical replicate of a simple and plain bar graph. Thestatements that physical visualizations are more engaging and encourage people to explorean underlying dataset are often related to artistic installations with visual metaphors, whichare commonly used in art exhibitions and museum presentations. However, participants’ratings indicate that physicality alone already has an effect on the user experience.
Limitations
The study also comes with limitations and aspects that should be considered when interpret-ing the results. All participants were students, and the majority had a technical backgroundand experience with data representations. Therefore, the results can not be easily general-ized. Further studies could involve an audience with a broader age range and participantswith less anticipation for the digital domain. It should also be considered to change the studydesign from between-group into within-subject to collect more concrete comparative qual-itative data about the representation modalities. This could lead to further insights whichcharacteristics of a specific representation support the memorization of particular informa-tion.
Participants were allowed to fill out the second interrogation at home. This has lead to avariance of the time span between the completion of the first and second quiz, as someparticipants did not fill out the quiz before we sent a reminder two days later. Furthermore, itcould not be prevented that participants either went to the previous page in the browser andcorrected their results in the free recall part or that they got informed about the content ofthe representations by searching the Internet. Follow-up studies could require a second labsession in which participants have to fill out the quiz and also could be further interviewedabout their experiences.
As another limiting factor, the study procedure involved optional predefined questions andthe verbal expression of all facts the participants explored. The purpose was to ensure thateach participant had the same knowledge before the interrogation. This process of ver-bal expression might have helped some participants more to remember the facts, than thedata representation itself. This potentially confounding factor should be independent of themodality. A clearer approach for future studies could be to give the subjects certain tasksthat induce the same knowledge implicitly.
Furthermore, most participants only held the physical bar chart in their hands but did hardlyexplore it haptically, e.g., by touching or tracing single bars. Tasks that more explicitly
110
Modular Physical Bar Charts
require haptic interaction could change this in further studies. The design of the physicaliza-tion could be adapted to invite further haptic exploration, e.g., by supporting the assemblyand disassembly of single components of the physicalization.
It is noteworthy that there are many criteria other than memorability according to whichthe value of physical visualizations need to be judged (e.g., fabrication costs, interactive ex-ploration, etc.). Furthermore, we evaluated two specific types of data representations, bothwithout any sophisticated interaction possibilities. We believe this is a promising prelimi-nary result for both casual and traditional InfoVis. Particularly for scenarios in which it isdesirable to present memorable information, such as advertisement, journalism or education,the use of physicalizations might have benefits.
6.2 Modular Physical Bar Charts
Our second study regarding the perception and memorability of data perceived with physi-calizations focused entirely on the physical modality. Similar to the previous study the typeof representation was a bar chart, but in this case, we evaluated the difference between apaper-based representation and a version built with wooden blocks (see Figure 6.7).
Based on the results and our observations in the first study we designed and conducted arepeated measures study with 16 participants. We again measured the recall immediatelyafter the exploration and with a delay of one week. Through the between-subject study de-sign and semi-structured interviews, we could collect information about the process of recalland participants’ opinions whether and how the representations differ in their potential formemorizing information. Through a modular design of the bar charts, in which each bar canbe grasped and lifted, we tried to encourage a haptic exploration. The results confirmed ourfindings regarding the better memorization of extreme values perceived with a 3D physicalbar chart compared to a 2D version. We discovered that the physical interaction techniquesthat we used in the study were not able to compensate lacking visual differentiation. Thestudy also revealed that the two datasets had a strong influence on the recall performance.
6.2.1 Motivation & Background
Our primary motivation of the second study was to provide a better understanding of whichcharacteristics of physical bar charts influence the perception and memorization of informa-tion. Based on the findings of our first study we had several research questions we wantedto address.
The results of the pre-study and the main study for the recall performance of information per-ceived with static bar charts did differ in some aspects. Therefore, we wanted to investigateif a second study can confirm our initial findings, especially regarding the better memora-bility of extreme values. The previous study did compare not only the modality but also the
111

6 Potential for Perception & Memorability
Figure 6.7: The modular bar charts which we used in our study, based on wooden blocks andpaper strips.
dimensionality, as our physical bar charts had a third dimension by nature. We were inter-ested in which ways the dimensionality of a physicalization and the related characteristicssuch as volume or weight influence the perception and recall of information.
As in the previous study only little haptic exploration of the physical bar charts occurred,we wanted a stronger focus on physical interactions to investigate in which ways, for ex-ample, disassembling, reassembling, grasping and lifting does influence the perception andrecall performance. To further motivate our design decisions, we give a brief background ofprojects in the area of tangible interfaces that focused on aspects such as learning or problemsolving.
Tangible Interfaces & Memorability
Section 4.2 - Information Visualization & Tangible Interaction already gave an introductionto tangible interfaces and an overview of projects that combined data representation withtangibles. Here we want to focus on projects that investigated tangible interaction in thefield of learning and problem-solving tasks.
O’Malley and Stanton Fraser [2004] argue that there can be real benefits for learning fromtangible interfaces and that carefully designed physical interactions can simplify problem-solving tasks. Similarly, Zuckerman et al. [2005] state that the natural way to learn engagesmultiple senses in a constructive process. The use of tangible user interfaces in learning and
112

Modular Physical Bar Charts
education has received a lot of attention in recent years: they offer a playful approach tolearning [Price et al., 2003], seem to encourage exploration and motivation [Rogers et al.,2002], and are believed as easily accessible to novices [Zacharia and Olympiou, 2011].
As a matter of fact, physical properties and haptic interaction have been used in education fora long time. In Mathematics tangible objects, such as the abacus or nowadays 3D printed ar-tifacts [Knill and Slavkovsky, 2013a], are often used as an aid to teaching the numeral systemor arithmetic. Another example is a technique to teach children how to write by Montessori[1964]. Children have to trace letters, which are cut out of sandpaper, with closed eyes. Thisleads to a perception of the letter’s tactile sensation instead of its visual image and ought toresult in a fixation of the letter’s trace in the muscular memory. Bara et al. [2004] exam-ined the effect of incorporating haptic exploration of foam letters on kindergarten children’sunderstanding of the alphabetic principle. Results of the study showed that the haptic explo-ration can support the understanding of the alphabetic principle and is also likely to improveletter-decoding skills compared to a solely visual exploration.
Although studies often show positive effects in the use of physical materials in education,it is not clear whether this is due to their physicality or rather to the fact that learning withphysical objects typically makes use of active learning and represents information in a moresalient way [Triona and Klahr, 2003]. Also, several studies in the area of tangible interactioncould not show a clear difference between the physical and virtual modality. Triona andKlahr [2003] found that physical and virtual instruction materials were equally effective forschool students to design experiments. Marshall et al. [2010] did not find any effects onadults’ discovery learning tasks using either physical or graphical materials. Zacharia andOlympiou [2011] argue that in the case of physics learning both, a virtual and physical settingsupport students’ understanding of physical concepts equally. In summary, the impact ofhaptics and tangible interaction in education and whether it enhances the learning experienceis still unclear [Minogue and Jones, 2006].
The results of our first study showed, that in the case of data representation, physicalityalone could improve memorization. The results might differ as the previously stated studiesin the area of TUIs have investigated the understanding of concepts, supposedly stored in thenondeclarative memory, but data representations convey factual information and correlationsstored in the declarative memory. We furthermore focused on the difference between the 2Dand 3D modality and explored whether the unique characteristics of physical objects thatcan be perceived haptically can enhance memorability.
6.2.2 Design Process
Based on the previous study and the related projects mentioned above, we determined acouple of aspects we wanted to attach importance regarding the design of the data represen-tations. Here we motivate our decisions and describe the creation of the data representations.
113
6 Potential for Perception & Memorability
DatasetsOur decision criteria regarding the underlying dataset were similar to the ones mentioned inthe previous study. Therefore, we again used two topics from the HDR as the underlyingdataset. The first topic on economic included, amongst others, values of imports and exportsas the proportion of the national product for the individual countries. The second topic onpopulation consisted of data such as the share of the population with a second or tertiary levelof education. In total, we had two datasets, each composed of the values for six countriesand five subtopics (2 x 30 values in total).
Data Representation TypeWe chose a well-known vertical bar chart as the data representation type to minimize theinfluence of difficulties in reading or interpretation on the results, identical to the first study.We intended to encourage haptic interactions that go beyond touching single bars and in-clude grasping or lifting single data points. The goal was to tap the potential of uniquecharacteristics of physicalizations such as weight and volume. To achieve this, we kept thebars modular and followed a token-based approach [Huron et al., 2014b], in which each datapoint is represented by an independent physical token.
Data Representation ModalitiesAs the previous study showed, only manipulating the presentation modality and finding theright alternative to a physicalization for conducting a comparative study is challenging. Acomparison between the digital and physical modality often inherits a comparison of thedimensionality. Therefore, we decided to concentrate on the dimensionality of physicaliza-tions and exclude their digital counterparts.
Specifically, we compared paper-based 2D bar charts with a 3D version built from woodenblocks (see Figure 6.7). We categorized the paper-based representation because of theirthinness as 2D in the following, although strictly speaking all physical artifacts, includingpaper strips, are 3D objects. To create the wooden blocks, we used a wood saw and coloredthem manually (see Figure 6.8-left). The paper-based representations were cut with a lasercutter out of colored drawing paper (160 g/m2) (see Figure 6.8-center). The single bars ofboth physicalizations had the same size, similar colors for each category and small printedflags on them (see Figure 6.8-right). In contrast to the static bar charts in the previous study,we decided against labeling the bars with numeric values. This was done to encouragephysical interaction with the single bars, as we provided a stand-alone scale instead forreading exact values (see Figure 6.9-right).
6.2.3 Study Design
The goal of our study was to learn more about the role of physical characteristics of physi-calizations, such as volume and weight, regarding the perception and recall of the encoded
114

Modular Physical Bar Charts
Figure 6.8: Creation of the physicalizations. Left: The wooden blocks were sawed and coloredmanually. Center: The paper strips were cut with a laser cutter. Right: Examples of one datapoint for the 3D and 2D modality. Image © Moritz Hobe.
data. We also wanted to gain some understanding whether and in which ways physical inter-actions influence this process. To investigate these questions, we conducted a study, in whichwe measured the recall performance once immediately after the exploration of the represen-tations, and once with a delay of one week. To get insights about the subjects’ judgments weused semi-structured interviews.
Participants
We had 16 participants (five women) with an average age of 22.8 years (range: 18-31 years).They were predominantly students of Media Informatics (14 out of 16). Participants receiveda 10 Euro voucher for an online shop.
Procedure
The study took place in an isolated and quiet room equipped with a table (100 cm x 160cm), the physicalizations and a separate computer. We used a repeated measures design forthe study with the independent variables dataset (economic and population) and modality(2D and 3D). The resulting four conditions were counterbalanced using a Latin square. Tomeasure the delayed recall we hold a second session after a gap of one week. The firstsession had a duration of about one hour, the second of about 30 minutes.
115

6 Potential for Perception & Memorability
Participants first had to fill out a consent form and a demographic questionnaire. After that,the exploration phase started, in which one of the data representations encoding one of thedatasets was presented to each participant and several tasks had to be fulfilled. Participantswere also asked to rate different aspects such as memorability, fun and ease of use on 5-point Likert scales after each exploration. Similar to the previous study we focused onimplicit memorization. Therefore, participants were not told about the recall phase or thatthey should try to memorize the encoded data.
Directly after exploring both physicalizations the recall phase started, in which participantshad to complete two online quizzes about each dataset. The order was kept equal to order thephysicalizations were presented. Participants did not receive any feedback on their perfor-mance, nor were they told the correct answers to the quiz. They also received no informationabout the procedure of the second session and that it contained a second quiz.
The second session started and ended with semi-structured interviews. First, we asked par-ticipants which data representation they could remember better after one week and whetherthey could give any details to substantiate their assumption. After filling out two onlinequizzes again, we wanted to know in which ways participants used the memorized physi-calization to answer the questions. We were, in particular, interested in statements aboutphysical characteristics and whether they had experienced any differences depending on themodality.
Tasks
As previously mentioned, participants had to fulfill several tasks during the explorationphase, which can be split into two main categories:
Assembling the physicalization The exploration phase started with a handover of a boxcontaining all paper strips or wooden blocks to the participants. Participants sat in front of anempty table with geographically arranged flags and a legend with the order of the categories(see Figure 6.9-left). We gave participants no further instructions how to fulfill this taskaccurately.
However, the legend provided an order for the categories and the flags on the table a roughposition where to place the bars. This was done as a compromise between the support of afixed spatial frame of reference without limiting the possibilities of haptic interaction. Thehigh level of flexibility in creating or manipulating physicalizations through haptic interac-tions might lead to a loss of a fixed spatial frame of reference, which implies the importantvisual variable of spatial position. If the spatial arrangement changes too often or lacks con-sistency, the data encoding might get more difficult, which could influence the perceptionand memorization, independent from the modality or type or data representation.
Retrieving and comparing single values After assembling the physicalization the studyleader asked participants to name the countries with the highest and lowest values for each
116
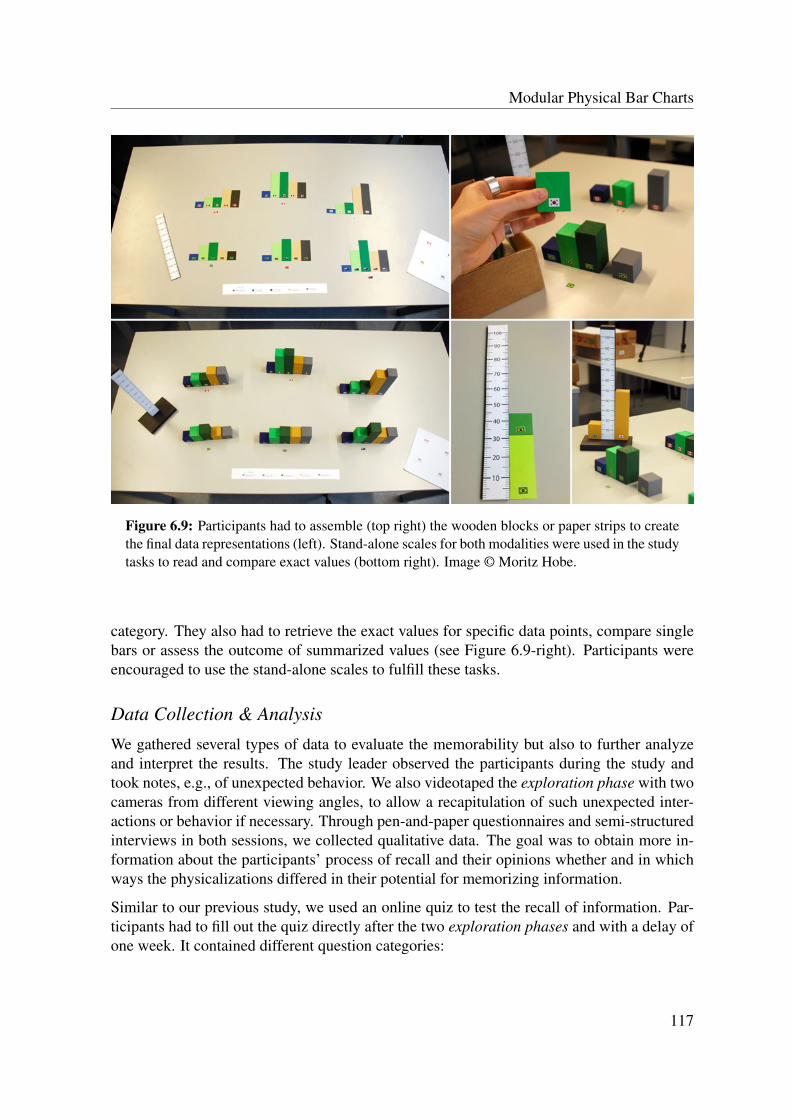
Modular Physical Bar Charts
Figure 6.9: Participants had to assemble (top right) the wooden blocks or paper strips to createthe final data representations (left). Stand-alone scales for both modalities were used in the studytasks to read and compare exact values (bottom right). Image © Moritz Hobe.
category. They also had to retrieve the exact values for specific data points, compare singlebars or assess the outcome of summarized values (see Figure 6.9-right). Participants wereencouraged to use the stand-alone scales to fulfill these tasks.
Data Collection & Analysis
We gathered several types of data to evaluate the memorability but also to further analyzeand interpret the results. The study leader observed the participants during the study andtook notes, e.g., of unexpected behavior. We also videotaped the exploration phase with twocameras from different viewing angles, to allow a recapitulation of such unexpected inter-actions or behavior if necessary. Through pen-and-paper questionnaires and semi-structuredinterviews in both sessions, we collected qualitative data. The goal was to obtain more in-formation about the participants’ process of recall and their opinions whether and in whichways the physicalizations differed in their potential for memorizing information.
Similar to our previous study, we used an online quiz to test the recall of information. Par-ticipants had to fill out the quiz directly after the two exploration phases and with a delay ofone week. It contained different question categories:
117

6 Potential for Perception & Memorability
• extreme values: Questions related to minimum and maximum values (e.g., “Whichcountry had the highest Gross Domestic Product (GDP) growth rate?”). Answers werechosen from a drop-down list and consisted of either a specific country or a specificnumeric value.
• facts: Questions related to general facts about the underlying data (e.g., “In whichcountries did the GDP increase between 2000 and 2010?”). Answers were chosen byselecting the corresponding checkboxes.
• summations: Questions that included the addition of values (e.g., “In which countriesis the addition of secondary and tertiary education higher than 60%?”). Answers werechosen by selecting the corresponding checkboxes.
The questions about extreme values and facts were similar to the categories of the previousstudy. Instead of numeric values we used summations to encourage further physical interac-tion, e.g., placing the bars on top of each other. The list of answers did not include the choiceof “I don’t know”, as this was hardly selected in the previous study. Based on the findingsof the first study, we only focused on cued recall. The quiz after one week contained severaladditional questions that were not part of the first one:
• image recognition: Pictures of the assembled physical bars for one country were dis-played but without the attached flags. Participants had to recognize the country andselect the corresponding checkbox.
• additional general questions: General questions about the underlying data which werenot asked in the first quiz.
The questions regarding image recognition aimed at evaluating not only the semantic knowl-edge received through the representation but also the recognition effect of the optical impres-sion and corresponding physical characteristics. With the additional general questions, wewanted to investigate whether participants recalled information because they had to give theanswers in the first quiz or if they actually remembered the information from the physical-ization.
6.2.4 Results
This section presents the results of our study evaluating the recall performance of informa-tion perceived with modular physical bar charts. We also give a summary of participants’opinions gathered through questionnaires and interviews.
118
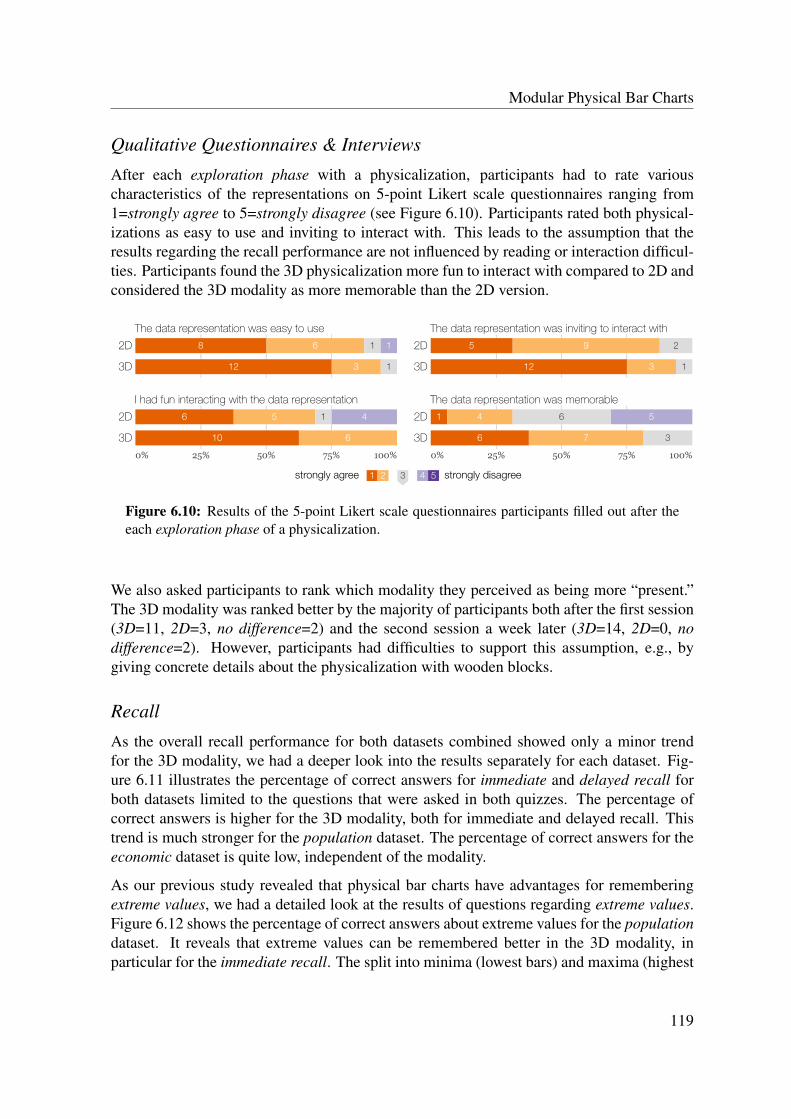
Modular Physical Bar Charts
Qualitative Questionnaires & Interviews
After each exploration phase with a physicalization, participants had to rate variouscharacteristics of the representations on 5-point Likert scale questionnaires ranging from1=strongly agree to 5=strongly disagree (see Figure 6.10). Participants rated both physical-izations as easy to use and inviting to interact with. This leads to the assumption that theresults regarding the recall performance are not influenced by reading or interaction difficul-ties. Participants found the 3D physicalization more fun to interact with compared to 2D andconsidered the 3D modality as more memorable than the 2D version.
The data representation was easy to use
68 1
1312
2D
3D
I had fun interacting with the data representation
56
610
2D
3D
0% 25% 50% 75% 100%
The data representation was inviting to interact with
1
14
2952D
3D
The data representation was memorable
564
37
2D
3D
0% 25% 50% 75% 100%
31 2 4 5strongly agree strongly disagree
1312
1
6
Figure 6.10: Results of the 5-point Likert scale questionnaires participants filled out after theeach exploration phase of a physicalization.
We also asked participants to rank which modality they perceived as being more “present.”The 3D modality was ranked better by the majority of participants both after the first session(3D=11, 2D=3, no difference=2) and the second session a week later (3D=14, 2D=0, nodifference=2). However, participants had difficulties to support this assumption, e.g., bygiving concrete details about the physicalization with wooden blocks.
Recall
As the overall recall performance for both datasets combined showed only a minor trendfor the 3D modality, we had a deeper look into the results separately for each dataset. Fig-ure 6.11 illustrates the percentage of correct answers for immediate and delayed recall forboth datasets limited to the questions that were asked in both quizzes. The percentage ofcorrect answers is higher for the 3D modality, both for immediate and delayed recall. Thistrend is much stronger for the population dataset. The percentage of correct answers for theeconomic dataset is quite low, independent of the modality.
As our previous study revealed that physical bar charts have advantages for rememberingextreme values, we had a detailed look at the results of questions regarding extreme values.Figure 6.12 shows the percentage of correct answers about extreme values for the populationdataset. It reveals that extreme values can be remembered better in the 3D modality, inparticular for the immediate recall. The split into minima (lowest bars) and maxima (highest
119
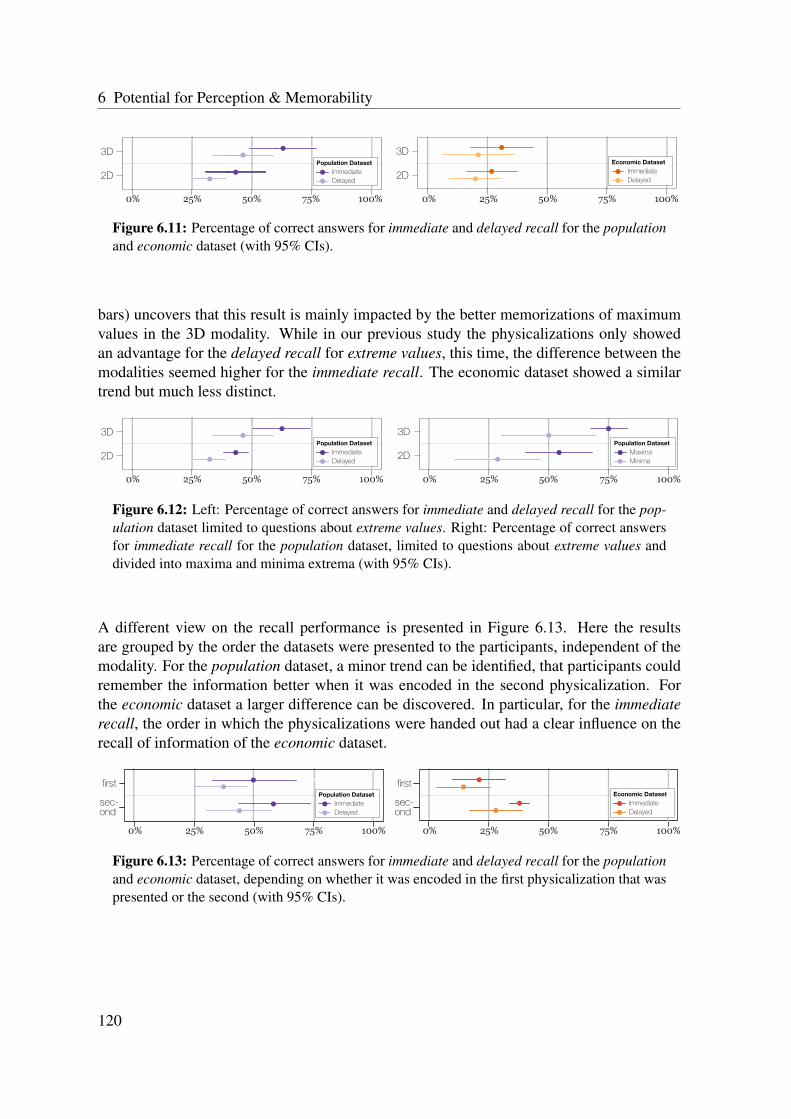
6 Potential for Perception & Memorability
3D
2D
3D
2DImmediateDelayed
Population Dataset ImmediateDelayed
Economic Dataset
50%25%0% 75% 100%50%25%0% 75% 100%
Figure 6.11: Percentage of correct answers for immediate and delayed recall for the populationand economic dataset (with 95% CIs).
bars) uncovers that this result is mainly impacted by the better memorizations of maximumvalues in the 3D modality. While in our previous study the physicalizations only showedan advantage for the delayed recall for extreme values, this time, the difference between themodalities seemed higher for the immediate recall. The economic dataset showed a similartrend but much less distinct.
3D
2D ImmediateDelayed
Population Dataset MaximaMinima
Population Dataset
3D
2D
50%25%0% 75% 100% 50%25%0% 75% 100%
Figure 6.12: Left: Percentage of correct answers for immediate and delayed recall for the pop-ulation dataset limited to questions about extreme values. Right: Percentage of correct answersfor immediate recall for the population dataset, limited to questions about extreme values anddivided into maxima and minima extrema (with 95% CIs).
A different view on the recall performance is presented in Figure 6.13. Here the resultsare grouped by the order the datasets were presented to the participants, independent of themodality. For the population dataset, a minor trend can be identified, that participants couldremember the information better when it was encoded in the second physicalization. Forthe economic dataset a larger difference can be discovered. In particular, for the immediaterecall, the order in which the physicalizations were handed out had a clear influence on therecall of information of the economic dataset.
ImmediateDelayed
Population Dataset
first
sec-ond
first
sec-ond
ImmediateDelayed
Economic Dataset
50%25%0% 75% 100% 50%25%0% 75% 100%
Figure 6.13: Percentage of correct answers for immediate and delayed recall for the populationand economic dataset, depending on whether it was encoded in the first physicalization that waspresented or the second (with 95% CIs).
120
Modular Physical Bar Charts
Regarding the results for facts, summations, and additional questions, that were only askedin the second quiz, a small trend in favor for the 3D modality could be found. The same wastrue for the image recognition questions.
6.2.5 Discussion
While the results partially confirmed our findings from the previous study, they also revealednew observations, e.g., the strong influence of the dataset on the recall performance. In thefollowing we discuss the results in the light of the dataset, the physical interactions, and themodality, but also, state the limitations of our study.
The Role of the Dataset
The results showed a clear difference in the recall results regarding the two datasets. Thepopulation dataset indicates a larger advantage for memorability for the 3D modality in bothquizzes than the economic dataset. The recall performance for the economic dataset was intotal quite low. The rather little differences between the immediate and delayed recall for theeconomic dataset can be explained through the aspect, that a small amount of facts, whichwere surprising or sticking out, can be remembered reliable, possibly independent from thetype of data representation.
Participants also left questions unanswered much more often for the economic dataset thanfor the population dataset. While for the population dataset 85% of the questions wereanswered in the first quiz and 64% in the second, for the economic dataset it were only 62%and 49%. This suggests that participants did not remember the information wrong, but haddifficulties in remembering it at all.
The semi-structured interviews revealed that most participants bore no relation to economictopics and stated that the data was too abstract and less interesting. This could be explainedby the aspect that the majority of our participants were computer science students, with lessinterest or knowledge in economic topics. Jean Piaget’s theory of constructivist learning, forexample, assumes that the assimilation of external information is dominated by internal con-structions and that learning is contextual, which means that humans learn in relationship toprevious knowledge (e.g., Hein [1991]). A different view becomes apparent for the popula-tion dataset, as participants stated that the underlying data consisted of “concrete and easilyimaginable categories.” These aspects seemed to have a relevant influence on the perceptionand memorization of the physicalization and its encoded data.
The quiz results further indicated that the gained information about the economic datasetwas “overwritten” by the following information about the population dataset, but vice versathis effect was much lower. This can be partially explained by the interference theory, whichstates that an interaction between new and past learned knowledge can have an adverse influ-ence on the speed of learning and memory performance. The two main kinds of interference
121
6 Potential for Perception & Memorability
are proactive and retroactive interference. The former explains the forgetting of new infor-mation because of memories and knowledge that was learned beforehand (e.g., Underwood[1957]). The latter describes the phenomenon when newly learned information is disruptingor hindering the recall of previously learned knowledge (e.g., Wohldmann et al. [2008]).
Another potential explanation for the differences appeared when we had a detailed look atthe range of the values in the two datasets. For the population dataset, the distance betweenextreme values and their direct neighbors was higher compared to the economic dataset.This ends in more distinct visual differences, which probably increased the potential formemorization.
The Role of Physical Interaction
As previously mentioned, the visual difference between extremes and the neighboring valueswas higher in the population dataset. Therefore, the visual sense seemed sufficient to dis-tinguish differences and detect extremes for the population dataset, as participants directlycompared two bars only two times on average. In contrast, such comparisons, in which twobars were placed next to each other or measured with the help of the stand-alone scale toidentify the higher or lower one, were made on average almost six times for the economicdataset. This leads to the assumption that the greater number of interactions could not com-pensate the lack of visual differentiation.
During the exploration phase participants had to assemble the overall physicalization fromsingle bars and measure or compare single bars to retrieve values. Surprisingly, there wereno larger differences in the ways in which the participants assembled the physicalization,e.g., all participants placed the wooden blocks upright. While our expectation was that thesephysical interactions, in which participants had to grasp and lift single bars could support theperception and memorization of information, only two participants stated that the manualassembly helped them to remember the categories and countries. An often used term by theparticipants to describe the interactions was “mechanical”. Participants reported also, thatthey tried to finish the initial assembly as fast as possible, as they assumed that a quick andunproblematic interaction with the bars was the focus of the study. This can also serve as anexplanation for the low recall performance of the economic dataset as participants seemed tofind the actual data not only uninteresting but also unimportant relating to the study.
During the semi-structured interviews in the second session, we learned that participants crit-icized the physical interactions as rather unnecessary. When asked about the study procedurefour participants did not remember any use of the stand-alone scale until an explicit questionabout it. Similarly, one participant reported that she recognizes the scale, but declared thatshe used it very rarely. As a large part of the study consisted of comparing and measuringvalues, which necessitated the use of the scale, this statement is surprising. Grasping move-ments in the direction of the countries or single bars involving the kinesthetic sense alsoseemed no aid for the recall process, as only one participant remembered a specific graspingmovement. It emphasized again that the physical interactions were performed almost auto-
122

Modular Physical Bar Charts
matically and that these interactions, based on participants’ subjective opinions, could notsupport the process of memorization.
This shows that the design of effective and meaningful physical interactions for physicaliza-tions is challenging and that the chosen approach to “enforce” specific interactions was notproductive. The high repetition of the same, rather artificially encouraged, physical interac-tion of assembling and moving paper stripes or wooden blocks was probably too familiar,but also perceived as rather unnecessary, to generate actual benefits.
The Role of Modality
The results regarding the recall performance showed a trend that participants could remem-ber information better when they perceived it with the 3D modality. Similar to the discussionof the results of the previous study we believe that the more vivid visual appearance of thewooden blocks compared to the paper strips are one possible explanation. The additionalcharacteristics of the 3D wooden blocks such as the top and side faces or the volume con-tribute to the distinctiveness and might explain the benefits compared to the 2D paper strips.This is in line with the findings of Scott [1967] that object names are less memorable thanpictures because they are less distinctive.
One participant furthermore stated that the 3D modality and the perceived information re-placed the 2D modality completely in her impression. The weight of the single woodenblocks did not seem to support the perception or memorization of information, as none ofthe participants stated that they notably perceived the weight or could make use of the sensedinformation. This can be explained by the fact, that humans have evolved an expectation and“sensation” about the weight of everyday physical objects, therefore the weight differencesof our standard wooden blocks were probably not perceived intentional.
One surprising statement by a participant referred to seriousness and credibility. She de-scribed the paper strips as “flimsy” and “easy to manipulate” and reported she took thewooden blocks more seriously. This could be an exciting area for future studies, e.g., byevaluating whether people trust data that is encoded in a physicalization more than data en-coded in a digital visualization. A study by Ackerman et al. [2010] already investigatedthat the subconsciously perceived weight of an object can have an influence on cognitiveprocesses. In this case, participants ranked job candidates better, when the application doc-uments were attached to a heavy clipboard.
The better recall performance was especially the case for extreme values, which confirmsto some extent the results of our previous study. As we do not believe that one of our twophysicalizations is more novel or ordinary than the other, we assume that we can rule out anovelty effect, which was one possible explanation for the results of the first study. Whilein our first study the advantage for extreme values perceived through a physicalization wasrevealed in the delayed recall, in this study, a larger effect was found for immediate recall.Compared to the first study, participants also seemed to forget more information perceivedwith the modular physical bar chart within one week than with the static physical bar chart
123
6 Potential for Perception & Memorability
within two weeks. In addition to the different data representation, this could be influencedby the dataset, the study design, and the tasks.
In summary, it can be argued that a higher distinctiveness, when designed properly, mayaffect the perception and recall of abstract data in a positive way to a certain amount. Theresults of our the second study furthermore assume that the distinctiveness is based on the3D modality and not mandatory for physical visualizations.
Limitations
Our study has various limitations and further aspects that should be considered when inter-preting the results. Similar to the previous study we only investigated two specific types ofdata representations and only focused on the physical modality. Further visual mappings andother modalities should be tested to generalize our findings.
One aspect that seemed to influence the results noticeable was that our participants weremainly computer science students. Almost all participants stated that they had no relation toeconomic topics, which led to a quite low recall performance. This highlights two aspects,which are important to bear in mind, especially regarding studies about memorability. Onthe one hand, the choice of test datasets should be well-considered and on the other hand,preferences and previous knowledge of the participants should be interrogated. Similarly,the expectations of the participants regarding the study can have an influence as some statedthat they focused on a fast and smooth interaction and not on the encoded data.
As another critical aspect, it should be mentioned that visualizations or physicalizations areoften used to make complex data more accessible. It seems that the chosen physicalizationswere not always able to fulfill this purpose. While for the economic dataset none of thephysicalizations were successful, the 2D paper strips had also for the population dataset arather low recall performance. This questions whether this type of data representation isactually suitable for representing abstract data.
The tasks and physical interactions of our study are further limiting factors, especially asparticipants stated that they often seemed unnecessary and were executed “mechanically.”Future studies could consider integrating the exploration and analysis of a data represen-tation into a main problem-solving tasks, in which physical interactions are required andmeaningful to comprehend the underlying data.
124
Chapter7Potential for Communication &
Collaboration
The evaluations of our early physicalization prototypes (see Chapter 5 - Beyond PhysicalBar Charts) revealed that physicalizations have a potential for presenting data in novel waysand also might benefit collaboration processes. When asked about application scenarios, foreach prototype several participants mentioned museums and other public spaces, as physi-calizations seem promising to encourage data exploration. Others mentioned meeting roomsand presentation stages, which strengthens the assumption that physicalizations have pos-sible benefits for communicating and talking about data. When presenting our prototypespublicly (see Subsection 5.2.1 - Layered Physical Visualizations on Tabletops and Subsec-tion 5.3.1 - Data Exploration Matrix), we observed that people did not only talk about theprototype but also discussed the underlying dataset and explored the data together.
This chapter presents two projects, which are based on these observations and investigatedin which ways the aspect of presenting data physically impacts a joint data exploration.The first project describes our design process of paper-based pop-up physicalizations andthe feedback from a hands-on evaluation, as we handed them out to more than 400 atten-dees of a scientific conference as part of the conference bags. In the second project, wecompared the ways in which groups work together on data representation tasks, either us-ing digital visualizations or physicalizations. We conducted an exploratory study with eightgroups each consisting of three participants, to see whether physicalizations influence oreven enhance group work. Both projects revealed the importance on the design and aesthetic
Personal contribution statement: The content of this chapter is based on two student’s theses by ArnoldSchefner [2014] as well as Xaver Loeffelholz and Peter Arnold [2015]. The latter was supervised by SarahTausch and the author. See Disclaimer for a detailed overview.
7 Potential for Communication & Collaboration
of physicalizations and exposed their limitations in contrast to their well-researched digitalcounterparts. The results also led to the assumption that physicalizations seem to polarize:Either participants strongly enjoyed working with them or rejected them as inconvenient andpointless toys.
7.1 PopUpData
Our first project that investigated the ways in which physicalizations can support the com-munication of data and encourage discussion about the underlying dataset focused on paper-based pop-up physicalizations. As pop-up cards are fun to create and receive, we wantedto take advantage of these characteristics by utilizing pop-up cards in the area of data rep-resentations (see Figure 7.1). We were especially interested in the question whether the actof assembling a personal pop-card, e.g., by folding and sticking, would engage participants,make them understand the underlying data, and lead to sharing and discussing the physical-izations. In this section, we report our design process and lessons learned from an initialstudy as well as the feedback from a hands-on evaluation, in which the attendees of the TEI2014 conference received a pop-up card as part of their conference bag.
7.1.1 Motivation & Background
Our goal in this project was to introduce pop-up cards into the field of physical data repre-sentations. We believe that pop-up cards are an exciting addition to this field, as people cantouch and interact with them, but also build their own pop-up physicalizations from scratch.They seem to provide a variety of possible benefits, such as leveraging human perceptualexploration skills, bringing data into the real world, or just engaging people in exploringdata in new ways.
Paper-based pop-up cards and books fascinate people of all ages and cultures. It is intriguingto watch 3D shapes pop up out of nowhere just by opening an initially flat, folded piece ofpaper. The design and construction of great pop-ups is challenging and artists in this field areoften titled paper engineers. To create functional and aesthetic pop-ups requires both artisticand technical skills [Glassner, 2002a]. The technique of pop-ups is most popularly used inchildren’s books to enrich the storytelling but also for illustration purposes in areas such asgeometry or medicine [Ruiz et al., 2014]. In the following we will give a brief overview ofpaper crafting in general and projects related to HCI.
Paper Crafting
Paper crafting has fascinated people probably since the invention of paper itself. Origami,the traditional Japanese art of paper folding is several hundred years old and still a populartype of paper craft that has been explored in literature (e.g., Demaine and O’Rourke [2008];
126

PopUpData
Figure 7.1: Final designs of the three pop-up physicalizations encoding data related to the TEIconference. Top: summit representing the acceptance rate. Center: word cloud representing themost used keywords. Bottom: flower representing the number of authors by country.
127

7 Potential for Communication & Collaboration
Hull [2012]). Origamic Architectures are a special type of paper pop-ups that involve cuttingand folding of a single sheet of paper. Most scientific work in this area focused on methodsto automatically generate pop-up cards that closely depict an input 3D model (e.g., Li et al.[2010]; Le et al. [2014]). As the design of pop-up cards can be difficult because of the variousconstraints required to make the card fold flat, a number of papers proposed interfaces forassisting the design and production of pop-up cards (e.g., Hendrix and Eisenberg [2006];Okamura and Igarashi [2009]). In contrast to Origamic Architecture, pop-ups cannot onlybe created through folding and cutting but also by gluing pieces of paper together.
The work of Glassner [2002a,b] gives a thorough introduction to the design, creation anddefinition of simple pop-up mechanisms such as the “single-slit” or the “V-fold”. Pop-upcards are called valid when they are both foldable and stable. When the structure can foldcompletely flat, a pop-up is said to be foldable. If the closing and opening of a pop-up doesnot need any extra external force besides holding the two outermost areas on each half of theground paper, a pop-up is said to be stable [Ruiz et al., 2014].
These references provide a solid conceptual basis for the design of pop-up cards as wellas its opportunities and limitations. Our literature review also confirmed that, apparently,pop-up cards have not been applied in the field of data representation so far. Recent workthat integrated pop-up constructions in classrooms lead to strong student engagement andcollaboration [Olsen et al., 2013]. This increased our expectations about the potential ofrepresenting data with pop-up cards.
7.1.2 Design Process
Our design process was mainly guided by the opportunity to place the final pop-up physi-calizations in the conference bags for the attendees of the 8th international ACM conferenceon Tangible, Embedded and Embodied Interaction (TEI 2014). Informal discussions withcolleagues lead to five key design goals:
• Data: the data that is represented through the pop-up physicalizations should be ofinterest to the attendees of the conference and potentially trigger discussions.
• Data representation: the pop-up physicalizations should be aesthetic, to motivate theconference attendees to assemble it and keep it as a souvenir. The underlying datashould be easy to read from the final pop-up.
• Assembly: as the spare time at conferences is short, the assembly of the pop-up physi-calizations should be easy and not take up too much time.
• Fabrication: the fabrication should be automated as far as possible and supported bydigital fabrication machines (e.g., laser cutters) to enable production for the more than400 attendees of the TEI conference in a reasonable time.
• Valid pop-up: The pop-up physicalizations should be foldable and stable (see above).
128
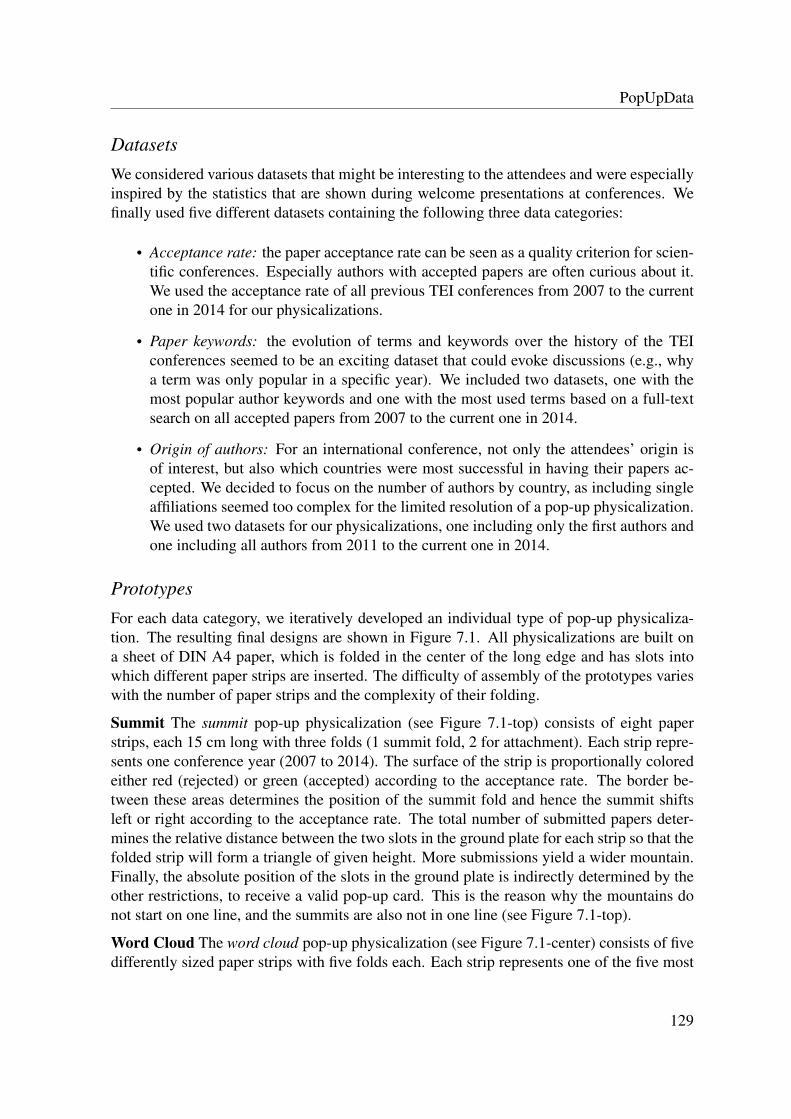
PopUpData
Datasets
We considered various datasets that might be interesting to the attendees and were especiallyinspired by the statistics that are shown during welcome presentations at conferences. Wefinally used five different datasets containing the following three data categories:
• Acceptance rate: the paper acceptance rate can be seen as a quality criterion for scien-tific conferences. Especially authors with accepted papers are often curious about it.We used the acceptance rate of all previous TEI conferences from 2007 to the currentone in 2014 for our physicalizations.
• Paper keywords: the evolution of terms and keywords over the history of the TEIconferences seemed to be an exciting dataset that could evoke discussions (e.g., whya term was only popular in a specific year). We included two datasets, one with themost popular author keywords and one with the most used terms based on a full-textsearch on all accepted papers from 2007 to the current one in 2014.
• Origin of authors: For an international conference, not only the attendees’ origin isof interest, but also which countries were most successful in having their papers ac-cepted. We decided to focus on the number of authors by country, as including singleaffiliations seemed too complex for the limited resolution of a pop-up physicalization.We used two datasets for our physicalizations, one including only the first authors andone including all authors from 2011 to the current one in 2014.
Prototypes
For each data category, we iteratively developed an individual type of pop-up physicaliza-tion. The resulting final designs are shown in Figure 7.1. All physicalizations are built ona sheet of DIN A4 paper, which is folded in the center of the long edge and has slots intowhich different paper strips are inserted. The difficulty of assembly of the prototypes varieswith the number of paper strips and the complexity of their folding.
Summit The summit pop-up physicalization (see Figure 7.1-top) consists of eight paperstrips, each 15 cm long with three folds (1 summit fold, 2 for attachment). Each strip repre-sents one conference year (2007 to 2014). The surface of the strip is proportionally coloredeither red (rejected) or green (accepted) according to the acceptance rate. The border be-tween these areas determines the position of the summit fold and hence the summit shiftsleft or right according to the acceptance rate. The total number of submitted papers deter-mines the relative distance between the two slots in the ground plate for each strip so that thefolded strip will form a triangle of given height. More submissions yield a wider mountain.Finally, the absolute position of the slots in the ground plate is indirectly determined by theother restrictions, to receive a valid pop-up card. This is the reason why the mountains donot start on one line, and the summits are also not in one line (see Figure 7.1-top).
Word Cloud The word cloud pop-up physicalization (see Figure 7.1-center) consists of fivedifferently sized paper strips with five folds each. Each strip represents one of the five most
129

7 Potential for Communication & Collaboration
used author keywords or terms, which is printed on the strip. The size of the strip and itspop-up height represent the popularity of the word. On the left next to the word we printedgraphs of the total count of the particular word for each year (2007 to 2014) and on the rightits ranking position. The positions of the slots on the ground paper were chosen to receivean aesthetic arrangement of the words.
Flower The flower pop-up physicalization (see Figure 7.1-bottom) consists of four paperstrips with fifteen folds each. Each strip represents one conference year (included are 2011to 2014) and each of the six flower petals represents one of the six most successful countriesregarding the number of (first) authors. The length of the petal is mapped to the total numberof authors. The slots have a fixed position on the ground to transform the paper strips into ahexagonal form when the card is popped up.
Pre-Study
We showed and discussed preliminary designs with colleagues during the entire design pro-cess. We also conducted a pre-study with 6 participants to evaluate our final prototypes.Each participant had to assemble all three physicalization types in a random order and wasasked to speak out loud, what she was thinking. The study showed that the successful as-sembly of each physicalization took about 10 to 15 minutes, which seemed like an adequateduration. We rephrased some parts of the assembly instructions and made some more designchanges based on recommendations by the participants.
Fabrication
The actual fabrication was split up into two parts: the digital design and creation of thephysicalizations and its analog production with the help of a laser printer, laser cutter, andhandwork. We used Processing1 to generate the shapes of the paper strips algorithmicallybased on the datasets. For the general layout and specific content, e.g., the assembly descrip-tion, we used Adobe Illustrator.
The ground plate of each pop-up physicalization consisted of two pieces of paper gluedtogether. The assembly description and a link to an online questionnaire were printed on theback, general information regarding the physicalization (e.g., the legend) on the front (seeFigure 7.2). We used a laser cutter to cut out the various paper strips and their slots on thefront paper (see Figure 7.3-left). It was possible to stack five pieces of paper on top of eachother and cut them in one pass, which accelerated the fabrication process. We further placedas many shapes as possible on one single page to minimize the effort of switching papersduring the cutting process. The final step was to collect all physicalization parts (groundpaper and its associated paper strips) in a transparent envelope, which was then placed in theconference bags (see Figure 7.3-center and right).
1 https://processing.org/ (accessed 2015-12-15)
130

PopUpData
Figure 7.2: Final graphical design of the ground plates (clockwise from top-left): back platewith assembly description and a link to an online questionnaire. Example front plates for theword cloud, flower and summit. Bottom: Examples for the different paper strips.
Figure 7.3: Fabrication of the physicalizations. Left: The single paper strips were cut witha laser cutter. Center: Collection of cut paper strips and glued ground papers. Right: Finalenvelope that was placed in the conference bags including all physicalization parts.
131
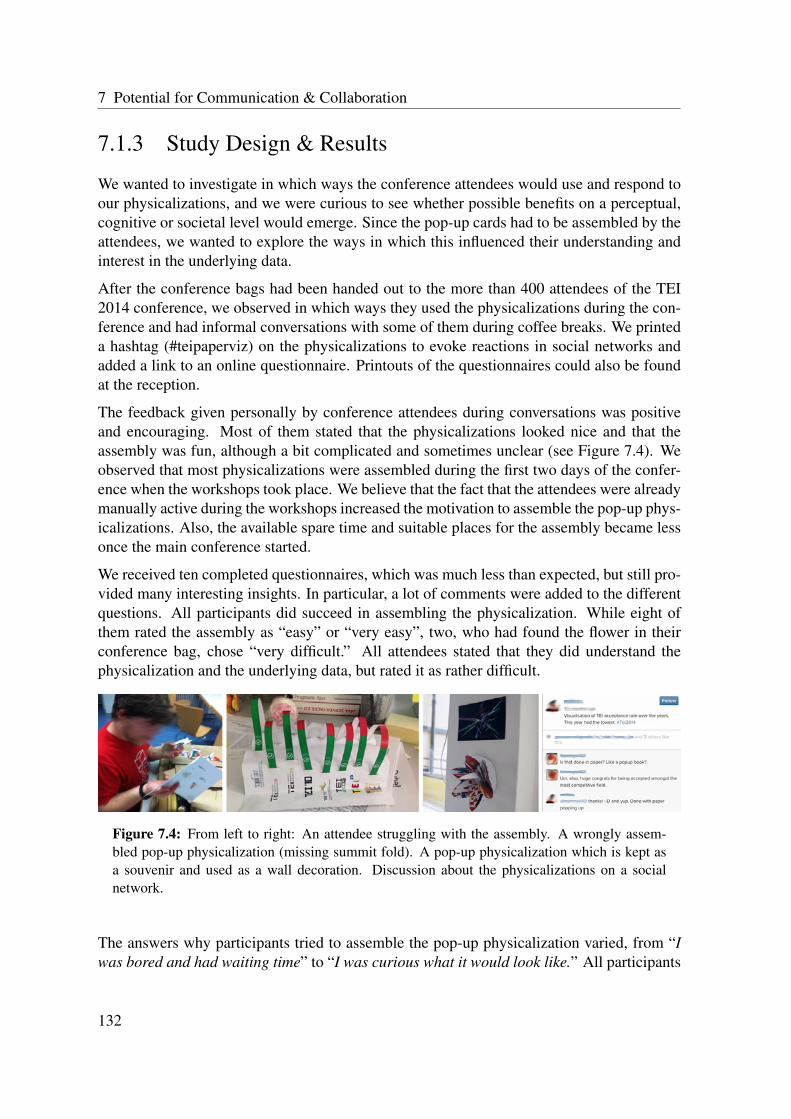
7 Potential for Communication & Collaboration
7.1.3 Study Design & Results
We wanted to investigate in which ways the conference attendees would use and respond toour physicalizations, and we were curious to see whether possible benefits on a perceptual,cognitive or societal level would emerge. Since the pop-up cards had to be assembled by theattendees, we wanted to explore the ways in which this influenced their understanding andinterest in the underlying data.
After the conference bags had been handed out to the more than 400 attendees of the TEI2014 conference, we observed in which ways they used the physicalizations during the con-ference and had informal conversations with some of them during coffee breaks. We printeda hashtag (#teipaperviz) on the physicalizations to evoke reactions in social networks andadded a link to an online questionnaire. Printouts of the questionnaires could also be foundat the reception.
The feedback given personally by conference attendees during conversations was positiveand encouraging. Most of them stated that the physicalizations looked nice and that theassembly was fun, although a bit complicated and sometimes unclear (see Figure 7.4). Weobserved that most physicalizations were assembled during the first two days of the confer-ence when the workshops took place. We believe that the fact that the attendees were alreadymanually active during the workshops increased the motivation to assemble the pop-up phys-icalizations. Also, the available spare time and suitable places for the assembly became lessonce the main conference started.
We received ten completed questionnaires, which was much less than expected, but still pro-vided many interesting insights. In particular, a lot of comments were added to the differentquestions. All participants did succeed in assembling the physicalization. While eight ofthem rated the assembly as “easy” or “very easy”, two, who had found the flower in theirconference bag, chose “very difficult.” All attendees stated that they did understand thephysicalization and the underlying data, but rated it as rather difficult.
Figure 7.4: From left to right: An attendee struggling with the assembly. A wrongly assem-bled pop-up physicalization (missing summit fold). A pop-up physicalization which is kept asa souvenir and used as a wall decoration. Discussion about the physicalizations on a socialnetwork.
The answers why participants tried to assemble the pop-up physicalization varied, from “Iwas bored and had waiting time” to “I was curious what it would look like.” All participants
132

PopUpData
agreed, that the instructions were still sometimes unclear and the assembly sometimes te-dious. One subject wrote “thankfully I love manual work and challenges”, another was lesspositive: “I got it all to work, but it wasn’t fun.” The physicalizations were also part of con-versations during the conference as seven of the ten participants specified. Some attendeesalso shared photos of the physicalizations on social networks (see Figure 7.4), but this wasnot as popular as we had expected.
Most participants liked the general idea of encoding data with pop-up cards. One stated, “Itmakes one more happy to see the results, instead of looking at a table.” Another empha-sized, “I actually memorize the acceptance rates better because I paid more attention to thenumbers when assembling the visualization.” A more critical comment was “physical datavisualization is a good idea. Assembling paper cut outs is a tedious way to do that, though.”Regarding the question whether the attendees will keep the physicalization as a souvenir ofthe conference, the answers were split five to five. One comment was “I don’t know howlong I will keep it, but for now, it’s on my desk, and I like looking at it”, another stated “Iam excited how my colleagues who did not participate will respond to it” and one was justenthusiastic: “Of course! It’s cool and original!”.
7.1.4 Discussion
The low participation of only ten completed questionnaires out of over 400 potential can-didates was somewhat disappointing to us. After discussing potential ways to fix this, weconsciously refrained from sending out more reminders or pushing for additional replies, aswe were afraid this would introduce a positive bias (good-subject effect). The richness of theanswers we did receive, including the written comments and discussions at the conference,still provides a sound basis for further investigation, as the general response was positive andintriguing.
The primary concern raised by most attendees was the rather unclear description how to as-semble the pop-up physicalization. We explicitly decided against printing a picture of thefinal physicalization next to the description to maintain the excitement about what it wouldlook like at the end. However, many attendees suggested this as an improvement. A com-prehensible instruction seems to be a key point for motivating people to try the assembly.While we thought the assembly process could be an essential aspect to encourage attendeesto explore the dataset and to get into a conversation with others, our observations could notconfirm this assumption. In retrospect, the hand out of already assembled pop-up physi-calizations might have been a better choice, as participants would have had more time toconcentrate on the data. The aspect that the majority of the participants stated that they un-derstood the physicalizations, but found the encoding process rather difficult, argues for theuse of more classical data representations, such as bar charts or line graphs.
One other possible explanation for the small number of attendees, who assembled the phys-icalizations and gave feedback, is the particular subject group: TEI participants are used toexciting novel physical and interactive artifacts, mostly involving computers or electronics
133

7 Potential for Communication & Collaboration
of some kind. The fact that our physicalizations were “only paper” could potentially makethem even less attractive in this particular context. At the same time, this opens up an ex-citing area for future work. Actuated electronics such as Shape Memory Alloys (SMAs) orinflatable pouches are already used as creative crafting material in combination with paper[Qi and Buechley, 2012; Niiyama et al., 2015]. These techniques could be used to enhancepop-up physicalizations by enabling details on demand or highlighting specific data pointsand thereby make them even more fascinating than they already are.
We still believe that also purely paper-based pop-up physicalizations are an exciting way tobring data into the real world. One example could be pop-up Christmas cards of companiesencoding the economic process of the last year. For this case, a prior assembly, as well asa sophisticated and aesthetic design, seem to be crucial points. We also see a potential atkindergarten or primary school, at which handicraft work with scissors and paper is com-mon. By creating their own pop-up physicalizations representing personal or historical data,children could engage with data representation in a playful and novel way.
7.2 Collaborative Physicalizations
While the project in the previous section observed in which ways paper-based physicaliza-tions are used in the setting of a scientific conference, in this section we present a studyexploring the potential of physicalizations for collaboration. We studied the ways in whichgroups work together on data representation tasks, either using physical or digital visual-izations. More specifically, we compared line graphs that were either made from laser cutacrylic glass or displayed on tablet devices (see Figure 7.5). We conducted an exploratory re-peated measures study with eight groups each consisting of three participants, to see whetherphysicalizations could enhance group work.
In questionnaires and semi-structured interviews, participants rated physicalizations asslightly more fun to use and better for sharing information with other group members aswell as more convenient for open-ended tasks. On the other hand, digital visualizations wereconsidered as more professional and easier to understand, which is not surprising given theirlong history. In general, we found that they polarized: Participants either strongly enjoyedworking with the physicalizations or entirely rejected them as inconvenient compared to thedigital counterpart on a tablet.
7.2.1 Motivation & Background
Working together in small groups of people to achieve shared goals is common and natu-ral. This can have various reasons such as getting a job done faster, sharing informationor benefiting from the combined expertise of different people. For sharing knowledge and
134

Collaborative Physicalizations
Figure 7.5: Left: The digital and physical visualizations used in the study. Right: Two partici-pants using the physical visualizations.
understanding specific insights, a visual representation is often useful and necessary. There-fore, in the field of InfoVis an increasing number or projects are related to collaborativevisualizations [Isenberg et al., 2011].
In our study, we wanted to explore whether physicalizations can be used for collaborativework. The unique characteristics of physicalizations, e.g., the fact that they are perceivedwith multiple senses and can easily be shared between collaborators, made it seem promis-ing to explore in which ways people collaborate and communicate with physicalizations.In the following, we briefly discuss the area of collaborative visualizations and TUIs forcollaboration, as findings suggest that tangibles can encourage collaboration.
Collaborative Visualization
The field of collaborative visualizations builds on findings from HCI, InfoVis and Computer-Supported Cooperative Work (CSCW). Isenberg et al. [2011] try to describe the entire scopeof collaborative visualizations by defining it as “the shared use of computer-supported, (in-teractive,) visual representations of data by more than one person with the common goal ofcontribution to joint information processing activities.” While we agree with this definitionand especially like the emphasis regarding “the shared use by more than one person” it isworth mentioning that the physical visualizations in our study were not computer-supportedanymore, once manufactured.
There are various ways to categorize systems in the area of collaborative visualizations. Thespace-time matrix is borrowed from general collaboration scenarios and differentiates be-tween space (distributed vs. co-located) and time (synchronous vs. asynchronous) [Baecker,1994]. Another one is based on the level of engagement teams have with the data represen-tation. This can vary from only viewing the information, actively exploring and interactingwith the data or even creating new visualizations and sharing these with a larger commu-
135

7 Potential for Communication & Collaboration
nity [Isenberg et al., 2011]. Other literature distinguishes between the underlying data (e.g.,personal, scientific), the skills of the users (novice, savvy, expert) or their goals (exploration,analysis, communication) [Heer et al., 2008]. Based on these categorizations we see ourwork in the area of co-located data representations in which groups of novice and savvyusers are exploring and interacting with a representation of data to share knowledge andcommunicate insights.
This rather new research area of collaborative visualizations poses many challenges in theintersection between collaborative work and visualization, such as the support and designof multiple in- and outputs [Isenberg et al., 2011]. However, the goal of our work wasnot to contribute in technology aspects, but rather in the field of social interaction and theobservation and evaluation of the collaborative process itself.
Tangible Interfaces for Collaboration
Most projects in the area of collaborative TUIs combine tangible objects with interactivetabletops. Schneider et al. [2011] compared multi-touch and tangible interfaces for collabo-rative learning and found that the tangible interface fostered collaboration, helped exploringa larger part of the problem space and turned problem-solving in a more playful experience.A follow-up study showed that a tabletop system that enables tangible and digital explorationcan support collaborative learning by engaging participants in the activity [Schneider et al.,2012].
Other studies showed that physical objects can increase engagement and exploration amongchildren [Antle et al., 2009] and have great potential to encourage collaboration [Stantonet al., 2001]. Also, they are suitable for collaborative and situated learning [Klemmer et al.,2006; Marshall, 2007; Suzuki and Kato, 1995] as well as collaborative problem-solvingactivities [Xie et al., 2008]. Based on these studies, we believe that physicalizations cansupport people’s engagement due to their aesthetics and affordances as physical objects.
7.2.2 Design Process
Our primary design goal was to find a visual representation that was suitable for group workand similarly well suited for both modalities to enable a fair comparison between them.
Datasets
As an abstract dataset, we used country indicator data from the world bank2. We created sixsubsets, each showing the development of one indicator for five countries (Germany, USA,China, South Africa and Brazil) over 18 years, from 1994 to 2012. To ultimately createtasks that involve collaboration we split the six sets into two triples that should be used by
2 http://www.worldbank.org/ (accessed 2015-12-15)
136

Collaborative Physicalizations
groups of three persons. The first triple of indicators was the GDP in US$, GDP growth(annual %) and the rate of Internet users per 100 people. The second triple consisted oftotal unemployment (% of total labor force), exports of goods and services (% of GDP) andimports of goods and services (% of GDP). Indicators, countries, and the time frame werechosen based on the availability of data, expected interest and with the goal to find highlyvisible developments over time and between countries.
Data Representation Type
Line charts are one of the most popular data representation types for time series data. Theyare also used on the world bank website to represent the chosen datasets graphically, besidetables and maps. They are well-known and commonly used in visualization or spreadsheetsoftware and therefore should be easy to read and understand by our study participants. Fur-thermore they are suitable for both, an on-screen 2D visualization and a 3D physicalization.
Digital Modality
We chose a 2D layout similar to the one offered by the world bank for our six on-screenvisualizations, which were created with the JavaScript library D3 [Bostock et al., 2011].Each visualization was shown on a tablet device (1280 x 800 pixels, 25.6 cm) in full-screendisplay. We chose tablet devices instead of laptops, computer screens or a projection inorder to create conditions similar to the physicalization. In particular, this also ensured thateach participant had his or her own visualization that could be held conveniently in one orboth hands and easily be shown and handed over to the other group members. To enable afair comparison between both modalities we kept the interaction possibilities rather simple,only allowing to show or hide specific countries via check boxes. Figure 7.6 shows our finaldesign of the on-screen visualization.
Physical Modality
To create the six physicalizations we used transparent acrylic glass cut into shape with alaser cutter. The general design and physical size were inspired by the 3D bar charts used byJansen et al. [2013]. It consisted of five country layers and five other layers for labeling andconstruction purposes. The final physicalization had a cube shape, with outer dimensionsof 10 x 10 x 10 cm and matched the layout and colors of the digital visualization. To makedistinction easier we painted only the top of every layer, so the colored lines would also bevisible if occluded by other layers in front of it. Similar to the hide function in the on-screenvisualization it was possible to take out each country layer. Two acrylic layers were used toshow the vertical axes by engraved horizontal lines. Every country layer also had engravedvertical lines, which were lined up with the scale of years. Finally, we put little stickers onthe side of every country layer to label the country, and one sticker on the back of the objectto labeling the indicator. Figure 7.7 shows our final physical prototype.
137

7 Potential for Communication & Collaboration
Figure 7.6: Final design of one of the line charts which were displayed in full-screen on tabletdevices.
Figure 7.7: Final design of the physical line chart.
Dimensionality and Fair Comparison
It is worth highlighting that the data representations do not only differ in their modality (dig-ital vs. physical) but also in their dimensionality (3D vs. 2D). While this decision introducesa larger difference between both representations, we argue that it still allows a fair compari-son for several reasons. The previous study by Jansen et al. [2013] showed that physical 3Dbar charts outperform their on-screen counterparts regarding information retrieval tasks, butthat the digital 2D visualization performed best. Furthermore, on-screen 3D visualizationsare generally considered problematic because of coverage and complex viewport control, as2D inputs have to control a 3D visualization [Shneiderman, 2003]. In the physical world this
138

Collaborative Physicalizations
is not the case as the person interacting with a 3D physical object can freely hold, rotate andmove it in his or her hands. Therefore, we believe that our designs use the strengths of bothmodalities and do not impose artificial disadvantages on one of them.
7.2.3 Study Design
In contrast to our previous studies we did not focus on memorability aspects, task completiontime or error rate. Instead, we were interested in i) learning more about social interactionin collaborative tasks when interacting with physical and digital visualizations, ii) gainingfirst insights in which ways physicalizations are used for collaboration and iii) exploring thepotential of physicalizations for collaboration in general.
ParticipantsWe collected participants through a social network and a mailing list of the university. To en-hance group work, we asked for groups in which participants knew each other. We recruitedeight groups with three participants each (in total 24 participants) who were between 20 and31 years old (mean: 24.3 years; female: 11). Among the participants were 16 students (8Media Informatics/HCI, 1 design in crafts, 1 magisterium, 1 medicine, 1 mechatronics, 1bioinformatics, 1 graphic design, 1 engineering) and eight professionals (2 graphic design-ers, 2 consultants, 1 software developer, 1 business analyst, 1 store management assistant, 1translator). Participants received a 10 Euro voucher for a well-known online store.
TasksWe designed the tasks such that they made collaboration necessary. For each triplet of in-dicators we created six tasks (totally 12 tasks). The first four tasks were closed-ended, withcertain countries, orders or numbers/values as correct answers. The first task always in-cluded all three indicators, while 2, 3 and 4 only included two indicators with all indicatorsappearing twice. Task 5 and 6 were open-ended tasks without a clearly right or wrong an-swer, involving all 3 indicators. These questions were designed to make participants explorethe data more freely and focus on developments instead of exact numeric values. Someexamples of the tasks are:
• Task 1: closed-ended question including all three indicators, e.g., “Did the countrywith the highest GDP-growth in the year 2008 also have a maximum in its GDP valueand its rate of internet users in the same year?”
• Tasks 2-4: closed-ended question including two indicators, e.g., “Find the three coun-tries with the highest GDP value in 2000. Order them by their GDP growth (fromlowest to highest).”
• Task 5 and 6: open-ended questions, e.g., “Is there a correlation between the rate ofinternet users and the GDP value or GDP growth?”
139
7 Potential for Communication & Collaboration
Procedure
The study took place in an isolated and quiet room equipped with a bistro table and a white-board (see Figure 7.11). When participants arrived they were given an introduction to thestudy, and the upcoming order of events. After a first demographic questionnaire, they wereintroduced to the first modality, either the physicalization or the on-screen visualization. Asan instruction, the study leader used one of the modalities and gave a short explanation onhow to read the graphs as well as showing the interaction by taking a country layer out of thephysicalization or hiding it with the checkbox in the digital visualization. Each participantwas given one representation, and they were told to work together to solve the upcomingtasks. They were also told that they were allowed to exchange their representations witheach other. Printed papers with tasks were placed on the whiteboard one at a time. Thegroup was also equipped with whiteboard markers and should note down their answers onthe whiteboard. Participants were encouraged to take as much time as necessary to find theanswer but did not get any feedback if their answer was correct. The order of modalities andtask sets was counterbalanced, and the study took one hour on average.
Data Collection
The experimenter observed the participants during the study and took notes. We also video-taped the entire process with two cameras in different viewing angles: a view from the topwith a fisheye camera (see Figure 7.11) and one from the back. The videos were used to ana-lyze the collaborative process, e.g., to see whether participants passed their visualizations onto each other. The whiteboard with the group’s answers was photographed after each sessionto check correctness. Pen-and-paper questionnaires were used to gather demographic infor-mation and the participants’ opinions on the data representations. A similar questionnairewas handed out after each modality and a third one in the end, in which participants hadto compare the two modalities directly. We further conducted semi-structured interviewswith each participant separately at the end of the study. These interviews aimed at obtain-ing more detailed insights about participants’ positions whether and in which ways the datarepresentations differed in their potential for collaboration.
7.2.4 Results
Our analysis and discussion is based on the data collected through questionnaires and inter-views as well as the observations. The discussion is split into Collaboration, Modalities, andParticipants. We will not focus on “time and error”, as participants had marginal problemsfinding the correct answers for closed-ended tasks. Of an overall number of 48 tasks, fourwrong answers in total were given with the physical modality and two wrong answers withthe digital.
140
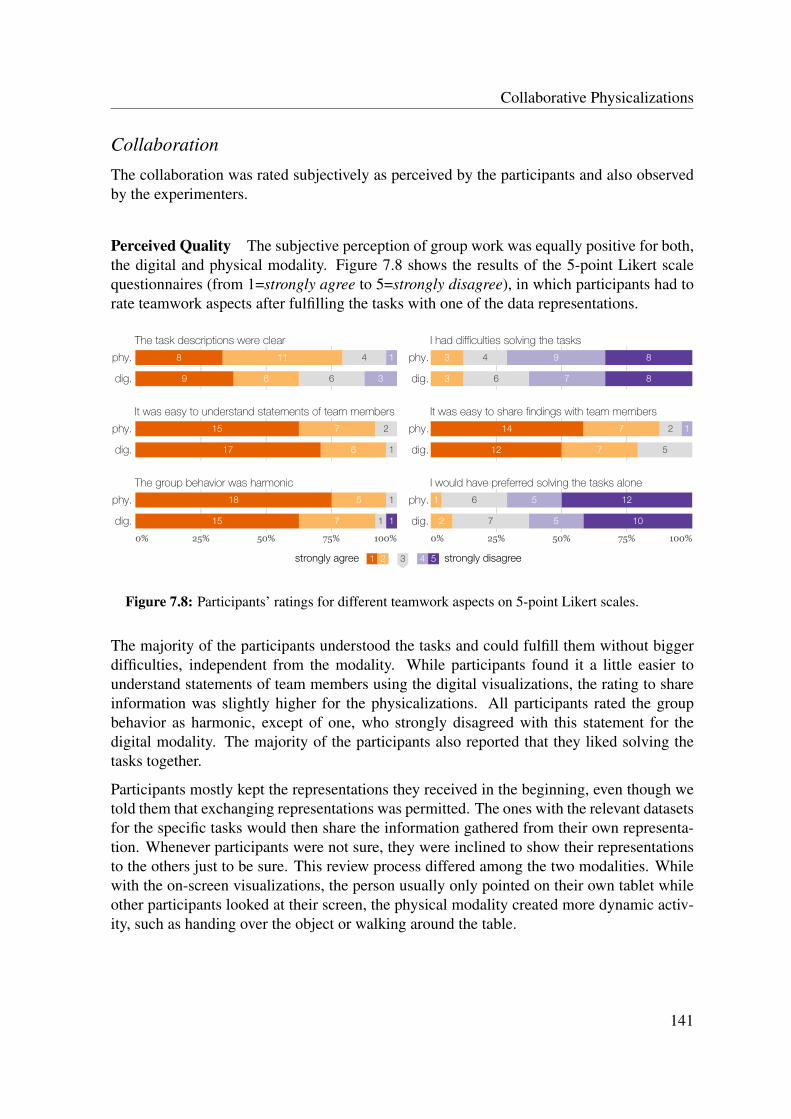
Collaborative Physicalizations
Collaboration
The collaboration was rated subjectively as perceived by the participants and also observedby the experimenters.
Perceived Quality The subjective perception of group work was equally positive for both,the digital and physical modality. Figure 7.8 shows the results of the 5-point Likert scalequestionnaires (from 1=strongly agree to 5=strongly disagree), in which participants had torate teamwork aspects after fulfilling the tasks with one of the data representations.
The task descriptions were clear
14118
3669
phy.
dig.
It was easy to understand statements of team members
2715
1617
phy.
dig.
The group behavior was harmonic
1518
11715
phy.
dig.
0% 25% 50% 75% 100%
I had difficulties solving the tasks
8943
8763
phy.
dig.
It was easy to share findings with team members
12714
5712
phy.
dig.
I would have preferred solving the tasks alone
12561
10572
phy.
dig.
0% 25% 50% 75% 100%
31 2 4 5strongly agree strongly disagree
Figure 7.8: Participants’ ratings for different teamwork aspects on 5-point Likert scales.
The majority of the participants understood the tasks and could fulfill them without biggerdifficulties, independent from the modality. While participants found it a little easier tounderstand statements of team members using the digital visualizations, the rating to shareinformation was slightly higher for the physicalizations. All participants rated the groupbehavior as harmonic, except of one, who strongly disagreed with this statement for thedigital modality. The majority of the participants also reported that they liked solving thetasks together.
Participants mostly kept the representations they received in the beginning, even though wetold them that exchanging representations was permitted. The ones with the relevant datasetsfor the specific tasks would then share the information gathered from their own representa-tion. Whenever participants were not sure, they were inclined to show their representationsto the others just to be sure. This review process differed among the two modalities. Whilewith the on-screen visualizations, the person usually only pointed on their own tablet whileother participants looked at their screen, the physical modality created more dynamic activ-ity, such as handing over the object or walking around the table.
141
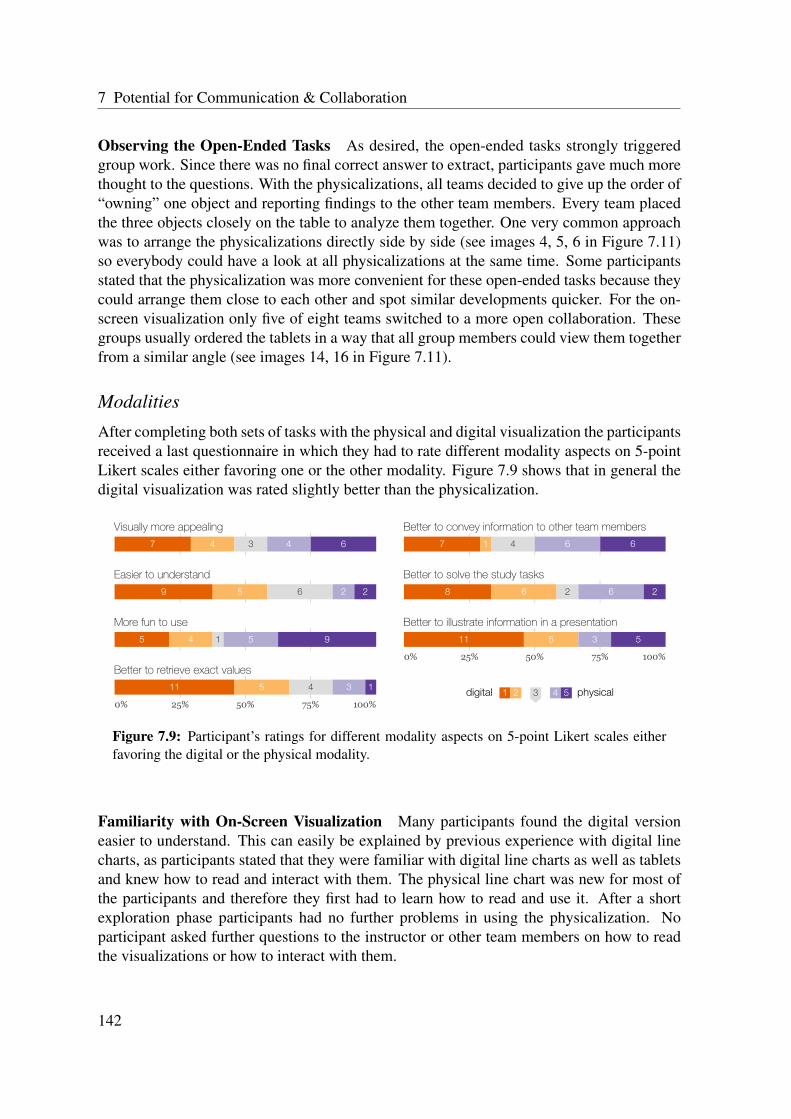
7 Potential for Communication & Collaboration
Observing the Open-Ended Tasks As desired, the open-ended tasks strongly triggeredgroup work. Since there was no final correct answer to extract, participants gave much morethought to the questions. With the physicalizations, all teams decided to give up the order of“owning” one object and reporting findings to the other team members. Every team placedthe three objects closely on the table to analyze them together. One very common approachwas to arrange the physicalizations directly side by side (see images 4, 5, 6 in Figure 7.11)so everybody could have a look at all physicalizations at the same time. Some participantsstated that the physicalization was more convenient for these open-ended tasks because theycould arrange them close to each other and spot similar developments quicker. For the on-screen visualization only five of eight teams switched to a more open collaboration. Thesegroups usually ordered the tablets in a way that all group members could view them togetherfrom a similar angle (see images 14, 16 in Figure 7.11).
Modalities
After completing both sets of tasks with the physical and digital visualization the participantsreceived a last questionnaire in which they had to rate different modality aspects on 5-pointLikert scales either favoring one or the other modality. Figure 7.9 shows that in general thedigital visualization was rated slightly better than the physicalization.
31 2 4 5digital physical
Better to retrieve exact values
11 5 4 3 1
More fun to use
5 4 1 5 9
Easier to understand
9 5 6 2 2
Visually more appealing
7 4 3 4 6
0% 25% 50% 75% 100%
Better to illustrate information in a presentation
11 5 3 5
Better to solve the study tasks
8 6 2 6 2
Better to convey information to other team members
7 1 4 6 6
0% 25% 50% 75% 100%
Figure 7.9: Participant’s ratings for different modality aspects on 5-point Likert scales eitherfavoring the digital or the physical modality.
Familiarity with On-Screen Visualization Many participants found the digital versioneasier to understand. This can easily be explained by previous experience with digital linecharts, as participants stated that they were familiar with digital line charts as well as tabletsand knew how to read and interact with them. The physical line chart was new for most ofthe participants and therefore they first had to learn how to read and use it. After a shortexploration phase participants had no further problems in using the physicalization. Noparticipant asked further questions to the instructor or other team members on how to readthe visualizations or how to interact with them.
142

Collaborative Physicalizations
Accuracy of 3D Model Another benefit of the digital visualization was the fact that it waseasier to retrieve exact values from it. This was because the digital visualization has a fixedviewpoint on the data at hand while participants had to create such a viewpoint themselveswith the physicalization: “It is just much easier to read data out of the visualization. Withthe physicalization, you always have to get the angle right before you can read the data andeven then it might not be precise.” (Participant ID: G5P2 = group 5, participant 2). Manyparticipants would close one eye and hold the physicalization directly in front of their headto be able to read a exact numeric value. Figure 7.10 shows this problem of perspectivedistortion.
Figure 7.10: This picture illustrates the problem of perspective distortion. It is not possible toalign all vertical lines of the physical modality.
Furthermore two participants (G2P3, G7P1) explicitly questioned the precision and reliabil-ity of the physical modality because of its production process. The accuracy of the digitalversion on the other hand was never questioned by them as it was not assumed to sufferfrom production issues, and infinite zooming was possible. In retrospect these drawbacks ofthe physicalization can also explain why the on-screen visualization was rated as better forsolving the study tasks, as the number of closed-ended tasks requiring exact comparisonswas higher than the number of open-ended tasks.
Usage for Presentation Two-thirds of the participants favored the digital visualization fora presentation. As we found out in the semi-structured interviews, most people thoughtit was also a matter of the audience’s size. While many would use a physicalization forsmall groups, the digital version was favored in the general case with typical statementssuch as “it’s just way easier to show other people data on a projector during a presentation”(G1P2). To emphasize the importance of professionalism in a presentation participants stated“you just have to go with the time” (G1P2) as a digital presentation is still perceived moremodern and “a digital visualization on a tablet is just more professional” (G2P2). Peoplethat would rather use a physicalization stated, that it is a matter of personality which datarepresentation suits the purpose better: “I am more of a spatial person who likes to see things
143
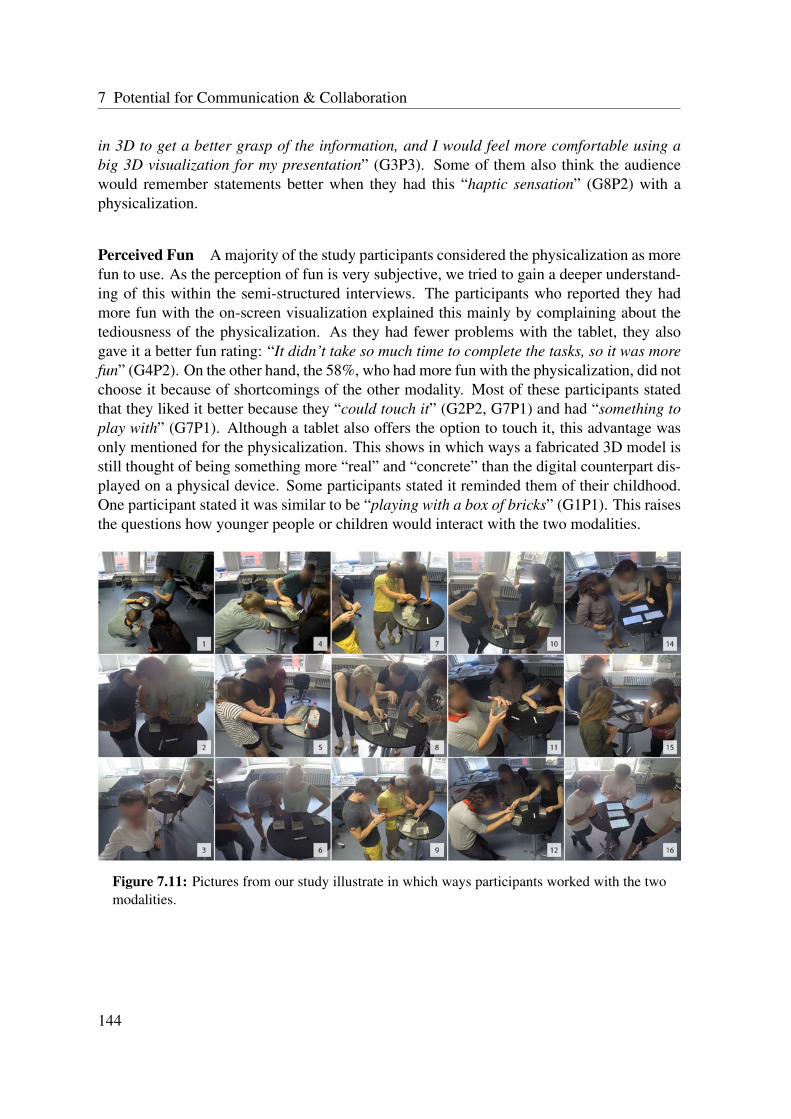
7 Potential for Communication & Collaboration
in 3D to get a better grasp of the information, and I would feel more comfortable using abig 3D visualization for my presentation” (G3P3). Some of them also think the audiencewould remember statements better when they had this “haptic sensation” (G8P2) with aphysicalization.
Perceived Fun A majority of the study participants considered the physicalization as morefun to use. As the perception of fun is very subjective, we tried to gain a deeper understand-ing of this within the semi-structured interviews. The participants who reported they hadmore fun with the on-screen visualization explained this mainly by complaining about thetediousness of the physicalization. As they had fewer problems with the tablet, they alsogave it a better fun rating: “It didn’t take so much time to complete the tasks, so it was morefun” (G4P2). On the other hand, the 58%, who had more fun with the physicalization, did notchoose it because of shortcomings of the other modality. Most of these participants statedthat they liked it better because they “could touch it” (G2P2, G7P1) and had “something toplay with” (G7P1). Although a tablet also offers the option to touch it, this advantage wasonly mentioned for the physicalization. This shows in which ways a fabricated 3D model isstill thought of being something more “real” and “concrete” than the digital counterpart dis-played on a physical device. Some participants stated it reminded them of their childhood.One participant stated it was similar to be “playing with a box of bricks” (G1P1). This raisesthe questions how younger people or children would interact with the two modalities.
Figure 7.11: Pictures from our study illustrate in which ways participants worked with the twomodalities.
144

Collaborative Physicalizations
Sharing Findings with Group Members Half of the participants rated the physicalmodality as better for conveying information to the other group members (16% no differenceand 33% for the digital visualization). The semi-structured interviews revealed that this canbe partly explained through interaction techniques that were only possible with the phys-icalization. With the physicalizations participants could draw direct comparisons betweendifferent datasets in an unforeseen way: Many groups appropriated the physical objects bypulling out the layers of a specific country from all physicalizations and spatially arrangingthem next to each other. They even overlaid them to compare different sets of data of thesame country (see images 7, 8, 9, 10 in Figure 7.11). This is a good example of how thericher physical modality supports appropriation. It was not possible with the digital visual-ization because there was no way to transfer datasets from one visualization to the other. Ifsomeone wanted to show certain information to the others, they had to pass along the wholetablet, as opposed to only the relevant layers with the 3D models. Showing one or two coun-try layers with one finger on a position of interest was perceived as a good way to sharefindings with multiple participants. The physicalization allowed also to sort the countriesdifferently. Some participants stated that this gave them a “better general overview” (G2P3)of the datasets.
Physical Activity Apart from the questionnaire we made the general observation, thatgroups were physically much more active while solving tasks with the 3D models. Whenusing the digital visualization, most of the time the tablets were just lying on the table, andinformation was exchanged mainly verbally. With the physicalizations, on the other hand,there was much more movement. The 3D models were grasped, lifted up and passed around,probably because of the more comfortable shape. The participants were more inclined tomove around the table, look at the visualizations from different angles and change positionsmore frequently, especially during the open-ended tasks (see images 1, 2, 3 in Figure 7.11).The increase in movement could also partially be explained by the mentioned perspectiveproblem, as participants needed to rotate the model or move to a certain position.
Participants
To see whether the findings of this study can be generalized, the influence within groups aswell as the influence of the background and nature of the participants have to be discussed.
Group Dynamics and Opinions The rather split results of the 5-point Likert scales (seeFigure 7.9) show that roughly half of all participants clearly favored for the digital modality.Even though the questionnaires were answered alone and without discussing them with theother team members, most groups showed similar preferences. Three groups completelypreferred the digital modality, two groups the physical modality. One group had no clearpreference. For two groups, one participant differed strongly from the other team members:In both groups, this participant preferred the physical modality while the rest of the group
145

7 Potential for Communication & Collaboration
preferred the digital visualization. The tiny number of “no preference” ratings and our in-terviews show that people either really liked working with the physicalizations or rejectedthem.
Background of Participants A total of 75% of the participants were enrolled in technicaluniversity programs or have technical occupations and 33% were studying HCI. This couldlead to two speculations: Participants with a technical background might rather reject thephysical modality for practicability reasons. In contrast, HCI students might show moreinterest and acceptance for the new modality. However, we could neither detect a higherrejection from participants with technical backgrounds, nor a significantly higher acceptancefrom HCI students. The first group that completely favored the physicalizations consisted ofthree HCI students, the second of three graphic designers. However, another group entirelyconsisting of HCI students fully rejected the new modality. This shows that although a stronginfluence of the participant’s personality or background is highly likely, this background cannot be fully captured by the person’s job or study subject.
The two participants who clearly favored the physical modality while their team membershad contrary opinions could serve as good directions for possible interest groups of physi-calizations in the future. One of them is a consultant working in finance (G8P2). She statedthat the on-screen visualization did not provide any special advantages for the given taskwhile she highly praised the fun factor of the physical modality as well as its haptic quality.Most participants who enjoyed the physicalization gave similar arguments as an explanation.They were familiar with the digital visualization but still preferred the physical counterpartbecause of its unique advantages and specialties.
The other participant with a strongly different attitude from the rest of the group had no tech-nical background and studied dance while currently working as a translator. In the interviewshe stated that she felt uncomfortable with the tablet and could not engage in the collabora-tion as much as she wanted because of the technical barrier: “I couldn’t really handle the firstvisualization because it was pretty complicated and so I stayed rather quiet” (G2P1). Shewas even relieved when they switched to the physicalization and stated that she felt muchmore at ease with it. Although this is only one participant, it indicates another possible in-terest group. Some people are not comfortable with using computers or can not work withregular displays, e.g., visually impaired people. These people could show stronger interestin physical representations.
7.2.5 Discussion
Although in general the perceived quality of the collaborative work did not change on a largescale, our study gave first insights in the way in which physicalizations can be used for groupwork and enhance collaboration. We saw an increase in physical activity and group dynam-ics and found that the physical modality was perceived as more suitable to share findings
146

Collaborative Physicalizations
with the other team members. Regarding the general acceptance of the physical modalitywe collected strong opinions with most participants either fully accepting or rejecting thephysical modality. Supporters of the physicalization enjoyed the haptic quality and as a re-sult of it the greater fun factor. The other part preferred the on-screen visualization becauseit was familiar, faster to understand and more professional. Only very few participants wereneutral. It raises the question if physicalizations can be “too much fun” and therefore unsuit-able for work places or whether they should be designed less playful, to avoid bringing backchildhood memories.
The initial knowledge gained from this study implies several fields that should be exploredin the future. First, the general design of physicalizations needs to be questioned. The per-spective distortion of physical 3D visualizations is a problem and there is no final answerhow to overcome this issue. One possible approach could be the use of projection augmen-tation (see also Subsection 5.2.2 - Projection Augmented Physical Visualizations). Certaininformation or guides could be displayed on top of the 3D model while preserving its hapticquality. Furthermore, with the developments in shape changing surfaces, physicalizationscould become less static. In contrast to our previous study, in which participants stated totook the modular wooden bar chart more seriously, in this study participants questioned theprecision and reliability of the physicalization because of the fabrication process. This fur-ther highlights the question regarding the confidence that people have in data that is encodedphysically and which characteristics influence this trustworthiness.
While physicalizations need improvements to become on-par with on-screen visualizationsin certain domains it should also be possible to apply findings of this study in the researchfield of CSCW. Many participants explicitly stated that they enjoyed the easy sharing offindings with the physical modality. This raises the question in which ways similar intuitivesharing options could be created in digital systems.
This finding also reveals again, how challenging it is to conduct a study with a fair com-parison between a digital and physical modality, in which only the presentation modality ismanipulated. Our two data representations did differ in the modality and dimensionality, butalso in the form factor and, rather unforeseen, in their interaction possibilities and function-ality. This shows the strengths of tangible interactions and physical objects, as humans donot have to learn such interactions, but apply them intuitively. Therefore, it is not only nec-essary to ask, in which ways similar intuitive interactions could be created in digital systems,but also in which ways physical and digital systems could act jointly. In the future it couldbe imaginable to switch back and forth between a digital and physical data representation,dependent on the underlying dataset, the particular task or the number of team members.
Finally, the influence of the participants’ background and personality should be further stud-ied. A possible way would be to conduct similar studies with different target groups, such aschildren, teenagers or visually impaired people. Furthermore, studies with people having alighter or stronger aversion to new technology could be conducted to gain further knowledgeon how to design intuitive physicalizations for them. We also discovered that the interest inphysicalizations can not be clearly linked to just a technical or non-technical background.
147

7 Potential for Communication & Collaboration
Further studies will have to explore what exactly makes some people show high interest ina physicalization while others seem to see no value in it. Interestingly, none of the par-ticipants gave statements related to a “novelty effect,” as a feature of the physicalizations.Another question is, whether physicalizations should be designed in a way to be acceptedalso by those who currently reject them or whether research should rather focus on thosewho already show interest.
148

Chapter8Potential for Motivation &
Self-Reflection
Most of our physicalizations in the last two chapters encoded abstract data and can be cate-gorized as pragmatic data representations. Apart from the PopUpData project, all studies hadthe task to perceive and explore data in an efficient way, aiming at memorizing informationor solving tasks collaboratively. Apart from such pragmatic physicalizations, data repre-sentations can also have an artistic or aesthetic purpose to convey meaning beyond the dataitself and allow a stronger personal connection. In the evaluations of our initial prototypes(see Chapter 5 - Beyond Physical Bar Charts) it was frequently mentioned by participants,that they would like to encode their personal data in such physicalizations. They describedthis as a personalized or data-driven souvenir, which they could use as an aesthetic piece ofscenery for the shelf.
This chapter presents the Activity Sculptures project, which is based on these statementsand investigated in which ways personal activity data can be encoded in physical artifactsand explored their potential for motivation and self-reflection. Activity Sculptures are 3Dprinted physical tokens encoding data of physical activity. In our work, the data from a runis processed to create a unique piece, which becomes part of a larger sculpture (see Figure8.1). We conducted a three-week field study with 14 participants to observe the ways inwhich such sculptures impact participants’ experiences and their running activity. The studyrevealed that participants liked the general idea of receiving personal physical rewards fortheir physical activity. The sculptures generated a playful experimentation, e.g., by changingrunning habits, and social dynamics, e.g., discussions on runs or envy and competition.
Personal contribution statement: The content of this chapter is based on a master thesis by Franziska Sauka[2014] and was published as an article by Stusak, Tabard, Sauka, Khot, and Butz [2014]. See Disclaimer fora detailed overview.

8 Potential for Motivation & Self-Reflection
Figure 8.1: Four Activity Sculptures encoding running activity data: a figure, a necklace, a lampand a jar.
Our findings suggest that physicalizations of personal data can provide additional benefitssuch as strengthening emotional connections and complement persuasion mechanisms witha more playful and reflective look at ones’ activity. Therefore, they seem a promising com-plement to their digital counterparts. The project demonstrates a promising way of howphysicalizations can be used for displaying personal data and reveals exciting further direc-tions.
8.1 Motivation & Background
Our primary motivation to explore the potential of physicalizations representing personaldata is based on the statements participants made in our early explorations. The decision tofocus on running activity data had several reasons. One was that sport is a domain in whichphysical tokens such as medals or cups are already widely used as material rewards. Fur-thermore, existing research in technology-supported behavioral change shows that feedbackand (digital) visualizations of past activity can increase current physical activity. Therefore,we were interested whether the same effects would come into play with physicalizations, orwhich other dynamics would emerge. Finally the tracking of physical activity, especiallyof running activity, became much easier recently. This is especially the case for runningactivity, provoked through advances of sensing technology in wearable fitness trackers (e.g.,Fitbit Charge, Garmin Vivosmart, Jawbone, Misfit Shine) and smartphones with their cor-responding mobile tracking applications (e.g., RunKeeper, Nike+ Running, Endomondo,Runtastic).
Khot et al. [2014] followed a similar approach with their SweatAtoms system, which trans-formed physical activity data based on heart rate into five different 3D printed material arti-
150

Motivation & Background
facts. The field study in six households for two weeks revealed that participants’ relationshipto physical activity can be affected by physical representations and strengthen emotionalconnections. Our work complements/differs from their project in the following ways:
• Broader study: Both studies were conducted “in-the-wild”, but we had twice as manyparticipants (14 vs. 7) and a longer duration (three vs. two weeks).
• Different data: Instead of everyday physical activity we focused on running activity.We used various variables related to running activity (running time, distance, speed,duration, elevation gain), while Khot et al. [2014] concentrated on heart rate data.
• Different design strategies: Besides the various models of the sculptures, we alsofollowed a modular approach in which physical objects add to each other, leading tobigger artifacts.
• Off-site printing: In the SweatAtoms system participants had to print the artifacts them-selves. Therefore, the printing process had an observable influence on participants’experience with the data representations. As participants directly received the artifactsin our case, we had a stronger focus on the physicalizations and the encoded data.
Also related to our project are works in the area of “quantified self” and research on be-havioral change. In the following, we briefly discuss in which ways technological solutionshave been proposed to track people’s activity and to foster change in their behavior.
8.1.1 From Lifelogging to Quantified Self
Before the invention of computers and digital tracking devices, artists and scientist have usedtools such as notebooks to track and reflect on their daily activity. With the raise of personalinformatics at the end of 1990’s, a number of self-tracking projects emerged. One promi-nent example of these experiments is the MyLifeBits project [Gemmell et al., 2003]: Largeamounts of personal data were recorded and organized, first focusing on computer baseddata [Freeman and Gelernter, 1996], later also based on lifelogging prototypes incorporatingan increasing number of sensor data [Bell and Gemmell, 2009]. The primary goal of thiscollection of various types of data was to augment personal memory. Those experimentsshowed that collecting and reflecting on personal activity data can have a clear impact onareas of health and well-being [Li et al., 2010]. This led to the recent emergence of the“quantified self” movement [Wolf, 2009], an “international collaboration of users and mak-ers of self-tracking tools” with the goal to gain “self-knowledge through self-tracking withtechnology”1. This self-knowledge based on personal data can range from detecting spend-ing habits, to stress or advancements in physical activity, often with the underlying goal ofself-improvement and a change of undesired behavior.
1 http://quantifiedself.com/ (accessed 2015-12-15)
151

8 Potential for Motivation & Self-Reflection
8.1.2 Motivating Physical Activity
The design of tracking and motivational applications are often based on behavioral psy-chology [Consolvo et al., 2009; Froehlich et al., 2010], with the hypothesis that immediatecontextual feedback can promote behavioral change [Li et al., 2011]. Tracking of activityand providing of contextual feedback has become much easier recently, due to progress insensing technology and wearable devices. Therefore, it seems that the primary challenges tobehavioral change are not technological but human ones, such as helping people reach theirgoals and retain the changes over time [Bacon et al., 2002]. Strategies to support behaviorchange can be found in social theory and include the promotion of gradual changes in indi-viduals’ behavior [Grimley et al., 1994] or mechanisms for sustaining the changes over time.A thorough literature review by Consolvo et al. [2009] identified the following strategies:
1. use abstraction, rather than raw sensor data to foster reflection;
2. be controllable, by letting people set their own goals [Locke, 2002];
3. show trends, for people to relate past efforts to the goals they set;
4. be positive, positive reinforcement encourages change [Consolvo et al., 2008]; nega-tive feedback or punishment are not effective motivators [Lin et al., 2006];
5. be comprehensive, by not limiting feedback and rewards to what can be sensed, butaccount for other positive behaviors that were not captured by the system [Consolvoet al., 2006];
6. be aesthetic, by displaying information in a comfortable and attractive manner; thiscan increase enjoyment and engagement [Fan et al., 2012];
7. be unobtrusive, by collecting data without interrupting users and presenting it whenneeded;
8. be public, allow sharing [Munson and Consolvo, 2012] as well as social influencesthrough family participation [McLean, 2003].
Although these strategies are mainly based on observations and experiences with digitalsystems and visualizations, we used them as guidelines and inspiration for the design of ourphysicalizations. They provided powerful motivators and demonstrated approaches of waysin which behavior can be influenced without people noticing. The field study of twinklylights [Rogers et al., 2010], for example, showed that ambient information could transformthe way people behave without them being aware of it, in this case, taking stairs rather thanthe elevator.
Nonetheless, many other factors apart from psychological elements contribute to lifestyleimprovements. For instance, Munson and Consolvo [2012] showed that digital rewards donot motivate inherently which raises questions about how such rewards should be designed.
152
Design Process of Activity Sculptures
Furthermore, the design of behavioral change systems is often based on inherent normsand visions of ideal behaviors [Rogers and Marsden, 2013]. Rather than persuading peo-ple into a specific behavior, more positive strategies might aim at changing attitudes insteadof behaviors. Examples for such positive strategies are designs or systems that leave roomfor stories [Purpura et al., 2011] or move beyond the individual [Brynjarsdottir et al., 2012;Dourish, 2010]. Yetim [2013] sees persuasion as a communicative act which enables design-ers to promote discussion “on the intent of persuasion and the strategies chosen to achievethe desired attitude and/or behavior change.” This approach might avoid an overly ratio-nal model of human behavior, which is often criticized [Brynjarsdottir et al., 2012; Purpuraet al., 2011]. We think that encoding personal activity data in a physical form can fosterreflection and communication on physical activity, similar to their digital counterparts. Webelieve, that physicalizations can provide additional benefits, such as generating a playfulrather than functional relationship to one’s physical activity.
8.2 Design Process of Activity Sculptures
This section describes the design and the fabrication process of the Activity Sculptures.Based on a literature review, a brainstorming session and an online survey we explored var-ious concepts (see Figure 8.2), which we then refined into four types of sculptures. Wedeveloped a fabrication process leveraging web technologies to fetch running data, and gen-erated 3D models which could then be 3D printed.
8.2.1 Initial Concepts
Similar to digital visualizations, physical data representations can display data in varioustypes and for different purposes. Our first step was to limit the space within which we woulddesign Activity Sculptures and gain initial insights which characteristics they should meet.We organized a Brainstorming Webs [Hyerle, 2008] session with five colleagues (graduatestudents) to discuss ideas in which ways such Activity Sculptures could look like. The mostpromising concepts were later refined through a review of the literature presented above andrated by a wider public through an online survey (47 participants).
Initial Design Directions
The brainstorming session had two outcomes: concrete concepts for the sculptures and gen-eral design trends and characteristics, that the sculptures should reflect. Based on furtherinformal discussions and the literature, we categorized these principles into three main de-sign directions:
153

8 Potential for Motivation & Self-Reflection
Figure 8.2: Sketches of eight early concepts that where used in the brainstorming session andfor the online questionnaire.
• Reflection: sculptures should support self-reflection more than a comparison with oth-ers; should display intermediate goals and stages; ought to reflect met and unmet goals;should always stay within sight.
• Motivation: sculptures should regularly support motivation and feedback; should dis-play good and bad performances.
• Shape: should only look aesthetically pleasing if good performances were achieved;should serve some practical purpose; should be modifiable and variable.
From the broad collection of our ideas and the ones generated in the brainstorming session,we identified six concepts which best suited these design directions. These concepts includeda necklace, a lamp, a jar, a picture frame, a modular robot and an engraved sculpture (seeFigure 8.2). Apart from these abstract and artistic concepts we also included rather pragmaticdata representations such as a bar chart and a stacked line graph.
Online survey
To collect a broader feedback for these initial concepts, but also gather information on run-ning behaviors and usage of self-tracking applications as well as visualizations, we con-ducted an online survey. In total, 47 participants (57% were female and 43% male) between23 and 50 years old answered our survey.
The answers regarding the general idea of encoding personal data physical were encourag-ing, as the majority of respondents (35) stated that they would like to have sculptures ofphysical activity data. The possibility to compare their performances with other runnersseemed less essential, as 75% of the respondents rated the visibility of their data as moreimportant. In contrast to related work, which suggests an avoidance of negative feedback,70% favored seeing all activities, including “bad” performances.
154
Design Process of Activity Sculptures
Respondents considered the motivational potential of physical representations positively,with 34% (16) perceiving a very good opportunity and nearly half (23) thinking that it couldmotivate them a little. The majority (32) considered the motivational aspects of physicalvisualizations of running activity positively.
Similar answers were given regarding the purpose that such physicalizations of activity datashould fulfill. An increase in motivation was considered by 23 participants as important, 14preferred sculptures supporting self-reflection, nine favored artwork pieces, and 20 partici-pants preferred a mixture of all three purposes.
In general, respondents preferred the artistic and extensible sculptures. The lamp was ratedbest, followed by the jar, the picture frame, the sculpture with engraving and the modularrobot. The more pragmatic data representations, i.e., the stacked line graph and the bar chartwere ranked lowest.
We asked questions about the design of the sculptures and about the frequency of receivingthem. Most participants (19) preferred to receive sculptures when reaching pre-establishedgoals and 11 chose the option of receiving one sculpture per month. Participants, there-fore, prefer longer periods of time between receiving sculptures, as only a few (5) wanted asculpture for every run.
In summary, the survey revealed an appreciation for the concept of Activity Sculptures aswell as interest and belief in the motivational potential of the sculptures. The ranking ofthe sculptures also highlighted the aesthetic aspects of the sculptures. The slow pace atwhich participants expected to receive sculptures reveals the importance of excitement andcontemplation over instant feedback and quantitative comparison.
8.2.2 Design Decisions
Based on the initial feedback from the brainstorming session and the online survey, we de-cided to focus on sculptures of an abstract nature, which support self-reflection. The sculp-tures should also be aesthetically pleasing and not seek constant attention. As participantswould use the sculptures for a longer time, and the comparison with other seemed less im-portant, we focused less on comprehensibility and direct readability of the exact data at thefirst glance.
Participants liked the idea of extensible sculptures, therefore, we decided to make the sculp-tures modular and rewarding each running session with a piece of the sculpture. The singlepieces are comparable and therefore allow self-reflection, but also promote regular physi-cal activities and uphold people’s interest, as they add up to make a whole sculpture. Forpractical reasons, we decided on producing one piece after every run, which contradicts thefeedback from our survey but allows an evaluation of the concepts after about one month.
We decided to keep four sculptures for the final study, which fitted best our design directions:the necklace, lamp, jar, and figure (see Figure 8.1). As a sculpture that predominantly ap-
155
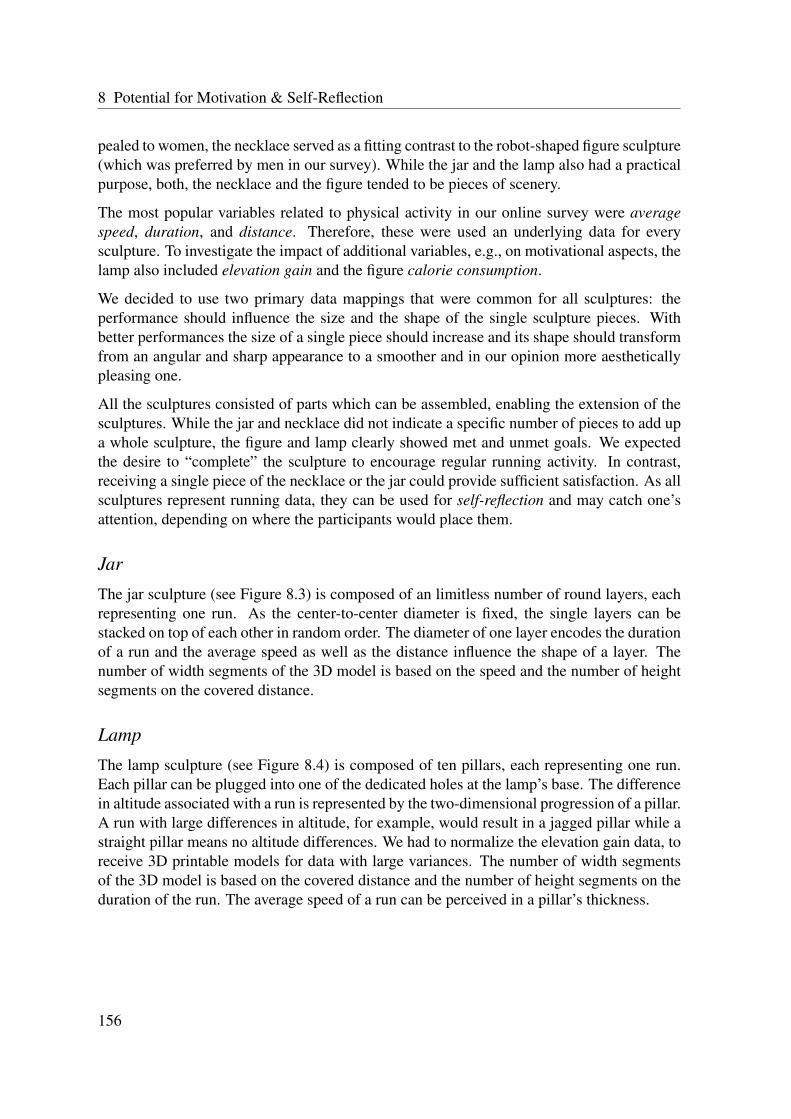
8 Potential for Motivation & Self-Reflection
pealed to women, the necklace served as a fitting contrast to the robot-shaped figure sculpture(which was preferred by men in our survey). While the jar and the lamp also had a practicalpurpose, both, the necklace and the figure tended to be pieces of scenery.
The most popular variables related to physical activity in our online survey were averagespeed, duration, and distance. Therefore, these were used an underlying data for everysculpture. To investigate the impact of additional variables, e.g., on motivational aspects, thelamp also included elevation gain and the figure calorie consumption.
We decided to use two primary data mappings that were common for all sculptures: theperformance should influence the size and the shape of the single sculpture pieces. Withbetter performances the size of a single piece should increase and its shape should transformfrom an angular and sharp appearance to a smoother and in our opinion more aestheticallypleasing one.
All the sculptures consisted of parts which can be assembled, enabling the extension of thesculptures. While the jar and necklace did not indicate a specific number of pieces to add upa whole sculpture, the figure and lamp clearly showed met and unmet goals. We expectedthe desire to “complete” the sculpture to encourage regular running activity. In contrast,receiving a single piece of the necklace or the jar could provide sufficient satisfaction. As allsculptures represent running data, they can be used for self-reflection and may catch one’sattention, depending on where the participants would place them.
Jar
The jar sculpture (see Figure 8.3) is composed of an limitless number of round layers, eachrepresenting one run. As the center-to-center diameter is fixed, the single layers can bestacked on top of each other in random order. The diameter of one layer encodes the durationof a run and the average speed as well as the distance influence the shape of a layer. Thenumber of width segments of the 3D model is based on the speed and the number of heightsegments on the covered distance.
Lamp
The lamp sculpture (see Figure 8.4) is composed of ten pillars, each representing one run.Each pillar can be plugged into one of the dedicated holes at the lamp’s base. The differencein altitude associated with a run is represented by the two-dimensional progression of a pillar.A run with large differences in altitude, for example, would result in a jagged pillar while astraight pillar means no altitude differences. We had to normalize the elevation gain data, toreceive 3D printable models for data with large variances. The number of width segmentsof the 3D model is based on the covered distance and the number of height segments on theduration of the run. The average speed of a run can be perceived in a pillar’s thickness.
156

Design Process of Activity Sculptures
DIAMETERDuration
NUMBER OFHEIGHT SEGMENTSDistance
NUMBER OFWIDTH SEGMENTSSpeed
Figure 8.3: Picture of the jar sculpture and the digital 3D model of one layer.
DIAMETERAverage Speed
PATHWAYElevation Gain
NUMBER OFHEIGHT SEGMENTSDuration
NUMBER OFWIDTH SEGMENTS
Distance
Figure 8.4: Picture of the necklace sculpture and the digital 3D model of one pillar.
157

8 Potential for Motivation & Self-Reflection
DIAMETERDuration
NUMBER OFHEIGHT SEGMENTSDistance
NUMBER OFWIDTH SEGMENTS
Speed
Figure 8.5: Picture of the necklace sculpture and the digital 3D model of one bead.
Necklace
The necklace sculpture (see Figure 8.5) is composed of an undefined number of beads, eachrepresenting one run. The single beads can be added to a chain in a random order, resultingin a necklace. The size of the bead encodes the duration of a run. Its shape is influencedby the average running speed, which affects the number of width segments and the covereddistance, which is visible in the number of height segments.
Figure
The figure sculpture (see Figure 8.6) is composed of eight body parts, each representinga run. The single body parts can be plugged into the unfinished figure. The height of abody part depends on the duration of a run and its scope on the covered distance. Its shaperepresents the calories burned through the number of width segments and the average speedthrough the number of height segments.
8.2.3 Fabrication Process
A general overview of our process to fabricate the sculptures is displayed in Figure 8.7.The activity data was tracked with a mobile tracking application and saved in the cloud(Figure 8.7-1). The data was then gathered either through a website export and e-mail (Fig-ure 8.7-2a) or by API calls (Figure 8.7-2b). Digital 3D models of the sculpture were gener-ated based on the captured data and saved as STereoLithography (STL) files. We then used
158

Design Process of Activity Sculptures
NUMBER OFWIDTH SEGMENTS
Calorie Consumption
HEIGHTDuration
SCOPEDistance
NUMBER OFHEIGHT SEGMENTS
Average Speed
Figure 8.6: Picture of the figure sculpture and the digital 3D model of several parts of it.
an Ultimaker Original2 to 3D print the sculptures (Figure 8.7-3). The single pieces of wereeither handed out in person (Figure 8.7-4a) or by letter (Figure 8.7-4b).
Data
We used four popular running applications for mobile phones (Endomondo, Runkeeper,Nike+ Running and Runtastic) to track and extract the activity data. All four applicationswere available for the mobile operating systems iOS and Android. In total, we focused onfive data types to represent in our sculptures: 1. the duration of a run; 2. the distance cov-ered; 3. the average speed; 4. the number of calories burned; 5. the elevation gain of arunning session. All applications were able to record these data types and export each runas TCX, GPX or CSV files. Participants could sent us the files directly via e-mail, or wegathered them from their member accounts via website export or API calls.
Digital 3D Models
First we generated digital 3D models based on the collected activity data, which were thenconverted to obtain printable 3D objects. We used web technologies for the generation of the3D models, in particular, several JavaScript libraries. We used a combination of Three.js3,
2 https://www.ultimaker.com/ (accessed 2015-12-15)3 http://threejs.org/ (accessed 2015-12-15)
159

8 Potential for Motivation & Self-Reflection
DATA
STL
{API}
@
CLOUD
2 3
4
b
a
b
a
Figure 8.7: The fabrication pipeline of the Activity Sculptures.
a library for WebGL, Csg.js4, a library for Constructive Solid Geometry (CSG) and Three-CSG.js5, as a bridge between them, since the two libraries use different formats for geometry.The CSG library uses boolean operations (i.e., add, subtract, union or intersect) to build com-plex objects by assembling simple objects. To display the sculptures, we created scenes foreach sculpture, including the physical activity data and the 3D geometries. We used HTMLtemplates which could be loaded in a Web browser and exported the 3D models as STL files,a format suitable for 3D printing.
3D printing
As 3D printing software we used Cura6, which supports a manipulation of the printing op-tions and therefore, allowed us to increase the quality of printing results. The software alsotransformed the 3D models (STL files) into G-Code, a numerical control programming lan-guage and the machine code understood by the Ultimaker Original. We decided to use onlywhite PLA as material for the sculptures to keep the printing process as easy and fast aspossible, e.g., by avoiding the manual exchange of different materials.
8.3 Study Design
We conducted a three-week field study to investigate participants’ experiences and to gaina better understanding of the impact of physicalizations on running activity. The primary
4 http://evanw.github.io/csg.js/ (accessed 2015-12-15)5 https://github.com/chandlerprall/ThreeCSG (accessed 2015-12-15)6 https://github.com/daid/Cura (accessed 2015-12-15)
160

Study Design
goal of our study was to observe the influence of physicalizations on participants’ behavior.In addition to the question whether our Activity Sculptures would evoke self-reflection anddiscussions, we also were interested in participants’ general perception of physicalizationsof personal running data.
8.3.1 Participants
In total, we recruited 16 individuals, but one participant did not have time to go for a run, andanother had technical issues. Therefore, the data of these two participants was not taken intoaccount, and the following will focus on the remaining 14 participants (8 females, aged be-tween 24 and 62). We announced the study in a Facebook group of our university and used anewsletter with subscribers who are interested in study participation. The participants repre-sented a range of occupations including a controller, designer, business consultant, assessor,students, and research assistants from our university (see Table 8.1 for more details).
Existing running habitsOur participants had various levels of running experience. While five participants had notgone running regularly before the study, the remaining nine participants ran between oneand three times a week.
Existing use of tracking applicationsMost of the participants (9) already used a mobile tracking application (see also Table 8.2).Four participants stated that they were part of a running team, meaning they worked togetherin the same building and saw each other several times a day. They already shared theirrunning data in the same mobile tracking app (Endomondo), although only three of themrun regularly. The five students who took part in our study attended the same university andknew each other by sight. Five participants reported they had never used a mobile trackingapplication before the study. Reasons were the inconvenience of carrying a mobile devicealong or the perceived lack of additional value.
8.3.2 Setup
Participants, who wanted to be part of the study, needed a mobile device which allowedthe installation of one of the following tracking applications: Endomondo, Runtastic, Nike+Running or Runkeeper. At the moment of study, these were the most used tracking applica-tions, based on the number of downloads specified by the digital distribution platforms suchas the Apple App Store or the Google Play Store. The five participants who did not use amobile tracking application before were asked to choose and install one of the four applica-tions. Participants also had to specify if they would send us the tracked data per e-mail or ifthey would provide us access to their account for the duration of the study.
161

8 Potential for Motivation & Self-Reflection
Table 8.1: Demographic details of the participants.
ID Gender Age Occupation Running routine Running Team
1 male 25 student once a week, 30-40 min no
2 male 30 research assistant
3 times a week, 10-20 km yes
3 male 31 student 1-2 times a week, 5-10 km no
4 female 29 research assistant
twice a week, 5-10 km yes
5 female 28 research assistant
non-runner no
6 male 27 controller once a week, 5 km no
7 female 24 student non-runner no
8 female 24 student once in two weeks no
9 female 24 student non-runner no
10 male 29 research assistant
3 times a week, 10 km yes
11 female 62 assessor non-runner no
12 female 30 designer twice a week, 5 km no
13 female 30 research assistant
non-runner yes
14 male 32 business consultant
2-4 runs a week, 7-8 km no
8.3.3 Procedure
The field study with 14 participants had a duration of three weeks and took place in Novem-ber 2013 in the local area of Munich in Germany. At the beginning and the end of the studywe conducted semi-structured interviews, which were complemented with pen-and-paperquestionnaires. We also met several participants throughout the study, if they chose a per-sonal handover of the sculptures. Participants received no compensation, but could keeptheir Activity Sculptures.
Preliminary session
In the preliminary session participants had to sign a consent form and fill out a questionnaireabout demographic data. We also asked about their current physical activity routines andgoals, types of running data they are interested in and their experience with physicalizations.
We then introduced the four types of Activity Sculptures by presenting the digital 3D modelsof each physicalization printed out on paper. First, we showed only the physicalization with-out any further descriptions, after that we presented variations with explanations about thedata mapping. The decision to not show any 3D printed sculptures was made to better ob-serve participants’ reactions when receiving their first piece. After the presentation of all foursculpture types, we asked the participants to share their first impressions of each physicaliza-
162

Results
tion. Participants rated also aspects such as the potential of motivation or self-reflection on5-point Likert scales. Finally, each participant had to choose one type of Activity Sculptures,which they would receive throughout the study.
Field Study
Participants had to track their runs during the three-week field study with one of the mobiletracking applications mentioned above. When participants sent us their data or we detectednew data through regularly API calls, we generated the digital 3D models according to theruns and 3D printed them. The period between receiving the data and delivering the sculpturepieces to participants was between one and three days. When the handover of the sculpturepieces occurred in person, the study leader observed and took notes of the participants’reactions. We asked them to express their first impressions of the sculpture.
Closing session
The closing session started with a semi-structure interview in which we asked each partici-pant to recall their experiences in the last weeks and gathered feedback on the physicaliza-tions. While we focused on the physicalizations, the social aspects that came along withthem and the participants’ running behavior, we also left room for personal anecdotes andcritique. The session ended with pen-and-paper questionnaires, where participants had torate the same aspects on 5-point Likert scales as in the preliminary session but also newquestions focusing on their impressions on the chosen sculpture.
Data Collected
We gathered data via semi-structured interviews, questionnaires as well as running logs.The interviews were audio recorded and transcribed by two researchers. We followed aqualitative coding approach to identify both overall themes and more specific findings linkedto single participants.
8.4 Results
This section describes the key findings from our three-week field study. We begin with anoverview of the participants and the results of the questionnaires. The main part will be thequalitative analysis of the semi-structured interviews.
163

8 Potential for Motivation & Self-Reflection
8.4.1 Participants Overview
An overview of the study setup for every participant is displayed in Table 8.2. Five partic-ipants used Endomondo to collect their data, four participants chose Runtastic, three usedNike+ Running and two tracked their runs with Runkeeper.
Regarding the reasons to go running the most often mentioned reasons were fitness (6),relaxation (4), fun (2), balance (2) and group motivation (2). Similarly to the results ofour online questionnaire, the most important types of running data for the participants werespeed (6), distance (5), duration (4), progress (4) and route (2). While eight participants didnot have any experience with physical visualizations, six reported that they had already seenvarious examples.
The different sculpture types were almost equally distributed throughout the participants, asthe lamp was chosen by four participants, the jar by four as well, the necklace by three, andthe figure by three. In total, we had 71 runs across participants over the three weeks of thestudy, while the number of runs of each participant ranged between one and nine times. Onlytwo participants chose a delivery of the single sculpture pieces by letter, the majority (12)preferred a personal delivery.
Table 8.2: Overview of the study setup for every participant.
ID Tracking App (*no app use before study)
Physicalization Delivery # runs / received pieces
1 RunKeeper* lamp personal 6
2 Endomondo personal 9
3 RunKeeper jar personal 6
4 Endomondo jar personal 8
5 Endomondo* necklace
figure
figure
personal 3
6 Nike+ Running lamp per letter 4
7 Runtastic* lamp personal 5
8 Nike+ Running personal 5
9 Runtastic necklace
figure
personal 4
10 Endomondo jar personal 6
11 Runtastic* personal 7
12 Nike+ Running jar per letter 4
13 Endomondo necklace personal 1
14 Runtastic* lamp personal 3
8.4.2 Questionnaires
Participants had to fill out 5-point Likert scale questionnaires (ranging from 1=very good to5=very poor) in the preliminary and closing sessions. The results of the questions, which
164

Results
were asked in both the preliminary and closing session are displayed in Figure 8.8. Partici-pants appreciated the general idea of encoding running data through physicalizations. Beforethe study, four participants were impartial, whereas all other participants rated the idea asgood or very good. In the closing interviews all participants rated the idea as either good orvery good. The rating of the motivational potential did hardly change. Before the study tenparticipants suggested potential for motivation and after the study eleven participants ratedit as very good or good.
General idea
8 2 4
8 6
pre
post
Potential for motivation
2 264
1 265
pre
post
Potential for comparison
43 3 4
33 6 2
pre
post
0% 25% 50% 75% 100%
Potential for self-expression
4 4 4 1 1
3 4 1 5 1
pre
post
Potential for self-reflection
pre
post
0% 25% 50% 75% 100%
31 2 4 5very good very poor
3 281
1 535
Figure 8.8: Results of the 5-point Likert scale questionnaires participants filled out during thepreliminary and closing (“post”) sessions.
The results for the potential for comparison with others, self-expression, and self-reflectionshowed a similar trend. Before and after the study the ratings of half of the participants weregood or very good. For self-reflection, the number of participants who rated it very goodincreased from one to five. The majority of participants who were impartial before the studydecreased their ratings afterward and could not be persuaded of these specific potentials.The necklace stood out, as all participants who chose this type increased their scores forcomparison with others and self-expression.
The questionnaire used in the closing session included further questions regarding the partic-ipants’ impressions on their chosen sculptures. The scale ranged again from 1=very good to5=very poor. Participants rated the aesthetics, practical benefit, information content and thequality of the sculptures overall as good. It is worth mentioning that the necklace sculpturereceived the best ratings overall, apart from practical benefit, in which the lamp and the jarscored better.
8.4.3 Interviews
We interrogated the participants throughout the entire study. The semi-structured interviewin the preliminary session focused on the first impression of the participants regarding the
165

8 Potential for Motivation & Self-Reflection
different sculpture types, e.g., what participants appreciated and disliked about the physi-calizations, and their motivation in picking a specific type. Throughout the study, the studyleader also collected feedback from the twelve participants who received their sculpturepieces through a personal handover. Finally, in the closing session the interviews includedopen-ended questions about the physicalizations as well as their influence on participants’experiences and behavior.
We decided to present our findings and observations from all interviews conjointly, instead ofseparating them into preliminary and closing. We also did not explicitly categorize betweenthe sculpture types but structured the results into four general topics: choice of ActivitySculpture, the perception of Activity Sculpture, the impact on running activity and the rewardexperience.
Choice of Activity Sculpture
Participants’ choice for a sculpture type was based on various considerations. In additionto the general design and aesthetics, practicality and the data mapping were also importantaspects. Participants also tried to envision in which ways the sculptures would “scale”, lookand stand after multiple runs.
Aesthetics Most participants stated that the aesthetic of the sculpture played a major rolein the choice. The necklace sculpture was appreciated by participant 5 just because it wasenjoyable jewelry she could wear. Two participants also mentioned that they liked the fact,that the necklace would be an attractive piece of jewelry with only one bead on it as well asmany.
Similar to the necklace, most participants expected the jar to scale well and look aesthetic,independent of the number of runs completed, although participant 11 had difficulties imag-ining the single pieces of the jar fitting together if large differences between the runs oc-curred. In general, aesthetics were strongly linked to the concerns participants expressedregarding the ability of certain sculptures to scale and their appearance after several runs.Two participants stated that they did not like the lamp and the figure because the sculptureswould look “incomplete” if they would not reach enough runs within the limited period ofthe study. The robot-like shape of the figure sculpture was criticized by four participants, asthey worried that it would look unaesthetic or disproportional when assembled.
Metaphorical Distance Six participants did not like the figure sculpture as it had a strongrelation to the running activity. They liked explicitly the physicalizations that encoded datain a rather “abstract” manner. In contrast, two participants rejected the jar sculpture as itwould remind them at an office desk at work and would represent the opposite of physicalactivity.
166

Results
Interpreting the Data The types of running data that were encoded and the way theywere represented, seemed to play a less significant role regarding the choice for a sculpture.None of the participants stated that they chose the lamp or the figure sculpture because theyshowed additional variables such as the elevation gain or calorie consumption. Participantsrather appreciated the general visibility of progress. Participant 6 liked the lamp “becauseit is clear when pieces are missing.” Similar to the lamp, two participants valued the sameproperty in the figure sculpture.
Practical Purpose Some participants favored the aspect that two of the sculptures had apractical purpose. They liked the storage ability of the jar sculpture and also noted positivelythat the lamp actually gives light. In contrast, the perceived lack of usefulness and later useof the figure sculpture led five participants to pick other sculptures.
Playfulness While most participants disliked the figure sculpture because of its aesthetics,all participants who chose the figure, highlighted it as the most interesting option, becausethe outcome was somehow unpredictable. Participant 8 stated that “it is funny and excitingto imagine what will come out in the end, and what it would look like.”
Perception of Activity Sculpture
In the following we will report in which ways participants perceived the sculptures, e.g., ifthey could read and understand the underlying data and if the 3D printed artifacts met theirexpectations. We will also describe the perception of the Activity Sculptures by others thanthe participants of the study.
Interpreting the Data Most participants had difficulties understanding the way in whichtheir run was mapped to the shape when they received the first sculpture piece. These diffi-culties diminished as participants received more sculpture parts with different shapes. Par-ticipant 14 noted that his first pillar of the lamp sculpture was not expressive, but once inassociation with the second piece, the difference between the two runs was noticeable. Ifruns are very similar this also reflects in very similar sculpture pieces. Participant 4 hadalmost identical runs and therefore difficulties in perceiving any differences between thesculpture parts. Most participants only mentioned the most distinct changes in the sculpturepieces based on the underlying data, such as the height of a lamp pillar or the diameter of ajar layer. Particularly for the necklace, participants appreciated the rather simple and clearencoding of an increased running performance into the size of a bead.
Expectations and Aesthetics Statements in semi-structured interviews in the preliminarysession showed, that participants’ expectations started to form as well as anticipation forthe objects they would receive. Participants had concerns about the appearance of theirsculpture pieces and their assembly as well as the reliability of the data (particularly about
167

8 Potential for Motivation & Self-Reflection
the elevation gain). However, scalability concerns were not expressed in the closing sessionand participants seemed to appreciate how the pieces fitted together.
Participants’ reaction when they received their first sculpture part can be split into two broadcategories. Most participants were positively surprised about the aesthetics, as until thenthey only had seen images of the digital 3D models. However, two participants reporteda disappointment related to a discrepancy between their expectations and the pieces theyreceived.
All participants who chose the necklace liked their first bead. Although participant 5 re-ported that the bead was smaller than she had expected, she found it “pretty” and wore thenecklace around her neck immediately. Similarly, participant 10 liked the first layers of hisjar sculpture and enjoyed their usefulness even when the jar consisted of merely two pieces,as he immediately used it to hold a pencil.
Positively surprised by the figure sculpture, participant 2 reported that the pieces look muchnicer then he thought, as he expected them much more clunky. Although he could imag-ine that the figure may not appear as nice for other people, this seemed to be secondary tohim, as he would know what effort he put into receiving the sculpture. The participant ex-plained that watching the sculpture grow created an emotional attachment, which increasedthe significance of the sculpture to him personally.
Overall, all participants but two were happy with their choice and would have chosen thesame sculpture again. Participant 8 would have chosen the necklace over the figure sculpturesince she found that the necklace scaled better. Participant 10 would have selected the lampinstead of the jar because this sculpture type also encodes differences in altitude.
Participants did not only compare new pieces with the ones they already received but alsowith the pieces of other participants. Participant 2 expressed minor disappointment abouthis first piece as he saw other participants receiving their first jar pieces which were muchlarger than the small foot of his figure, although he had run for a long time. Participant 4was disappointed when she received her third jar layer after a short run but with a relativelyhigh speed by her standards. She criticized that the short duration of her run, compared toher previous runs, was clearly visible in the sculpture piece, but that the increased speed ofthis run was hardly observable.
Personalization Many participants reported suggestions how they would personalize thesculptures to their liking. Given the minimalist form and the white color of the sculptures,participants were able to appropriate them through various means.
As the single pieces did not encode the date of a run, Participant 1 had the idea to write thenumber of the runs at the bottom of each piece of the lamp figure to allow him to track theorder. Participant 5 spelled out a strategy on how to arrange the beads of her necklace byputting the biggest piece in the center and the others around it (see also Figure 8.1). Shealso had thought about painting the single pieces in different shades of blue according to thedate of the run so that she can always track the order despite rearranging them on the chain.
168
Results
Participant 2 thought of dressing his figure sculpture in a shirt of his favorite soccer club andfinally he attached a small medal to his sculpture (see also Figure 8.1).
Two participants also mentioned the request to have further possibilities to customize thesculptures in the beginning. Besides offering more types of sculptures, they also suggesteda free choice of the data variables and in which ways they are mapped to the characteristicsof the sculpture.
The sculptures were actually embedded in everyday life by several participants (see Figure8.1 and 8.9 for various examples). The jar sculptures were used as a storage box for aUniversal Serial Bus (USB) stick, adhesive tape, and pencils while other participants used itas a tea candle holder or as a “light volcano” by putting an LED lamp inside. The necklacewas worn by all participants, and the lamp and figure sculptures were placed at variouslocations, e.g., an office desk or a nightstand.
Perception by Other People Participants also reported how the Activity Sculptures andthe encoded data were perceived by other people. Participant 5 mentioned that she normallydid not like to share her running data, e.g., by posting a run on social media platforms.However, she liked to show and talk about her necklace as she preferred it as a way of self-expression. She also highlighted the fact that she could see peoples’ reactions immediately.Participant 11 enjoyed the necklace because it could be worn openly around the neck and isthus easily noticed by others.
For several participants, it seemed an important aspect that the sculptures were not clearlydistinguishable as data representations. This also meant that participants could choose toexplain its significance whenever they liked. Participant 1 stated that one of his visitors likedthe idea of having a piece of scenery which cannot be identified as being a data representationor being related to physical activity.
Impact on the Running Activity
The interviews in the closing session revealed some anecdotal evidence of the ActivitySculptures’ motivational potential and influence on running routines.
Motivation In contrast to most digital visualizations, our physicalizations had an “alwayson” aspect, as they were visible at any time the participants were in their vicinity. The mostextreme case being the necklace which can be worn and seen at all times. Participant 13,who was part of the running team, referred to her only piece as the “pearl of shame” since itindicated that she only ran once.
The feature of comparing single sculpture pieces, e.g., to a previous run or to others’ runs,seemed to increase the motivation of some participants. For instance, participant 9 acci-dentally saw the necklace sculpture of another participant which had larger beads than herown, which motivated her to achieve larger pieces as well. Participant 4 was disappointed
169

8 Potential for Motivation & Self-Reflection
Figure 8.9: Various pictures of the by participants’ received Activity Sculptures and in whichways they were embedded in everyday life.
when receiving her third piece, as it was clearly thinner than the first piece. This raised hermotivation to a longer subsequent run to get a wider ring for her jar.
Almost all participants who chose the figure or lamp sculpture, which had a defined num-ber of pieces, mentioned that they tried to accomplish enough runs to assemble a completesculpture eventually. Three participants stated that the lamp influenced their running behav-ior such that it provided an incentive to fill all the hollows.
Changing Running Habits The interviews also revealed a rather unexpected impact ofthe Activity Sculptures, as they had a strong influence on some participants’ running habits.
170

Results
Curiosity, playfulness, and aesthetics began influencing the way participants ran as they triedto control the shape of the pieces they would receive.
Participant 9 mentioned having a piece in mind during every run. As the lamp sculptureencoded the elevation gain, participants who chose this type felt motivated to experimentwith speed and altitude. Participant 6 intentionally ran uphill, and participant 7 ran thesame route twice in a different manner, to see in which ways this would be reflected in thesculpture pieces.
Participant 5, who had mentioned in the preliminary interviews that she normally did notrun when it rains, actually ran in the rain, due to her “excitement” about receiving her firstsculpture piece. She was also surprised at how small and angular her first bead of the neck-lace sculpture was. Therefore, she modified her running accordingly to achieve a “nicer androunder bead.” For her third run, she then tried to achieve a performance similar to her firstrun. Her intention was to have two small beads and one big one, to have a nice appearancewith the biggest bead in the center and the smaller ones around it.
In contrast, participant 11 tried to achieve a disproportional figure sculpture by finishingruns with high variances in the data within and between single runs. Similarly, participant10 ran a half marathon to test the limits of the system.
The Reward Experience
The participants also raised questions related to their expectations and the actual receptionof the pieces as a reward.
Time of Delivery Participants thought about the best moment for receiving a sculpturepart. In general, they seemed to consider that having a delay between the run and the rewardwas beneficial. Participant 9 liked the aspect that with a delay of one day between the runand receiving a piece, one has the chance to speculate on the run and what the piece wouldlook like. Participant 14 also preferred a delay, arguing that directly after a run one alreadyfelt the reward of having finished it, whereas receiving the piece a few days later could actas an additional reward for the run. As mentioned in the design discussion, based on theonline questionnaire we initially envisioned a slower reward mechanism, e.g., a sculpturepiece per month or for specific goals instead for each run. However, none of the participantscomplained about the high frequency of delivery during the study.
Excitement Several participants mentioned terms such as “surprise” and “excitement” asan important part of the rewarding experience. Participant 11 wanted to go running imme-diately after she received her first piece since she wondered what she would receive next.Participant 8 stated that she skipped her yoga classes several times during the study sinceshe knew that she would not get a physicalization for this kind of activity. She also men-tioned it would have been nice to get rewarded with sculpture pieces for any physical activityand not only for running.
171

8 Potential for Motivation & Self-Reflection
Based on participants’ statements the figure sculpture seemed to be the most exciting sculp-ture, as all participants mentioned that they were always looking forward to receiving thenext part of their figure. The mystery of which body part would be presented to them nextwas especially appreciated. For participant 11 it would have been even more interesting ifshe had not known in advance the type of her sculpture and how it would look like until shehad put the pieces together.
Conversation All participants pointed out the ability of the sculptures to provoke ex-changes and discussions. They often served as a conversation starter. Especially the par-ticipants who chose the necklace reported, that they were often asked about their beautifulaccessory. Participant 4 mentioned that when she received a new piece she wanted to go toher colleague to show it to him and find out if he also received a new piece. Apparently, hercolleague had the same idea and so both met in the corridor holding their new pieces. Bothwere part of the running team and mentioned similarly to the other two members, that theyin general often talked about not only the sculptures but the entire study, e.g., during lunchor coffee breaks.
8.5 Discussion
The design and study of the Activity Sculptures raised various questions of how data can bemapped in a physical form and in which ways this influences the perception and interpreta-tion. It also highlighted the role of experimentation in supporting reflection, sense-making,and engagement with the data. We furthermore observed technical concerns related to scal-ability and sustainability. We believe that the physical nature of our data representationsstresses design questions which are relevant for casual InfoVis, and maybe even InfoVis ingeneral.
8.5.1 Sculptures as Personal Data Representations
It seemed that our Activity Sculptures encouraged participants to interpret and reflect ontheir personal activity data. Participants improved their reading of the physicalizations overthe course of the study. Through experimentation, they developed a finer understanding ofhow their runs influenced the sculptures. For instance, the mapping of the elevation gain andthe impact of different runs on the sculpture parts were explored in a creative and playfulway by the participants, in which they also tried to test the limits of our system. The aspectof encoding data in an unusual or unpredictable form to encourage an exploration of therepresentation possibilities also seems interesting for digital visualizations. One amusingand creative example for this is a current trend of “FigureRunning”7, in which runners use
7 http://app.figurerunning.com/ (accessed 2015-12-15)
172

Discussion
the Global Positioning System (GPS) tracking of mobile applications to create drawingswith their runs. The intention is not to motivate people to run faster or longer, but to run withmore fun. We could observe such dynamics in our study as well and believe that the physicalaspect intensified this effect, e.g., as our sculptures are unique and not easily reproducible.
The fact that the physicalizations required personal knowledge to be interpreted seemed tohave fostered reflection on the pieces and the corresponding runs. It led participants to en-gage with the objects, by observing or comparing them. It also meant that participants coulddisplay them freely without feeling as if they were over-exposing themselves. It neither feltas bragging about one’s performance nor did it felt as displaying something one would havepreferred to keep to oneself. As the underlying data is not recognizable by everyone, oursculptures also allow a form of privacy protection. It seems that abstract or casual visual-izations might be a promising direction for representing personal data, which can be sharedwith others, e.g., via social networks or other means.
8.5.2 Challenges of Static Representations
Similar to most prototypes we presented in previous chapters, the Activity Sculptures werestatic physicalizations. In contrast to digital visualizations, which can be easily updated asnew data comes in or manipulated to show different data mappings or views, the variablesand the mappings of our physicalizations were set from the beginning and did not change.Our choice of an extensible model which enabled us to augment the sculpture as new datawas being produced, seemed a suitable way to reduce this drawback.
As mentioned by some participants, it could be interesting to give more freedom of choice,e.g., by letting participants choose and change the variables and mappings or specify con-crete goals. In addition to offering more predefined sculpture types, it is also conceivable tolet the people create their own sculptures, for example, with the help of an online configura-tor. One drawback of supporting more personalization could be the lower comparability ofthe sculptures between different participants.
8.5.3 Scalability
Scalability seems one of the main concerns in representing personal data in a physical form.Running data often underlies strong variances, e.g., as runners improve or follow a specifictraining schedule. Furthermore, Activity Sculptures evolve over a long period, as they aim atfostering regular physical activity, which makes scalability challenging. It needs to displayboth minor and large changes in the data, while supporting comparison and, not the least,resulting in an object that is suitable for 3D printing.
Finding a data mapping that accommodates people’s different running patterns can be diffi-cult. A sculpture should accommodate both a runner training for a marathon and someone
173
8 Potential for Motivation & Self-Reflection
running short distances at high speeds. While the sculptures should still be readable in bothcases and show variations in the data as well as performance advancements, they should alsosupport comparability and increase motivation.
Beside these considerations which are valid for a small number of pieces, the sculpturesshould also stand on its own and be meaningful after a high number of runs. The neck-lace and the jar sculpture are theoretically scalable but would become less attractive or lessfunctional at a certain point. The lamp and the figure are not scalable because of their fixedamount of possible parts. A solution could be choosing one type of sculpture for a specifiedgoal and once this is accomplished another can be chosen. This could be combined nicelywith well-known gamification principles, e.g., unlocking new sculpture types after attainingspecific achievements.
8.5.4 Sustainability
The production of plenty plastic objects for playful or motivational purposes raises issuesof sustainability. It should be noted that technical devices to display digital visualizationalso consume a lot of energy, and their production requires a high consumption of resources.Nonetheless, we acknowledge, that Activity Sculptures increase the number of products inthe environment. It could be imaginable to focus on rather small sculptures, which requireless material, or to adjust the infill density in the printing process, to print less plastic insideof a sculpture. Another way to decrease the total amount of sculptures would be to decreasethe frequency of delivery or only offering “summary sculptures” that represent the data of anentire month. In addition or in complement, old sculptures could be recycled. An increasingnumber of projects (e.g., Filabot8, FilaMaker9, Filastruder10) develop technologies to recycleand reuse 3D prints created with PLA. Adidas®, for example, is working on a concept to3D print shoes consisting of recycled ocean plastic [adidas AG, 2015]. Another possibilityis the usage of biodegradable PLA filament. Finally, following the vision by Gershenfeld[2012] we might overcome this problem in the future, as “Trash is a concept that appliesonly to materials that don’t contain enough information to be reusable.”
8.5.5 Reflection and Self-Expression
Activity Sculptures are a promising medium for fostering reflection on physical activity, asthey make the activity data visible and tangible. Schön [1983] describes that reflective prac-tices are composed of reflection-in-action and reflection-on-action. Reflection-in-action isrelated to thinking ahead of the action, critically experiencing and adjusting to the activity as
8 http://www.filabot.com/ (accessed 2015-12-15)9 http://filamaker.eu/ (accessed 2015-12-15)10http://www.filastruder.com/ (accessed 2015-12-15)
174

Discussion
it unfolds. We observed this precise phenomenon as participants anticipated the sculpturesbefore the runs, thought about them while running, and sometimes adjusted their runningto get a specific shape. Reflection-on-action is much more related to the appraisal of theaction after it has occurred, which was observed as participants compared their pieces anddiscussed them with others. Furthermore, we believe that our physicalizations allow a moreabstract and enjoyable reflection on ones’ physical activities than through detailed activitydata composed of precise numbers and histories. We do not propose that this type of repre-sentations should replace traditional digital visualization techniques but to complement therange of tools available for representing personal activity data.
Based on participants’ statements and our observation it seems of minor importance thatthe sculptures or single pieces support a comparison in a competitive way. None of theparticipants who chose the figure were bothered by the circumstance that it was hard tocompare these sculptures with each other. For most participants it was more important tosee their progress and performance improvements or the general influence of a run on thesculpture’s shape.
Out of our four sculpture types, the necklace sculpture received the best ratings and was theonly sculpture type which fulfilled participants’ expectations regarding self-expression andthe comparison with others. The good ratings for self-expression can be explained by thefact, that it was the only sculpture type which can be worn on the body and therefore easilybe seen and shown to others. These findings lead to our assumption that the most promisingdesign direction for Activity Sculptures is to be geared to accessory design and wearablephysicalizations.
8.5.6 Limitations
Our exploratory field study with 14 participants can only reveal first trends and anecdotalevidence regarding the impact of physicalizations on participants’ behavior. To investigatewhether the sculptures have a motivational effect in the long term, and to preclude the noveltyeffect as a predominant explanation of this success, further longitudinal studies with a largersample are needed. Material costs and the time-consuming printing process play a major rolefor the practicality of physicalizations of running data. Before realizing this concept for along-term study or beyond a study, these aspects in particular need to be taken into account.
The results collected through the online questionnaire revealed that participants preferredreceiving the sculptures only for the achievement of pre-established goals or once per month.While our field study could not take these preferences into account due to the limited studytime, this could be a valuable strategy for a longer term study. It should also be mentionedthat the manual handover might have influenced the participants’ experience, especially atinitial handover. As the participants were in regular contact with the study leader multipletimes they might have felt an obligation to comply and be a “good subject” [Brown et al.,2011], e.g., to run several times during the study.
175
8 Potential for Motivation & Self-Reflection
With our four types of Activity Sculptures we only covered a small sample of the designspace. We only compared artistic physicalizations and had neither pragmatic physical datarepresentations nor digital visualizations as a baseline. It is also important to mention, thatalthough our physicalizations could be touched, none of the participants reported that theyexplored or analyzed the data through the haptic sense. The visual sense seemed to pro-vide enough information, and as we mapped the underlying data only to the visible shapeof the sculptures, a haptic exploration of the data was unnecessary. Future designs couldincorporate physical variables (see also Chapter 10 - Physical Variables), such as compli-ance, weight or coldness, which are only perceivable through the haptic sense. This couldalso upgrade the privacy aspect, as observers not only need to recognize an object as a datarepresentation and understand the data mapping but also have to touch the physicalization.
8.5.7 Conclusion
Our field study showed a high appreciation of our Activity Sculptures and their ability toimprove motivation and self-reflection convinced our participants in particular. We furtheruncovered their potential for a more creative and playful view at ones’ activity, as partici-pants started to change their running routines to impact the shape and aesthetics of the finalsculpture pieces. Participants developed an emotional connectedness to their sculptures andthought about ways to personalize their sculptures.
While bearing in mind the limitations and the exploratory nature of the study, our findingsrevealed additional benefits of physicalizations for representing personal data and motivatefurther research in this area. Besides different types of sculptures, future studies could alsoinvestigate the utilization of other materials. As running is associated with nature, naturalmaterials such as wood instead of plastic could be an interesting alternative.
It is also imaginable to change the concept of one sculpture for each person to one sculptureon which numerous people collaborate. Each person would then contribute to the commonsculpture. In the brainstorming session, for example, one participant had the idea of a Christ-mas crib, in which each family member would be accountable for one figure. At the end of ayear the family could explore together how physically active everybody was during the year.Such group sculptures in various shapes could also be interesting for members of a runningteam, a group of physically active colleagues or people who share an apartment and wantto engage in a more regular physical activity. Another concept would be to focus on largepublic events such as marathons or triathlons, in which participants would receive a personaltrophy tailored to their performance instead of medals.
It could also be exciting to investigate in which ways such sculptures could be integratedinto the routine of professional athletes. Our aesthetical mappings of better performancesto rounder shapes were purely experimental. Those data mappings could be determinedtogether with experienced trainers, such that the different types of training (e.g., endurance,speed or interval) would each lead to meaning- and beautiful sculptures.
176
Discussion
Finally, we only focused on a specific type of personal data: five variables which representrunning activity. An extension to other physical activities is conceivable as well. Examplesare cycling, hiking or daily routines. Furthermore, the underlying data does not have to belimited to activity data. People are tracking nowadays their sleep quality [Hao et al., 2013]and eating habits [Cordeiro et al., 2015], but also their music listening [Baur et al., 2012] orbeverage consumption [Maurer et al., 2013]. Even the progress of completion of to-do listsor Ph.D. thesis writing could be encoded physically and thereby promote an efficient andtimely completion in a playful and unobtrusive way.
177

8 Potential for Motivation & Self-Reflection
178

IIIREFLECTING ON THE
DESIGN OFPHYSICAL VISUALIZATIONS


Chapter9Materialized Self
The design and evaluation of the Activity Sculptures project (Chapter 8 - Potential for Mo-tivation & Self-Reflection) revealed the various engagement opportunities at disposal withphysicalizations for representing personal activity data. Our findings revealed the need fordesign strategies for such physicalizations of personal activity data and a structured viewon which personal feelings as well as social dynamics such data representations can evoke.Independent from our project, Khot et al. [2014] developed and studied a similar systemcalled SweatAtoms. During an intensive collocated collaboration for three months with Ro-hit Ashok Khot, we laid the foundation for a conceptual framework called Materialized Self.The framework is based on the insights gained from studying those two systems, supple-mented with the knowledge from the literature and our own experiences in designing thesesystems.
This chapter describes the Materialized Self framework and its two lenses: “production lens”and “consumption lens” (see Figure 9.1). These two lenses highlight the shared agency indefining the design and the use of personal physicalizations in an everyday context. Eachlens has a set of design properties grouped in three nested layers. The “production lens”describes the areas that the designer prescribes in the creation process of the physicalizationand consists of the layers function, form, and fabrication. The “consumption lens” focuseson the range of qualities and effects evoked by the personal physicalizations during its useand consists of the layers identity, meaning, and ecology. Therefore, the framework canbe used as a design tool for physicalization by selection and adaptation of the framework’sproperties but also as an analytic tool for describing final designs regarding the selectedproperties. We believe that the framework guides interaction designers working in the fieldof personal informatics to harness the interactive capabilities afforded by digital fabricationand physicalizations for personal data.
Personal contribution statement: The content of this chapter is based on an intensive collocated collaborationfor three months with Rohit Ashok Khot. See Disclaimer for a detailed overview.

9 Materialized Self
FUN
CTI
ON ID
ENTITY
CO
N-
SU
MP
TIONP
RO
-D
UC
TIO
N
ECO
LOG
Y
MEA
NIN
G
FAB
RIC
ATIO
N
FOR
M
Figure 9.1: Diagrammatic overview of the “Materialized Self” framework consisting of theproduction lens and consumption lens and their according layers.
9.1 Motivation & Background
A review of existing literature in HCI to support physical activity suggests that most oftena digital medium is used to represent personal activity data. Non-virtual, i.e., material, rep-resentations have not been explored much, possibly because creating physicalizations wastechnically challenging, which recently has changed thanks to digital fabrication technolo-gies (see Chapter 3 - Digital Fabrication). The Activity Sculptures system (see Chapter 8 -Potential for Motivation & Self-Reflection) and the SweatAtoms system by Khot et al. [2014]were the first approaches in exploring and investigating in which ways activity data can berepresented through physical artifacts. Table 9.1 shows a brief comparison of both systems.The results of both studies led to the assumption that physicalizations can have additionalqualities compared to their digital counterparts. Therefore, we believe, there is a need toprovide researcher and designer with guidelines of ways in which such physicalizations ofpersonal activity data can be designed but also what kind of dynamics and qualities thesecan evoke for the people receiving them.
By physical activity data, we refer to biofeedback (e.g., heart rate) and data about bodilymovements that occur during physical activity. This construction process involves a “phys-ical – digital – physical” mode of interaction in which physical energy is first invested togenerate digital data such as heart rate, which is then converted back again into a physicalform to make a re-entry into the physical world. As a result, the data, which was previouslyaccessible only through a digital screen, becomes tangible.
182

Motivation & Background
Table 9.1: Comparisons of the SweatAtoms and Activity Sculptures systems.
Sweat Atoms Activity Sculptures
Sensed physical activity data
Tracking
Number of representations
Received representations per participant
Method of delivery
Choice of color
Study method
Number of participants
Number of participants
Heart rate Running data (distance, duration, average speed, burned calories, elevation gain)
Heart rate monitor Mobile tracking application
Five (Graph, Flower, Dice, Ring, and Frog)
Four (Necklace, Figure, Jar, and Lamp)
Five One
3D-printing at home Personal handover or via letter
User defined White
Field study in participants’ home
Field study
Seven Fourteen
Two weeks Three weeks
In addition to our own experiences in designing and evaluating physicalizations, we groundour interest in material representations and their opportunities in the literature on materialculture studies [Miller, 1987, 2008, 2010; Woodward, 2007] as well as in HCI and TUI [Kirkand Sellen, 2010; van den Hoven, 2004; Golsteijn et al., 2012; Petrelli et al., 2008], whichsignify the human fascination towards collecting and making objects. Sennett [2008] refersto humans as “homo faber: manufacturer and collector of objects” and as a “creature whoimbues sentiment in external artifacts.” Miller [2008] argues that people like to expressthemselves with material representations that embody their lives, personalities, emotionsand achievements. For example, the results of one’s crafts and awards are often displayedon fridge doors, walls and shelves. Photographs of trips and events are often printed, framedand displayed despite the fact that they could just as well be seen on a screen. Such anarrangement of material representations that spatially represent the identity of an individualis called “autotopography” [González, 1995]. This autotopography can serve as a memorylandscape to the owner, triggering reminiscence at a later point of time [van den Hoven,2004].
Despite the benefits that material representations may provide, we only have a limited under-standing of how to design such material representations for physical activity. Laser cuttersand 3D printers simplify the fabrication of physicalizations and Gershenfeld [2007] envi-sions that 3D printers will soon be found in every home. As a result, design and HCI re-searchers are now considering the role of digital fabrication in HCI (see Section 3.2 - DigitalFabrication in HCI)). But there is still a limited understanding of the benefits and uses ofpersonal digitally fabricated artifacts. Additionally, we identified a growing interest within
183

9 Materialized Self
the HCI community of exploring the potential of material representations of personal data(e.g., Nissen et al. [2014]; Nissen and Bowers [2015]; Lee et al. [2015]). We, therefore, con-sider it a timely endeavor to investigate the significance of digital fabrication for supportingphysical activity.
The structure of the framework was made during an intensive exchange of our experiencesand findings discovered through the design and evaluation of the two systems. We also en-gaged in informal discussions with colleagues for feedback and iterations of the framework.Inspired by techniques such as open coding [Seidel and Recker, 2009] and affinity diagramswe further extracted the key terms and results and recorded them on index cards. By sortingthe cards into groups, we narrowed down the framework regarding the key concepts. Theform-driven materiality framework by Jung and Stolterman [2012] was also influential ingrounding our understanding of materiality and framing of the main components.
9.2 The “Materialized Self” Framework
We propose the “Materialized Self” framework as a descriptive design framework that takesa cross-sectional view on the design of physicalizations for personal activity data. The de-signer of the physicalizations and the people, who are receiving and using them, have ashared agency in defining the design and the use of the material artifacts in an everydaycontext. We frame this regarding two lenses: “production lens” and “consumption lens”.The “production lens” helps in shaping the physical appearance of the physicalization bydescribing aspects of the physical form and the fabrication process. The “consumption lens”is crucial in understanding the intrinsic cognitive relation and value of the representation asdriven by the people’s data and properties. Table 9.2 gives an overview of the entire frame-work in tabular form consisting of the two lenses and their according layers and properties.
Each lens allows examining a set of design properties that are grouped in three nested lay-ers, in decreasing order of priority from the center. These design properties help in under-standing, analyzing and contrasting the qualities expressed in the design and the use of thephysicalization. Furthermore, the grouping of these properties into layers was done basedon commonalities and level of importance we observed among the properties. As a result,the layer closest to the center has more importance than the other layers (see Figure 9.1).
9.3 Production Lens
The “production lens” has in total nine properties that are grouped in three layers: function,form, and fabrication. We put the function layer in the center as it describes the essentialproperties while designing physicalizations for personal activity data. The other two layersform and fabrication are outer layers which conceptually follow the function layer. It is
184

Production Lens
Table 9.2: Tabular overview of the “Materialized Self” framework.
Production LensLayer Property Description
Function Purpose Designer’s intended purpose for the physicalization, e.g., to enable richer reflection on physical activity.
Qualities Qualities of the physicalization that go beyond the intended purpose, e.g., sustainability.
Use Values of the physicalization concerning its use, e.g., decorative or practical object.
Form Data Aspects regarding the used data, e.g., data type.Physical Variables Physical properties that can be used for representing data,
e.g., size or texture.Data Mapping Process of mapping abstract data to a material form,
e.g., mapping size to amount of physical activity.
Fabrication Process General process of fabrication, e.g., manual or automatic.Timing Duration and point in time the physicalization is
fabricated, e.g., during a physical activity.Frequency How often the physicalization is fabricated,
e.g., every month or on special occasions.
Consumption LensLayer Property Description
Identity Self Extent to which the physicalization is in line with the user’s identity, thoughts and likes.
Authenticity Identification and mapping of distinctive characteristics of individuals in material form.
Autonomy Abilities to affect the design of the physicalization byexperimenting with physical activity routines.
Meaning Information Perceived understanding of the physicalization and the mapped data.
Motivation Incentives provided by the physicalization for doing physical activity.
Utility Other imagined uses of the material artifact by people.
Ecology Context How situations and environment affect people‘s interactions with the physicalization.
Pairing Association of the physicalization with other material artifacts and people.
Attachment Level of engagement with the physicalization in terms of time.
185

9 Materialized Self
noteworthy that the fabrication can limit the form (by technological restrictions), which inturn can also affect the desired function.
9.3.1 Function
The function layer is at the core of the “production lens” and points to the central goals ofthe physicalization. In general, the function layer has the closest relationship to the “con-sumption lens” as the choice of its properties can have a substantial impact on how peoplecan and should use the physicalization. First, there is the intended purpose, which was inour projects to encourage physical activity through positive reinforcement. Apart from mo-tivating to start or maintain a physically active lifestyle, other purposes could be changinga specific behavior or keeping track of the progress. As those purposes can be fulfilled invarious ways, they should be adapted to the diversity of individuals [Prochaska and Velicer,1997].
Besides supporting the primary objective, e.g., being physical active, physicalizations canfulfill additional qualities. A classical example which is also valid for digital representa-tions is aesthetic aspects. In our projects, we also observed desired qualities that go beyonddigital representations, e.g., sustainability. Similar to these qualities, which focus more onfeelings and emotions, physicalizations can also fulfill a practical use in everyday life. Suchadditional qualities and practical uses prescribed in the design could help in further support-ing the main purpose and overall engagement with the physicalization. In our projects, thephysicalizations were used, for example, as a decorative object or fashionable jewelry.
9.3.2 Form
The form layer involves considerations regarding the aesthetic and appealing possibilitiesof the physicalization. The data property describes aspects of the data such as its type andthe used tracking method. Physical activity can be measured, for example, as physiologi-cal output (e.g., heart rate data) or movement based data (e.g., distance). It should also beconsidered how and when the data is tracked, how reliable it might be and if additional prepa-ration is needed to gain a form that is suitable for a data representation, e.g., normalizing thedata.
Another aspect is how the data will be encoded physically, i.e., which physical variablescan be used (see also Chapter 10 - Physical Variables). Volume and shape were the primaryphysical variables used in both projects because those are controllable through the techniqueof 3D printing. Finally, the data mapping process has to be defined, i.e., in which waysthe digital data will be encoded into the object and material properties. We used a rathersimple data mapping for most of the physicalizations. In the majority, an increase of physicalactivity resulted in a bigger artifact. We believe, it would be worth investigating in whichways people perceive and understand other physical variables such as texture or compliance.
186
Consumption Lens
9.3.3 Fabrication
Fabrication, as the outer layer of the “production lens” is concerned with all aspects regard-ing the actual physical creation of the artifact. Swaminathan et al. [2014a] have argued thatassembly and manufacturing features are also important for physicalizations along with thedesign goals (function) and the aesthetic features (form). The process property describesthe fabrication procedure of the physicalizations. One aspect is whether the consumer isinvolved in the process, e.g., by printing the artifacts at home, or not. The technique choice(e.g., 3D printing or laser cutting) and their limitations and capabilities do also define whatkind of physicalizations can be produced. Both projects used rather simple shaped and smallobjects for 3D printing to keep time and costs on a reasonable level.
The timing and frequency properties play key roles in determining the duration of the fabri-cation process and answering questions such as how often and when the material represen-tation is fabricated and received. The 3D printing or laser cutting could take place duringthe physical activity in which people could directly influence the material representation bychanging the course of the activity. If the fabrication happens after the physical activitydesigners should consider the duration between these two actions, to enable short-term orlong-term reflection [Li et al., 2010]. The frequency of how often the physicalization willbe fabricated can vary from a specific period to a specific occasion. The frequency of fabri-cation is also related to the frequency of data collection [Li et al., 2010]. Additionally, thedesigner can also consider the amount of data and its mapping to the artifact. For example,some users may appreciate the data for a particular event or one-week long training session,encapsulated into one design rather than dividing and fabricating data physicalizations everyday.
9.4 Consumption Lens
After explaining the “production lens,” we turn our attention to the “consumption lens” andits three layers identity, meaning, and ecology. The “consumption lens” focuses on theexperiences and emotions of the people that are using the personal physicalizations. Thislens is constructive, as it draws our attention to how people reframe their understandingof physicalizations through their use. Social science research designates these qualities asmateriality and defines them in terms of the relationship between representations, people andthe environment [Miller, 1987].
9.4.1 Identity
The identity layer looks at reflective qualities of physicalizations, synonymous with theindividual’s personality, values, and ethics. The self property refers to a representationabout oneself, in parallel to the representations people have of other individuals [Swann
187
9 Materialized Self
and Bosson, 2010]. James [1890] differs between the “material self”, which describes inwhich ways an individual appears to the external world through his body, likes and person-alities and the “spiritual self”, which reflects individual’s ideas, goals, and state of mind.Physicalizations can blend both these aspects nicely by making its visual appearance in linewith the individual’s preferences (material self) and by being reflective of the individual’sstate of mind through the capture of personal data (spiritual self).
The property of authenticity refers to the degree to which the created physicalization is trueto the individual and the captured physical activity data. Personal physicalizations can bea unique and authentic type of self-representation which cannot be purchased. It is alsoimportant that the data mapping is understandable, and the underlying data is reliable. Theproperty of autonomy refers to the levels of individuality and creativity at which people caninnovate the design of their physicalization through the use of their body and movements. Inour studies participants followed a playful exploration of the systems and their possibilitiesas well as their limitations. We believe that physicalizations can leverage the opportunities tobe self-expressive and autonomous. Instead of just mimicking predefined exercises, personalphysicalizations could inspire to be more physically active and also to be creative within theexercise, which could lead to an engaging experience.
9.4.2 Meaning
The meaning layer describes the emotional responses such as intrigue, disappointment, andsatisfaction that people may experience when they encounter a physicalization of their data.The information property defines the internal mapping between the data and the physical-ization, as understood by the user. A lot of this understanding strongly depends on the formand the function of the representation as discussed earlier in the “production lens.” However,individuals have different expectations and interpretation abilities when it comes to under-standing a design, in our case a physicalization. Furthermore, these abilities are influencedby the context and might change over time and with use.
The motivation property describes the range of incentives that physicalizations provide andwhether they can fulfill the goal to encourage people being physical active. The rewardstructure of physicalizations should be tailored to suit an individual’s needs and aspirations.Moreover, for sustaining people’s interest and motivation, providing a variety of rewards andchanging rewards over time might be a valuable option. The utility property puts forwardnew and imagined uses of the physicalizations that go beyond predefined uses as sketched bythe designer. Our studies showed, that participants were creative in discovering new valuesfor their physicalizations, such as using them as a candleholder, or tried to personalize them,e.g., by coloring them.
188
Discussion
9.4.3 Ecology
The ecology layer is concerned with the nature in which the artifacts are embedded in every-day life and in which ways the surrounding reacts to them. The context property identifiesthe ways in which individual’s interactions with the physicalizations are influenced by thesituations and the environment they are used. This is based on the concept of “the socialself” by James [1890] and the theory of self-representation by Goffman [1959]. Unlike dig-ital visualizations that sit mainly on a digital screen, physicalizations have to fit the contextin which they will be placed and have to satisfy and cater to existing aesthetic details andsurroundings. Another aspect is the level of abstraction, as an individual might desire moreabstraction and privacy in a public setting while she might appreciate a more detailed andclear representation in a private setting.
The pairing property describes the extent to which a physicalization pairs with other artifactsas well as the people who would interact with it. Although the physicalizations from bothstudies worked as standalone artifacts, participants reported the request to receive artifactsthat can easily pair with things that they already have. The artifacts also played the roleof a social catalyst, inviting conversations around their aesthetics and use. The attachmentproperty points to the continuance of an individual’s relationship with the physicalization.While material artifacts might have a longer life and value in people’s life than its digitalcounterparts, they are also much harder to create and destroy. As a result, designers shouldfocus on how these representations could be able to sustain a user’s interest over a longerperiod or instead use temporal or disposable materials.
9.5 Discussion
By differing between the “production lens” and “consumption lens,” we want to highlight theimportance of the user’s role and agency in designing material representations of personaldata. In our experience, the users seem to develop a greater sense of value and emotionalconnectedness to personal physicalizations than to their digital counterparts. In particular,as they are influencing the shape of real-world physical objects through their personal data.Therefore, the “production lens” targets the aspects that are controllable through design andfabrication while the “consumption lens” highlights the evolution of understanding and emo-tional bond to the physicalizations during its use.
The framework should be useful for designers as a design tool to ideate and design physi-calizations of physical activity data. Additionally, designers can also utilize the frameworkto analyze existing designs and identify whether the intended purposes of the system aremet. Through the set of design properties, the framework provides an overarching collec-tion of possible design opportunities. We hope to broaden the often limited view whendesigning technology that supports physical activity. The emphasis on encouraging betterperformances and achieving efficiency goals often covers other ways of engaging humans
189

9 Materialized Self
with physical activity. We hope that the framework will be helpful in striking the balancebetween what is possible (“production lens”) and what is desirable (“consumption lens”)regarding physicalizations encoding activity data. Furthermore, we believe, it can serve asinspiration for the design and the potential of physicalizations in general, especially for rep-resenting personal data.
190

Chapter10Physical Variables
Visual variables are a set of characteristic properties that can be applied to data to repre-sent information visually. By understanding the variables’ internal properties (what theycan represent) and their external properties (how they are perceived) designers can choosethem accordingly. To our knowledge no counterpart for physicalizations does exist. Inspiredby the tradition of InfoVis, we investigate potential variables associated to physicalizations.These variables describe the ways in which physicalizations can encode data, e.g., by mod-ifying the size, shape, roughness or weight of physical artifacts. In contrast to the visualvariables targeting tradition data representations, we focus on variables that are not only vi-sual but also aimed at additional senses such as tactile or kinesthetic. The goal is to lay afoundation for a discussion of how physical variables can be defined and in which ways theycan be used to represent data.
In this chapter, we propose a preliminary definition of variables for modular data physical-ization. Modular data physicalizations are physical representations of data made out of mul-tiple pieces (modules), with each module corresponding to a data point. Such modular dataphysicalizations were used, for example, in Section 6.2 - Modular Physical Bar Charts andfor the Activity Sculptures project in Chapter 8 - Potential for Motivation & Self-Reflection.In total we outline 14 dimensions grouped into four categories, but focus on the nine di-mensions that are novel and related to data physicalizations: geometric variables (position,orientation, global shape, exact shape), color variables (hue, saturation, luminance, optics),tactile variables (roughness, lay, temperature, compliance), and kinesthetic variables (slip-periness, weight). We describe each dimension, give examples in which ways they can beused to encode data and address their performance for interpretation tasks. We concludewith a short discussion on how the variables relate to personal or social perception, such asemotional and associative aspects.
Personal contribution statement: The content of this chapter is the result of an collaboration with AurélienTabard. See Disclaimer for a detailed overview.
10 Physical Variables
10.1 Motivation & Background
To create effective physicalizations that are explorable and readable by people, it is essential,that an observer can decode an object and its underlying data. Similar to the visual encodingprocess for visualizations, a structured way of representing data in a physical form, withits physical properties is necessary. This can guide researchers, designers, and artists increating physicalizations, e.g., by specifying what type of data can be conveyed with specificphysical properties and which role they play in the perception and interpretation of data. Inthe following, we will briefly discuss related topics from the InfoVis area, in particular,visual perception as well as visual marks and variables, but also delimit the scope of ourproposition.
10.1.1 Visual Perception
Human perception and especially the visual sense play a major role in the area of visualiza-tion. However, the exact process from receiving sensory inputs and their way to perceptionand cognition is still unclear. In psychology, two theories of perception are controversydiscussed. The bottom-up theory by Gibson [1962] on the one hand suggests that sensoryinformation is analyzed in one direction. The top-down theory by Gregory [1970] on theother hand refers to the use of contextual information and argues that prior knowledge andpast experiences are crucial in perception.
Healey and Enns [2012] give a thorough overview regarding research on attention and vi-sual perception in their paper “Attention and Visual Memory in Visualization and ComputerGraphics”. They highlight that each fixation of our eyes influences our mental experience butthat our current mental states are also guiding saccades in a top-down mode to new locationsfor more information.
One of the most important discoveries in the early studies regarding visual perception was“the identification of a limited set of visual features that are detected very rapidly by low-level, fast-acting visual processes” [Healey and Enns, 2012]. Although attention is alsoimportant at this early stage of vision, these properties are called pre-attentive. Typicalexamples of visual features that are pre-attentive are size, color (hue) and curvature. Typicaltasks to identify such features are the detection of a target element or a texture boundarybetween two groups of elements. If these tasks can be performed in less than 200-250milliseconds, they are considered as pre-attentive. It is worth mentioning that a target only“pops out” if its visual property is unique, when a target is encoded by two or more visualproperties, it often cannot be found pre-attentively.
Some theories have been proposed to explain in which ways pre-attentive processing occurswithin the visual system, such as the feature integration theory (e.g., Treisman and Gelade[1980]; Treisman [1985]) or the texton theory (e.g., Julesz [1971]). In addition pre-attentivevision there exist also related phenomena such as post-attentive vision or change blindness,
192

Motivation & Background
which are relevant for the design of effective visualizations (see Healey and Enns [2012] formore details).
10.1.2 Visual Marks & Variables
To appreciate the aim to investigate and identify physical variables it is necessary to under-stand the value of its counterpart in visualization: visual marks and visual variables. A lot ofstudies explored in which ways data can be encoded visually and how efficiently the variousvisual variables are.
Bertin [1983] developed the semiology of graphics as a practical approach for his data graph-ics. He defined marks as the basic unit to present something visually and identified threetypes of marks:
• Points are dimensionless locations in space that need properties such as size or colorto be visually perceived.
• Lines represent information with a certain length, but with no width and need proper-ties such as size or color to be visually perceived.
• Areas have a length and width and operate in a 2D space.
Those three types were later expanded with two additional marks (e.g., Card and Mackinlay[1997]; Carpendale [2003]):
• Surfaces are similar to areas but in a 3D space with no thickness.
• Volumes have length, width, and depth, while their size is their meaning.
Bertin further identified variables that can be used to vary these marks to encode data ona two-dimensional space: x and y position on a two-dimensional plane, size, value (grayscale saturation/color value), texture, color (color hue), orientation, and shape. This listof variables was later expanded and renamed by MacEachren [1995] resulting in a cata-log of 12 variables in total: location, size, crispness, resolution, transparency, color value,color hue, color saturation, texture, orientation, arrangement, and shape. Please note thatMacEachren indicates Morrison [1974] as the first author who suggested arrangement andcolor saturation as additional visual variables.
Based on this work a great amount of studies has been conducted to extend and validate thevariables (e.g., Cleveland and McGill [1984, 1985, 1986, 1987]; Mackinlay [1986]) and isstill an important topic in current research (e.g., Chung et al. [2015, 2016]; Skau and Kosara[2016]). Among other things those studies led to a ranking of perceptual tasks which isuseful for designers of visualizations by supporting the data mapping process.
193

10 Physical Variables
10.1.3 Disclaimer
Bertin [1983] and Carpendale [2003] prefaced their work with a disclaimer to delimit thescope of their concepts. Bertin considered the creation of data graphics on a white paper inwhich the data is visible at a glance. He also assumed standard book reading conditions, suchas constant light and a reading distance of an arm’s length. Carpendale mentioned the lowresolution of digital displays compared to prints on paper, at the time, but also the technicalprocess in software and hardware, which will change what can be displayed visually. Tonarrow down our initial classification of physical variables we also implied various externalpreconditions. Therefore, this should not be considered as a definitive description but as apractical first pass and a working classification.
We only focus on modular physicalizations, which presents several benefits. Modules can beparametrized and produced quickly with digital fabrication technologies, e.g., laser cuttingor 3D printing. They can also be assembled in a systematic manner and enable physicaliza-tions to be “updated” as new data points come in. We follow the argumentation by Bertin[1983] and only consider the design and perception of modular physicalizations in “normalconditions” by “normal sighted” people. We only included “substantial surfaces”, i.e., ig-noring liquids and gases. We also follow the argumentation by Jansen et al. [2015], thatphysicalizations are perceived “actively,” through exploratory actions involving hand, arm,and body movements, based on an “intermodal” approach, which allows cohesive and re-alistic multi-sensory experiences. This active exploration also means, that the condition byBertin that the data representation is perceivable at a glance is not valid for physicalizations,as the active exploration takes time and occurs sequentially.
To limit the list of potential variables we focused on material properties and characteristicsthat are most studied in the field of haptic perception (see Section 2.2 - Haptic Perception),are part of active research in HCI (e.g., changing weight [Niiyama et al., 2013] or stiffness[Follmer et al., 2012; Ou et al., 2013]) and can be fabricated with state-of-the-art digital fab-rication technologies. Finally, we did not take into account and did not intend to characterizethe role actuation could play in the design and perception of physicalizations. We, therefore,skipped properties that seemed less appropriate for encoding data at the moment, based ontechnological complexity and their limitations. We believe that technical advancements,especially regarding digital fabrication technologies and shape displays, will simplify thecreation of physicalizations as well as change and extend what can be represented physicallyand perceived haptically, in the near future.
10.2 Description of Variables
This section describes each dimension by specifying in which ways the material and objectproperties can be used to encode data. In total, we have identified 14 dimensions but willfocus on the nine dimensions that are novel and most relevant for data physicalizations. We
194

Description of Variables
classified them into the following four categories: geometric variables (position, orienta-tion, global shape, exact shape), color variables (hue, saturation, luminance, optics), tactilevariables (roughness, lay, temperature, compliance), and kinesthetic variables (slipperiness,weight).
Throughout the presentation of the variables, we use the beads from the Activity Sculptureproject (see Chapter 8 - Potential for Motivation & Self-Reflection as well as Figure 8.5) as anexample to illustrate the ways in which the dimensions could be applied. If we could find realexamples of physicalizations using those variables, they are also listed. We furthermore givea brief description of how each variable could be realized using current digital fabricationtechnologies.
10.2.1 Geometric Variables
Geometric variables consist of four dimensions, but we will focus on global shape and exactshape as position and orientation are intensively discussed in previous articles about visualvariables. The global shape can be described as the bounding box of a module and the exactshape as the contour of it. Please note that roughness and lay could be classified as a micro-level of the exact shape, but we categorized them as tactile variables since they are directlyrelated to touch.
Position and Orientation
The characteristics of the position and orientation of single physical modules are similar totheir descriptions for visualizations. As physicalizations are part of the physical world theirpositions can be defined in three dimensions, as positional variables x, y, and z. However,physicalizations are also subject to gravity which hinders the free positioning of modules in3D space. While it is out of scope for this article, the kinesthetic location, i.e., the locationof the hand in relation to the body and the reachability of a module, i.e., in an arm’s lengthdistance, are aspects worth considering for physicalizations.
For the beads of the Activity Sculptures project, the position (on one axis) of multiple beads(or modules) on a chain can be used to encode the order of the runs. If the shape of a beadis not homogeneous or the weight distribution is controlled, the orientation could also beused for data encoding. We believe that for modular physicalizations both, position andorientation, are rather managed through manual control than through fabrication techniques.
Global Shape
With global shape, we mean the global dimension of a module. This variable is similar tothe visual variable size, which is based on the length, area or volume of a mark. It can alsobe described as a coarse bounding box for a module, to highlight the focus on the globalappearance and to exclude finer details of a shape.
195
10 Physical Variables
The global shape of the bead would be the size or volume of a surrounding sphere andtherefore, ignoring the exact shape, defined by the width and height segments. The globalshape can be perceived with the visual and haptic sense. We believe the visual sense is morecrucial as with the haptic sense objects are not perceived by its global shape but rather by itslocal features, such as the exact shape or the roughness. Furthermore, the module has to beof a size, which can be perceived with the haptic sense.
Similar to digital visualizations the global shape or size is one the most used variables forphysicalizations. A classical example could be the size of the bars forming a physical barchart. The global shape depends on the scale of the digital model and the physical artifactsand can be limited by external conditions, e.g., the build volume of a 3D printer.
Exact Shape
The exact shape of a module is its actual contour or its outline. We also see the surfacefinish term waviness as part of the exact shape. It is related to the visual variable shape. Ingeneral, shape is already a complex phenomenon in InfoVis [Munzner, 2014] and there is noprecise definition, e.g., if shape is based on simple geometry or also includes icons, symbolsor compound glyphs. Furthermore, there is an extensive list of visual attributes associatedwith shape, such as closure, hole, curvature, or line ending (see Brath [2010, 2014] for amore detailed description). We focus our initial categorization of exact shape as a physicalvariable on well-known 3D modeling techniques, such as constructive solid geometry andpolygon mesh to describe and define the exact shape of a module.
The exact shape of the bead is defined by the number of width and height segments. It isworth mentioning that the global and exact shape are influenced by each other and mightconstrain each other. When the number of width and height segments changes, for example,also the volume of the bead changes. They also can be equal, e.g., if the module is a prim-itive, such as a sphere or a cuboid. The exact shape can be perceived with both, the visualand haptic sense. While the visual sense is primarily used to perceive the exact shape, thehaptic sense can support the perception of small shape changes.
We believe that the exact shape might play a more important role for physicalizations toencode data than the visual variable of shape does for digital visualizations. Similar to theglobal shape, the exact shape can be limited by external conditions. To represent delicatechanges in the physical shape, the fabrication machine needs a respectively level of precision.
10.2.2 Color Variables
The category of color variables includes four dimensions, three of them (hue, saturation,luminance) are already discussed in previous works. We add to these three well-known colordimensions the new dimension optics, which in particular focuses on physical properties ofmaterials and objects, that influence the behavior of visible light.
196

Description of Variables
Hue, Saturation and LuminanceThe color variables hue, saturation, and luminance have the same characteristics for phys-icalizations than they do for digital visualizations. Therefore, we refer for more details onthese variables to other sources, e.g., Bertin [1983], Carpendale [2003] or Munzner [2014].Please note, that multi-color 3D printing within one object is challenging, however, physicalartifacts can be colored manually afterward.
OpticsUnder the umbrella term optics, we refer to the branch of physics which involves the be-havior and properties of visible light. For digital visualizations, the environment and theincoming light influences the entire screen and therefore the entire visualizations in a similarway. For modular physicalizations, in contrast, single modules can be influenced based onthe material properties independent from the other modules in various ways.
Most relevant for physicalizations are the transparency and reflection properties, which arealso related to absorption, scattering, and refraction. They are only perceivable through thevisual sense. We combine these properties for clarity reasons and as they rank similarly inthe performance characteristics. Please note, that transparency was also supposed as a visualvariable for maps by MacEachren [1995].
It could be imaginable, that each bead has a different level of transparency or reflection. Itis worth mentioning that these properties are highly dependent on the environment and theposition of the observer. Without any light source, reflections are not perceivable. It canalso be necessary for the observer to move his head or the entire body to perceive and noticepossible differences in these properties.
One project that experimented with the transparency of physical materials is x.pose by Chenand Oliveira [2014] (see Figure 10.1-right). The wearable data sculpture makes the collec-tion of the wearer’s location data visible in real-time through reactive displays that changein opacity to reveal the wearer’s skin. Static physicalizations can be built, for example, withvariations of acrylic glass, which have different levels of transparency.
10.2.3 Tactile Variables
We classified roughness, lay, coldness and compliance as the most relevant dimensions inthe category of tactile variables. For all four dimensions, the cutaneous cues seem to be themost important ones. Waviness is also used to describe a surface texture, but we alreadyincluded as part of the exact shape dimension.
RoughnessRoughness is a component of surface texture and received most attention within haptics re-search. When a surface has irregularities or ridges, it can be described as rough. The rough-
197

10 Physical Variables
Figure 10.1: Examples for the use of transparency and temperature as physical variables: Left:Perpetual (Tropical) SUNSHINE installation by fabric.ch [2005] (Image © Milo Keller). Right:x.pose by Chen and Oliveira [2014] (Image © Roy Rochlin).
ness variable is related to the visual variable texture or grain (see Bertin [1983]; Carpendale[2003]). We will focus here on the physical surface, i.e., textures that are also perceivablewith the haptic sense and not only visual.
It could be possible to provide each segment of the bead or each bead itself with a differentlevel of roughness according to the underlying data. While the roughness of a surface insome cases can be perceived visually, e.g., different grits of sandpaper, the haptic senseis necessary and allows a more delicate perception. A 3D printer with a correspondingresolution can print surfaces with different forms and levels of roughness, and a laser cuttercan engrave suitable patterns.
Lay
In manufacturing lay indicates the direction of the predominant surface pattern. Therefore,it has relations to the visual variables of orientation and texture, but also our proposed di-mensions of roughness and exact shape. While there can be surfaces with no predominantpattern direction, we base our considerations on patterns, that are applied in manufacturing[De Garmo et al., 2011].
The lay can have one linear direction, which, for example, can be parallel or perpendicularto the observer. It can also have two crossed directions or more, which is called multi-directional and be can be pictured as scattered. To our knowledge, there are no studiesspecifying how many different directions are perceivable by humans and under which cir-cumstances. A lay can also be approximately circular or radial, relative to a center point onthe surface. Similar to the application of roughness different lay patterns can be used forvarious segments of a bead or for each bead. Also, lay patterns could be perceived visually,
198

Description of Variables
but the haptic sense allows a more detailed perception. Similar to roughness, lay can berealized easily through digital fabrication machines with a suitable precision.
Coldness
As actuated physicalizations are out of scope for this proposition, it is important to mention,that we focus on the coldness of an object at room temperature. This is distinct from theobject’s temperature, which is independent of the material. Different materials have differentcooling curves, which define the perceived coldness, which is related to the heat extractionfrom the fingers when touching a material.
As an example, each bead could have a different cooling curve. It is noteworthy that in ad-dition the thermal properties of the material and its geometry, which both can be controlled,the perceived coldness is also influenced by the manner of touching and the contact resis-tance between finger and object. While coldness can only be perceived with the haptic sense,the visual sense could influence the expectancy based on previous experiences, e.g., metal isperceived colder than plastic.
The only example to our knowledge that uses temperature for data encoding is the Perpetual(Tropical) SUNSHINE installation by fabric.ch [2005] (see Figure 10.1-left). This physi-calization represents weather data through the heat and light emitted from infrared bulbs.However, it uses the actuated object’s temperature without direct touch and not coldness. Asthe cooling curve depends on the material and its geometry, it can be realized through 3Dprinted artifacts with different materials and designs.
Compliance
Compliance can be expressed physically in various ways and has different characteristics,e.g., malleability, elasticity or plasticity. We focus on the perceived compliance which canbe described as softness or hardness of a material. While compliance perception does notdepend on kinesthetic force information, it can be influenced by it.
In the example of the beads, each bead or even specific parts of it could have altered levelsof compliance. While the visual sense could influence the expectancy, e.g., metal is harderthan plastic, varying versions of plastic can have different levels of compliance, which canbe perceived only with the haptic sense. Stiffness also depends on the object’s dimension asa thick, narrow object can be compressed more than a thin, wide object made of the samematerial, using the same force.
Compliance can be realized, for example, through the use of different 3D printing materialfor each module. The infill density and pattern (e.g., linear, concentric, honeycomb) of thephysical artifact can also define the level of compliance. Specific laser cut pattern, e.g., the“living hinge”, allow some form of bending of rigid pieces as well.
199

10 Physical Variables
10.2.4 Kinesthetic Variables
Into the category of kinesthetic variables, we classified the dimensions slipperiness andweight. Both depend on the combination of cutaneous and kinesthetic cues for an accurateperception.
SlipperinessAs slipperiness, we describe the friction that occurs when one surface, e.g., a finger, slidesover another. Therefore, the movement is essential for an accurate perception of slipperiness.While slipperiness and roughness are quite distinct from a physical point of view, there maybe some overlap perceptually and linguistically [Tiest, 2010].
As an example, each bead could have a different level of slipperiness. While people canfeel clear differences in resistance for various materials when they move their finger over thesurface, there is little research about the relationship between the perceived intensity and thephysical intensity. Slipperiness can only be perceived by the haptic sense and depends on hu-midity, but also force and speed of movement. For controlling several levels of slipperiness,it seems most suitable to use a raw material with accordant characteristics for fabrication.
WeightThe perceived weight depends on a wide variety of mechanisms, such as prior experience,volume or thermal properties. The weight of an object can only be perceived through thehaptic sense, by lifting or at least moving it. The object, therefore, should be of a size thatcan be grasped by humans.
In the example of the beads, each bead could have a different weight. It is important tomention that the weight of a module can only be perceived when it is detached. In contrastto dimensions such as roughness or slipperiness the perception of weight will change whenmultiple modules are combined, i.e., the object will get heavier. The weight of a module canbe manipulated by the choice of material and its infill density.
10.3 Performance of Variables
To discuss the previously introduced dimensions in a structured way regarding their perfor-mance, we use four characteristics of visual variables supposed by Bertin [1983]:
• Selective: A variable is selective if a change in this variable alone makes it easier toselect that changed module from all other modules.
• Associative: A variable is associative if modules can be grouped according to thisvariable alone as they differ in other variables (following Carpendale [2003], whileBertin [1983] uses the term differently).
200

Performance of Variables
• Quantitative: A variable is quantitative if the relationship between two modules canbe obtainable as a numerical difference of this variable.
• Order: A variable is ordered if changes in this variable support an ordered reading ofthe modules.
We believe these characteristics are not only applicable for visual variables but also forphysical variables. They help to understand in which ways a change in a specific variable canaffect the perception and therefore, the performance of a particular task (see also Carpendale[2003]). We will rank the performance as “good” (X), “possible” (∼), and “impossible” (X).
In contrast to visual variables, physical variables can hardly be judged based on pre-attentiveprocessing, as haptic sensation processes linear. Therefore, the ranking relies on the possi-bility that these tasks can be accomplished in a reasonable time frame of a few secondsand on study results, whether changes in this variable are perceivable and predictable. Thedifferentiation between “possible” and “good” is based on the afore mentioned studies andthe experiences collected during the design and evaluation of physicalizations. They, there-fore, serve as an initial suggestion and basis for discussion whether and in which ways thesedimensions can be used for data encoding.
In the following sections, we summarize the discussion for each category while focusing onour proposed dimensions and only highlighting specific aspects if the characteristics of thedimensions vary. A detailed overview can be found in Table 10.1.
10.3.1 Geometric Variables
Global shape and exact shape are both selective and associative, as a module that haschanged this characteristic alone will become distinct and selectable from the other mod-ules, but can also be used to create groups. However, for the exact shape, it depends on thenumber of modules displayed, the actual shapes and how strongly the various shapes differ.
Changes of the global shape, e.g., the volume, are difficult for comparative numerical inter-pretations. However, if the change is based on a repetition of the same module, a numericalreading could be possible and therefore can be quantitative. Variations in the exact shapecan hardly provide any numerical interpretation, therefore, it is not quantitative. While itcould be argued, that the number of height and width segments of the bead from the ActivitySculpture project could be used for a numerical difference, we do not believe that this issuitable.
While changes in the global shape are orderable, this is not the case for exact shape. Ashape does in general not support an ordered reading, or the criteria would be of personalpreference. However, the bead from the Activity Sculpture project changes its shape fromangular (few segments) to smooth and round (more segments). Such modifications in theexact shape could be assumed as orderable, but it has to be learned.
201
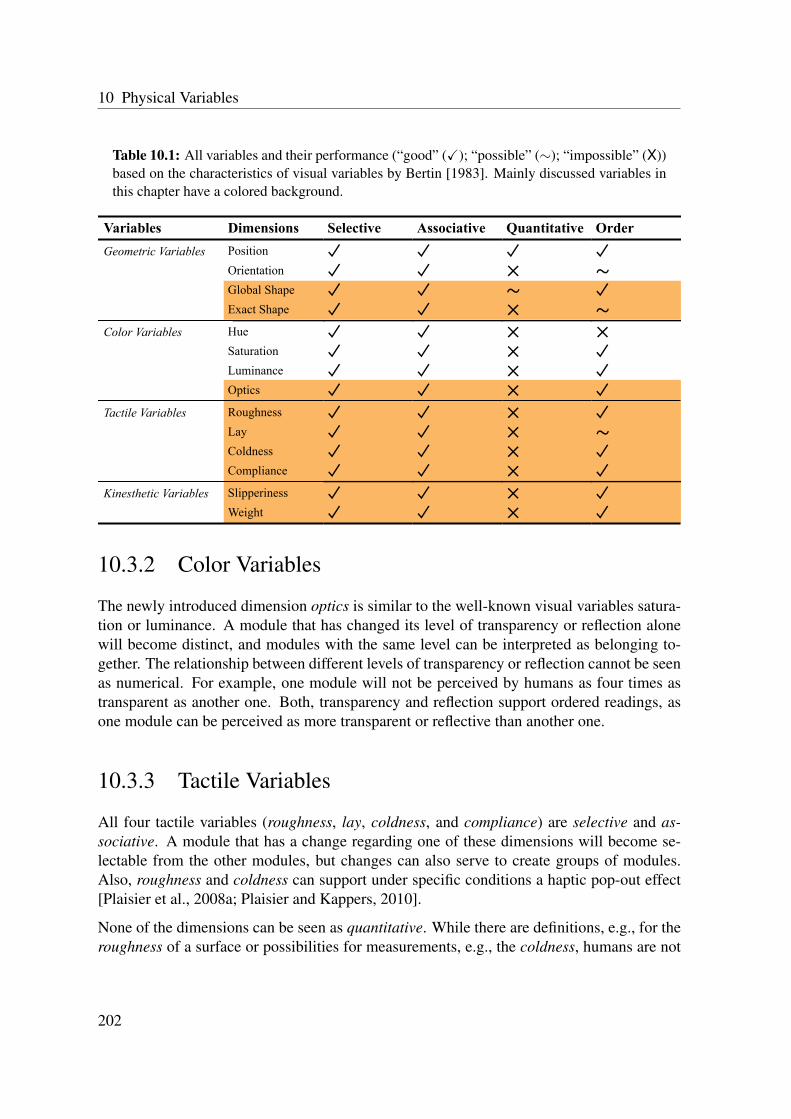
10 Physical Variables
Table 10.1: All variables and their performance (“good” (X); “possible” (∼); “impossible” (X))based on the characteristics of visual variables by Bertin [1983]. Mainly discussed variables inthis chapter have a colored background.
Variables SelectiveDimensions Associative Quantitative OrderGeometric Variables Position
Orientation × ~Global Shape ~Exact Shape × ~
Color Variables Hue × ×Saturation ×Luminance ×Optics ×
Tactile Variables Roughness ×Lay × ~Coldness ×Compliance ×
Kinesthetic Variables Slipperiness ×Weight ×
10.3.2 Color Variables
The newly introduced dimension optics is similar to the well-known visual variables satura-tion or luminance. A module that has changed its level of transparency or reflection alonewill become distinct, and modules with the same level can be interpreted as belonging to-gether. The relationship between different levels of transparency or reflection cannot be seenas numerical. For example, one module will not be perceived by humans as four times astransparent as another one. Both, transparency and reflection support ordered readings, asone module can be perceived as more transparent or reflective than another one.
10.3.3 Tactile Variables
All four tactile variables (roughness, lay, coldness, and compliance) are selective and as-sociative. A module that has a change regarding one of these dimensions will become se-lectable from the other modules, but changes can also serve to create groups of modules.Also, roughness and coldness can support under specific conditions a haptic pop-out effect[Plaisier et al., 2008a; Plaisier and Kappers, 2010].
None of the dimensions can be seen as quantitative. While there are definitions, e.g., for theroughness of a surface or possibilities for measurements, e.g., the coldness, humans are not
202

Discussion
able to perceive those characteristics accurate enough, that one object can be perceived astwo times as warm or rough as another one.
All dimensions beside lay are orderable. One module can be rougher, colder or harder thananother one. Lay is similar to the visual variable orientation. There can be a notion of orderif the changes are progressive, e.g., only the direction of the pattern changes clockwise.However, it has to be learned, and an order between a circular and a linear pattern is notpossible.
10.3.4 Kinesthetic Variables
Both dimensions, slipperiness, and weight, are selective and associative, as a module witha different weight or level of friction will become distinct and selectable. Modules with thesame weight or level of friction can be interpreted as belonging together.
Although the slipperiness and weight can be expressed physically, both dimensions are notquantitative, as a module can hardly be perceived by humans as twice as heavy as anotherone. Both can be ordered, as a module can be heavier or can have a higher level of frictionthan another one.
10.4 Discussion
Our list of physical variables and the initial rating regarding their performance for specificcharacteristics show a general trend: most dimensions are as selective, associative, and or-derable but not as quantitative. The only exceptions are exact shape and lay, which both areorderable only under specific conditions as well as global shape, which might be quantita-tive under particular circumstances.
Please note that we excluded the characteristic of length, which describes how many distinctvalues a dimension supports, and therefore how much information it can convey. We arguethat the number of changes for all dimensions is theoretically infinite but practically limited.Too delicate changes, for example, might neither be perceivable through human senses norbe producible with digital fabrication technologies. A couple of studies showed strong rela-tionships between the human perception and the physical expression for various dimensions.Further studies need to investigate additional aspects, such as the just-noticeable differencesthat a dimension can convey [Jansen et al., 2015] or the total number of changes that aresuitable for encoding and perceiving data within one physicalization.
Apart from such studies that focus on the general perception, it is also important to ob-serve in which ways the perception is influenced by the context of a data representation. Itis not clear how the ability to haptically perceive aspects of a physical artifact transformsinto interpreting and understanding abstract data. Little is known about the process of how
203
10 Physical Variables
people haptically explore the characteristics of a physicalization, about the time it takesand in which ways people cope with memory challenges associated with sequential explo-ration. Furthermore, subjective aspects incorporating the observer of a physicalization needto be considered. We believe that hedonistic sensations (e.g., comfortable/uncomfortable,elegant/ugly), when a surface is touched and existing personal experiences with specific ma-terials, might have a substantial influence on the perception and therefore, the interpretationof data. Similarly, it needs to be investigated in which ways the combination of multiplephysical variables affects the perception, e.g., whether specific dimensions overrule othersunder particular circumstances.
Finally, as previously mentioned, we see our classification as a first pass, which has to beextended, elaborated, and questioned by other researchers and their studies. We excludedphysical variables that need actuation such as air resistance, pressure, vibration or temper-ature. We also focused on variables for haptic perception and left out other senses such assound, taste and smell. We believe that technological advancements will further simplifyand broaden the creation of physicalizations and the incorporation of additional variables. Itis worth mentioning that we hardly found any examples of physicalizations using physicalvariables that require haptic exploration. Although dimensions such as roughness or compli-ance can already be controlled with a 3D printer, most installations and artifacts used onlythe visible shape for data encoding. We hope our preliminary suggestion of promising phys-ical variables encourages and motivates researchers and designers to experiment with newways of encoding data and to build data representations, which have to be explored with allour senses. We believe it highlights the necessity for additional studies, e.g., regarding theperformance or interplay and serves as an elaborate starting point for further discussions onphysical variables.
204

Chapter11Summary and Future Work
This thesis explored the potential of encoding data in a physical form. After reviewingrelated literature in the fields of haptic perception and digital fabrication, we presented sixinitial prototypes of physicalizations, ranging from static to digitally augmented to dynamicones.
In more detail, we explored three promising directions, in which physical data representa-tions can provide benefits for exploring data: perception & memorability, communication &collaboration, and motivation & self-reflection. Among other things, our findings revealedthat the higher distinctiveness of 3D physical bar charts affects information recall in a posi-tive way compared to their digital counterparts and 2D variations. Similarly, physicalizationsof personal activity data can provide additional benefits such as strengthening emotionalconnections and allowing a more playful look at ones’ physical activity. However, we alsoobserved skepticism and discovered the importance of a sophisticated and effective design,to be on par with traditional digital visualizations, especially in more work-related settings.
Based on our practical experience in building and evaluating a number of physicalizations weproposed a conceptual framework for the design of personal physicalizations and an initialcategorization of physical variables. Both schemes can guide and inspire artists, researchers,and designers in creating and studying data physicalizations for various purposes.
In this last chapter, the contributions of this thesis will be discussed in a more concrete wayand in light of the designed and evaluated prototypes. Furthermore, the limitations of ourapproach will be reported, and the ways in which the presented work can be continued andits results can stimulate further research in the field of data physicalization.
11 Summary and Future Work
11.1 Contribution Summary
This thesis started with two broad research questions investigating the ways physicalizationscan and should be designed and in which ways they affect the perception and experience ofdata exploration. During the course of designing and evaluating various data physicalizationsthree promising directions and related research questions emerged. With this thesis, we gainfirst insights to tackling these issues and thereby offer two overall contributions to the fieldof data physicalization.
11.1.1 Design of Physicalizations
In the course of this thesis, eleven different prototypes of physicalizations were built andevaluated in several studies in the lab as well as “in the wild” for multiple weeks. This offersa broad first glimpse into the design space of physicalizations. As data physicalization isa new area of research, we believe this to be a suitable approach to gaining first practicalinsights to the design and evaluation as well as potential benefits of data physicalization.
Based on our experiences with these prototypes and literature reviews, we furthermore pro-posed a conceptual framework for personal physicalizations and a working classification forphysical variables. The conceptual framework “Materialized Self” targets researchers anddesigners interested in exploring physical data representations for personal data. By takinga look at such physicalizations from a “production lens”, and a “consumption lens” we il-lustrate on the one hand various design criteria which researchers should consider and canchoose from. On the other hand, we highlight the role of the individuals receiving and usingthe personal physicalizations. Compared to their digital counterparts, physical visualiza-tions seem to generate a stronger emotional connectedness and arouse new aspects such aspractical purposes or their embedding in everyday life.
The initial classification of physical variables complements our undertaking of providingresearchers and designers with guidance and inspiration for uncovering alternative strategiesfor physically representing data as well as positioning their ideas and prototypes. Basedon our experience in creating physicalizations and a literature review in the area of hapticperception, we identified 14 dimensions of material properties grouped into four categoriesof physical variables. In particular, we discussed those nine dimensions that differed fromvisual variables or were unique for physicalizations. Our performance rating of the variablesshowed, that most of them are selective, associative and oderable. As none of them allow acomparative numerical interpretation, they cannot be classified as quantitative.
While all these findings are not conclusive, we believe that they cover broad insights into apossible design space for data physicalization and can guide future projects, prototypes andstudies in this field.
206

Contribution Summary
11.1.2 Potential for Physicalizations
By designing, building and evaluating various types of physicalizations, we identified threepromising areas, which were investigated in more detail: perception & memorability, com-munication & collaboration, and motivation & self-reflection.
Two lab studies related to the perception of physicalizations and the information recall ofthe perceived data revealed that physicalizations can have advantages to digital or “flat”data representations. The results of the first study led to the conclusion that participants whoperceived abstract data with a physical bar chart forgot less information about maximum andminimum values within two weeks, while no difference in the recall performance betweenthe digital and physical modality could be seen for numeric values and general facts. Incontrast to the first study, in which we compared the digital and physical modality, the secondstudy focused on the dimensionality of physicalizations. While the findings of the first studyregarding extreme values could be confirmed, the second study pointed to the aspect, thatnot physicality alone but the higher distinctiveness of the 3D modality affects the perceptionand recall of abstract data in a positive way.
Two explorative studies, one “in the wild” study at a scientific conference, the other in thelab, explored in which ways physicalizations might affect the communication about and thecollaboration with data. Both studies stressed the high expectations people might have wheninteracting with physicalizations and emphasized a sophisticated design, especially whencompared to interactive digital visualizations. The lab study further illustrated the challengesin conducting a comparative study, in which only the presentation modality is manipulated.The studies also revealed a polarization, as people either strongly enjoyed working withphysical data representations and appreciated their tangible features or rejected them as toysand inconvenient compared to their digital counterparts. However, physicalizations mightsupport participants with an aversion against new technologies in engaging in collaborationby diminishing the technical barrier.
A three-week field study explored the potential of physicalizations for representing personalactivity data and supporting aspects such as motivation and self-reflection. Participants ac-knowledged the general idea of encoding their running data into 3D printed sculptures andrated their potential for motivation and self-reflection as high. Questionnaires and semi-structured interviews also showed, that participants developed an emotional connection totheir sculptures, as they had a sculpture piece in mind during a run, thought about person-alizing them and also embedded the final sculptures in their everyday life. Furthermore, weobserved that participants, driven by curiosity and playfulness, changed their running habitsand tried to control the shape of the pieces they would receive as well as test the limits of oursystem. This initial study demonstrated that physicalizations can have additional benefitscompared to digital visualization, particularly for representing personal data.
207

11 Summary and Future Work
11.2 Limitations and Future Work
As previously stated, data physicalization is a new area of research and an unexplored do-main which left us with many options regarding the design and evaluation of physical datarepresentation. Our choices were carefully made by taking into account related work fromthe fields of InfoVis and TUI but also based on a “research through design” approach, inwhich the iterative process of building and evaluating a number of prototypes helped in re-jecting unfavorable ideas early and pursuing more promising directions. Nonetheless, thisdoes not save our work from certain limitations that we would like to use to light the way forfuture research in the domain of physicalizations.
11.2.1 Perceiving Physicalizations
Our studies regarding information recall showed that it can be beneficial if data is perceivedwith a physicalization. Similarly, the Activity Sculptures project revealed additional benefitswhen personal activity data is encoded physically. As most of our prototypes represented thedata through size and shape, participants primarily perceived our physicalizations with theirvisual sense. As motivated by our classification of physical variables many additional waysto encode data in a physical form, which require haptic exploration, are possible. An openquestion is in which ways the data mapping of such physical variables should be explainedto an observer. Additionally, it is unanswered in which ways individuals could be instructedto discover data variables haptically, which are not recognizable visually. More studies haveto be conducted to investigate in which ways individuals perceive and experience the explo-ration of abstract data through physical variables such as roughness or compliance. Further-more little is known about the process of perceiving abstract data haptically, understandingthe data and finally generating knowledge. Similarly, more fundamental research regardingthe perception of physical variables has to be done to understand in which ways physicalvariables can be encoded effectively, following, for example, the approach by Jansen andHornbæk [2016]. The findings of such experiments will answer whether and how physical-izations are applicable for scenarios beyond artistic installations, particularly for the field ofpragmatic physicalizations.
11.2.2 Interacting with Physicalizations
Interacting with physicalizations is strongly related to the ways they are perceived. Apartfrom the modular bar chart study, in which participants assembled a physicalization, theprototypes were simply manually held by participants and not haptically explored. Whilethis can be explained by our chosen physical variables, it opens up the questions in whichways interactions with a physicalization can and should be designed to be effective andunderstood. While Taher et al. [2015] started to explore interaction techniques for dynamic
208

Limitations and Future Work
physical bar charts, the ways in which physical interactions, such as grasping and lifting,might affect the data exploration process are unclear. Furthermore, it should be investigatedin which ways “affordances” [Gibson, 1986; Norman, 2002] that physicalizations mightimplicate can be designed and incorporated to imply that an action is possible, similarly todigital visualizations [Boy et al., 2016]. Apart from studies with artificial exploration tasks,integrating the interaction and analysis of a physicalization into practical problem-solvingtasks seems eligible. Thereby the comprehension of the underlying data is required andmeaningful for the participants, and the physicalizations take a back seat as a tool, that mightsupport a task or not. Additionally, the question arises in which ways physical and digitalvisualizations can be combined and complement each other. An example would be choosingto perceive data through a specific modality and switching in between tasks, depending onthe comfort, speed or facility the data can be explored in the individual modality (e.g., Wunet al. [2016]).
11.2.3 Collaborating with Physicalizations
While our study regarding collaboration with physicalizations revealed interesting insights,it also highlighted the challenges in conducting a comparative study and allowing a faircomparison between the physical and the digital modality. One problem seems to be thatdue to technological challenges and a much shorter research history physicalizations arenot comparable to state-of-the-art digital visualizations. Especially regarding interactivity,degrading digital visualizations to attain similar conditions for both modalities is often nec-essary. For participants with experience in using current digital visualizations, this might beirritating. Further studies could consider focusing less on competition between the physicaland digital modality and more on how physicalizations can complement the digital ones.One compelling example is to support a collaboration process between able sighted and vi-sually impaired or blind. The highly evolved haptic perception of the visually impaired andblind, may lead to an advantage at feeling even delicate changes in various physical variablesand therefore, reading and decoding a higher range of the underlying data. Investigating inwhich ways these different audiences can collaborate using digital and physical visualiza-tions seems worth further research.
11.2.4 Communicating with Physicalizations
In our hands-on-evaluation at a scientific conference, we explored if paper-based physical-izations can engage individuals in exploring the data, which might also lead to spendingmore time with it or sharing and discussing the content with others. While our study couldnot confirm this assumption, we still believe that physicalizations have a great potential inpresenting and communicating data. Excellent examples are the talks by Hans Rosling (seeSection 1.1 - Motivation), in which physical objects are not only used to explain the data butalso serve as tools to emphasize the message and tell a gripping story. In the field of InfoVis,
209

11 Summary and Future Work
a growing number of researchers propose to attach a higher importance to the aspect of pre-senting data and recommend integrating elements from storytelling to portray information ina more engaging manner and with greater efficiency (e.g., Gershon and Page [2001]; Kosaraand Mackinlay [2013]). Researchers, who explore and study data representations for com-munication, especially in scenarios such as public space or museums, should consider andinvestigate the potential of physicalizations for expressing data in an engaging way.
11.2.5 Personal Physicalizations
Our Activity Sculptures project identified additional benefits of encoding personal datathrough a physical from compared to a digital visualization. We investigated the specificcase of representing physical activity data in a three-week field study. While we couldfind promising trends, longer studies with more participants should be conducted to allowstronger conclusions on whether and how physicalizations can increase motivation or sup-port behavioral change. Possible explanations such as the “novelty effect” or being a “goodsubject” should be resolved, e.g., by conducting comparative studies in which novel waysof digital visualizations are examined against physical ones. While the emotional commit-ment participants evolved seems to be a key factor regarding physicalizations further studieshave to confirm these findings and also examine if this is true for other types of data. Wehope that physicalizations will become a part of the ongoing research in the InfoVis field onpersonal visualization and personal visual analytics (e.g., Huang et al. [2015]; Thudt et al.[2016]) and future work will demonstrate the ways in which the strengths of both worlds willcomplement each other in exploiting the enormous potential of personal data “to understandourselves better and make positive changes in our lives” [Huang et al., 2015].
11.2.6 Dynamic Physicalizations
Although we created two projects experimenting in which ways physicalizations can beaugmented digitally and two early prototypes of dynamic physicalizations, our main projectsfocused on static physicalizations, made out of wood or plastic, created with a 3D printer ora laser cutter. Similarly, most prototypes were inspired by traditional types of visualizationssuch as bar or line charts. While we argue that our approach was effective in studyingfundamental aspects of the perception of physicalizations, we also observed the importanceand ubiquity of interactive data representations. Our modular physicalizations supported arearranging of data points and “updates” as new data was introduced. To be comparable tothe functionality of current digital visualizations, which allow operations such as automaticfiltering or ordering as well as switching the type of the representation or the data mapping,much more research is needed. Jansen et al. [2015] specified the importance and challengesin designing and implementing effective dynamic physicalizations but also stressed that theyare essential in supporting “not only reusability across datasets, but also a wider range ofanalytical and communication tasks.”
210

Closing Remarks
11.2.7 Multi-Sensory Data Representations
This thesis and its projects focused primarily on static physicalizations that could be per-ceived through the visual and haptic sense. However, auditory, gustatory, and olfactorysenses can also provide information about objects and therefore encode data. Variousprojects explored ways in which food can act as a medium for data expression and in whichways edible and palatable materials can convey data stories (e.g., Zorina et al. [2012]; Ste-faner [2014]; Khot et al. [2015b]; Wang et al. [2016]). Similarly, in the field of “sonification”,a number of researchers investigated in which ways acoustic variables such as pitch, volumeor timbre can be used to represent data (e.g., Krygier [1994]; Hermann and Ritter [1999];Franklin and Roberts [2003]; Zhao et al. [2008]). One question which emerges is whetherdata representations which provide a multi-sensory data exploration, including the visualsense, should be called physicalizations or if other terms should be found. Future researchshould also consider in which ways the usage and combination of various variables and mul-tiple senses affect the experience of data exploration and whether such data representationsare only beneficial for aesthetic and artistic purposes, or can also aid pragmatic data analysis[Hogan and Hornecker, 2016].
11.3 Closing Remarks
This thesis offered a first glimpse into the design of physicalizations, explored their poten-tial and revealed some first benefits of representing data in a physical form. As the researchfield of data physicalization is at its beginning and the design space is still largely unex-plored, I believe the projects and findings presented in this thesis will inspire designers andresearchers to continue the investigation of the ways in which physicalizations can enrichour experiences of exploring and analyzing data.
I think that the digital and the physical world will continue to merge and that data, which iscaptured and saved digitally, will shift beyond the digital flat screen and will be representedby interactive objects and surfaces, which are non-flat, non-solid and shape-changing. Welive in a data-driven world and all this data can eventually help to understand the worldand ourselves better. But to make the right choices and positive changes, people first haveto become engaged in exploring and thinking about the data in a meaningful way. Thiswill hopefully result in understanding the data and gaining new knowledge. I believe thatphysicalizations and multi-sensory data representations have the power to transform plainnumbers and statistics into fascinating stories and allow us to relive the data with all oursenses.
211

11 Summary and Future Work
212
BIBLIOGRAPHY
J. M. Ackerman, C. C. Nocera, and J. A. Bargh. 2010. Incidental Haptic Sensations InfluenceSocial Judgments and Decisions. Science 328, 5986 (2010), 1712–1715.DOI: http://dx.doi.org/10.1126/science.1189993
adidas AG. 2015. adidas and Parley for the Oceans stop the in-dustry’s waiting game. Press release. (2015). http://www.adidas-group.com/en/media/news-archive/press-releases/2015/adidas-and-parley-oceans-stop-industrys-waiting-game/ - Accessed:2015-12-15.
H. Agrawal, R. Jain, P. Kumar, and P. Yammiyavar. 2014. FabCode: Visual ProgrammingEnvironment for Digital Fabrication. In Proceedings of the 2014 Conference on Interac-tion Design and Children (IDC ’14). ACM, New York, NY, USA, 353–356.DOI: http://dx.doi.org/10.1145/2593968.2610490
S. Al-Megren and R. A. Ruddle. 2016. Comparing Tangible and Multi-touch Interaction forInteractive Data Visualization Tasks. In Proceedings of the TEI ’16: Tenth InternationalConference on Tangible, Embedded, and Embodied Interaction (TEI ’16). ACM, NewYork, NY, USA, 279–286.DOI: http://dx.doi.org/10.1145/2839462.2839464
G. Alemanno, P. Cignoni, N. Pietroni, F. Ponchio, and R. Scopigno. 2014. InterlockingPieces for Printing Tangible Cultural Heritage Replicas. In Eurographics Workshop onGraphics and Cultural Heritage, Reinhard Klein and Pedro Santos (Eds.). The Eurograph-ics Association.DOI: http://dx.doi.org/10.2312/gch.20141312
J. Alexander, Y. Jansen, K. Hornbæk, J. Kildal, and A. Karnik. 2015. Exploring the Chal-lenges of Making Data Physical. In Proceedings of the 33rd Annual ACM ConferenceExtended Abstracts on Human Factors in Computing Systems (CHI EA ’15). ACM, NewYork, NY, USA, 2417–2420.DOI: http://dx.doi.org/10.1145/2702613.2702659
C. Anderson. 2010. In the Next Industrial Revolution, Atoms are the New Bits. Wired 2(2010), 58–67.
213
BIBLIOGRAPHY
H. A. Anema, V. W. Wolswijk, C. Ruis, and H. C. Dijkerman. 2008. Grasping Weber’sillusion: The effect of receptor density differences on grasping and matching. Cognitiveneuropsychology 25, 7-8 (2008), 951–967.
S. Anselm and J. Corbin. 1998. Basics of qualitative research: Techniques and proceduresfor developing grounded theory. SAGE Publications (1998).
A. N. Antle, M. Droumeva, and D. Ha. 2009. Hands on What?: Comparing Children’sMouse-based and Tangible-based Interaction. In Proceedings of the 8th International Con-ference on Interaction Design and Children (IDC ’09). ACM, New York, NY, USA, 80–88.DOI: http://dx.doi.org/10.1145/1551788.1551803
H. Aoki, T. Suzuki, and A. Kamei. 1985a. Study on Correspondence between Sensory andPhysical Properties of materials (I). Bulletin of JSSD 53 (1985), 37–42.
H. Aoki, T. Suzuki, and Y. Matsuoka. 1985b. Study on Correspondence between Sensoryand Physical Properties of materials (II)–Comparison of natural and substitute leather forhand. Bulletin of JSSD 53 (1985), 43–48.
K. Apro. 2008. Secrets of 5-Axis Machining (1st ed.). Industrial Press, Inc., New York, NY,USA.
F. G. Ashby and W. T. Maddox. 1990. Integrating information from separable psychologicaldimensions. Journal of Experimental Psychology: Human Perception and Performance16, 3 (1990), 598–612.DOI: http://dx.doi.org/10.1037/0096-1523.16.3.598
A. Aslan. 2013. Physical Visualizations with Acrylic Glass: An Exploration. Bachelor’sthesis. LMU Munich.
ASTM. 2012. F2792. 2012 Standard terminology for additive manufacturing technologies.West Conshohocken, PA: ASTM International. (2012).DOI: http://dx.doi.org/10.1520/F2792-12
B. Bach, E. Pietriga, and J.-D. Fekete. 2014. Visualizing Dynamic Networks with MatrixCubes. In Proceedings of the SIGCHI Conference on Human Factors in Computing Sys-tems (CHI ’14). ACM, New York, NY, USA, 877–886.DOI: http://dx.doi.org/10.1145/2556288.2557010
L. Bacon, N. Keim, M. Van Loan, M. Derricote, B. Gale, A. Kazaks, and J. Stern. 2002.Evaluating a ’non-diet’ wellness intervention for improvement of metabolic fitness, psy-chological well-being and eating and activity behaviors. International Journal of Obesity26, 6 (2002), 854–865.DOI: http://dx.doi.org/10.1038/sj.ijo.0802012
214
BIBLIOGRAPHY
R. M. Baecker. 1994. Readings in GroupWare and Computer-Supported Cooperative Work:Assisting Human-Human Collaboration (1st ed.). Morgan Kaufmann Publishers Inc., SanFrancisco, CA, USA.
M. Bailey. 2005. Layered Manufacturing for Scientific Visualization. Commun. ACM 48, 6(2005), 42–48.DOI: http://dx.doi.org/10.1145/1064830.1064857
F. Bara, E. Gentaz, P. Colé, and L. Sprenger-Charolles. 2004. The visuo-haptic and hapticexploration of letters increases the kindergarten-children’s understanding of the alphabeticprinciple. Cognitive Development 19, 3 (2004), 433–449.DOI: http://dx.doi.org/10.1016/j.cogdev.2004.05.003
J. Bardzell, S. Bardzell, and A. Toombs. 2014. "Now That’s Definitely a Proper Hack":Self-made Tools in Hackerspaces. In Proceedings of the SIGCHI Conference on HumanFactors in Computing Systems (CHI ’14). ACM, New York, NY, USA, 473–476.DOI: http://dx.doi.org/10.1145/2556288.2557221
S. Barrass. 2011. Phsyical Sonification Dataforms. In The 17th International Conference onAuditory Display (ICAD-2011). International Community for Auditory Display.DOI: http://dx.doi.org/10.13140/2.1.2316.9286
S. Barrass. 2012. Digital Fabrication of Acoustic Sonifications. Journal of the Audio Engi-neering Society 60, 9 (2012), 709–715.
S. Bateman, R. L. Mandryk, C. Gutwin, A. Genest, D. McDine, and C. Brooks. 2010. Use-ful Junk?: The Effects of Visual Embellishment on Comprehension and Memorability ofCharts. In Proceedings of the SIGCHI Conference on Human Factors in Computing Sys-tems (CHI ’10). ACM, New York, NY, USA, 2573–2582.DOI: http://dx.doi.org/10.1145/1753326.1753716
D. Baur, J. Büttgen, and A. Butz. 2012. Listening Factors: A Large-scale Principal Com-ponents Analysis of Long-term Music Listening Histories. In Proceedings of the SIGCHIConference on Human Factors in Computing Systems (CHI ’12). ACM, New York, NY,USA, 1273–1276.DOI: http://dx.doi.org/10.1145/2207676.2208581
E. Beaudette, L. Sanchez-Botero, S. Ashdown, J. Hinestroza, and H. Park. 2014. InnovativeExplorations in Apparel Design to Create Engineered Outfits with Lighting Technologies.In Proceedings of the 2014 ACM International Symposium on Wearable Computers: Ad-junct Program (ISWC ’14 Adjunct). ACM, New York, NY, USA, 15–19.DOI: http://dx.doi.org/10.1145/2641248.2641279
C. Bell and J. Gemmell. 2009. Total Recall: How the E-memory Revolution Will ChangeEverything. Dutton.
215
BIBLIOGRAPHY
J. Bertin. 1983. Semiology of graphics: diagrams, networks, maps. University of Wisconsinpress.
E. Bertini, H. Lam, and A. Perer (Eds.). 2010. BELIV ’10: Proceedings of the 3rd BE-LIV’10 Workshop: BEyond Time and Errors: Novel evaLuation Methods for InformationVisualization. ACM, New York, NY, USA.
E. Bertini, A. Perer, H. Lam, P. Isenberg, and T. Isenberg (Eds.). 2012. BELIV ’12: Proceed-ings of the 2012 BELIV Workshop: Beyond Time and Errors - Novel Evaluation Methodsfor Visualization. ACM, New York, NY, USA.
E. Bertini, A. Perer, C. Plaisant, and G. Santucci (Eds.). 2008. BELIV ’08: Proceedings ofthe 2008 Workshop on BEyond Time and Errors: Novel evaLuation Methods for Informa-tion Visualization. ACM, New York, NY, USA.
E. Bertini, C. Plaisant, and G. Santucci (Eds.). 2006. BELIV ’06: Proceedings of the 2006AVI Workshop on BEyond Time and Errors: Novel Evaluation Methods for InformationVisualization. ACM, New York, NY, USA.
W. Bevan and J. A. Steger. 1971. Free recall and abstractness of stimuli. Science 172, 3983(1971), 597–599.DOI: http://dx.doi.org/10.1126/science.172.3983.597
D. Beyer, S. Gurevich, S. Mueller, H.-T. Chen, and P. Baudisch. 2015. Platener: Low-Fidelity Fabrication of 3D Objects by Substituting 3D Print with Laser-Cut Plates. InProceedings of the 33rd Annual ACM Conference on Human Factors in Computing Sys-tems (CHI ’15). ACM, New York, NY, USA, 1799–1806.DOI: http://dx.doi.org/10.1145/2702123.2702225
P. Beynon-Davies. 2009. Significant Threads: The Nature of Data. International Journal ofInformation Management 29, 3 (2009), 170–188.DOI: http://dx.doi.org/10.1016/j.ijinfomgt.2008.12.003
A. J. Blasio and A. M. Bisantz. 2002. A comparison of the effects of data–ink ratio on per-formance with dynamic displays in a monitoring task. International Journal of IndustrialErgonomics 30, 2 (2002), 89 – 101.DOI: http://dx.doi.org/10.1016/S0169-8141(02)00074-4
P. Blikstein. 2014. Reempowering Powerful Ideas: Designers’ Mission in the Age of Ubiq-uitous Technology. In Proceedings of the 2014 Conference on Interaction Design andChildren (IDC ’14). ACM, New York, NY, USA, 1–4.DOI: http://dx.doi.org/10.1145/2593968.2597649
P. Blikstein and D. Krannich. 2013. The Makers’ Movement and FabLabs in Education:Experiences, Technologies, and Research. In Proceedings of the 12th International Con-ference on Interaction Design and Children (IDC ’13). ACM, New York, NY, USA, 613–
216

BIBLIOGRAPHY
616.DOI: http://dx.doi.org/10.1145/2485760.2485884
R. Borgo, A. Abdul-Rahman, F. Mohamed, P. W. Grant, I. Reppa, L. Floridi, and M. Chen.2012. An Empirical Study on Using Visual Embellishments in Visualization. IEEE Trans-actions on Visualization and Computer Graphics 18, 12 (2012), 2759–2768.DOI: http://dx.doi.org/10.1109/TVCG.2012.197
M. A. Borkin, Z. Bylinskii, N. W. Kim, C. M. Bainbridge, C. S. Yeh, D. Borkin, H. Pfister,and A. Oliva. 2016. Beyond Memorability: Visualization Recognition and Recall. IEEETransactions on Visualization and Computer Graphics 22, 1 (2016), 519–528.DOI: http://dx.doi.org/10.1109/TVCG.2015.2467732
M. A. Borkin, A. A. Vo, Z. Bylinskii, P. Isola, S. Sunkavalli, A. Oliva, and H. Pfister. 2013.What makes a visualization memorable? IEEE Transactions on Visualization and Com-puter Graphics 19, 12 (2013), 2306–2315.DOI: http://dx.doi.org/10.1109/TVCG.2013.234
M. Bostock, V. Ogievetsky, and J. Heer. 2011. D3 data-driven documents. IEEE Transac-tions on Visualization and Computer Graphics 17, 12 (2011), 2301–2309.DOI: http://dx.doi.org/10.1109/TVCG.2011.185
J. Boy, L. Eveillard, F. Detienne, and J.-D. Fekete. 2016. Suggested Interactivity: SeekingPerceived Affordances for Information Visualization. IEEE Transactions on Visualizationand Computer Graphics 22, 1 (2016), 639–648.DOI: http://dx.doi.org/10.1109/TVCG.2015.2467201
R. Brath. 2010. Multiple Shape Attributes in Information Visualization: Guidance fromPrior Art and Experiments. 18th International Conference on Information Visualisation(2010), 433–438.DOI: http://dx.doi.org/10.1109/IV.2010.66
R. Brath. 2014. Information Visualisation: Techniques, Usability and Evaluation. Cam-bridge Scholars Publishing, Chapter: The multiple visual attributes of shape, 43–66.
W. C. Brinton. 1939. Graphic presentation. Brinton associates.
B. Brown, S. Reeves, and S. Sherwood. 2011. Into the Wild: Challenges and Opportunitiesfor Field Trial Methods. In Proceedings of the SIGCHI Conference on Human Factors inComputing Systems (CHI ’11). ACM, New York, NY, USA, 1657–1666.DOI: http://dx.doi.org/10.1145/1978942.1979185
C. Brown and A. Hurst. 2012. VizTouch: Automatically Generated Tactile Visualizationsof Coordinate Spaces. In Proceedings of the Sixth International Conference on Tangible,Embedded and Embodied Interaction (TEI ’12). ACM, New York, NY, USA, 131–138.DOI: http://dx.doi.org/10.1145/2148131.2148160
217
BIBLIOGRAPHY
H. Brynjarsdottir, M. Håkansson, J. Pierce, E. Baumer, C. DiSalvo, and P. Sengers. 2012.Sustainably Unpersuaded: How Persuasion Narrows Our Vision of Sustainability. In Pro-ceedings of the SIGCHI Conference on Human Factors in Computing Systems (CHI ’12).ACM, New York, NY, USA, 947–956.DOI: http://dx.doi.org/10.1145/2207676.2208539
L. Buechley and B. M. Hill. 2010. LilyPad in the Wild: How Hardware’s Long Tail isSupporting New Engineering and Design Communities. In Proceedings of the 8th ACMConference on Designing Interactive Systems (DIS ’10). ACM, New York, NY, USA,199–207.DOI: http://dx.doi.org/10.1145/1858171.1858206
E. Buehler, S. Branham, A. Ali, J. J. Chang, M. Hofmann, A. Hurst, and S. K. Kane. 2015.Sharing is Caring: Assistive Technology Designs on Thingiverse. In Proceedings of the33rd Annual ACM Conference on Human Factors in Computing Systems (CHI ’15). ACM,New York, NY, USA, 525–534.DOI: http://dx.doi.org/10.1145/2702123.2702525
E. Buehler, A. Hurst, and M. Hofmann. 2014a. Coming to Grips: 3D Printing for Accessibil-ity. In Proceedings of the 16th International ACM SIGACCESS Conference on Computers& Accessibility (ASSETS ’14). ACM, New York, NY, USA, 291–292.DOI: http://dx.doi.org/10.1145/2661334.2661345
E. Buehler, S. K. Kane, and A. Hurst. 2014b. ABC and 3D: Opportunities and Obstacles to3D Printing in Special Education Environments. In Proceedings of the 16th InternationalACM SIGACCESS Conference on Computers & Accessibility (ASSETS ’14). ACM, NewYork, NY, USA, 107–114.DOI: http://dx.doi.org/10.1145/2661334.2661365
W. Büschel, U. Kister, M. Frisch, and R. Dachselt. 2014. T4 - Transparent and TranslucentTangibles on Tabletops. In Proceedings of the 2014 International Working Conference onAdvanced Visual Interfaces (AVI ’14). ACM, New York, NY, USA, 81–88.DOI: http://dx.doi.org/10.1145/2598153.2598179
S. Cangiano and D. Fornari. 2014. Products As Platforms: A Framework for DesigningOpen Source Interactive Artifacts. In Proceedings of the 2014 Companion Publication onDesigning Interactive Systems (DIS Companion ’14). ACM, New York, NY, USA, 219–222.DOI: http://dx.doi.org/10.1145/2598784.2598805
S. Card and J. Mackinlay. 1997. The structure of the information visualization design space.In Proceedings of IEEE Symposium on Information Visualization. 92–99.DOI: http://dx.doi.org/10.1109/INFVIS.1997.636792
S. K. Card, J. D. Mackinlay, and B. Shneiderman. 1999. Readings in information visualiza-tion: using vision to think. Morgan Kaufmann.
218

BIBLIOGRAPHY
M. S. T. Carpendale. 1999. A Framework for Elastic Presentation Space. Ph.D. Dissertation.Simon Fraser University, Burnaby, BC, Canada, Canada.
M. S. T. Carpendale. 2003. Considering Visual Variables as a Basis for Information Visual-isation. Technical Report. University of Calgary, Calgary, AB.DOI: http://dx.doi.org/1880/45758
S. Cha, M.-H. Lee, and T.-J. Nam. 2016. Gleamy: An Ambient Display Lamp with aTransparency-Controllable Shade. In Proceedings of the TEI ’16: Tenth InternationalConference on Tangible, Embedded, and Embodied Interaction (TEI ’16). ACM, NewYork, NY, USA, 304–307.DOI: http://dx.doi.org/10.1145/2839462.2839501
A. Charpentier. 1891. Analyse experimentale de quelques elements de la sensation de poids.Vol. 3. Archives de Physiologie Normale et Pathologique. 122–135 pages.
A. Cheatle and S. J. Jackson. 2015. Digital Entanglements: Craft, Computation and Col-laboration in Fine Art Furniture Production. In Proceedings of the 18th ACM Conferenceon Computer Supported Cooperative Work & Social Computing (CSCW ’15). ACM, NewYork, NY, USA, 958–968.DOI: http://dx.doi.org/10.1145/2675133.2675291
X. Chen and P. G. C. Oliveira. 2014. x.pose. Website. (2014). https://www.behance.net/gallery/17256769/xpose - Accessed: 2015-12-15.
K. E. Cherry, D. K. Dokey, C. M. Reese, and S. Brigman. 2003. Pictorial Illustrations En-hance Memory for Sentences in Younger and Older Adults. Experimental Aging Research29, 3 (2003), 353–370.DOI: http://dx.doi.org/10.1080/03610730303720 PMID: 12775443.
E. H. Chi. 2000. A Taxonomy of Visualization Techniques Using the Data State Refer-ence Model. In IEEE Symposium on Information Vizualization 2000 (INFOVIS ’00). IEEEComputer Society, Washington, DC, USA, 69–75.
E. H.-H. Chi and J. T. Riedl. 1998. An operator interaction framework for visualizationsystems. In Proceedings of IEEE Symposium on Information Visualization. 63–70.DOI: http://dx.doi.org/10.1109/INFVIS.1998.729560
D. H. Chung, P. A. Legg, M. L. Parry, R. Bown, I. W. Griffiths, R. S. Laramee, and M. Chen.2015. Glyph sorting: Interactive visualization for multi-dimensional data. InformationVisualization 14, 1 (2015), 76–90.DOI: http://dx.doi.org/10.1177/1473871613511959
D. H. S. Chung, D. Archambault, R. Borgo, D. J. Edwards, R. S. Laramee, and M. Chen.2016. How Ordered Is It? On the Perceptual Orderability of Visual Channels. ComputerGraphics Forum 35, 3 (2016), 131–140.DOI: http://dx.doi.org/10.1111/cgf.12889
219

BIBLIOGRAPHY
A. Clark. 1996. Being There: Putting Brain, Body, and World Together Again (1st ed.). MITPress, Cambridge, MA, USA.
A. Clark and D. Chalmers. 1998. The Extended Mind. Analysis 58, 1 (1998), 7–19.DOI: http://dx.doi.org/10.1111/1467-8284.00096
W. S. Cleveland. 1985. The Elements of Graphing Data. Wadsworth Publ. Co., Belmont,CA, USA.
W. S. Cleveland and R. McGill. 1984. Graphical Perception: Theory, Experimentation, andApplication to the Development of Graphical Methods. J. Amer. Statist. Assoc. 79, 387(1984), 531–554.DOI: http://dx.doi.org/10.1080/01621459.1984.10478080
W. S. Cleveland and R. McGill. 1985. Graphical Perception and Graphical Methods forAnalyzing Scientific Data. Science 229, 4716 (1985), 828–833.DOI: http://dx.doi.org/10.1126/science.229.4716.828
W. S. Cleveland and R. McGill. 1986. An experiment in graphical perception. InternationalJournal of Man-Machine Studies 25, 5 (1986), 491 – 500.DOI: http://dx.doi.org/10.1016/S0020-7373(86)80019-0
W. S. Cleveland and R. McGill. 1987. Graphical Perception: The Visual Decoding of Quanti-tative Information on Graphical Displays of Data. Journal of the Royal Statistical Society.Series A (General) 150, 3 (1987), 192–229.
A. Cockburn and B. McKenzie. 2002. Evaluating the Effectiveness of Spatial Memory in 2Dand 3D Physical and Virtual Environments. In Proceedings of the SIGCHI Conference onHuman Factors in Computing Systems (CHI ’02). ACM, New York, NY, USA, 203–210.DOI: http://dx.doi.org/10.1145/503376.503413
S. Consolvo, K. Everitt, I. Smith, and J. A. Landay. 2006. Design Requirements for Tech-nologies That Encourage Physical Activity. In Proceedings of the SIGCHI Conference onHuman Factors in Computing Systems (CHI ’06). ACM, New York, NY, USA, 457–466.DOI: http://dx.doi.org/10.1145/1124772.1124840
S. Consolvo, D. W. McDonald, and J. A. Landay. 2009. Theory-driven Design Strategiesfor Technologies That Support Behavior Change in Everyday Life. In Proceedings of theSIGCHI Conference on Human Factors in Computing Systems (CHI ’09). ACM, NewYork, NY, USA, 405–414.DOI: http://dx.doi.org/10.1145/1518701.1518766
S. Consolvo, D. W. McDonald, T. Toscos, M. Y. Chen, J. Froehlich, B. Harrison, P. Klasnja,A. LaMarca, L. LeGrand, R. Libby, I. Smith, and J. A. Landay. 2008. Activity Sensingin the Wild: A Field Trial of Ubifit Garden. In Proceedings of the SIGCHI Conference
220

BIBLIOGRAPHY
on Human Factors in Computing Systems (CHI ’08). ACM, New York, NY, USA, 1797–1806.DOI: http://dx.doi.org/10.1145/1357054.1357335
F. Cordeiro, D. A. Epstein, E. Thomaz, E. Bales, A. K. Jagannathan, G. D. Abowd, and J.Fogarty. 2015. Barriers and Negative Nudges: Exploring Challenges in Food Journaling.In Proceedings of the 33rd Annual ACM Conference on Human Factors in ComputingSystems (CHI ’15). ACM, New York, NY, USA, 1159–1162.DOI: http://dx.doi.org/10.1145/2702123.2702155
D. A. Corsini and H. L. Pick. 1969. The effect of texture on tactually perceived length.Perception & Psychophysics 5, 6 (1969), 352–356.DOI: http://dx.doi.org/10.3758/BF03210656
S. Crump. 1991. Fused deposition modeling (FDM): putting rapid back in prototyping. InProceedings of the 2nd International Conference on Rapid Prototyping. 358–361.
G. Cumming. 2014. The new statistics: why and how. Psychological science 25, 1 (2014),7–29.DOI: http://dx.doi.org/10.1177/0956797613504966
M. Cutkosky and P. Wright. 1986. Modeling manufacturing grips and correlations with thedesign of robotic hands. In Proceedings of the IEEE International Conference on Roboticsand Automation, Vol. 3. 1533–1539.DOI: http://dx.doi.org/10.1109/ROBOT.1986.1087525
I. Daian, A. M. van Ruiten, A. Visser, and S. Zubic. 2007. Sensitive Chair: A Force SensingChair with Multimodal Real-time Feedback via Agent. In Proceedings of the 14th Euro-pean Conference on Cognitive Ergonomics: Invent! Explore! (ECCE ’07). ACM, NewYork, NY, USA, 163–166.DOI: http://dx.doi.org/10.1145/1362550.1362583
E. De Garmo, J. Black, and R. Kohser. 2011. DeGarmo’s Materials and Processes in Man-ufacturing. Wiley.
E. D. Demaine and J. O’Rourke. 2008. Geometric Folding Algorithms: Linkages, Origami,Polyhedra (reprint ed.). Cambridge University Press, New York, NY, USA.
L. Devendorf. 2014. Making Art and Making Artists. In Proceedings of the 2014 CompanionPublication on Designing Interactive Systems (DIS Companion ’14). ACM, New York,NY, USA, 151–156.DOI: http://dx.doi.org/10.1145/2598784.2598787
L. Devendorf and D. K. Rosner. 2015. Reimagining Digital Fabrication As PerformanceArt. In Proceedings of the 33rd Annual ACM Conference Extended Abstracts on HumanFactors in Computing Systems (CHI EA ’15). ACM, New York, NY, USA, 555–566.DOI: http://dx.doi.org/10.1145/2702613.2732507
221
BIBLIOGRAPHY
L. Devendorf and K. Ryokai. 2014. Being the Machine: Exploring New Modes of Making.In Proceedings of the 2014 Companion Publication on Designing Interactive Systems(DIS Companion ’14). ACM, New York, NY, USA, 33–36.DOI: http://dx.doi.org/10.1145/2598784.2602775
L. Devendorf and K. Ryokai. 2015a. Being the Machine: Reconfiguring Agency and Controlin Hybrid Fabrication. In Proceedings of the 33rd Annual ACM Conference on HumanFactors in Computing Systems (CHI ’15). ACM, New York, NY, USA, 2477–2486.DOI: http://dx.doi.org/10.1145/2702123.2702547
L. Devendorf and K. Ryokai. 2015b. Redeform: Participatory 3D Printing in Public Spaces.In Proceedings of the Ninth International Conference on Tangible, Embedded, and Em-bodied Interaction (TEI ’15). ACM, New York, NY, USA, 423–424.DOI: http://dx.doi.org/10.1145/2677199.2690880
T. Diez and A. Posada. 2013. The Fab and the Smart City: The Use of Machines andTechnology for the City Production by Its Citizens. In Proceedings of the 7th Interna-tional Conference on Tangible, Embedded and Embodied Interaction (TEI ’13). ACM,New York, NY, USA, 447–454.DOI: http://dx.doi.org/10.1145/2460625.2460725
T. Döring, A. Sylvester, and A. Schmidt. 2013. A Design Space for Ephemeral User In-terfaces. In Proceedings of the 7th International Conference on Tangible, Embedded andEmbodied Interaction (TEI ’13). ACM, New York, NY, USA, 75–82.DOI: http://dx.doi.org/10.1145/2460625.2460637
P. Dourish. 2001. Where the Action is: The Foundations of Embodied Interaction. MITPress, Cambridge, MA, USA.
P. Dourish. 2010. HCI and Environmental Sustainability: The Politics of Design and theDesign of Politics. In Proceedings of the 8th ACM Conference on Designing InteractiveSystems (DIS ’10). ACM, New York, NY, USA, 1–10.DOI: http://dx.doi.org/10.1145/1858171.1858173
P. Dourish. 2013. Epilogue: Where the Action Was, Wasn’T, Should Have Been, and MightYet Be. ACM Transactions on Computer-Human Interaction (TOCHI) 20, 1, Article 2(2013), 4 pages.DOI: http://dx.doi.org/10.1145/2442106.2442108
P. Dragicevic. 2016. Fair Statistical Communication in HCI. Springer International Publish-ing, Cham, 291–330.DOI: http://dx.doi.org/10.1007/978-3-319-26633-6_13
P. Dragicevic and Y. Jansen. 2012. List of Physical Visualizations. Online document. (2012).http://www.dataphys.org/list - Accessed: 2015-12-15.
222

BIBLIOGRAPHY
R. D. Easton, A. J. Greene, and K. Srinivas. 1997. Transfer between vision and haptics:Memory for 2-D patterns and 3-D objects. Psychonomic Bulletin & Review 4, 3 (1997),403–410.DOI: http://dx.doi.org/10.3758/BF03210801
H. Ebbinghaus. 1885. Über das Gedächtnis. Verlag von Duncker und Humblot.
R. R. Ellis and S. J. Lederman. 1998. The golf-ball illusion: evidence for top-down process-ing in weight perception. Perception 27 (1998), 193–201.
R. R. Ellis and S. J. Lederman. 1999. The material-weight illusion revisited. Perception &Psychophysics 61, 8 (1999), 1564–1576.DOI: http://dx.doi.org/10.3758/BF03213118
E. Engel. 2014. Data Exploration Matrix. Project thesis. LMU Munich.
S. Everts. 2013. Understanding The Workings Of Life: Pinpointing three-dimensional ar-rangements of proteins has been crucial for understanding the chemistry of living cells.Chemical & Engineering News 91, 36 (2013), 44–49.
fabric.ch. 2005. Perpetual (Tropical) SUNSHINE. Website. (2005). http://www.fabric.ch/pts/ - Accessed: 2015-12-15.
C. Fan, J. Forlizzi, and A. K. Dey. 2012. A Spark of Activity: Exploring Informative ArtAs Visualization for Physical Activity. In Proceedings of the 2012 ACM Conference onUbiquitous Computing (UbiComp ’12). ACM, New York, NY, USA, 81–84.DOI: http://dx.doi.org/10.1145/2370216.2370229
T. Feix, H.-B. Schmiedmayer, J. Romero, and D. Kragic. 2009. A comprehensive grasptaxonomy. In Robotics, Science and Systems Conference: Workshop on Understandingthe Human Hand for Advancing Robotic Manipulation, Poster Presentation.
S. Few. 2011a. Benefitting infovis with visual difficulties? Provocation without a cause.Perceptual Edge. Visual Business Intelligence Newsletter (2011).
S. Few. 2011b. The chartjunk debate: A close examination of recent findings. PerceptualEdge. Visual Business Intelligence Newsletter (2011).
S. Few. 2013. Chart Junk: A Magnet for Misguided Research. Blog post. Perceptual Edge.Visual Business Intelligence. (2013). https://www.perceptualedge.com/blog/?p=1770
S. Few. 2015. Information Visualization Research as Pseudo-Science. Perceptual Edge.Visual Business Intelligence Newsletter (2015).
S. Few. 2016. Critique to Learn. Blog post. Perceptual Edge. Visual Business Intelligence.(2016). https://www.perceptualedge.com/blog/?p=2313
223

BIBLIOGRAPHY
D. Fitton, J. C. Read, and J. Dempsey. 2015. Exploring Children’s Designs for MakerTechnologies. In Proceedings of the 14th International Conference on Interaction Designand Children (IDC ’15). ACM, New York, NY, USA, 379–382.DOI: http://dx.doi.org/10.1145/2771839.2771921
J. Flanagan, A. Wing, S. Allison, and A. Spenceley. 1995. Effects of surface texture onweight perception when lifting objects with a precision grip. Perception & Psychophysics57, 3 (1995), 282–290.DOI: http://dx.doi.org/10.3758/BF03213054
S. Follmer, D. Carr, E. Lovell, and H. Ishii. 2010. CopyCAD: Remixing Physical Objectswith Copy and Paste from the Real World. In Adjunct Proceedings of the 23nd AnnualACM Symposium on User Interface Software and Technology (UIST ’10). ACM, NewYork, NY, USA, 381–382.DOI: http://dx.doi.org/10.1145/1866218.1866230
S. Follmer and H. Ishii. 2012. KidCAD: Digitally Remixing Toys Through Tangible Tools.In Proceedings of the SIGCHI Conference on Human Factors in Computing Systems (CHI’12). ACM, New York, NY, USA, 2401–2410.DOI: http://dx.doi.org/10.1145/2207676.2208403
S. Follmer, D. Leithinger, A. Olwal, N. Cheng, and H. Ishii. 2012. Jamming User Interfaces:Programmable Particle Stiffness and Sensing for Malleable and Shape-changing Devices.In Proceedings of the 25th Annual ACM Symposium on User Interface Software and Tech-nology (UIST ’12). ACM, New York, NY, USA, 519–528.DOI: http://dx.doi.org/10.1145/2380116.2380181
S. Follmer, D. Leithinger, A. Olwal, A. Hogge, and H. Ishii. 2013. inFORM: Dynamic Phys-ical Affordances and Constraints Through Shape and Object Actuation. In Proceedings ofthe 26th Annual ACM Symposium on User Interface Software and Technology (UIST ’13).ACM, New York, NY, USA, 417–426.DOI: http://dx.doi.org/10.1145/2501988.2502032
K. M. Franklin and J. C. Roberts. 2003. Pie chart sonification. In Proceedings of the SeventhInternational Conference on Information Visualization (IV ’03). 4–9.DOI: http://dx.doi.org/10.1109/IV.2003.1217949
E. Freeman and D. Gelernter. 1996. Lifestreams: A Storage Model for Personal Data. SIG-MOD Rec. 25, 1 (1996), 80–86.DOI: http://dx.doi.org/10.1145/381854.381893
R. M. Friedman, K. D. Hester, B. G. Green, and R. H. LaMotte. 2008. Magnitude estimationof softness. Experimental Brain Research 191, 2 (2008), 133–142.DOI: http://dx.doi.org/10.1007/s00221-008-1507-5
224

BIBLIOGRAPHY
M. Friendly and D. J. Denis. 2001. Milestones in the history of thematic cartography, sta-tistical graphics, and data visualization. Web document. (2001). http://www.datavis.ca/milestones/
M. Frisch, U. Kister, W. Büschel, R. Langner, and R. Dachselt. 2013. Translucent Tangibleson Tabletops: Exploring the Design Space. In CHI ’13 Workshop on Blended Interaction- Envisioning Future Collaborative Interactive Spaces. 6.
J. Froehlich, L. Findlater, and J. Landay. 2010. The Design of Eco-feedback Technology. InProceedings of the SIGCHI Conference on Human Factors in Computing Systems (CHI’10). ACM, New York, NY, USA, 1999–2008.DOI: http://dx.doi.org/10.1145/1753326.1753629
M. Gannon, T. Grossman, and G. Fitzmaurice. 2015. Tactum: A Skin-Centric Approachto Digital Design and Fabrication. In Proceedings of the 33rd Annual ACM Conferenceon Human Factors in Computing Systems (CHI ’15). ACM, New York, NY, USA, 1779–1788.DOI: http://dx.doi.org/10.1145/2702123.2702581
M. Gardiner, C. Lindinger, R. Haring, H. Hörtner, H. Ogawa, and E. Ogawa. 2011. SocialBrainstorming via Interactive Fabrication. In Proceedings of the 8th International Confer-ence on Advances in Computer Entertainment Technology (ACE ’11). ACM, New York,NY, USA, Article 76, 2 pages.DOI: http://dx.doi.org/10.1145/2071423.2071516
W. R. Garner. 1974. The Processing of Information and Structure. Lawrence Erlbaum,Potomac, MD.
P. Gary, G. Jeremy, D. Jake, and G. James. 2012. Projection Augmented Relief Models(PARM): Tangible Displays for Geographic Information | Papers | EVA | 2012 | Con-ferences by year | Conference archive | eWiC - Electronic Workshops in Computing. InProceedings from Electronic Visualisation and the Arts (EVA). 180–187.
P. Gatalsky, N. Andrienko, and G. Andrienko. 2004. Interactive analysis of event data usingspace-time cube. In Proceedings of the Eighth International Conference on InformationVisualisation. 145–152.DOI: http://dx.doi.org/10.1109/IV.2004.1320137
C. Geiger, M. Hogen, J. Hornig, and M. Schaar. 2013. Datenreise: Digital Bits Made Tan-gible. In Proceedings of the 8th International Conference on Tangible, Embedded andEmbodied Interaction (TEI ’14). ACM, New York, NY, USA, 283–284.DOI: http://dx.doi.org/10.1145/2540930.2540945
F. Geldard. 1972. The human senses, Wiley. New York (1972).
225

BIBLIOGRAPHY
J. Gemmell, R. Lueder, and G. Bell. 2003. The MyLifeBits Lifetime Store. In Proceedingsof the 2003 ACM SIGMM Workshop on Experiential Telepresence (ETP ’03). ACM, NewYork, NY, USA, 80–83.DOI: http://dx.doi.org/10.1145/982484.982500
N. Gershenfeld. 1999. When Things Start to Think. Henry Holt and Co., Inc., New York,NY, USA.
N. Gershenfeld. 2007. Fab: The Coming Revolution on Your Desktop–from Personal Com-puters to Personal Fabrication. Basic Books, Inc., New York, NY, USA.
N. Gershenfeld. 2012. How to Make Almost Anything: The Digital Fabrication Revolution.Foreign Affairs 91, 6 (2012), 42–57.DOI: http://dx.doi.org/10.1111/1467-8284.00096
N. Gershon and W. Page. 2001. What Storytelling Can Do for Information Visualization.Commun. ACM 44, 8 (2001), 31–37.DOI: http://dx.doi.org/10.1145/381641.381653
M. N. Giannakos and L. Jaccheri. 2013. What Motivates Children to Become Creators ofDigital Enriched Artifacts?. In Proceedings of the 9th ACM Conference on Creativity &Cognition (C&C ’13). ACM, New York, NY, USA, 104–113.DOI: http://dx.doi.org/10.1145/2466627.2466634
J. J. Gibson. 1962. Observations on active touch. Psychological review 69, 6 (1962), 477–491.DOI: http://dx.doi.org/10.1037/h0046962
J. J. Gibson. 1986. The Ecological Approach To Visual Perception (new ed ed.). PsychologyPress.
D. J. Gillan and E. H. Richman. 1994. Minimalism and the Syntax of Graphs. HumanFactors: The Journal of the Human Factors and Ergonomics Society 36, 4 (1994), 619–644.DOI: http://dx.doi.org/10.1177/001872089403600405
A. Gillet, M. Sanner, D. Stoffler, and A. Olson. 2005. Tangible Interfaces for StructuralMolecular Biology. Structure 13, 3 (2005), 483–491.DOI: http://dx.doi.org/10.1016/j.str.2005.01.009
A. Glassner. 2002a. Interactive pop-up card design. 1. IEEE Computer Graphics and Appli-cations 22, 1 (2002), 79–86.DOI: http://dx.doi.org/10.1109/38.974521
A. Glassner. 2002b. Interactive pop-up card design. 2. IEEE Computer Graphics and Appli-cations 22, 2 (2002), 74–85.DOI: http://dx.doi.org/10.1109/38.988749
226

BIBLIOGRAPHY
E. Goffman. 1959. The Presentation of Self in Everyday Life. Anchor.
C. Golsteijn, E. van den Hoven, D. Frohlich, and A. Sellen. 2012. Towards a More Cherish-able Digital Object. In Proceedings of the Designing Interactive Systems Conference (DIS’12). ACM, New York, NY, USA, 655–664.DOI: http://dx.doi.org/10.1145/2317956.2318054
J. A. González. 1995. Autotopographies. Prosthetic territories: Politics and hypertechnolo-gies (1995), 133–150.
A. Greenberg. 2015. Feds Tighten Restrictions on 3-D Printed Gun FilesOnline. Wired (online article). (2015). http://www.wired.com/2015/06/feds-restrict-3d-printed-gun-files/ - Accessed: 2015-12-15.
R. Gregory. 1970. The intelligent eye. McGraw-Hill.
L. E. Grierson and H. Carnahan. 2006. Manual exploration and the perception of slipperi-ness. Perception & Psychophysics 68, 7 (2006), 1070–1081.DOI: http://dx.doi.org/10.3758/BF03193710
A. Griffin. 2001. Feeling It Out: The Use of Haptic Visualization for Exploratory GeographicAnalysis. Cartographic Perspectives 0, 39 (2001).DOI: http://dx.doi.org/10.14714/CP39.636
D. Grimley, J. Prochaska, W. Velicer, L. Vlais, and C. DiClemente. 1994. Changing the self:Philosophies, techniques, and experiences. State University of New York Press, Chapter:The transtheoretical model of change, 201–227.
M. Gross. 2013. Creating the Magic with Information Technology. In Proceedings of the2013 ACM International Joint Conference on Pervasive and Ubiquitous Computing (Ubi-Comp ’13). ACM, New York, NY, USA, 1–2.DOI: http://dx.doi.org/10.1145/2493432.2501096
I. Gwilt, A. Yoxall, K. Sano, and others. 2012. Enhancing the understanding of statisticaldata through the creation of physical objects. In Proceedings of the 2nd InternationalConference on Design Creativity Volume 1. 117–126.
G. Hake. 1970. Kartographie II. Walter de Gruyter.
M. Haller, C. Richter, P. Brandl, S. Gross, G. Schossleitner, A. Schrempf, H. Nii, M. Sug-imoto, and M. Inami. 2011. Finding the Right Way for Interrupting People ImprovingTheir Sitting Posture. In Human-Computer Interaction – INTERACT 2011: 13th IFIP TC13 International Conference, Lisbon, Portugal, September 5-9, 2011, Proceedings, PartII, Pedro Campos, Nicholas Graham, Joaquim Jorge, Nuno Nunes, Philippe Palanque, andMarco Winckler (Eds.). Springer Berlin Heidelberg, Berlin, Heidelberg, 1–17.DOI: http://dx.doi.org/10.1007/978-3-642-23771-3_1
227

BIBLIOGRAPHY
M. Hancock, O. Hilliges, C. Collins, D. Baur, and S. Carpendale. 2009. Exploring Tangibleand Direct Touch Interfaces for Manipulating 2D and 3D Information on a Digital Table.In Proceedings of the ACM International Conference on Interactive Tabletops and Sur-faces (ITS ’09). ACM, New York, NY, USA, 77–84.DOI: http://dx.doi.org/10.1145/1731903.1731921
T. Hao, G. Xing, and G. Zhou. 2013. iSleep: Unobtrusive Sleep Quality Monitoring UsingSmartphones. In Proceedings of the 11th ACM Conference on Embedded Networked Sen-sor Systems (SenSys ’13). ACM, New York, NY, USA, Article 4, 14 pages.DOI: http://dx.doi.org/10.1145/2517351.2517359
S. Haroz, R. Kosara, and S. L. Franconeri. 2015. ISOTYPE Visualization: Working Memory,Performance, and Engagement with Pictographs. In Proceedings of the 33rd Annual ACMConference on Human Factors in Computing Systems (CHI ’15). ACM, New York, NY,USA, 1191–1200.DOI: http://dx.doi.org/10.1145/2702123.2702275
R. Harper and S. S. Stevens. 1964. Subjective hardness of compliant materials. QuarterlyJournal of Experimental Psychology 16, 3 (1964), 204–215.DOI: http://dx.doi.org/10.1080/17470216408416370
C. G. Healey and J. Enns. 2012. Attention and Visual Memory in Visualization and Com-puter Graphics. IEEE Transactions on Visualization and Computer Graphics 18, 7 (2012),1170–1188.DOI: http://dx.doi.org/10.1109/TVCG.2011.127
J. Heer, F. Ham, S. Carpendale, C. Weaver, and P. Isenberg. 2008. Creation and Collab-oration: Engaging New Audiences for Information Visualization. In Information Visu-alization, Andreas Kerren, John T. Stasko, Jean-Daniel Fekete, and Chris North (Eds.).Springer-Verlag, Berlin, Heidelberg, Chapter: Creation and Collaboration: Engaging NewAudiences for Information Visualization, 92–133.DOI: http://dx.doi.org/10.1007/978-3-540-70956-5_5
G. Hein. 1991. Constructivist learning theory. Institute for Inquiry. (1991).
H. Helson and S. M. King. 1931. The tau effect: an example of psychological relativity.Journal of Experimental Psychology 14, 3 (1931), 202–217.DOI: http://dx.doi.org/10.1037/h0071164
S. L. Hendrix and M. A. Eisenberg. 2006. Computer-assisted Pop-up Design for Children:Computationally Enriched Paper Engineering. Advanced Technology for Learning 3, 2(2006), 119–127.
T. Hermann and H. Ritter. 1999. Listen to your Data: Model-Based Sonification for DataAnalysis. In Advances in intelligent computing and multimedia systems, G. E. Lasker andMahbubur Rahman Syed (Eds.). Int. Inst. for Advanced Studies in System research andcybernetics, 189–194.
228

BIBLIOGRAPHY
G. Hermans. 2013. Wordpress of Objects: Addressing Layman Participation in a Post-industrial Society. In Proceedings of the 2013 ACM Conference on Pervasive and Ubiq-uitous Computing Adjunct Publication (UbiComp ’13 Adjunct). ACM, New York, NY,USA, 945–950.DOI: http://dx.doi.org/10.1145/2494091.2499206
O. Hilliges, D. Baur, and A. Butz. 2007. Photohelix: Browsing, Sorting and Sharing DigitalPhoto Collections. In Second Annual IEEE International Workshop on Horizontal Inter-active Human-Computer Systems. 87–94.DOI: http://dx.doi.org/10.1109/TABLETOP.2007.14
K. Hinckley, R. Pausch, J. C. Goble, and N. F. Kassell. 1994. Passive Real-world InterfaceProps for Neurosurgical Visualization. In Proceedings of the SIGCHI Conference on Hu-man Factors in Computing Systems (CHI ’94). ACM, New York, NY, USA, 452–458.DOI: http://dx.doi.org/10.1145/191666.191821
D. Hirschmann. 2004. Glowbits. Demo at Ubicomp 2004. (2004). http://www.danielhirschmann.com/glowbits-3d-pixel-surface/ - Accessed: 2015-12-15.
M. Hobe. 2015. Evaluating the Memorability of Physical Visualizations. Bachelor’s thesis.LMU Munich.
W. E. Hockley. 2008. The picture superiority effect in associative recognition. Memory &Cognition 36, 7 (2008), 1351–1359.DOI: http://dx.doi.org/10.3758/MC.36.7.1351
T. Hogan and E. Hornecker. 2012. How Does Representation Modality Affect User-Experience of Data Artifacts? Springer Berlin Heidelberg, Berlin, Heidelberg, 141–151.DOI: http://dx.doi.org/10.1007/978-3-642-32796-4_15
T. Hogan and E. Hornecker. 2013. In Touch with Space: Embodying Live Data for TangibleInteraction. In Proceedings of the 7th International Conference on Tangible, Embeddedand Embodied Interaction (TEI ’13). ACM, New York, NY, USA, 275–278.DOI: http://dx.doi.org/10.1145/2460625.2460671
T. Hogan and E. Hornecker. 2016. Towards a Design Space for Multisensory Data Repre-sentation. Interacting with Computers (2016).DOI: http://dx.doi.org/10.1093/iwc/iww015
J. Hollan, E. Hutchins, and D. Kirsh. 2000. Distributed Cognition: Toward a New Founda-tion for Human-computer Interaction Research. ACM Transactions on Computer-HumanInteraction (TOCHI) 7, 2 (2000), 174–196.DOI: http://dx.doi.org/10.1145/353485.353487
M. Hollins, R. Faldowski, S. Rao, and F. Young. 1993. Perceptual dimensions of tactilesurface texture: A multidimensional scaling analysis. Perception & Psychophysics 54, 6
229

BIBLIOGRAPHY
(1993), 697–705.DOI: http://dx.doi.org/10.3758/BF03211795
M. Hollins and S. R. Risner. 2000. Evidence for the duplex theory of tactile texture percep-tion. Perception & Psychophysics 62, 4 (2000), 695–705.DOI: http://dx.doi.org/10.3758/BF03206916
L. E. Holmquist and T. Skog. 2003. Informative Art: Information Visualization in EverydayEnvironments. In Proceedings of the 1st International Conference on Computer Graphicsand Interactive Techniques in Australasia and South East Asia (GRAPHITE ’03). ACM,New York, NY, USA, 229–235.DOI: http://dx.doi.org/10.1145/604471.604516
J.-k. Hong, S. Song, J. Cho, and A. Bianchi. 2015. Better Posture Awareness ThroughFlower-Shaped Ambient Avatar. In Proceedings of the Ninth International Conference onTangible, Embedded, and Embodied Interaction (TEI ’15). ACM, New York, NY, USA,337–340.DOI: http://dx.doi.org/10.1145/2677199.2680575
E. Hornecker. 2010. Tangible Interaction. Online article for The Glos-sary of Human Computer Interaction (Interaction Design Foundation).(2010). https://www.interaction-design.org/literature/book/the-glossary-of-human-computer-interaction/tangible-interaction#heading_Influences_from_other_disciplines:_Product/Industrial_Design_and_the_Arts_page_36537 - Accessed: 2015-12-15.
E. Hornecker and J. Buur. 2006. Getting a Grip on Tangible Interaction: A Frameworkon Physical Space and Social Interaction. In Proceedings of the SIGCHI Conference onHuman Factors in Computing Systems (CHI ’06). ACM, New York, NY, USA, 437–446.DOI: http://dx.doi.org/10.1145/1124772.1124838
S. Houben, C. Golsteijn, S. Gallacher, R. Johnson, S. Bakker, N. Marquardt, L. Capra, andY. Rogers. 2016. Physikit: Data Engagement Through Physical Ambient Visualizations inthe Home. In Proceedings of the 2016 CHI Conference on Human Factors in ComputingSystems (CHI ’16). ACM, New York, NY, USA, 1608–1619.DOI: http://dx.doi.org/10.1145/2858036.2858059
M. Hu. 2015. Exploring New Paradigms for Accessible 3D Printed Graphs. In Proceedingsof the 17th International ACM SIGACCESS Conference on Computers & Accessibility(ASSETS ’15). ACM, New York, NY, USA, 365–366.DOI: http://dx.doi.org/10.1145/2700648.2811330
D. Huang, M. Tory, B. A. Aseniero, L. Bartram, S. Bateman, S. Carpendale, A. Tang, andR. Woodbury. 2015. Personal Visualization and Personal Visual Analytics. IEEE Trans-actions on Visualization and Computer Graphics 21, 3 (2015), 420–433.DOI: http://dx.doi.org/10.1109/TVCG.2014.2359887
230

BIBLIOGRAPHY
Y. Huang and M. Eisenberg. 2012. Easigami: Virtual Creation by Physical Folding. InProceedings of the Sixth International Conference on Tangible, Embedded and EmbodiedInteraction (TEI ’12). ACM, New York, NY, USA, 41–48.DOI: http://dx.doi.org/10.1145/2148131.2148143
S. E. Hudson. 2014. Printing Teddy Bears: A Technique for 3D Printing of Soft InteractiveObjects. In Proceedings of the SIGCHI Conference on Human Factors in Computing Sys-tems (CHI ’14). ACM, New York, NY, USA, 459–468.DOI: http://dx.doi.org/10.1145/2556288.2557338
T. Hull. 2012. Project Origami: Activities for Exploring Mathematics, Second Edition.Taylor & Francis.
J. Hullman, E. Adar, and P. Shah. 2011. Benefitting InfoVis with Visual Difficulties. IEEETransactions on Visualization and Computer Graphics 17, 12 (2011), 2213–2222.DOI: http://dx.doi.org/10.1109/TVCG.2011.175
S. Huron. 2014. Constructive Visualization: A token-based paradigm allowing to assembledynamic visual representation for non-experts. Ph.D. Dissertation. Université Paris Sud -Paris XI.
S. Huron, S. Carpendale, A. Thudt, A. Tang, and M. Mauerer. 2014a. Constructive Visu-alization. In Proceedings of the 2014 Conference on Designing Interactive Systems (DIS’14). ACM, New York, NY, USA, 433–442.DOI: http://dx.doi.org/10.1145/2598510.2598566
S. Huron, Y. Jansen, and S. Carpendale. 2014b. Constructing visual representations: Inves-tigating the use of tangible tokens. IEEE Transactions on Visualization and ComputerGraphics 20, 12 (2014), 2102–2111.DOI: http://dx.doi.org/10.1109/TVCG.2014.2346292
A. Hurst and S. Kane. 2013. Making "Making" Accessible. In Proceedings of the 12th In-ternational Conference on Interaction Design and Children (IDC ’13). ACM, New York,NY, USA, 635–638.DOI: http://dx.doi.org/10.1145/2485760.2485883
D. Hyerle. 2008. Visual Tools for Transforming Information Into Knowledge. SAGE Publi-cations.
O. Inbar, N. Tractinsky, and J. Meyer. 2007. Minimalism in Information Visualization:Attitudes Towards Maximizing the Data-ink Ratio. In Proceedings of the 14th EuropeanConference on Cognitive Ergonomics: Invent! Explore! (ECCE ’07). ACM, New York,NY, USA, 185–188.DOI: http://dx.doi.org/10.1145/1362550.1362587
231
BIBLIOGRAPHY
P. Isenberg, N. Elmqvist, J. Scholtz, D. Cernea, K.-L. Ma, and H. Hagen. 2011. Collaborativevisualization: Definition, challenges, and research agenda. Information Visualization 10,4 (2011), 310–326.DOI: http://dx.doi.org/10.1177/1473871611412817
Y. Ishiguro and I. Poupyrev. 2014. 3D Printed Interactive Speakers. In Proceedings of theSIGCHI Conference on Human Factors in Computing Systems (CHI ’14). ACM, NewYork, NY, USA, 1733–1742.DOI: http://dx.doi.org/10.1145/2556288.2557046
H. Ishii, D. Lakatos, L. Bonanni, and J.-B. Labrune. 2012. Radical Atoms: Beyond TangibleBits, Toward Transformable Materials. interactions 19, 1 (2012), 38–51.DOI: http://dx.doi.org/10.1145/2065327.2065337
H. Ishii and B. Ullmer. 1997. Tangible Bits: Towards Seamless Interfaces Between People,Bits and Atoms. In Proceedings of the SIGCHI Conference on Human Factors in Com-puting Systems (CHI ’97). ACM, New York, NY, USA, 234–241.DOI: http://dx.doi.org/10.1145/258549.258715
J. Jacobs and L. Buechley. 2013. Codeable Objects: Computational Design and Digital Fab-rication for Novice Programmers. In Proceedings of the SIGCHI Conference on HumanFactors in Computing Systems (CHI ’13). ACM, New York, NY, USA, 1589–1598.DOI: http://dx.doi.org/10.1145/2470654.2466211
J. Jacobs and A. Zoran. 2015. Hybrid Practice in the Kalahari: Design CollaborationThrough Digital Tools and Hunter-Gatherer Craft. In Proceedings of the 33rd Annual ACMConference on Human Factors in Computing Systems (CHI ’15). ACM, New York, NY,USA, 619–628.DOI: http://dx.doi.org/10.1145/2702123.2702362
N. Jafarinaimi, J. Forlizzi, A. Hurst, and J. Zimmerman. 2005. Breakaway: An AmbientDisplay Designed to Change Human Behavior. In CHI ’05 Extended Abstracts on HumanFactors in Computing Systems (CHI EA ’05). ACM, New York, NY, USA, 1945–1948.DOI: http://dx.doi.org/10.1145/1056808.1057063
W. James. 1890. The principles of psychology. New York: Henry Holt and Company.
Y. Jansen. 2014. Physical and tangible information visualization. Ph.D. Dissertation. Uni-versité Paris Sud - Paris XI.
Y. Jansen and P. Dragicevic. 2013. An Interaction Model for Visualizations Beyond TheDesktop. IEEE Transactions on Visualization and Computer Graphics 19, 12 (2013),2396–2405.DOI: http://dx.doi.org/10.1109/TVCG.2013.134
Y. Jansen, P. Dragicevic, and J.-D. Fekete. 2012. Investigating Physical Visualizations.Poster Abstract of IEEE Transactions on Visualization and Computer Graphics. (2012).
232
BIBLIOGRAPHY
Y. Jansen, P. Dragicevic, and J.-D. Fekete. 2013. Evaluating the Efficiency of Physical Vi-sualizations. In Proceedings of the SIGCHI Conference on Human Factors in ComputingSystems (CHI ’13). ACM, New York, NY, USA, 2593–2602.DOI: http://dx.doi.org/10.1145/2470654.2481359
Y. Jansen, P. Dragicevic, P. Isenberg, J. Alexander, A. Karnik, J. Kildal, S. Subramanian, andK. Hornbæk. 2015. Opportunities and Challenges for Data Physicalization. In Proceed-ings of the 33rd Annual ACM Conference on Human Factors in Computing Systems (CHI’15). ACM, New York, NY, USA, 3227–3236.DOI: http://dx.doi.org/10.1145/2702123.2702180
Y. Jansen and K. Hornbæk. 2016. A Psychophysical Investigation of Size as a PhysicalVariable. IEEE Transactions on Visualization and Computer Graphics 22, 1 (2016), 479–488.DOI: http://dx.doi.org/10.1109/TVCG.2015.2467951
T. Jenkins and I. Bogost. 2015. Escaping the Sandbox: Making and Its Future. In Pro-ceedings of the Ninth International Conference on Tangible, Embedded, and EmbodiedInteraction (TEI ’15). ACM, New York, NY, USA, 29–32.DOI: http://dx.doi.org/10.1145/2677199.2680558
H.-C. Jetter, J. Gerken, M. Zöllner, H. Reiterer, and N. Milic-Frayling. 2011. Materializingthe Query with Facet-streams: A Hybrid Surface for Collaborative Search on Tabletops.In Proceedings of the SIGCHI Conference on Human Factors in Computing Systems (CHI’11). ACM, New York, NY, USA, 3013–3022.DOI: http://dx.doi.org/10.1145/1978942.1979390
G. Johnson, M. Gross, E. Y.-L. Do, and J. Hong. 2012. Sketch It, Make It: SketchingPrecise Drawings for Laser Cutting. In CHI ’12 Extended Abstracts on Human Factors inComputing Systems (CHI EA ’12). ACM, New York, NY, USA, 1079–1082.DOI: http://dx.doi.org/10.1145/2212776.2212390
B. Jones. 2015. When Memorability Matters: Another Practitioner’sView. Blog post. (2015). http://dataremixed.com/2015/12/when-memorability-matters-another-practitioners-view/
M. Y. Jones, R. Pentecost, and G. Requena. 2005. Memory for advertising and informationcontent: Comparing the printed page to the computer screen. Psychology and Marketing22, 8 (2005), 623–648.DOI: http://dx.doi.org/10.1002/mar.20077
B. Joy. 2000. Why the future doesn’t need us. Wired 8, 4 (2000), 238–263.
B. Julesz. 1971. Foundations of Cyclopean perception. The University of Chicago Press,Chicago, London.
233

BIBLIOGRAPHY
H. Jung and E. Stolterman. 2012. Digital Form and Materiality: Propositions for a NewApproach to Interaction Design Research. In Proceedings of the 7th Nordic Conferenceon Human-Computer Interaction: Making Sense Through Design (NordiCHI ’12). ACM,New York, NY, USA, 645–654.DOI: http://dx.doi.org/10.1145/2399016.2399115
M. Kahrimanovic, W. M. Bergmann Tiest, and A. M. Kappers. 2009. Context effects inhaptic perception of roughness. Experimental Brain Research 194, 2 (2009), 287–297.DOI: http://dx.doi.org/10.1007/s00221-008-1697-x
M. Kaptein and J. Robertson. 2012. Rethinking Statistical Analysis Methods for CHI. InProceedings of the SIGCHI Conference on Human Factors in Computing Systems (CHI’12). ACM, New York, NY, USA, 1105–1114.DOI: http://dx.doi.org/10.1145/2207676.2208557
D. Katz. 1925. Der Aufbau der Tastwelt. Wissenschaftliche Buchgesellschaft.
D. Katz and L. Krueger. 2013. The World of Touch. Taylor & Francis.
Y. Kawahara, S. Hodges, B. S. Cook, C. Zhang, and G. D. Abowd. 2013. Instant InkjetCircuits: Lab-based Inkjet Printing to Support Rapid Prototyping of UbiComp Devices.In Proceedings of the 2013 ACM International Joint Conference on Pervasive and Ubiq-uitous Computing (UbiComp ’13). ACM, New York, NY, USA, 363–372.DOI: http://dx.doi.org/10.1145/2493432.2493486
M. Kay, S. Haroz, S. Guha, and P. Dragicevic. 2016a. Special Interest Group on TransparentStatistics in HCI. In Proceedings of the 2016 CHI Conference Extended Abstracts onHuman Factors in Computing Systems (CHI EA ’16). ACM, New York, NY, USA, 1081–1084.DOI: http://dx.doi.org/10.1145/2851581.2886442
M. Kay, G. L. Nelson, and E. B. Hekler. 2016b. Researcher-Centered Design of Statistics:Why Bayesian Statistics Better Fit the Culture and Incentives of HCI. In Proceedings ofthe 2016 CHI Conference on Human Factors in Computing Systems (CHI ’16). ACM,New York, NY, USA, 4521–4532.DOI: http://dx.doi.org/10.1145/2858036.2858465
J. W. Kelly, M. N. Avraamides, and N. A. Giudice. 2011. Haptic experiences influencevisually acquired memories: Reference frames during multimodal spatial learning. Psy-chonomic bulletin & review 18, 6 (2011), 1119–1125.DOI: http://dx.doi.org/10.3758/s13423-011-0162-1
D. Kerzel. 2001. Visual short-term memory is influenced by haptic perception. Journal ofExperimental Psychology: Learning, Memory, and Cognition 27, 4 (2001), 1101–1109.DOI: http://dx.doi.org/10.1037/0278-7393.27.4.1101
234

BIBLIOGRAPHY
R. A. Khot. 2013. Sweat-atoms: Crafting Physical Objects with Everyday Exercise. In CHI’13 Extended Abstracts on Human Factors in Computing Systems (CHI EA ’13). ACM,New York, NY, USA, 2701–2706.DOI: http://dx.doi.org/10.1145/2468356.2479496
R. A. Khot. 2014. Exploring Material Representations of Physical Activity. In Proceedingsof the 2014 Companion Publication on Designing Interactive Systems (DIS Companion’14). ACM, New York, NY, USA, 177–180.DOI: http://dx.doi.org/10.1145/2598784.2598792
R. A. Khot, L. Hjorth, and F. F. Mueller. 2014. Understanding Physical Activity Through 3DPrinted Material Artifacts. In Proceedings of the SIGCHI Conference on Human Factorsin Computing Systems (CHI ’14). ACM, New York, NY, USA, 3835–3844.DOI: http://dx.doi.org/10.1145/2556288.2557144
R. A. Khot, J. Lee, D. Aggarwal, L. Hjorth, and F. F. Mueller. 2015a. TastyBeats: Celebrat-ing Heart Rate Data with a Drinkable Spectacle. In Proceedings of the Ninth InternationalConference on Tangible, Embedded, and Embodied Interaction (TEI ’15). ACM, NewYork, NY, USA, 229–232.DOI: http://dx.doi.org/10.1145/2677199.2680545
R. A. Khot, J. Lee, D. Aggarwal, L. Hjorth, and F. F. Mueller. 2015b. TastyBeats: DesigningPalatable Representations of Physical Activity. In Proceedings of the 33rd Annual ACMConference on Human Factors in Computing Systems (CHI ’15). ACM, New York, NY,USA, 2933–2942.DOI: http://dx.doi.org/10.1145/2702123.2702197
R. A. Khot and F. F. Mueller. 2013. Sweat-atoms: Turning Physical Exercise into PhysicalObjects. In CHI ’13 Extended Abstracts on Human Factors in Computing Systems (CHIEA ’13). ACM, New York, NY, USA, 3075–3078.DOI: http://dx.doi.org/10.1145/2468356.2479614
R. A. Khot, F. F. Mueller, and L. Hjorth. 2013. SweatAtoms: Materializing Physical Activity.In Proceedings of The 9th Australasian Conference on Interactive Entertainment: Mattersof Life and Death (IE ’13). ACM, New York, NY, USA, Article 4, 7 pages.DOI: http://dx.doi.org/10.1145/2513002.2513012
R. A. Khot, R. Pennings, and F. F. Mueller. 2015a. EdiPulse: Supporting Physical Activitywith Chocolate Printed Messages. In Proceedings of the 33rd Annual ACM ConferenceExtended Abstracts on Human Factors in Computing Systems (CHI EA ’15). ACM, NewYork, NY, USA, 1391–1396.DOI: http://dx.doi.org/10.1145/2702613.2732761
R. A. Khot, R. Pennings, and F. F. Mueller. 2015b. EdiPulse: Turning Physical Activity IntoChocolates. In Proceedings of the 33rd Annual ACM Conference Extended Abstracts on
235

BIBLIOGRAPHY
Human Factors in Computing Systems (CHI EA ’15). ACM, New York, NY, USA, 331–334.DOI: http://dx.doi.org/10.1145/2702613.2725436
J. Kim, M. Kasper, T. Yeh, and N. Correll. 2014. SikuliBot: Automating Physical InterfaceUsing Images. In Proceedings of the Adjunct Publication of the 27th Annual ACM Sym-posium on User Interface Software and Technology (UIST’14 Adjunct). ACM, New York,NY, USA, 53–54.DOI: http://dx.doi.org/10.1145/2658779.2659110
D. S. Kirk and A. Sellen. 2010. On Human Remains: Values and Practice in the HomeArchiving of Cherished Objects. ACM Transactions on Computer-Human Interaction(TOCHI) 17, 3, Article 10 (2010), 43 pages.DOI: http://dx.doi.org/10.1145/1806923.1806924
D. Kirsh. 1995. The intelligent use of space. Artificial Intelligence - Computational Researchon Interaction and Agency, Part 2 73, 1 (1995), 31 – 68.DOI: http://dx.doi.org/10.1016/0004-3702(94)00017-U
D. Kirsh. 1996. Adapting the Environment Instead of Oneself. Adaptive Behavior 4, 3-4(1996), 415–452.DOI: http://dx.doi.org/10.1177/105971239600400307
D. Kirsh. 2013. Embodied Cognition and the Magical Future of Interaction Design. ACMTransactions on Computer-Human Interaction (TOCHI) 20, 1, Article 3 (2013), 30 pages.DOI: http://dx.doi.org/10.1145/2442106.2442109
R. L. Klatzky, S. J. Lederman, and D. E. Matula. 1991. Imagined haptic exploration injudgments of object properties. Journal of experimental psychology: Learning, Memory,and Cognition 17, 2 (1991), 314–322.DOI: http://dx.doi.org/10.1037/0278-7393.17.2.314
R. L. Klatzky, S. J. Lederman, and C. Reed. 1987. There’s more to touch than meets theeye: The salience of object attributes for haptics with and without vision. Journal ofexperimental psychology: General 116, 4 (1987), 356–369.DOI: http://dx.doi.org/10.1037/0096-3445.116.4.356
R. L. Klatzky, S. J. Lederman, and C. L. Reed. 1989. Haptic integration of object proper-ties: texture, hardness, and planar contour. Journal of Experimental Psychology: HumanPerception and Performance 15, 1 (1989), 45–57.DOI: http://dx.doi.org/10.1037/0096-1523.15.1.45
S. R. Klemmer, B. Hartmann, and L. Takayama. 2006. How Bodies Matter: Five Themesfor Interaction Design. In Proceedings of the 6th Conference on Designing InteractiveSystems (DIS ’06). ACM, New York, NY, USA, 140–149.DOI: http://dx.doi.org/10.1145/1142405.1142429
236

BIBLIOGRAPHY
R. B. Kline. 2004. Beyond Significance Testing: Reforming Data Analysis Methods in Be-havioral Research. American Psychological Association.
O. Knill and E. Slavkovsky. 2013a. Illustrating mathematics using 3D printers. arXivpreprint arXiv:1306.5599 (2013).
O. Knill and E. Slavkovsky. 2013b. Thinking like Archimedes with a 3D printer. arXivpreprint arXiv:1301.5027 (2013).
H. Kodama. 1981. Automatic method for fabricating a three-dimensional plastic model withphoto-hardening polymer. Review of Scientific Instruments 52, 11 (1981), 1770–1773.DOI: http://dx.doi.org/10.1063/1.1136492
L. Koeman. 2014. A Personal Visualisation Future: Domestic Data Sculptures. In PVA2014: A Personal Perspective on Visualization and Visual Analytics - Workshop at DIS2014. Vancouver, Canada.
V. Konchada, B. Jackson, T. Le, I. Borazjani, F. Sotiropoulos, and D. F. Keefe. 2011.Supporting Internal Visualization of Biomedical Datasets via 3D Rapid Prototypes andSketch-based Gestures. In Symposium on Interactive 3D Graphics and Games (I3D ’11).ACM, New York, NY, USA, 214–214.DOI: http://dx.doi.org/10.1145/1944745.1944794
N. Kong and M. Agrawala. 2012. Graphical Overlays: Using Layered Elements to Aid ChartReading. IEEE Transactions on Visualization and Computer Graphics 18, 12 (2012),2631–2638.DOI: http://dx.doi.org/10.1109/TVCG.2012.229
R. Kosara. 2007. Visualization Criticism - The Missing Link Between Information Visual-ization and Art. In Proceedings of the 11th International Conference Information Visual-ization (IV ’07). IEEE Computer Society, Washington, DC, USA, 631–636.DOI: http://dx.doi.org/10.1109/IV.2007.130
R. Kosara. 2015. Memorability, Science, and The Value of Thinking Out-side the Box. Blog post. (2015). https://eagereyes.org/blog/2015/memorability-science-and-the-value-of-thinking-outside-the-box
R. Kosara and J. Mackinlay. 2013. Storytelling: The Next Step for Visualization. Computer46, 5 (2013), 44–50.DOI: http://dx.doi.org/10.1109/MC.2013.36
M. Koutsomichalis, A. Psarra, and M. Varela. 2014. Oiko-nomic Threads. In Proceedingsof the 2014 ACM International Symposium on Wearable Computers: Adjunct Program(ISWC ’14 Adjunct). ACM, New York, NY, USA, 59–64.DOI: http://dx.doi.org/10.1145/2641248.2641281
237

BIBLIOGRAPHY
M. Kraak. 2003. The space-time cube revisited from a geovisualization perspective. In Pro-ceedings of the 21st International Cartographic Conference (ICC). 1988–1996.
D. Krannich, B. Robben, and S. Wilske. 2012. Digital Fabrication for Educational Contexts.In Proceedings of the 11th International Conference on Interaction Design and Children(IDC ’12). ACM, New York, NY, USA, 375–376.DOI: http://dx.doi.org/10.1145/2307096.2307174
M. F. Kreutzer. 2014. Interacting with Physical Visualizations on Tabletops. Bachelor’sthesis. LMU Munich.
K. J. Kruszynski and R. Liere. 2009. Tangible props for scientific visualization: concept,requirements, application. Virtual Reality 13, 4 (2009), 235–244.DOI: http://dx.doi.org/10.1007/s10055-009-0126-1
J. B. Krygier. 1994. Visualization in modern cartography. Elsevier Science Ltd, Oxford,UK., Chapter: Sound and geographic visualization, 149–166.
J. Kulla-Mader. 2007. Graphs via Ink: Understanding How the Amount of Non-data-ink ina Graph Affects Perception and Learning. Master’s thesis. Department of Information andLibrary Science, University of North Carolina.
H. Lam, P. Isenberg, T. Isenberg, and M. Sedlmair (Eds.). 2014. BELIV ’14: Proceedings ofthe Fifth Workshop on Beyond Time and Errors: Novel Evaluation Methods for Visualiza-tion. ACM, New York, NY, USA.
M. Lau, C. Weichel, and N. Villar. 2013. Workshop on Personal and Pervasive Fabrication(PerFab 2013). In Proceedings of the 2013 ACM Conference on Pervasive and UbiquitousComputing Adjunct Publication (UbiComp ’13 Adjunct). ACM, New York, NY, USA,939–944.DOI: http://dx.doi.org/10.1145/2494091.2499210
S. N. Le, S. J. Leow, T. V. Le-Nguyen, C. Ruiz, and K. L. Low. 2014. Surface and contour-preserving origamic architecture paper pop-ups. IEEE Transactions on Visualization andComputer Graphics 20, 2 (2014), 276–288.DOI: http://dx.doi.org/10.1109/TVCG.2013.108
E. C. Lechelt, J. Eliuk, and G. Tanne. 1976. Perceptual orientational asymmetries: A com-parison of visual and haptic space. Perception & Psychophysics 20, 6 (1976), 463–469.DOI: http://dx.doi.org/10.3758/BF03208283
E. C. Lechelt and A. Verenka. 1980. Spatial anisotropy in intramodal and cross-modal judg-ments of stimulus orientation: the stability of the oblique effect. Perception 9, 5 (1980),581–589.
S. J. Lederman and L. A. Jones. 2011. Tactile and Haptic Illusions. IEEE Transactions onHaptics 4, 4 (2011), 273–294.DOI: http://dx.doi.org/10.1109/TOH.2011.2
238

BIBLIOGRAPHY
S. J. Lederman and R. L. Klatzky. 1987. Hand movements: A window into haptic objectrecognition. Cognitive Psychology 19, 3 (1987), 342 – 368.DOI: http://dx.doi.org/10.1016/0010-0285(87)90008-9
S. J. Lederman and R. L. Klatzky. 2009a. Haptic perception: A tutorial. Attention, Percep-tion, & Psychophysics 71, 7 (2009), 1439–1459.DOI: http://dx.doi.org/10.3758/APP.71.7.1439
S. J. Lederman and R. L. Klatzky. 2009b. Human haptics. LR Squire (Ed. in Chief), Ency-clopedia of neuroscience 5 (2009), 11–18.
S. J. Lederman, C. Summers, and R. L. Klatzky. 1996. Cognitive salience of haptic objectproperties: role of modality-encoding bias. Perception 25, 8 (1996), 983–998.
B. Leduc-Mills, J. Dec, and J. Schimmel. 2013. Evaluating Accessibility in FabricationTools for Children. In Proceedings of the 12th International Conference on InteractionDesign and Children (IDC ’13). ACM, New York, NY, USA, 617–620.DOI: http://dx.doi.org/10.1145/2485760.2485882
B. Leduc-Mills and M. Eisenberg. 2011. The UCube: A Child-friendly Device for Introduc-tory Three-dimensional Design. In Proceedings of the 10th International Conference onInteraction Design and Children (IDC ’11). ACM, New York, NY, USA, 72–80.DOI: http://dx.doi.org/10.1145/1999030.1999039
B. Leduc-Mills, H. Profita, and M. Eisenberg. 2012. "Seeing Solids" via Patterns of Light:Evaluating a Tangible 3D-input Device. In Proceedings of the 11th International Confer-ence on Interaction Design and Children (IDC ’12). ACM, New York, NY, USA, 377–380.DOI: http://dx.doi.org/10.1145/2307096.2307176
B. Lee, P. Isenberg, N. Riche, and S. Carpendale. 2012. Beyond Mouse and Keyboard: Ex-panding Design Considerations for Information Visualization Interactions. IEEE Trans-actions on Visualization and Computer Graphics 18, 12 (2012), 2689–2698.DOI: http://dx.doi.org/10.1109/TVCG.2012.204
M.-H. Lee, S. Cha, and T.-J. Nam. 2015. Patina Engraver: Visualizing Activity Logs AsPatina in Fashionable Trackers. In Proceedings of the 33rd Annual ACM Conference onHuman Factors in Computing Systems (CHI ’15). ACM, New York, NY, USA, 1173–1182.DOI: http://dx.doi.org/10.1145/2702123.2702213
D. Leithinger, S. Follmer, A. Olwal, and H. Ishii. 2014. Physical Telepresence: ShapeCapture and Display for Embodied, Computer-mediated Remote Collaboration. In Pro-ceedings of the 27th Annual ACM Symposium on User Interface Software and Technology(UIST ’14). ACM, New York, NY, USA, 461–470.DOI: http://dx.doi.org/10.1145/2642918.2647377
239

BIBLIOGRAPHY
D. Leithinger, S. Follmer, A. Olwal, and H. Ishii. 2015. Shape Displays: Spatial Interactionwith Dynamic Physical Form. IEEE Computer Graphics and Applications 35, 5 (2015),5–11.DOI: http://dx.doi.org/10.1109/MCG.2015.111
D. Leithinger, D. Lakatos, A. DeVincenzi, M. Blackshaw, and H. Ishii. 2011. Direct andGestural Interaction with Relief: A 2.5D Shape Display. In Proceedings of the 24th AnnualACM Symposium on User Interface Software and Technology (UIST ’11). ACM, NewYork, NY, USA, 541–548.DOI: http://dx.doi.org/10.1145/2047196.2047268
M. Levoy, K. Pulli, B. Curless, S. Rusinkiewicz, D. Koller, L. Pereira, M. Ginzton, S. An-derson, J. Davis, J. Ginsberg, J. Shade, and D. Fulk. 2000. The Digital MichelangeloProject: 3D Scanning of Large Statues. In Proceedings of the 27th Annual Conference onComputer Graphics and Interactive Techniques (SIGGRAPH ’00). ACM Press/Addison-Wesley Publishing Co., New York, NY, USA, 131–144.DOI: http://dx.doi.org/10.1145/344779.344849
E. Levy, J. Zacks, B. Tversky, and D. Schiano. 1996. Gratuitous Graphics? Putting Pref-erences in Perspective. In Proceedings of the SIGCHI Conference on Human Factors inComputing Systems (CHI ’96). ACM, New York, NY, USA, 42–49.DOI: http://dx.doi.org/10.1145/238386.238400
I. Li, A. Dey, and J. Forlizzi. 2010. A Stage-based Model of Personal Informatics Systems.In Proceedings of the SIGCHI Conference on Human Factors in Computing Systems (CHI’10). ACM, New York, NY, USA, 557–566.DOI: http://dx.doi.org/10.1145/1753326.1753409
I. Li, A. K. Dey, and J. Forlizzi. 2011. Understanding My Data, Myself: Supporting Self-reflection with Ubicomp Technologies. In Proceedings of the 13th International Confer-ence on Ubiquitous Computing (UbiComp ’11). ACM, New York, NY, USA, 405–414.DOI: http://dx.doi.org/10.1145/2030112.2030166
X.-Y. Li, C.-H. Shen, S.-S. Huang, T. Ju, and S.-M. Hu. 2010. Popup: Automatic PaperArchitectures from 3D Models. ACM Transactions on Graphics 29, 4, Article 111 (July2010), Article 111, 9 pages.DOI: http://dx.doi.org/10.1145/1778765.1778848
H. W. Lin, L. Aflatoony, and R. Wakkary. 2014. Design for One: A Game Controller fora Quadriplegic Gamer. In CHI ’14 Extended Abstracts on Human Factors in ComputingSystems (CHI EA ’14). ACM, New York, NY, USA, 1243–1248.DOI: http://dx.doi.org/10.1145/2559206.2581334
J. J. Lin, L. Mamykina, S. Lindtner, G. Delajoux, and H. B. Strub. 2006. Fish’N’Steps:Encouraging Physical Activity with an Interactive Computer Game. In Proceedings of the8th International Conference on Ubiquitous Computing (UbiComp’06). Springer-Verlag,
240

BIBLIOGRAPHY
Berlin, Heidelberg, 261–278.DOI: http://dx.doi.org/10.1007/11853565_16
G. P. Locke, Edwin A.; Latham. 2002. Building a practically useful theory of goal settingand task motivation: A 35-year odyssey. American Psychologist 57, 9 (2002), 705–717.DOI: http://dx.doi.org/10.1037/0003-066X.57.9.705
X. Loeffelholz and P. Arnold. 2015. Collaborative Problem Solving with Physical Visual-izations. Project thesis. LMU Munich.
J. M. Loomis and S. J. Lederman. 1986. Tactual perception. John Wiley & Sons.
T. Ludwig, O. Stickel, A. Boden, and V. Pipek. 2014. Towards Sociable Technologies:An Empirical Study on Designing Appropriation Infrastructures for 3D Printing. In Pro-ceedings of the 2014 Conference on Designing Interactive Systems (DIS ’14). ACM, NewYork, NY, USA, 835–844.DOI: http://dx.doi.org/10.1145/2598510.2598528
A. MacEachren. 1995. How Maps Work: Representation, Visualization, and Design. Guil-ford Press.
J. Mackinlay. 1986. Automating the Design of Graphical Presentations of Relational Infor-mation. ACM Transactions on Graphics 5, 2 (1986), 110–141.DOI: http://dx.doi.org/10.1145/22949.22950
D. Mainstone. 2009. Addressing the Unexpected. In Proceedings of the Seventh ACM Con-ference on Creativity & Cognition (C&C ’09). ACM, New York, NY, USA, 475–476.DOI: http://dx.doi.org/10.1145/1640233.1640362
D. Marr. 1982. Vision: A computational investigation into the human representation andprocessing of visual information. W. H. Freeman and Company 2 (1982).
K. Marriott, H. Purchase, M. Wybrow, and C. Goncu. 2012. Memorability of Visual Featuresin Network Diagrams. IEEE Transactions on Visualization and Computer Graphics 18,12 (2012), 2477–2485.DOI: http://dx.doi.org/10.1109/TVCG.2012.245
P. Marshall. 2007. Do Tangible Interfaces Enhance Learning?. In Proceedings of the 1stInternational Conference on Tangible and Embedded Interaction (TEI ’07). ACM, NewYork, NY, USA, 163–170.DOI: http://dx.doi.org/10.1145/1226969.1227004
P. Marshall, A. Antle, E. van den Hoven, and Y. Rogers. 2013. Introduction to the SpecialIssue on the Theory and Practice of Embodied Interaction in HCI and Interaction Design.ACM Transactions on Computer-Human Interaction (TOCHI) 20, 1, Article 1 (2013), 3pages.DOI: http://dx.doi.org/10.1145/2442106.2442107
241

BIBLIOGRAPHY
P. Marshall, P. C.-H. Cheng, and R. Luckin. 2010. Tangibles in the Balance: A DiscoveryLearning Task with Physical or Graphical Materials. In Proceedings of the Fourth Inter-national Conference on Tangible, Embedded, and Embodied Interaction (TEI ’10). ACM,New York, NY, USA, 153–160.DOI: http://dx.doi.org/10.1145/1709886.1709914
S. C. Masin and L. Crestoni. 1988. Experimental demonstration of the sensory basis of thesize-weight illusion. Perception & Psychophysics 44, 4 (1988), 309–312.
T. H. Massie and J. K. Salisbury. 1994. The PHANToM haptic interface: A device for prob-ing virtual objects. In Proceedings of the ASME Dynamic Systems and Control Division.295–301.
M.-E. Maurer, A. De Luca, A. Hang, D. Hausen, F. Hennecke, S. Loehmann, H. Palleis, H.Richter, S. Stusak, A. Tabard, S. Tausch, E. von Zezschwitz, F. Schwamb, H. Hussmann,and A. Butz. 2013. Long-Term Experiences with an Iterative Design of a QR-Code-BasedPayment System for Beverages. In Human-Computer Interaction – INTERACT 2013:14th IFIP TC 13 International Conference, Cape Town, South Africa, September 2-6,2013, Proceedings, Part IV, Paula Kotzé, Gary Marsden, Gitte Lindgaard, Janet Wesson,and Marco Winckler (Eds.). Springer Berlin Heidelberg, Berlin, Heidelberg, 587–594.DOI: http://dx.doi.org/10.1007/978-3-642-40498-6_49
D. McGookin, E. Robertson, and S. Brewster. 2010. Clutching at Straws: Using TangibleInteraction to Provide Non-visual Access to Graphs. In Proceedings of the SIGCHI Con-ference on Human Factors in Computing Systems (CHI ’10). ACM, New York, NY, USA,1715–1724.DOI: http://dx.doi.org/10.1145/1753326.1753583
D. K. McGookin and S. A. Brewster. 2007. People and Computers XX — Engage: Pro-ceedings of HCI 2006. Springer London, London, Chapter: Graph Builder: ConstructingNon-visual Visualizations, 263–278.DOI: http://dx.doi.org/10.1007/978-1-84628-664-3_20
S. T. K. H. W. McLean, N.; Griffin. 2003. Family involvement in weight control, weightmaintenance and weight-loss interventions: A systematic review of randomised trials.International Journal of Obesity 27, 9 (2003), 987–1005.DOI: http://dx.doi.org/10.1038/sj.ijo.0802383
D. Mellis, S. Follmer, B. Hartmann, L. Buechley, and M. D. Gross. 2013. FAB at CHI:Digital Fabrication Tools, Design, and Community. In CHI ’13 Extended Abstracts onHuman Factors in Computing Systems (CHI EA ’13). ACM, New York, NY, USA, 3307–3310.DOI: http://dx.doi.org/10.1145/2468356.2479673
D. A. Mellis. 2013. Do-it-yourself Electronic Products and the People Who Make Them. InProceedings of the 7th International Conference on Tangible, Embedded and Embodied
242

BIBLIOGRAPHY
Interaction (TEI ’13). ACM, New York, NY, USA, 357–358.DOI: http://dx.doi.org/10.1145/2460625.2460692
D. A. Mellis and L. Buechley. 2012. Case Studies in the Personal Fabrication of Elec-tronic Products. In Proceedings of the Designing Interactive Systems Conference (DIS’12). ACM, New York, NY, USA, 268–277.DOI: http://dx.doi.org/10.1145/2317956.2317998
D. A. Mellis and L. Buechley. 2014. Do-it-yourself Cellphones: An Investigation into thePossibilities and Limits of High-tech Diy. In Proceedings of the SIGCHI Conference onHuman Factors in Computing Systems (CHI ’14). ACM, New York, NY, USA, 1723–1732.DOI: http://dx.doi.org/10.1145/2556288.2557309
D. A. Mellis, D. Gordon, and L. Buechley. 2011. Fab FM: The Design, Making, and Mod-ification of an Open-source Electronic Product. In Proceedings of the Fifth InternationalConference on Tangible, Embedded, and Embodied Interaction (TEI ’11). ACM, NewYork, NY, USA, 81–84.DOI: http://dx.doi.org/10.1145/1935701.1935718
D. A. Mellis, S. Jacoby, L. Buechley, H. Perner-Wilson, and J. Qi. 2013. Microcontrollers AsMaterial: Crafting Circuits with Paper, Conductive Ink, Electronic Components, and an"Untoolkit". In Proceedings of the 7th International Conference on Tangible, Embeddedand Embodied Interaction (TEI ’13). ACM, New York, NY, USA, 83–90.DOI: http://dx.doi.org/10.1145/2460625.2460638
M. Mikubo, K. Tsukada, and I. Siio. 2013. AcrySense: Interactive Carved Acrylic Board.In Proceedings of the 2013 ACM Conference on Pervasive and Ubiquitous ComputingAdjunct Publication (UbiComp ’13 Adjunct). ACM, New York, NY, USA, 1–4.DOI: http://dx.doi.org/10.1145/2494091.2494093
D. Miller. 1987. Material Culture and Mass Consumption. B. Blackwell.
D. Miller. 2008. The Comfort of Things. Wiley.
D. Miller. 2010. Stuff. Wiley.
J. Minogue and M. G. Jones. 2006. Haptics in education: Exploring an untapped sensorymodality. Review of Educational Research 76, 3 (2006), 317–348.
A. V. Moere, M. Tomitsch, C. Wimmer, B. Christoph, and T. Grechenig. 2012. Evaluatingthe Effect of Style in Information Visualization. IEEE Transactions on Visualization andComputer Graphics 18, 12 (2012), 2739–2748.DOI: http://dx.doi.org/10.1109/TVCG.2012.221
M. Montessori. 1964. The Montessori method. Schocken Books.
243
BIBLIOGRAPHY
A. Moraiti, V. Vanden Abeele, E. Vanroye, and L. Geurts. 2015. Empowering OccupationalTherapists with a DIY-toolkit for Smart Soft Objects. In Proceedings of the Ninth Inter-national Conference on Tangible, Embedded, and Embodied Interaction (TEI ’15). ACM,New York, NY, USA, 387–394.DOI: http://dx.doi.org/10.1145/2677199.2680598
J. L. Morrison. 1974. A theoretical framework for cartographic generalization with emphasison the process of symbolization. In International Yearbook of Cartography, Vol. 14. 115–127.
C. Mota. 2011. The Rise of Personal Fabrication. In Proceedings of the 8th ACM Conferenceon Creativity & Cognition (C&C ’11). ACM, New York, NY, USA, 279–288.DOI: http://dx.doi.org/10.1145/2069618.2069665
S. Mueller, M. Fritzsche, J. Kossmann, M. Schneider, J. Striebel, and P. Baudisch. 2015.Scotty: Relocating Physical Objects Across Distances Using Destructive Scanning, En-cryption, and 3D Printing. In Proceedings of the Ninth International Conference on Tan-gible, Embedded, and Embodied Interaction (TEI ’15). ACM, New York, NY, USA, 233–240.DOI: http://dx.doi.org/10.1145/2677199.2680547
S. Mueller, S. Im, S. Gurevich, A. Teibrich, L. Pfisterer, F. Guimbretière, and P. Baudisch.2014a. WirePrint: 3D Printed Previews for Fast Prototyping. In Proceedings of the 27thAnnual ACM Symposium on User Interface Software and Technology (UIST ’14). ACM,New York, NY, USA, 273–280.DOI: http://dx.doi.org/10.1145/2642918.2647359
S. Mueller, A. Ion, and P. Baudisch. 2014b. Tutorial: Hot Topics in Personal Fabrication Re-search. In Proceedings of the Ninth ACM International Conference on Interactive Table-tops and Surfaces (ITS ’14). ACM, New York, NY, USA, 499–502.DOI: http://dx.doi.org/10.1145/2669485.2669633
S. Mueller, B. Kruck, and P. Baudisch. 2013. LaserOrigami: Laser-cutting 3D Objects. InProceedings of the SIGCHI Conference on Human Factors in Computing Systems (CHI’13). ACM, New York, NY, USA, 2585–2592.DOI: http://dx.doi.org/10.1145/2470654.2481358
S. Mueller, P. Lopes, and P. Baudisch. 2012. Interactive Construction: Interactive Fabrica-tion of Functional Mechanical Devices. In Proceedings of the 25th Annual ACM Sympo-sium on User Interface Software and Technology (UIST ’12). ACM, New York, NY, USA,599–606.DOI: http://dx.doi.org/10.1145/2380116.2380191
S. Mueller, P. Lopes, K. Kaefer, B. Kruck, and P. Baudisch. 2013. Constructable: Interac-tive Construction of Functional Mechanical Devices. In CHI ’13 Extended Abstracts on
244
BIBLIOGRAPHY
Human Factors in Computing Systems (CHI EA ’13). ACM, New York, NY, USA, 3107–3110.DOI: http://dx.doi.org/10.1145/2468356.2479622
S. Mueller, T. Mohr, K. Guenther, J. Frohnhofen, and P. Baudisch. 2014. faBrickation: Fast3D Printing of Functional Objects by Integrating Construction Kit Building Blocks. InProceedings of the SIGCHI Conference on Human Factors in Computing Systems (CHI’14). ACM, New York, NY, USA, 3827–3834.DOI: http://dx.doi.org/10.1145/2556288.2557005
E. Mugellini, E. Rubegni, S. Gerardi, and O. A. Khaled. 2007. Using Personal ObjectsAs Tangible Interfaces for Memory Recollection and Sharing. In Proceedings of the 1stInternational Conference on Tangible and Embedded Interaction (TEI ’07). ACM, NewYork, NY, USA, 231–238.DOI: http://dx.doi.org/10.1145/1226969.1227016
S. A. Munson and S. Consolvo. 2012. Exploring goal-setting, rewards, self-monitoring, andsharing to motivate physical activity. In Proceedings of the 6th International Conferenceon Pervasive Computing Technologies for Healthcare (PervasiveHealth) and Workshops.25–32.DOI: http://dx.doi.org/10.4108/icst.pervasivehealth.2012.248691
T. Munzner. 2008. Information Visualization: Human-Centered Issues and Perspectives.Springer Berlin Heidelberg, Berlin, Heidelberg, Chapter: Process and Pitfalls in WritingInformation Visualization Research Papers, 134–153.DOI: http://dx.doi.org/10.1007/978-3-540-70956-5_6
T. Munzner. 2014. Visualization Analysis and Design. CRC Press.
T. Munzner. 2016. On Conventions between Fields in Experimental Design and Anyl-ysis. Blog post. (2016). https://tamaramunzner.wordpress.com/2016/01/16/on-conventions-between-fields-in-experimental-design-and-analysis/
D. J. Murray, R. R. Ellis, C. A. Bandomir, and H. E. Ross. 1999. Charpentier (1891) on thesize—weight illusion. Perception & Psychophysics 61, 8 (1999), 1681–1685.DOI: http://dx.doi.org/10.3758/BF03213127
J. R. Napier. 1956. The prehensile movements of the human hand. The Journal of bone andjoint surgery. British volume 38, 4 (1956), 902–913.
R. Niiyama, X. Sun, L. Yao, H. Ishii, D. Rus, and S. Kim. 2015. Sticky Actuator: Free-Form Planar Actuators for Animated Objects. In Proceedings of the Ninth InternationalConference on Tangible, Embedded, and Embodied Interaction (TEI ’15). ACM, NewYork, NY, USA, 77–84.DOI: http://dx.doi.org/10.1145/2677199.2680600
245

BIBLIOGRAPHY
R. Niiyama, L. Yao, and H. Ishii. 2013. Weight and Volume Changing Device with LiquidMetal Transfer. In Proceedings of the 8th International Conference on Tangible, Embed-ded and Embodied Interaction (TEI ’14). ACM, New York, NY, USA, 49–52.DOI: http://dx.doi.org/10.1145/2540930.2540953
B. Nissen and J. Bowers. 2015. Data-Things: Digital Fabrication Situated Within Partici-patory Data Translation Activities. In Proceedings of the 33rd Annual ACM Conferenceon Human Factors in Computing Systems (CHI ’15). ACM, New York, NY, USA, 2467–2476.DOI: http://dx.doi.org/10.1145/2702123.2702245
B. Nissen, J. Bowers, P. Wright, J. Hook, and C. Newell. 2014. Volvelles, Domes andWristbands: Embedding Digital Fabrication Within a Visitor’s Trajectory of Engagement.In Proceedings of the 2014 Conference on Designing Interactive Systems (DIS ’14). ACM,New York, NY, USA, 825–834.DOI: http://dx.doi.org/10.1145/2598510.2598524
D. A. Norman. 2002. The Design of Everyday Things (reprint ed.). Basic Books.
P. Nurkka and S. Jumisko-Pyykkö. 2014. Exploring Online Customization of a High In-volvement Experience Product. In Proceedings of the 26th Australian Computer-HumanInteraction Conference on Designing Futures: The Future of Design (OzCHI ’14). ACM,New York, NY, USA, 505–514.DOI: http://dx.doi.org/10.1145/2686612.2686692
L. Oehlberg, W. Willett, and W. E. Mackay. 2015. Patterns of Physical Design Remixingin Online Maker Communities. In Proceedings of the 33rd Annual ACM Conference onHuman Factors in Computing Systems (CHI ’15). ACM, New York, NY, USA, 639–648.DOI: http://dx.doi.org/10.1145/2702123.2702175
R. Ohno. 1979. Visual perception of texture: development of a scale of the perceived surfaceroughness of building materials. In Proceedings of the 11th Annual Conference of theEnvironmental Design Research Association, Vol. 11. Center for Architecture and UrbanPlanning Research, University of Wisconsin–Milwaukee, 193–200.
S. Okamura and T. Igarashi. 2009. Smart Graphics: 10th International Symposium, SG2009, Salamanca, Spain, May 28-30, 2009. Proceedings. Springer Berlin Heidelberg,Berlin, Heidelberg, Chapter: An Interface for Assisting the Design and Production ofPop-Up Card, 68–78.DOI: http://dx.doi.org/10.1007/978-3-642-02115-2_6
S. Olberding, N.-W. Gong, J. Tiab, J. A. Paradiso, and J. Steimle. 2013. A Cuttable Multi-touch Sensor. In Proceedings of the 26th Annual ACM Symposium on User Interface Soft-ware and Technology (UIST ’13). ACM, New York, NY, USA, 245–254.DOI: http://dx.doi.org/10.1145/2501988.2502048
246

BIBLIOGRAPHY
S. Olberding, M. Wessely, and J. Steimle. 2014. PrintScreen: Fabricating Highly Customiz-able Thin-film Touch-displays. In Proceedings of the 27th Annual ACM Symposium onUser Interface Software and Technology (UIST ’14). ACM, New York, NY, USA, 281–290.DOI: http://dx.doi.org/10.1145/2642918.2647413
B. D. Olsen, K. S. Zhbanova, H. Parpucu, Z. Alkouri, and A. C. Rule. 2013. Pop-Up Con-structions Motivate and Reinforce Science Learning for Upper Elementary Students. Sci-ence Activities: Classroom Projects and Curriculum Ideas 50, 4 (2013), 119–133.DOI: http://dx.doi.org/10.1080/00368121.2013.846899
C. O’Malley and D. Stanton Fraser. 2004. Literature Review in Learning with TangibleTechnologies. Discussion paper. FutureLab.
J. Ou, L. Yao, D. Tauber, J. Steimle, R. Niiyama, and H. Ishii. 2013. jamSheets: ThinInterfaces with Tunable Stiffness Enabled by Layer Jamming. In Proceedings of the 8thInternational Conference on Tangible, Embedded and Embodied Interaction (TEI ’14).ACM, New York, NY, USA, 65–72.DOI: http://dx.doi.org/10.1145/2540930.2540971
K. Ozawa, F. Terauchi, M. Kubo, H. Aoki, and T. Suzuki. 1996. Effect of Light Source onVisual Image of Wood Surface. Bulletin of JSSD (1996).
S. Panëels and J. C. Roberts. 2010. Review of Designs for Haptic Data Visualization. IEEETransactions on Haptics 3, 2 (2010), 119–137.DOI: http://dx.doi.org/10.1109/TOH.2009.44
Y.-W. Park, J. Park, and T.-J. Nam. 2015. The Trial of Bendi in a Coffeehouse: Use of aShape-Changing Device for a Tactile-Visual Phone Conversation. In Proceedings of the33rd Annual ACM Conference on Human Factors in Computing Systems (CHI ’15). ACM,New York, NY, USA, 2181–2190.DOI: http://dx.doi.org/10.1145/2702123.2702326
C. Parraman and S. Adams-Foster. 2011. Traditional Approaches Using New Technologies:Case Studies of Printed Wallpaper Using UV Inkjet Printing. In Procedings of the SecondConference on Creativity and Innovation in Design (DESIRE ’11). ACM, New York, NY,USA, 297–306.DOI: http://dx.doi.org/10.1145/2079216.2079258
W. Pease. 1952. An automatic machine tool. Scientific American 187 (1952), 101–112.DOI: http://dx.doi.org/10.1038/scientificamerican0952-101
H. Peng, J. Mankoff, S. E. Hudson, and J. McCann. 2015a. A Layered Fabric 3D Printer forSoft Interactive Objects. In Proceedings of the 33rd Annual ACM Conference on HumanFactors in Computing Systems (CHI ’15). ACM, New York, NY, USA, 1789–1798.DOI: http://dx.doi.org/10.1145/2702123.2702327
247
BIBLIOGRAPHY
H. Peng, A. Zoran, and F. V. Guimbretière. 2015b. D-Coil: A Hands-on Approach to Digital3D Models Design. In Proceedings of the 33rd Annual ACM Conference on Human Fac-tors in Computing Systems (CHI ’15). ACM, New York, NY, USA, 1807–1815.DOI: http://dx.doi.org/10.1145/2702123.2702381
D. Petrelli, S. Whittaker, and J. Brockmeier. 2008. AutoTopography: What Can PhysicalMementos Tell Us About Digital Memories?. In Proceedings of the SIGCHI Conferenceon Human Factors in Computing Systems (CHI ’08). ACM, New York, NY, USA, 53–62.DOI: http://dx.doi.org/10.1145/1357054.1357065
B. Piper, C. Ratti, and H. Ishii. 2002. Illuminating Clay: A 3-D Tangible Interface forLandscape Analysis. In Proceedings of the SIGCHI Conference on Human Factors inComputing Systems (CHI ’02). ACM, New York, NY, USA, 355–362.DOI: http://dx.doi.org/10.1145/503376.503439
M. A. Plaisier and A. M. L. Kappers. 2010. Cold Objects Pop Out! In Haptics: Gen-erating and Perceiving Tangible Sensations, A. M. L. Kappers, J. B. F. van Erp, W. M.Bergmann Tiest, and F. C. T. van der Helm (Eds.). Lecture Notes in Computer Science,Vol. 6192. Springer Berlin Heidelberg, 219–224.DOI: http://dx.doi.org/10.1007/978-3-642-14075-4_31
M. A. Plaisier, W. M. B. Tiest, and A. M. L. Kappers. 2008a. Haptic pop-out in a handsweep. Acta Psychologica 128, 2 (2008), 368–377.DOI: http://dx.doi.org/10.1016/j.actpsy.2008.03.011
M. A. Plaisier, W. M. B. Tiest, and A. M. L. Kappers. 2008b. Haptic Search for Spheresand Cubes. In Haptics: Perception, Devices and Scenarios, Manuel Ferre (Ed.). LectureNotes in Computer Science, Vol. 5024. Springer Berlin Heidelberg, 275–282.DOI: http://dx.doi.org/10.1007/978-3-540-69057-3_32
M. A. Plaisier, W. M. B. Tiest, and A. M. L. Kappers. 2009. Salient features in 3-D hapticshape perception. Attention, Perception, & Psychophysics 71, 2 (2009), 421–430.DOI: http://dx.doi.org/10.3758/APP.71.2.421
W. Playfair. 1786. Commercial and political atlas: Representing, by copper-plate charts, theprogress of the commerce, revenues, expenditure, and debts of England, during the wholeof the eighteenth century. Corry, London. Republished in The Commercial and PoliticalAtlas and Statistical Breviary (1786).
W. Playfair. 1801. Commercial and political atlas and statistical breviary. New York:Cambridge University Press.
I. Posch and G. Fitzpatrick. 2012. First Steps in the FabLab: Experiences Engaging Children.In Proceedings of the 24th Australian Computer-Human Interaction Conference (OzCHI’12). ACM, New York, NY, USA, 497–500.DOI: http://dx.doi.org/10.1145/2414536.2414612
248

BIBLIOGRAPHY
I. Poupyrev, T. Nashida, S. Maruyama, J. Rekimoto, and Y. Yamaji. 2004. Lumen: Interac-tive Visual and Shape Display for Calm Computing. In ACM SIGGRAPH 2004 EmergingTechnologies (SIGGRAPH ’04). ACM, New York, NY, USA, 17–17.DOI: http://dx.doi.org/10.1145/1186155.1186173
Z. Pousman, J. Stasko, and M. Mateas. 2007. Casual Information Visualization: Depictionsof Data in Everyday Life. IEEE Transactions on Visualization and Computer Graphics13, 6 (2007), 1145–1152.DOI: http://dx.doi.org/10.1109/TVCG.2007.70541
S. Price, Y. Rogers, M. Scaife, D. Stanton, and H. Neale. 2003. Using ‘tangibles’ to promotenovel forms of playful learning. Interacting with Computers 15, 2 (2003), 169–185.DOI: http://dx.doi.org/10.1016/S0953-5438(03)00006-7
J. O. Prochaska and W. F. Velicer. 1997. The Transtheoretical Model of Health BehaviorChange. American Journal of Health Promotion 12, 1 (1997), 38–48.DOI: http://dx.doi.org/10.4278/0890-1171-12.1.38 PMID: 10170434.
S. Purpura, V. Schwanda, K. Williams, W. Stubler, and P. Sengers. 2011. Fit4Life: TheDesign of a Persuasive Technology Promoting Healthy Behavior and Ideal Weight. InProceedings of the SIGCHI Conference on Human Factors in Computing Systems (CHI’11). ACM, New York, NY, USA, 423–432.DOI: http://dx.doi.org/10.1145/1978942.1979003
J. Qi and L. Buechley. 2012. Animating Paper Using Shape Memory Alloys. In Proceedingsof the SIGCHI Conference on Human Factors in Computing Systems (CHI ’12). ACM,New York, NY, USA, 749–752.DOI: http://dx.doi.org/10.1145/2207676.2207783
R. Raskar, G. Welch, K.-L. Low, and D. Bandyopadhyay. 2001. Shader Lamps: Animat-ing Real Objects With Image-Based Illumination. In Proceedings of the 12th Eurograph-ics Workshop on Rendering Techniques, Steven J. Gortler and Karol Myszkowski (Eds.).Springer Vienna, London, UK, UK, 89–102.DOI: http://dx.doi.org/10.1007/978-3-7091-6242-2_9
M. K. Rasmussen, E. W. Pedersen, M. G. Petersen, and K. Hornbæk. 2012. Shape-changingInterfaces: A Review of the Design Space and Open Research Questions. In Proceedingsof the SIGCHI Conference on Human Factors in Computing Systems (CHI ’12). ACM,New York, NY, USA, 735–744.DOI: http://dx.doi.org/10.1145/2207676.2207781
O. Redlich. 1970. Intensive and extensive properties. Journal of Chemical Education 47, 2(1970).DOI: http://dx.doi.org/10.1021/ed047p154.2
249
BIBLIOGRAPHY
T. Regan, D. Sweeney, J. Helmes, V. Vlachokyriakos, S. Lindley, and A. Taylor. 2015. De-signing Engaging Data in Communities. In Proceedings of the 33rd Annual ACM Confer-ence Extended Abstracts on Human Factors in Computing Systems (CHI EA ’15). ACM,New York, NY, USA, 271–274.DOI: http://dx.doi.org/10.1145/2702613.2725432
H. Richter. 2013. Remote tactile feedback on interactive surfaces. Ph.D. Dissertation.Ludwig-Maximilians-Universität München.
J. Rifkin. 2011. The Third Industrial Revolution: How Lateral Power Is Transforming En-ergy, the Economy, and the World. Palgrave Macmillan.
G. Rinkenauer, S. Mattes, and R. Ulrich. 1999. The surface—weight illusion: On the con-tribution of grip force to perceived heaviness. Perception & Psychophysics 61, 1 (1999),23–30.DOI: http://dx.doi.org/10.3758/BF03211946
J. Roberts and R. Walker. 2010. Using all our senses: the need for a unified theoreticalapproach to multi-sensory information visualization. In IEEE VisWeek 2010 Workshop:The Role of Theory in Information Visualization.
J. C. Roberts, P. D. Ritsos, S. K. Badam, D. Brodbeck, J. Kennedy, and N. Elmqvist. 2014.Visualization beyond the Desktop–the Next Big Thing. IEEE Computer Graphics andApplications 34, 6 (2014), 26–34.DOI: http://dx.doi.org/10.1109/MCG.2014.82
Y. Rogers. 2011. Interaction Design Gone Wild: Striving for Wild Theory. interactions 18,4 (2011), 58–62.DOI: http://dx.doi.org/10.1145/1978822.1978834
Y. Rogers, W. R. Hazlewood, P. Marshall, N. Dalton, and S. Hertrich. 2010. AmbientInfluence: Can Twinkly Lights Lure and Abstract Representations Trigger BehavioralChange?. In Proceedings of the 12th ACM International Conference on Ubiquitous Com-puting (UbiComp ’10). ACM, New York, NY, USA, 261–270.DOI: http://dx.doi.org/10.1145/1864349.1864372
Y. Rogers and G. Marsden. 2013. Does He Take Sugar?: Moving Beyond the Rhetoric ofCompassion. interactions 20, 4 (2013), 48–57.DOI: http://dx.doi.org/10.1145/2486227.2486238
Y. Rogers, M. Scaife, S. Gabrielli, H. Smith, and E. Harris. 2002. A Conceptual Frameworkfor Mixed Reality Environments: Designing Novel Learning Activities for Young Chil-dren. Presence: Teleoperators and Virtual Environments 11, 6 (2002), 677–686.DOI: http://dx.doi.org/10.1162/105474602321050776
250

BIBLIOGRAPHY
D. K. Rosner, M. Ikemiya, and T. Regan. 2015. Resisting Alignment: Code and Clay. InProceedings of the Ninth International Conference on Tangible, Embedded, and EmbodiedInteraction (TEI ’15). ACM, New York, NY, USA, 181–188.DOI: http://dx.doi.org/10.1145/2677199.2680587
J. Rowell and S. Ungar. 2003a. The world of touch: an international survey of tactile maps.Part 1: production. British Journal of Visual Impairment 21, 3 (2003), 98–104.DOI: http://dx.doi.org/10.1177/026461960302100303
J. Rowell and S. Ungar. 2003b. The world of touch: an international survey of tactile maps.Part 2: design. British Journal of Visual Impairment 21, 3 (2003), 105–110.DOI: http://dx.doi.org/10.1177/026461960302100304
C. R. Ruiz, S. N. Le, J. Yu, and K.-L. Low. 2014. Multi-style paper pop-up designs from 3Dmodels. Computer Graphics Forum 33, 2 (2014), 487–496.DOI: http://dx.doi.org/10.1111/cgf.12320
D. Saakes, T. Cambazard, J. Mitani, and T. Igarashi. 2013. PacCAM: Material Capture andInteractive 2D Packing for Efficient Material Usage on CNC Cutting Machines. In Pro-ceedings of the 26th Annual ACM Symposium on User Interface Software and Technology(UIST ’13). ACM, New York, NY, USA, 441–446.DOI: http://dx.doi.org/10.1145/2501988.2501990
J. R. Sampson. 1970. Free recall of verbal and non-verbal stimuli. Quarterly Journal ofExperimental Psychology 22, 2 (1970), 215–221.DOI: http://dx.doi.org/10.1080/00335557043000140
A. Sarda, R. Deterre, and C. Vergneault. 2004. Heat perception measurements of the differ-ent parts found in a car passenger compartment. Measurement 35, 1 (2004), 65–75.DOI: http://dx.doi.org/10.1016/j.measurement.2003.08.018
J. Sarik, C. T. Li, and I. Kymissis. 2012. Fabricating Electronics with Rapid PrototypingTools. In Proceedings of the Sixth International Conference on Tangible, Embedded andEmbodied Interaction (TEI ’12). ACM, New York, NY, USA, 339–342.DOI: http://dx.doi.org/10.1145/2148131.2148212
F. Sauka. 2014. Physical Activity Sculptures. Master’s thesis. LMU Munich.
G. Saul, M. Lau, J. Mitani, and T. Igarashi. 2011a. SketchChair: An All-in-one Chair DesignSystem for End Users. In Proceedings of the Fifth International Conference on Tangible,Embedded, and Embodied Interaction (TEI ’11). ACM, New York, NY, USA, 73–80.DOI: http://dx.doi.org/10.1145/1935701.1935717
G. Saul, M. Lau, J. Mitani, and T. Igarashi. 2011b. SketchChair (Studio at TEI ’11). InProceedings of the Fifth International Conference on Tangible, Embedded, and EmbodiedInteraction (TEI ’11). ACM, New York, NY, USA, 357–360.DOI: http://dx.doi.org/10.1145/1935701.1935785
251

BIBLIOGRAPHY
G. Saul, T. Rorke, H. Peng, and C. Xu. 2013. Make Your Own Piccolo. In Proceedings ofthe 7th International Conference on Tangible, Embedded and Embodied Interaction (TEI’13). ACM, New York, NY, USA, 439–442.DOI: http://dx.doi.org/10.1145/2460625.2460723
V. Savage, C. Chang, and B. Hartmann. 2013. Sauron: Embedded Single-camera Sensing ofPrinted Physical User Interfaces. In Proceedings of the 26th Annual ACM Symposium onUser Interface Software and Technology (UIST ’13). ACM, New York, NY, USA, 447–456.DOI: http://dx.doi.org/10.1145/2501988.2501992
V. Savage, R. Schmidt, T. Grossman, G. Fitzmaurice, and B. Hartmann. 2014. A Series ofTubes: Adding Interactivity to 3D Prints Using Internal Pipes. In Proceedings of the 27thAnnual ACM Symposium on User Interface Software and Technology (UIST ’14). ACM,New York, NY, USA, 3–12.DOI: http://dx.doi.org/10.1145/2642918.2647374
A. Schefner. 2014. Using Paper Engineering for Information Visualization. Bachelor’sthesis. LMU Munich.
B. Schindler. 2014. Swirly - An Interactive Liquid Data Visualization. Bachelor’s thesis.LMU Munich.
D. Schmandt-Besserat. 1986. An ancient token system: The precursor to numerals andwriting. Archaeology 39, 6 (1986), 32–39.
D. Schmandt-Besserat. 2010. How writing came about. University of Texas Press.
S. Schneegass, A. Sahami Shirazi, T. Döring, D. Schmid, and A. Schmidt. 2014. NatCut: AnInteractive Tangible Editor for Physical Object Fabrication. In CHI ’14 Extended Abstractson Human Factors in Computing Systems (CHI EA ’14). ACM, New York, NY, USA,1441–1446.DOI: http://dx.doi.org/10.1145/2559206.2581189
B. Schneider, P. Jermann, G. Zufferey, and P. Dillenbourg. 2011. Benefits of a TangibleInterface for Collaborative Learning and Interaction. IEEE Transactions on LearningTechnologies 4, 3 (2011), 222–232.DOI: http://dx.doi.org/10.1109/TLT.2010.36
B. Schneider, M. Strait, L. Muller, S. Elfenbein, O. Shaer, and C. Shen. 2012. Phylo-Genie: Engaging Students in Collaborative ’Tree-thinking’ Through Tabletop Techniques.In Proceedings of the SIGCHI Conference on Human Factors in Computing Systems (CHI’12). ACM, New York, NY, USA, 3071–3080.DOI: http://dx.doi.org/10.1145/2207676.2208720
D. Schön. 1983. The Reflective Practitioner: How Professionals Think in Action. BasicBooks.
252

BIBLIOGRAPHY
M. Schonlau and E. Peters. 2012. Comprehension of Graphs and Tables Depend on theTask: Empirical Evidence from Two Web-Based Studies. RAND Working Paper SeriesNo. WR- 618. In Statistics, Politics, and Policy, Vol. 3.DOI: http://dx.doi.org/10.1515/2151-7509.1054
J. Schwarz. 2014. Evaluating the Memorability of Phyiscal Visualizations. Master’s thesis.LMU Munich.
E. Schweikardt, N. Elumeze, M. Eisenberg, and M. D. Gross. 2009. A Tangible ConstructionKit for Exploring Graph Theory. In Proceedings of the 3rd International Conference onTangible and Embedded Interaction (TEI ’09). ACM, New York, NY, USA, 373–376.DOI: http://dx.doi.org/10.1145/1517664.1517739
K. G. Scott. 1967. Clustering with perceptual and symbolic stimuli in free recall. Journal ofVerbal Learning and Verbal Behavior 6, 6 (1967), 864–866.
H. Segerman. 2012. 3D Printing for Mathematical Visualisation. The Mathematical Intelli-gencer 34, 4 (2012), 56–62.DOI: http://dx.doi.org/10.1007/s00283-012-9319-7
S. Seidel and J. C. Recker. 2009. Using grounded theory for studying business process man-agement phenomena. In The 17th European Conference on Information Systems, Marcode Marco, Claudia Loebecke, and Leslie Willcocks (Eds.). Association for InformationSystems, Faculty of Economics of the University of Verona, Verona.
R. Sennett. 2008. The Craftsman. Yale University Press.
O. Shaer and E. Hornecker. 2010. Tangible User Interfaces: Past, Present, and Future Direc-tions. Foundations and Trends in Human-Computer Interaction 3, 1–2 (2010), 1–137.DOI: http://dx.doi.org/10.1561/1100000026
Y. Shen, K. Dou, and J. Gu. 2013. RoCuModel: An Iterative Tangible Modeling System. InProceedings of the 8th International Conference on Tangible, Embedded and EmbodiedInteraction (TEI ’14). ACM, New York, NY, USA, 73–76.DOI: http://dx.doi.org/10.1145/2540930.2540960
R. Shewbridge, A. Hurst, and S. K. Kane. 2014. Everyday Making: Identifying FutureUses for 3D Printing in the Home. In Proceedings of the 2014 Conference on DesigningInteractive Systems (DIS ’14). ACM, New York, NY, USA, 815–824.DOI: http://dx.doi.org/10.1145/2598510.2598544
B. Shneiderman. 1996. The eyes have it: a task by data type taxonomy for informationvisualizations. In Proceedings of IEEE Symposium on Visual Languages. 336–343.DOI: http://dx.doi.org/10.1109/VL.1996.545307
B. Shneiderman. 2003. Why not make interfaces better than 3D reality? IEEE ComputerGraphics and Applications 23, 6 (2003), 12–15.DOI: http://dx.doi.org/10.1109/MCG.2003.1242376
253

BIBLIOGRAPHY
M. Siegrist. 1996. The use or misuse of three-dimensional graphs to represent lower-dimensional data. Behaviour & Information Technology 15, 2 (1996), 96–100.DOI: http://dx.doi.org/10.1080/014492996120300
D. Skau, L. Harrison, and R. Kosara. 2015. An Evaluation of the Impact of Visual Embel-lishments in Bar Charts. Computer Graphics Forum 34, 3 (2015), 221–230.DOI: http://dx.doi.org/10.1111/cgf.12634
D. Skau and R. Kosara. 2016. Arcs, Angles, or Areas: Individual Data Encodings in Pie andDonut Charts. Computer Graphics Forum 35, 3 (2016), 121–130.DOI: http://dx.doi.org/10.1111/cgf.12888
T. Skog, S. Ljungblad, and L. Holmquist. 2003. Between aesthetics and utility: designingambient information visualizations. In Proceedings of IEEE Symposium on InformationVisualization. 233–240.DOI: http://dx.doi.org/10.1109/INFVIS.2003.1249031
H. Song, F. Guimbretière, C. Hu, and H. Lipson. 2006. ModelCraft: Capturing FreehandAnnotations and Edits on Physical 3D Models. In Proceedings of the 19th Annual ACMSymposium on User Interface Software and Technology (UIST ’06). ACM, New York, NY,USA, 13–22.DOI: http://dx.doi.org/10.1145/1166253.1166258
I. Spence. 1990. Visual psychophysics of simple graphical elements. Journal of Experimen-tal Psychology: Human Perception and Performance 16, 4 (1990), 683–692.DOI: http://dx.doi.org/10.1037/0096-1523.16.4.683
A. Spencer. 2005. DIY: The Rise of Lo-fi Culture. Marion Boyars.
M. Spindler, W. Büschel, and R. Dachselt. 2012. Use Your Head: Tangible Windows for 3DInformation Spaces in a Tabletop Environment. In Proceedings of the 2012 ACM Interna-tional Conference on Interactive Tabletops and Surfaces (ITS ’12). ACM, New York, NY,USA, 245–254.DOI: http://dx.doi.org/10.1145/2396636.2396674
M. Spindler, C. Tominski, H. Schumann, and R. Dachselt. 2010. Tangible Views for In-formation Visualization. In ACM International Conference on Interactive Tabletops andSurfaces (ITS ’10). ACM, New York, NY, USA, 157–166.DOI: http://dx.doi.org/10.1145/1936652.1936684
M. Srinivasan and R. LaMotte. 1996. Tactual discrimination of softness: abilities and mech-anisms. In Somesthesis and the Neurobiology of the Somatosensory Cortex, O. Franzén,R. Johansson, and L. Terenius (Eds.). Birkhäuser Basel, 123–135.DOI: http://dx.doi.org/10.1007/978-3-0348-9016-8_11
254

BIBLIOGRAPHY
G. S. Stager. 2013. Papert’s Prison Fab Lab: Implications for the Maker Movement andEducation Design. In Proceedings of the 12th International Conference on InteractionDesign and Children (IDC ’13). ACM, New York, NY, USA, 487–490.DOI: http://dx.doi.org/10.1145/2485760.2485811
D. Stanton, V. Bayon, H. Neale, A. Ghali, S. Benford, S. Cobb, R. Ingram, C. O’Malley,J. Wilson, and T. Pridmore. 2001. Classroom Collaboration in the Design of TangibleInterfaces for Storytelling. In Proceedings of the SIGCHI Conference on Human Factorsin Computing Systems (CHI ’01). ACM, New York, NY, USA, 482–489.DOI: http://dx.doi.org/10.1145/365024.365322
M. Stefaner. 2014. Data Cuisine. Website. (2014). http://data-cuisine.net/ - Ac-cessed: 2015-12-15.
J. Stevens. 1979. Thermal intensification of touch sensation: further extensions of the Weberphenomenon. Sensory processes 3, 3 (1979), 240—248.
C. Stolte, D. Tang, and P. Hanrahan. 2003. Multiscale visualization using data cubes. IEEETransactions on Visualization and Computer Graphics 9, 2 (2003), 176–187.DOI: http://dx.doi.org/10.1109/TVCG.2003.1196005
L. Streppel. 2014. Evaluating Layered Physical Visualizations. Bachelor’s thesis. LMUMunich.
S. Stusak. 2014. Interacting with Layered Physical Visualizations on Tabletops. In Work-In-Progress in conjunction with the 8th ACM Conference on Tangible, Embedded andEmbodied Interaction (TEI ’14), February 16-19, 2014, Munich, Germany. (TEI ’14).ACM, New York, NY, USA. 5 pages.
S. Stusak. 2015. Exploring the Potential of Physical Visualizations. In Proceedings of theNinth International Conference on Tangible, Embedded, and Embodied Interaction (TEI’15). ACM, New York, NY, USA, 437–440.DOI: http://dx.doi.org/10.1145/2677199.2691604
S. Stusak and A. Aslan. 2014. Beyond Physical Bar Charts: An Exploration of DesigningPhysical Visualizations. In CHI ’14 Extended Abstracts on Human Factors in ComputingSystems (CHI EA ’14). ACM, New York, NY, USA, 1381–1386.DOI: http://dx.doi.org/10.1145/2559206.2581311
S. Stusak, M. Hobe, and A. Butz. 2016. If Your Mind Can Grasp It, Your Hands Will Help.In Proceedings of the TEI ’16: Tenth International Conference on Tangible, Embedded,and Embodied Interaction (TEI ’16). ACM, New York, NY, USA, 92–99.DOI: http://dx.doi.org/10.1145/2839462.2839476
S. Stusak, J. Schwarz, and A. Butz. 2015. Evaluating the Memorability of Physical Vi-sualizations. In Proceedings of the 33rd Annual ACM Conference on Human Factors in
255

BIBLIOGRAPHY
Computing Systems (CHI ’15). ACM, New York, NY, USA, 3247–3250.DOI: http://dx.doi.org/10.1145/2702123.2702248
S. Stusak, A. Tabard, and A. Butz. 2013. Can physical visualizations support analyticaltasks? Poster Abstract of IEEE Transactions on Visualization and Computer Graphics.(2013). 2 pages.
S. Stusak, A. Tabard, F. Sauka, R. A. Khot, and A. Butz. 2014. Activity sculptures: Ex-ploring the impact of physical visualizations on running activity. IEEE Transactions onVisualization and Computer Graphics 20, 12 (2014), 2201–2210.DOI: http://dx.doi.org/10.1109/TVCG.2014.2352953
S. Stusak and M. Teufel. 2014. Projection Augmented Physical Visualizations. In Proceed-ings of the 2nd ACM Symposium on Spatial User Interaction (SUI ’14). ACM, New York,NY, USA, 145–145.DOI: http://dx.doi.org/10.1145/2659766.2661210
Y. Sun, S. Lindtner, X. Ding, T. Lu, and N. Gu. 2015. Reliving the Past & Making a Harmo-nious Society Today: A Study of Elderly Electronic Hackers in China. In Proceedings ofthe 18th ACM Conference on Computer Supported Cooperative Work & Social Comput-ing (CSCW ’15). ACM, New York, NY, USA, 44–55.DOI: http://dx.doi.org/10.1145/2675133.2675195
H. Suzuki and H. Kato. 1995. Interaction-level Support for Collaborative Learning:AlgoBlock–an Open Programming Language. In The First International Conference onComputer Support for Collaborative Learning (CSCL ’95). L. Erlbaum Associates Inc.,Hillsdale, NJ, USA, 349–355.DOI: http://dx.doi.org/10.3115/222020.222828
S. Swaminathan, C. Shi, Y. Jansen, P. Dragicevic, L. Oehlberg, and J.-D. Fekete. 2014a. Cre-ating Physical Visualizations with Makervis. In CHI ’14 Extended Abstracts on HumanFactors in Computing Systems (CHI EA ’14). ACM, New York, NY, USA, 543–546.DOI: http://dx.doi.org/10.1145/2559206.2574788
S. Swaminathan, C. Shi, Y. Jansen, P. Dragicevic, L. A. Oehlberg, and J.-D. Fekete. 2014b.Supporting the Design and Fabrication of Physical Visualizations. In Proceedings of theSIGCHI Conference on Human Factors in Computing Systems (CHI ’14). ACM, NewYork, NY, USA, 3845–3854.DOI: http://dx.doi.org/10.1145/2556288.2557310
W. B. Swann and J. K. Bosson. 2010. Handbook of Social Psychology. John Wiley & Sons,Inc., Chapter: Self and Identity, 589–628.DOI: http://dx.doi.org/10.1002/9780470561119.socpsy001016
A. Sylvester, T. Döring, and A. Schmidt. 2010. Liquids, Smoke, and Soap Bubbles: Re-flections on Materials for Ephemeral User Interfaces. In Proceedings of the Fourth Inter-national Conference on Tangible, Embedded, and Embodied Interaction (TEI ’10). ACM,
256
BIBLIOGRAPHY
New York, NY, USA, 269–270.DOI: http://dx.doi.org/10.1145/1709886.1709941
F. Taher, J. Hardy, A. Karnik, C. Weichel, Y. Jansen, K. Hornbæk, and J. Alexander. 2015.Exploring Interactions with Physically Dynamic Bar Charts. In Proceedings of the 33rdAnnual ACM Conference on Human Factors in Computing Systems (CHI ’15). ACM, NewYork, NY, USA, 3237–3246.DOI: http://dx.doi.org/10.1145/2702123.2702604
M. Tanaka. 1998. Experimental Manufacture and Image Estimation on Handmade StrawPaper. Bulletin of JSSD 44, 5 (1998), 27–36.
J. G. Tanenbaum, A. M. Williams, A. Desjardins, and K. Tanenbaum. 2013. DemocratizingTechnology: Pleasure, Utility and Expressiveness in DIY and Maker Practice. In Pro-ceedings of the SIGCHI Conference on Human Factors in Computing Systems (CHI ’13).ACM, New York, NY, USA, 2603–2612.DOI: http://dx.doi.org/10.1145/2470654.2481360
A. S. Taylor, S. Lindley, T. Regan, D. Sweeney, V. Vlachokyriakos, L. Grainger, and J. Lin-gel. 2015. Data-in-Place: Thinking Through the Relations Between Data and Community.In Proceedings of the 33rd Annual ACM Conference on Human Factors in Computing Sys-tems (CHI ’15). ACM, New York, NY, USA, 2863–2872.DOI: http://dx.doi.org/10.1145/2702123.2702558
M. M. Taylor and S. J. Lederman. 1975. Tactile roughness of grooved surfaces: A modeland the effect of friction. Perception & Psychophysics 17, 1 (1975), 23–36.DOI: http://dx.doi.org/10.3758/BF03203993
P. Te. 2015. TADCAD: A Tangible and Gestural 3D Modeling & Printing Platform forBuilding Creativity. In Proceedings of the 14th International Conference on InteractionDesign and Children (IDC ’15). ACM, New York, NY, USA, 406–409.DOI: http://dx.doi.org/10.1145/2771839.2771865
F. Terauchi, R. Fukami, Y. Matsuoka, M. Kubo, and H. Aoki. 1997. Evaluative Structureof the Gathered Leather Seat and Personal Preference Difference. Bulletin of JSSD 44, 4(1997), 49–56.
M. Teufel. 2014. Projection Augmented Phyiscal Visualisations. Master’s thesis. LMUMunich.
Thingiverse. 2011. thing:12613. Website. (2011). http://www.thingiverse.com/thing:276911 - Accessed: 2015-12-15.
Thingiverse. 2014a. thing:276911. Website. (2014). http://www.thingiverse.com/thing:276911 - Accessed: 2015-12-15.
257

BIBLIOGRAPHY
Thingiverse. 2014b. thing:365994. Website. (2014). http://www.thingiverse.com/thing:276911 - Accessed: 2015-12-15.
A. Thudt, D. Baur, S. Huron, and S. Carpendale. 2016. Visual Mementos: Reflecting Mem-ories with Personal Data. IEEE Transactions on Visualization and Computer Graphics22, 1 (2016), 369–378.DOI: http://dx.doi.org/10.1109/TVCG.2015.2467831
W. M. B. Tiest. 2010. Tactual perception of material properties. Vision Research - Perceptionand Action: Part I 50, 24 (2010), 2775 – 2782.DOI: http://dx.doi.org/10.1016/j.visres.2010.10.005
W. M. B. Tiest and A. M. Kappers. 2008. Thermosensory reversal effect quantified. ActaPsychologica 127, 1 (2008), 46 – 50.DOI: http://dx.doi.org/10.1016/j.actpsy.2006.12.006
M. Tobiasz, P. Isenberg, and S. Carpendale. 2009. Lark: Coordinating Co-located Collabo-ration with Information Visualization. IEEE Transactions on Visualization and ComputerGraphics 15, 6 (2009), 1065–1072.DOI: http://dx.doi.org/10.1109/TVCG.2009.162
R. C. Tolman. 1917. The measurable quantities of physics. Physical Review 9, 3 (1917),237–253.
A. L. Toombs, S. Bardzell, and J. Bardzell. 2015. The Proper Care and Feeding of Hack-erspaces: Care Ethics and Cultures of Making. In Proceedings of the 33rd Annual ACMConference on Human Factors in Computing Systems (CHI ’15). ACM, New York, NY,USA, 629–638.DOI: http://dx.doi.org/10.1145/2702123.2702522
C. Torres and E. Paulos. 2015. MetaMorphe: Designing Expressive 3D Models for DigitalFabrication. In Proceedings of the SIGCHI Conference on Creativity & Cognition (C&C’15). ACM, New York, NY, USA, 73–82.DOI: http://dx.doi.org/10.1145/2757226.2757235
M. Tory, C. Swindells, and R. Dreezer. 2009. Comparing dot and landscape spatializationsfor visual memory differences. IEEE Transactions on Visualization and Computer Graph-ics 15, 6 (2009), 1033–1040.DOI: http://dx.doi.org/10.1109/TVCG.2009.127
A. Treisman. 1985. Preattentive processing in vision. Computer Vision, Graphics, and ImageProcessing 31, 2 (1985), 156–177.DOI: http://dx.doi.org/10.1016/S0734-189X(85)80004-9
A. M. Treisman and G. Gelade. 1980. A feature-integration theory of attention. CognitivePsychology 12, 1 (1980), 97–136.DOI: http://dx.doi.org/10.1016/0010-0285(80)90005-5
258
BIBLIOGRAPHY
L. M. Triona and D. Klahr. 2003. Point and click or grab and heft: Comparing the influenceof physical and virtual instructional materials on elementary school students’ ability todesign experiments. Cognition and Instruction 21, 2 (2003), 149–173.DOI: http://dx.doi.org/10.1207/S1532690XCI2102_02
V. Tsaknaki, Y. Fernaeus, and M. Schaub. 2014. Leather As a Material for Crafting In-teractive and Physical Artifacts. In Proceedings of the 2014 Conference on DesigningInteractive Systems (DIS ’14). ACM, New York, NY, USA, 5–14.DOI: http://dx.doi.org/10.1145/2598510.2598574
T. Tseng. 2015. Spin: A Photography Turntable System for Creating Animated Documen-tation. In Proceedings of the 14th International Conference on Interaction Design andChildren (IDC ’15). ACM, New York, NY, USA, 422–425.DOI: http://dx.doi.org/10.1145/2771839.2771869
T. Tseng and G. Tsai. 2015. Process Products: Capturing Design Iteration with Digital Fab-rication. In Proceedings of the Ninth International Conference on Tangible, Embedded,and Embodied Interaction (TEI ’15). ACM, New York, NY, USA, 631–636.DOI: http://dx.doi.org/10.1145/2677199.2687891
T. Tsujii, N. Koizumi, and T. Naemura. 2014. Inkantatory Paper: Dynamically Color-changing Prints with Multiple Functional Inks. In Proceedings of the Adjunct Publicationof the 27th Annual ACM Symposium on User Interface Software and Technology (UIST’14Adjunct). ACM, New York, NY, USA, 39–40.DOI: http://dx.doi.org/10.1145/2658779.2659103
E. R. Tufte. 1986. The Visual Display of Quantitative Information. Graphics Press, Cheshire,CT, USA.
B. Ullmer, C. Dell, C. Gil, C. Toole, Jr., C. Wiley, Z. Dever, L. Rogge, R. Bradford, G.Riviere, R. Sankaran, K. Liu, C. Freeman, A. Wallace, Jr., M. DeLatin, C. Washington, A.Reeser, C. W. Branton, and R. Parker. 2011. Casier: Structures for Composing Tangiblesand Complementary Interactors for Use Across Diverse Systems. In Proceedings of theFifth International Conference on Tangible, Embedded, and Embodied Interaction (TEI’11). ACM, New York, NY, USA, 229–236.DOI: http://dx.doi.org/10.1145/1935701.1935746
B. Ullmer, H. Ishii, and R. J. K. Jacob. 2003. Tangible Query Interfaces: Physically Con-strained Tokens for Manipulating Database Queries. In Human-computer Interaction, IN-TERACT ’03: IFIP TC13 International Conference on Human-Computer Interaction,Zurich, Switzerland, September 1-5, 2003, Preceedings, Part II. 279–286.
J. Underkoffler and H. Ishii. 1999. Urp: A Luminous-tangible Workbench for Urban Plan-ning and Design. In Proceedings of the SIGCHI Conference on Human Factors in Com-puting Systems (CHI ’99). ACM, New York, NY, USA, 386–393.DOI: http://dx.doi.org/10.1145/302979.303114
259

BIBLIOGRAPHY
B. J. Underwood. 1957. Interference and forgetting. Psychological review 64, 1 (1957),49–60.DOI: http://dx.doi.org/10.1037/h0044616
G. Urton and C. J. Brezine. 2005. Khipu accounting in ancient Peru. Science 309, 5737(2005), 1065–1067.
E. van den Hoven. 2004. Graspable cues for everyday recollecting. Ph.D. Dissertation.Technische Universiteit Eindhoven.
E. van den Hoven and B. Eggen. 2005. Personal Souvenirs As Ambient Intelligent Objects.In Proceedings of the 2005 Joint Conference on Smart Objects and Ambient Intelligence:Innovative Context-aware Services: Usages and Technologies (sOc-EUSAI ’05). ACM,New York, NY, USA, 123–128.DOI: http://dx.doi.org/10.1145/1107548.1107583
V. van Polanen, W. M. Bergmann T., and A. M. L. Kappers. 2012. Haptic pop-out of movablestimuli. Attention, Perception, & Psychophysics 74, 1 (2012), 204–215.DOI: http://dx.doi.org/10.3758/s13414-011-0216-5
A. Vande Moere. 2008. Beyond the Tyranny of the Pixel: Exploring the Physicality of Infor-mation Visualization. In Proceedings of the 12th International Conference on InformationVisualisation (IV ’08). 469–474.DOI: http://dx.doi.org/10.1109/IV.2008.84
A. Vande Moere and D. Offenhuber. 2009. Beyond ambient display: a contextual taxon-omy of alternative information display. International Journal of Ambient Computing andIntelligence (IJACI) 1, 2 (2009), 39–46.
A. Vande Moere and S. Patel. 2009. Analyzing the design approaches of physical data sculp-tures in a design education context. Visual Information Communications International(VINCI’09) (2009).
A. Vande Moere and S. Patel. 2010. Visual Information Communication. Springer US,Boston, MA, Chapter: The Physical Visualization of Information: Designing Data Sculp-tures in an Educational Context, 1–23.DOI: http://dx.doi.org/10.1007/978-1-4419-0312-9_1
M. Vandermaesen, T. de Weyer, K. Luyten, and K. Coninx. 2013. PhysiCube: ProvidingTangible Interaction in a Pervasive Upper-limb Rehabilitation System. In Proceedings ofthe 8th International Conference on Tangible, Embedded and Embodied Interaction (TEI’14). ACM, New York, NY, USA, 85–92.DOI: http://dx.doi.org/10.1145/2540930.2540936
J. Vanek, J. A. G. Galicia, B. Benes, R. Mech, N. Carr, O. Stava, and G. S. Miller. 2014.PackMerger: A 3D Print Volume Optimizer. Computer Graphics Forum 33, 6 (2014),
260

BIBLIOGRAPHY
322–332.DOI: http://dx.doi.org/10.1111/cgf.12353
F. Varesano. 2013. LibreMote: Exploring DIY, Personal Fabrication and Community Con-tribution in Ad-hoc Designed Unconventional Controllers. In Proceedings of the 7th Inter-national Conference on Tangible, Embedded and Embodied Interaction (TEI ’13). ACM,New York, NY, USA, 369–370.DOI: http://dx.doi.org/10.1145/2460625.2460698
R. Vasconcellos. 1991. Knowing the Amazon through tactual graphics. In Proceedings ofthe 15th Conference of the International Cartographic Association, Vol. 1. Bournemouth,UK, 206–210.
R. Vasconcellos. 1996. Tactile mapping design and the visually impaired user. CartographicDesign: Theoretical and Practical Perspectives. John Wiley & Sons, England (1996).
M. Vázquez, E. Brockmeyer, R. Desai, C. Harrison, and S. E. Hudson. 2015. 3D PrintingPneumatic Device Controls with Variable Activation Force Capabilities. In Proceedingsof the 33rd Annual ACM Conference on Human Factors in Computing Systems (CHI ’15).ACM, New York, NY, USA, 1295–1304.DOI: http://dx.doi.org/10.1145/2702123.2702569
R. Villalon, H. Lieberman, and L. Sass. 2009. Breaking Down Brick Walls: Design, Con-struction, and Prototype Fabrication Knowledge in Architecture. In CHI ’09 ExtendedAbstracts on Human Factors in Computing Systems (CHI EA ’09). ACM, New York, NY,USA, 4261–4266.DOI: http://dx.doi.org/10.1145/1520340.1520650
Y. Wang, X. Ma, Q. Luo, and H. Qu. 2016. Data Edibilization: Representing Data withFood. In Proceedings of the 2016 CHI Conference Extended Abstracts on Human Factorsin Computing Systems (CHI EA ’16). ACM, New York, NY, USA, 409–422.DOI: http://dx.doi.org/10.1145/2851581.2892570
P. S. Wardrip and L. Brahms. 2015. Learning Practices of Making: Developing a Frameworkfor Design. In Proceedings of the 14th International Conference on Interaction Designand Children (IDC ’15). ACM, New York, NY, USA, 375–378.DOI: http://dx.doi.org/10.1145/2771839.2771920
C. Ware. 2012. Information Visualization: Perception for Design (3 ed.). Morgan KaufmannPublishers Inc., San Francisco, CA, USA.
E. H. Weber. 1846. Tastsinn und Gemeingefühl. Leipzig, W. Engelmann.
C. Weichel, J. Alexander, A. Karnik, and H. Gellersen. 2015. SPATA: Spatio-Tangible Toolsfor Fabrication-Aware Design. In Proceedings of the Ninth International Conference onTangible, Embedded, and Embodied Interaction (TEI ’15). ACM, New York, NY, USA,
261
BIBLIOGRAPHY
189–196.DOI: http://dx.doi.org/10.1145/2677199.2680576
M. Weiser. 1991. The computer for the 21st century. Scientific american 265, 3 (1991),94–104.DOI: http://dx.doi.org/10.1038/scientificamerican0991-94
M. Weiser and J. S. Brown. 1996. Designing calm technology. PowerGrid Journal 1, 1(1996), 75–85.
M. Weiser and J. S. Brown. 1997. The Coming Age of Calm Technology. In Beyond Calcu-lation. Springer New York, 75–85.DOI: http://dx.doi.org/10.1007/978-1-4612-0685-9_6
M. Weiss, J. Wagner, Y. Jansen, R. Jennings, R. Khoshabeh, J. D. Hollan, and J. Borchers.2009. SLAP Widgets: Bridging the Gap Between Virtual and Physical Controls on Table-tops. In Proceedings of the SIGCHI Conference on Human Factors in Computing Systems(CHI ’09). ACM, New York, NY, USA, 481–490.DOI: http://dx.doi.org/10.1145/1518701.1518779
L. T. G. K. R. Wichmann, Felix A.; Sharpe. 2002. The contributions of color to recognitionmemory for natural scenes. Journal of Experimental Psychology: Learning, Memory, andCognition 28, 3 (2002), 509–520.DOI: http://dx.doi.org/10.1037/0278-7393.28.3.509
K. D. D. Willis, E. Brockmeyer, S. Hudson, and I. Poupyrev. 2012. Printed Optics: 3DPrinting of Embedded Optical Elements for Interactive Devices. In Proceedings of the25th Annual ACM Symposium on User Interface Software and Technology (UIST ’12).ACM, New York, NY, USA, 589–598.DOI: http://dx.doi.org/10.1145/2380116.2380190
K. D. D. Willis, J. Lin, J. Mitani, and T. Igarashi. 2010. Spatial Sketch: Bridging BetweenMovement & Fabrication. In Proceedings of the Fourth International Conference on Tan-gible, Embedded, and Embodied Interaction (TEI ’10). ACM, New York, NY, USA, 5–12.DOI: http://dx.doi.org/10.1145/1709886.1709890
K. D. D. Willis, C. Xu, K.-J. Wu, G. Levin, and M. D. Gross. 2011. Interactive Fabrication:New Interfaces for Digital Fabrication. In Proceedings of the Fifth International Confer-ence on Tangible, Embedded, and Embodied Interaction (TEI ’11). ACM, New York, NY,USA, 69–72.DOI: http://dx.doi.org/10.1145/1935701.1935716
M. Wilson. 2002. Six views of embodied cognition. Psychonomic Bulletin & Review 9, 4(2002), 625–636.DOI: http://dx.doi.org/10.3758/BF03196322
262

BIBLIOGRAPHY
R. Wimmer. 2015. Grasp-sensitive surfaces. Ph.D. Dissertation. Ludwig-Maximilians-Universität München.
E. L. Wohldmann, A. F. Healy, and L. E. Bourne Jr. 2008. A mental practice superiorityeffect: less retroactive interference and more transfer than physical practice. Journal ofExperimental Psychology: Learning, Memory, and Cognition 34, 4 (2008), 823–833.DOI: http://dx.doi.org/10.1037/0278-7393.34.4.823
G. Wolf. 2009. Know Thyself: Tracking Every Facet of Life, from Sleep to Mood toPain, 24/7/365. Wired (online article). (2009). http://www.wired.com/2009/06/lbnp-knowthyself/ - Accessed: 2015-12-15.
I. Woodward. 2007. Understanding Material Culture. SAGE Publications.
M. Worsley and P. Blikstein. 2013. Towards the Development of Multimodal Action BasedAssessment. In Proceedings of the Third International Conference on Learning Analyticsand Knowledge (LAK ’13). ACM, New York, NY, USA, 94–101.DOI: http://dx.doi.org/10.1145/2460296.2460315
T. Wun, J. Payne, S. Huron, and S. Carpendale. 2016. Comparing Bar Chart Authoring withMicrosoft Excel and Tangible Tiles. Computer Graphics Forum 35, 3 (2016), 111––120.DOI: http://dx.doi.org/10.1111/cgf.12887
L. Xie, A. N. Antle, and N. Motamedi. 2008. Are Tangibles More Fun?: Comparing Chil-dren’s Enjoyment and Engagement Using Physical, Graphical and Tangible User Inter-faces. In Proceedings of the 2nd International Conference on Tangible and EmbeddedInteraction (TEI ’08). ACM, New York, NY, USA, 191–198.DOI: http://dx.doi.org/10.1145/1347390.1347433
K. Yamamoto, I. Kanaya, M. Bordegoni, and U. Cugini. 2014. Re:Form: Rapid DesigningSystem Based on Fusion and Illusion of Digital/Physical Models. In Proceedings of the2nd ACM Symposium on Spatial User Interaction (SUI ’14). ACM, New York, NY, USA,140–140.DOI: http://dx.doi.org/10.1145/2659766.2661205
L. Yao, R. Niiyama, J. Ou, S. Follmer, C. Della Silva, and H. Ishii. 2013. PneUI: Pneumat-ically Actuated Soft Composite Materials for Shape Changing Interfaces. In Proceedingsof the 26th Annual ACM Symposium on User Interface Software and Technology (UIST’13). ACM, New York, NY, USA, 13–22.DOI: http://dx.doi.org/10.1145/2501988.2502037
F. Yetim. 2013. Critical Perspective on Persuasive Technology Reconsidered. In Proceedingsof the SIGCHI Conference on Human Factors in Computing Systems (CHI ’13). ACM,New York, NY, USA, 3327–3330.DOI: http://dx.doi.org/10.1145/2470654.2466454
263
BIBLIOGRAPHY
B. Young, T. Hall, and G. Bailey. 2010. Introduction to CNC Routing for Prototyping andManufacturing. In Proceedings of the Fourth International Conference on Tangible, Em-bedded, and Embodied Interaction (TEI ’10). ACM, New York, NY, USA, 373–374.DOI: http://dx.doi.org/10.1145/1709886.1709978
W. Yu and S. Brewster. 2003. Evaluation of multimodal graphs for blind people. UniversalAccess in the Information Society 2, 2 (2003), 105–124.DOI: http://dx.doi.org/10.1007/s10209-002-0042-6
Z. C. Zacharia and G. Olympiou. 2011. Physical versus virtual manipulative experimentationin physics learning. Learning and Instruction 21, 3 (2011), 317–331.DOI: http://dx.doi.org/10.1016/j.learninstruc.2010.03.001
E. T. B. S. D. J. Zacks, Jeff; Levy. 1998. Reading bar graphs: Effects of extraneous depthcues and graphical context. Journal of Experimental Psychology: Applied 4, 2 (1998),119–138.DOI: http://dx.doi.org/10.1037/1076-898X.4.2.119
H. Zhao, C. Plaisant, B. Shneiderman, and J. Lazar. 2008. Data Sonification for Userswith Visual Impairment: A Case Study with Georeferenced Data. ACM Transactions onComputer-Human Interaction (TOCHI) 15, 1, Article 4 (2008), 28 pages.DOI: http://dx.doi.org/10.1145/1352782.1352786
J. Zhao and A. Vande Moere. 2008. Embodiment in Data Sculpture: A Model of the Phys-ical Visualization of Information. In Proceedings of the 3rd International Conference onDigital Interactive Media in Entertainment and Arts (DIMEA ’08). ACM, New York, NY,USA, 343–350.DOI: http://dx.doi.org/10.1145/1413634.1413696
C. Zheng. 2015. Fusilli: Translating the Exploration of a Product Customization Space fromDigital to Physical. In Proceedings of the Ninth International Conference on Tangible,Embedded, and Embodied Interaction (TEI ’15). ACM, New York, NY, USA, 329–336.DOI: http://dx.doi.org/10.1145/2677199.2680574
C. L. Zhu, H. Agrawal, and P. Maes. 2015. Data-objects: Re-designing everyday objectsas tactile affective interfaces. In International Conference on Affective Computing andIntelligent Interaction (ACII ’15). 322–326.DOI: http://dx.doi.org/10.1109/ACII.2015.7344590
J. Zimmerman, J. Forlizzi, and S. Evenson. 2007. Research Through Design As a Methodfor Interaction Design Research in HCI. In Proceedings of the SIGCHI Conference onHuman Factors in Computing Systems (CHI ’07). ACM, New York, NY, USA, 493–502.DOI: http://dx.doi.org/10.1145/1240624.1240704
A. Zoran and J. A. Paradiso. 2013. FreeD: A Freehand Digital Sculpting Tool. In Pro-ceedings of the SIGCHI Conference on Human Factors in Computing Systems (CHI ’13).
264

ACM, New York, NY, USA, 2613–2616.DOI: http://dx.doi.org/10.1145/2470654.2481361
A. Zoran, R. Shilkrot, and J. Paradiso. 2013. Human-computer Interaction for Hybrid Carv-ing. In Proceedings of the 26th Annual ACM Symposium on User Interface Software andTechnology (UIST ’13). ACM, New York, NY, USA, 433–440.DOI: http://dx.doi.org/10.1145/2501988.2502023
K. Zorina, R. van der Vleuten, and K. Frantzis. 2012. Tasty Tweets. Website. (2012).http://ciid.dk/education/portfolio/idp12/courses/data-visualisation/projects/tasty-tweets/ - Accessed: 2015-12-15.
O. Zuckerman, S. Arida, and M. Resnick. 2005. Extending Tangible Interfaces for Educa-tion: Digital Montessori-inspired Manipulatives. In Proceedings of the SIGCHI Confer-ence on Human Factors in Computing Systems (CHI ’05). ACM, New York, NY, USA,859–868.DOI: http://dx.doi.org/10.1145/1054972.1055093
H. Zuo, T. Hope, P. Castle, and M. Jones. 2001. An investigation into the sensory propertiesof materials. In Proceedings of the international conference on affective human factorsdesign. Citeseer, 500–507.

BIBLIOGRAPHY
266

Declaration
Eidesstattliche Versicherung(Siehe Promotionsordnung vom 12.07.11, § 8, Abs. 2 Pkt. 5)
Hiermit erkläre ich an Eidesstatt, dass die Dissertation von mir selbstständig und ohne uner-laubte Beihilfe angefertigt wurde.
München, den 02. August 2016
Simon Stusak
267