exploring the digital nation computer and ... - kentucky wired
TRANSCRIPT
Final Digital Nation covers.qxd 11/1/11 11:01 AM Page 1

Final Digital Nation covers.qxd 11/1/11 11:01 AM Page 2
EXPLORING THE DIGITAL NATIONComputer and Internet Use at Home
Prepared by
Economics and Statistics Administration
and
National Telecommunications and Information Administration
U.S. Department of Commerce
November 2011

Exploring the Digital Nation:Computer and Internet Use at Home
Foreword
The Internet is an extraordinary platform for innovation, economic growth, and socialcommunication. High-speed Internet services delivered over broadband networks arecritical to maintaining the United States’ competitiveness in a global economy. A
strong correlation exists between broadband (both deployment and adoption) and indices ofeconomic growth, such as increases in Gross Domestic Product, employment, and propertyvalues. The Administration recognizes the importance of broadband to improve health care,enhance education, and provide essential job training and employment assistance for Americansseeking work. President Obama recently reiterated his long-standing commitment to ensuringbroadband’s role in the nation’s future, stating:
I will not sacrifice the core investments that we need to grow and create jobs.We will invest in medical research. We will invest in clean energy technology.We will invest in new roads and airports and broadband access. We will investin education. We will invest in job training. We will do what we need to do tocompete, and we will win the future.
—Remarks by President Obama on Fiscal Policy in Washington, DC, April 13, 2011
The American Recovery and Reinvestment Act of 2009 (Recovery Act) provides a downpayment on needed investments to extend the nation’s broadband infrastructure, expandpublic computer center capacity, and promote broadband adoption. The NationalTelecommunications and Information Administration (NTIA) provides approximately$4 billion to fund 229 projects under the Recovery Act’s Broadband Technology OpportunitiesProgram (BTOP). These investments, combined with the Department of Agriculture’sBroadband Initiatives Program, total approximately $7 billion, and they are beginning to paydividends. BTOP grantees have installed or upgraded over 18,000 miles of new broadbandnetworks, added or upgraded more than 16,000 computer workstations, and reported over110,000 new subscribers as of June 30, 2011. The projects are stimulating the deploymentand adoption of broadband in communities across the United States and we expect that theywill continue to do so for years to come. In addition, NTIA recently launchedDigitalLiteracy.gov in partnership with nine Federal agencies to create an online resource forimproving digital literacy.
Exploring the Digital Nation: Computer and Internet Use at Home
i

Government efforts, private sector investment, and increased demand for Internet services andapplications all play a key role in facilitating the steady growth in households’ computer andInternet use. For its part, the Department of Commerce is a leader in analyzing broadbandaccess and adoption in America. In October 2010, the U.S. Census Bureau within theEconomics and Statistics Administration, in collaboration with NTIA, significantly expandedthe Current Population Survey (CPS) to include new questions on computer and Internet use.The Census Bureau surveyed about 54,300 households, and through statistical methodsextrapolated the survey results to represent 119.5 million American households.
The CPS data revealed that 68 percent of households used broadband Internet access service,up from 64 percent the previous year. Despite this improvement, demographic and geographicdisparities demonstrate a persistent digital divide among certain groups. For example, rurallow-income minorities’ broadband adoption at home lagged significantly behind that of othergroups. In addition, almost one-third of Americans are not accessing broadband service athome. The Administration has made it a priority to evaluate the effectiveness of existingprograms, develop new programs as needed, and work collaboratively with industry to designnew strategies to ameliorate the digital divide. Our ongoing analysis highlights that there is nosimple “one size fits all” solution to resolve the adoption disparities among broadband users.The Administration will continue to encourage Congress, state and local officials, and theprivate sector to find ways to promote broadband deployment and adoption so that wecontinue to create jobs, prepare the workforce for the rapidly developing Internet economy,and increase the nation’s competitiveness.
Rebecca M. Blank
Acting Deputy Secretary of Commerce andUnder Secretary for Economic AffairsEconomics and Statistics Administration
Lawrence E. Strickling
Assistant Secretary for Communications and Information National Telecommunications and Information Administration
Exploring the Digital Nation: Computer and Internet Use at Home
ii
Exploring the Digital Nation:Computer and Internet Use at Home
Exploring the Digital Nation: Computer and Internet Use at Home
iii
ECONOMICS & STATISTICS
ADMINISTRATION
Rebecca M. BlankActing Deputy Secretary of Commerceand Under Secretary for Economic Affairs
ESA
Mark Doms, Chief Economist
Robert Rubinovitz, Deputy Chief Economist
Beethika Khan, Economist
Rebecca Lehrman, Economist
U.S. CENSUS BUREAU
Robin Anderson, Research Economist
Demographic Surveys DivisionTechnologies Management OfficeDemographic Statistical Methods DivisionHousing and Household Economics Statistics
Division: Population Division
NATIONAL TELECOMMUNICATIONS
& INFORMATION ADMINISTRATION
Lawrence E. StricklingAssistant Secretary for Communicationsand Information
NTIA
John S. Morabito, Deputy AssociateAdministrator for Policy Analysisand Development
James McConnaughey, Chief Economist
Maureen Lewis, Director of MinorityTelecommunications Development
Rafi M. Goldberg, TelecommunicationsPolicy Analyst
Agatha Cole
The Project Team would like to thank Joanne Caldwell, Sabrina Montes, Cassandra Ingram,David Beede, George McKittrick, and Jane Callen of the Economics and Statistics Administration;Anna Gomez, Angela Simpson, Marsha MacBride, Rochelle Cohen, Kathy Smith, Josephine Arnold,Tim Sloan, and Percia Safar of NTIA; David Johnson, Hyon Shin, Kurt Bauman, Gregory Weyland,and Tiffany Julian of the Census Bureau; Patricia Buckley of the Office of the Secretary;Thomas C. Power and Daniel J. Weitzner of the White House Office of Science and TechnologyPolicy; Peter Stenberg and Christopher Chapman of the U.S. Departments of Agriculture andEducation, respectively; and Craig Peters of the Council of Economic Advisers, for theircontributions to this report.
JOINT PROJECT TEAM


Exploring the Digital Nation:Computer and Internet Use at Home
Executive Summary
This report updates and expands last year’s report, Exploring the Digital Nation: HomeBroadband Internet Adoption in the United States, based on data from the CensusBureau’s most recent Current Population Survey (CPS) School Enrollment and Internet
Use Supplement. The report also provides additional information augmenting the February2011 research preview, Digital Nation: Expanding Internet Usage, and includes new findings oncomputer and Internet use in the United States. For example, we use regression analysis to helpexplain some of the disparities in broadband Internet adoption that exist between demographicand geographic groups. The analysis reveals that, by holding constant certain factors such ashousehold income, education, or age, the adoption disparities may decrease significantly.
Below is a summary of our final review of the 2010 CPS results. These findings may assistpolicymakers as they consider ways to promote broadband deployment and adoption in theUnited States.1
Summary of the 2010 CPS Results
� As of October 2010, more than 68 percent of households used broadband Internetaccess service, up from 64 percent one year earlier (Section 1, Figure 1). Approximately80 percent of households had at least one Internet user, either at home or elsewhere(Section 3.1, Figure 3).
� Cable modem (32 percent) and DSL (23 percent) ranked as the most commonly usedbroadband technologies (Section 3.1, Figure 3). Other technologies, including mobilebroadband, fiber optics, and satellite services, accounted for a small, but growing, segmentof households with broadband Internet access service.
Exploring the Digital Nation: Computer and Internet Use at Home
v
1 In this report, we examine Internet access service from the demand side based on the Census Bureau’s survey ofhouseholds. We use the terms “adoption,” “use,” “utilization,” “access,” and “connection” interchangeably to indicatethat a household reported having Internet access service. The term “Internet access service” includes both the provisionof dial-up Internet access service and broadband Internet access service. Similarly, the CPS survey inquires abouthouseholds’ ownership or use of a home computer to examine whether they have access to the devices necessary toaccess the Internet. The report describes such access as “ownership” or “use” and employs the terms interchangeably.
� Dial-up use at home – the preferred form of residential Internet access through the mid2000s – continued to decline from five percent in October 2009 to three percent one yearlater (Section 3.1, Figure 3).
� Over three-fourths (77 percent) of households had a computer – the principal means bywhich households access the Internet – compared with 62 percent in 2003 (Section 1,Figure 1). Low computer use correlates with low broadband adoption rates.
� Broadband Internet adoption, as well as computer use, varied across demographic andgeographic groups. Lower income families, people with less education, those withdisabilities, Blacks, Hispanics, and rural residents generally lagged the national average inboth broadband adoption and computer use. For example, home broadband adoptionand computer use stood at only 16 percent and 27 percent, respectively, among ruralhouseholds headed by a Black householder without a high school diploma (Section 4.2,Table 4). Also, households with school-age children exhibited higher broadband adoptionand computer use rates than other households (Section 4.1, Figure 7).
� The differences in socio-economic attributes do not entirely explain why some groupslagged in adoption. Broadband Internet adoption disparities decrease when regressionanalysis holds constant certain household characteristics, such as income, education, race,ethnicity, foreign-born status, household composition, disability status, or geographiclocation. For example, the gap with respect to broadband Internet adoption associatedwith disabilities decreases from 29 to six percentage points when controlling for income,education, age, and other attributes (Section 4.3, Figure 18).
� The most important reasons households without broadband Internet or dial-up servicegave for not subscribing were: (1) lack of need or interest (47 percent); (2) lack ofaffordability (24 percent); and (3) inadequate computer (15 percent) (Section 5,Figure 19).
� Households reporting affordability as the major barrier to subscribing to broadbandservice cited both the fixed cost of purchasing a computer and the recurring monthlysubscription costs as important factors (Section 5, Figure 21). Our analysis of theexpanded CPS data suggests that work, school, public libraries, and someone else’s housewere all popular alternatives for Internet access among those with no home broadbandInternet access service (Section 6, Figure 23). Not surprisingly, individuals with no homebroadband Internet access service relied on locations such as public libraries (20 percent)or other people’s houses (12 percent) more frequently than those who used broadbandInternet access service at home.
Exploring the Digital Nation: Computer and Internet Use at Home
vi
Exploring the Digital Nation:Computer and Internet Use at Home
Table of Contents
1. Introduction . . . . . . . . . . . . . . . . . . . . . . . . . . . . . . . . . . . . . . . . . . . . . . . . . . . . . . . . . . . . . . 1
2. Household Computer Use, 2010 . . . . . . . . . . . . . . . . . . . . . . . . . . . . . . . . . . . . . . . . . . 3
3. Household Internet Adoption, 2010 . . . . . . . . . . . . . . . . . . . . . . . . . . . . . . . . . . . . . . . 5
3.1 Types of Household Internet Adoption . . . . . . . . . . . . . . . . . . . . . . . . . . . . . . . . . . . 5
3.2 Mobile Broadband Internet Use at Home . . . . . . . . . . . . . . . . . . . . . . . . . . . . . . . . . 6
4. Computer and Home Internet Use by Household Demographic
Characteristics and Geography, 2010 . . . . . . . . . . . . . . . . . . . . . . . . . . . . . . . . . . . . 11
4.1 Demographic and Geographic Gaps in Computer and Internet Use . . . . . . . . . . 11
4.2 A Detailed Look at Computer and Broadband Internet Use by Demographic Characteristics and Geography . . . . . . . . . . . . . . . . . . . . . . . . . . . . 23
4.3 Marginal Effects of Household Characteristics on the Likelihood that a Household Uses Broadband Internet Access Service . . . . . . . . . . . . . . . . . . 26
5. Non-Adoption of Internet Access Services at Home, 2010 . . . . . . . . . . . . . . . . . . 34
6. Internet Use Outside the Home, 2010 . . . . . . . . . . . . . . . . . . . . . . . . . . . . . . . . . . . . 38
7. Conclusion . . . . . . . . . . . . . . . . . . . . . . . . . . . . . . . . . . . . . . . . . . . . . . . . . . . . . . . . . . . . 40
References . . . . . . . . . . . . . . . . . . . . . . . . . . . . . . . . . . . . . . . . . . . . . . . . . . . . . . . . . . . . . . 41
Appendix A: Data and Methodology . . . . . . . . . . . . . . . . . . . . . . . . . . . . . . . . . . . . . . . 42
Appendix B: Statistical Tables . . . . . . . . . . . . . . . . . . . . . . . . . . . . . . . . . . . . . . . . . . . . . 43
Exploring the Digital Nation: Computer and Internet Use at Home
vii


Exploring the Digital Nation:Computer and Internet Use at Home
1. Introduction
The Internet has transformed our social and economic environment by providing an importantplatform for innovation, economic growth, and social communication. Residential use ofbroadband Internet access services has risen dramatically during the past decade, demonstratingthat the Internet plays a key role in the everyday lives of many people.
Figure 1: Overview of Household Adoption Rates by Technology
Percent of U.S. Households
Source: U.S. Census Bureau, Current Population Survey School Enrollment and Internet Use Supplement,October 2010, and ESA calculations. “Digital Nation: Expanding Internet Usage,” National Telecommunications andInformation Administration, February 2011.
Note: Internet adoption depicted above combines broadband and dial-up Internet access services. 2001-2010 computerand Internet use data employ 2000 Census-based weights, and earlier years use 1990 Census-based weights.
Exploring the Digital Nation: Computer and Internet Use at Home
1
3742
5156
62
77
19
26
42
5055
6269
71
49
20
51
6468
94 94 94 95 95 95 9696
Oct 97
Nov 97Nov 98
Dec 98
Jul 00
Aug 00 Sep 01
Nov 01
Oct 03
Nov 03
Oct 07
Nov 07
Oct 09
Nov 09Mar 10
Oct 100%
10%
20%
30%
40%
50%
60%
70%
80%
90%
100%Computer Internet Broadband Internet Telephone

Nonetheless, as Figure 1 illustrates, not everyone uses a computer or the Internet. Today, thereexists a substantial gap between these technologies’ adoption rates (77 and 71 percent,respectively) and that of telephone service (96 percent); broadband Internet access (68 percent)trails as well. However, the differentials have decreased significantly between very maturetelephone subscribership and growing digital technologies. For example, in 2003 computer uselagged by approximately 33 percentage points and broadband by almost 75 percentage points.While telephone diffusion has plateaued for more than two decades, nascent computer andInternet adoption rates have continued to climb, albeit at a slower pace than earlier in thedecade. In contrast, broadband Internet’s rise has remained sharp and robust, as dial-upadoption plunged from 37 percent in 2000 to three percent in 2010.
In February 2011, NTIA released Digital Nation: Expanding Internet Usage, a research previewthat provided a first look at data from the October 2010 School Enrollment and Internet UseSupplement to the Census Bureau’s Current Population Survey. The preview relied on severalstatistical tables that the Census Bureau released shortly after it began processing the surveydata. These tables provided us with certain information about disparities in broadbandadoption based on demographic characteristics such as income, race, and population density.The preliminary CPS data, however, limited our analysis until the Census Bureau madeavailable a public use dataset for the survey, which facilitated a more detailed examinationof the data.
Armed with complete survey results, ESA and NTIA produced custom statistics on adoption ofInternet access services by demographics and geography, and reasons for non-adoption. Inaddition to calculating statistics not listed in the summary tables that NTIA used for the 2011research preview, such as information on computer ownership, we employed regression analysisto estimate the effects of different variables, such as income or race, on such outcomes asbroadband adoption when holding other factors constant. In other words, it allowed us toestimate how much of the digital divide remains attributable to population density orgeography (for example) if we control for characteristics like education and income.
This report, therefore, draws on the October 2010 CPS data to provide new insights from thesurvey’s expanded questions on computer use and Internet adoption.2 These additionalquestions enabled us to study home computer use, identify the types of broadband Internetaccess services used at home, and determine the locations from which people used the Internetoutside the home. In addition, one of the main findings of the 2011 preview was thataffordability played a large role in a household’s decision not to subscribe to broadband services.The expanded questionnaire allowed us to identify the types of costs that concerned households,including fixed costs, such as the cost of computer equipment and Internet service installation,and recurring costs, such as monthly Internet access subscription fees.
Exploring the Digital Nation: Computer and Internet Use at Home
2
2 Please see Appendix A for a detailed description of the data and methodology employed in this report.

2. Household Computer Use, 2010
More than three-quarters (77 percent) of all American households had a computer at homein 2010, up from 62 percent in 2003.3,4 Figure 2 shows that the majority of U.S. households(58 percent) used a desktop, laptop, netbook, or notebook computer only (personal computer),while 17 percent used a handheld device (which includes smartphones and other Internet-capable devices of similar functionality) in addition to a personal computer. Handheld devicesappear to be complementary to personal computers since the substantial majority of householdswith handheld devices also used a personal computer. Only two percent of households reportedhaving just a handheld device.
A significant segment of the population, almost one-fourth (23 percent) of all Americanhouseholds, did not own or use a computer at home in 2010.
Figure 2: Household Computer Use by Type of Computer, 2010
Source: U.S. Census Bureau, Current Population Survey School Enrollment and Internet Use Supplement,October 2010, and ESA calculations.
Note: Handheld devices include smartphones and other Internet-capable devices of similar size and functionality.
Exploring the Digital Nation: Computer and Internet Use at Home
3
3 For the 2010 household-level estimate of computer usage based on the total sample, the margin of error at the90 percent confidence level is plus or minus 0.35 percentage points based on a standard error (SE) of 0.21 percentagepoints. See Appendix B, Table B2 for estimates of computer use and standard errors for population subgroups. The lasttime the CPS included data on computer use was in 2003. 4 All comparisons referenced in this paper have been tested for statistical significance, and are significant at the90 percent confidence level.
Personal computeronly (Desktop,
laptop,netbook, or
notebook computer) 58%
Handhelddevice only
2%
No computer23%
Handheld device and personal
computer17%
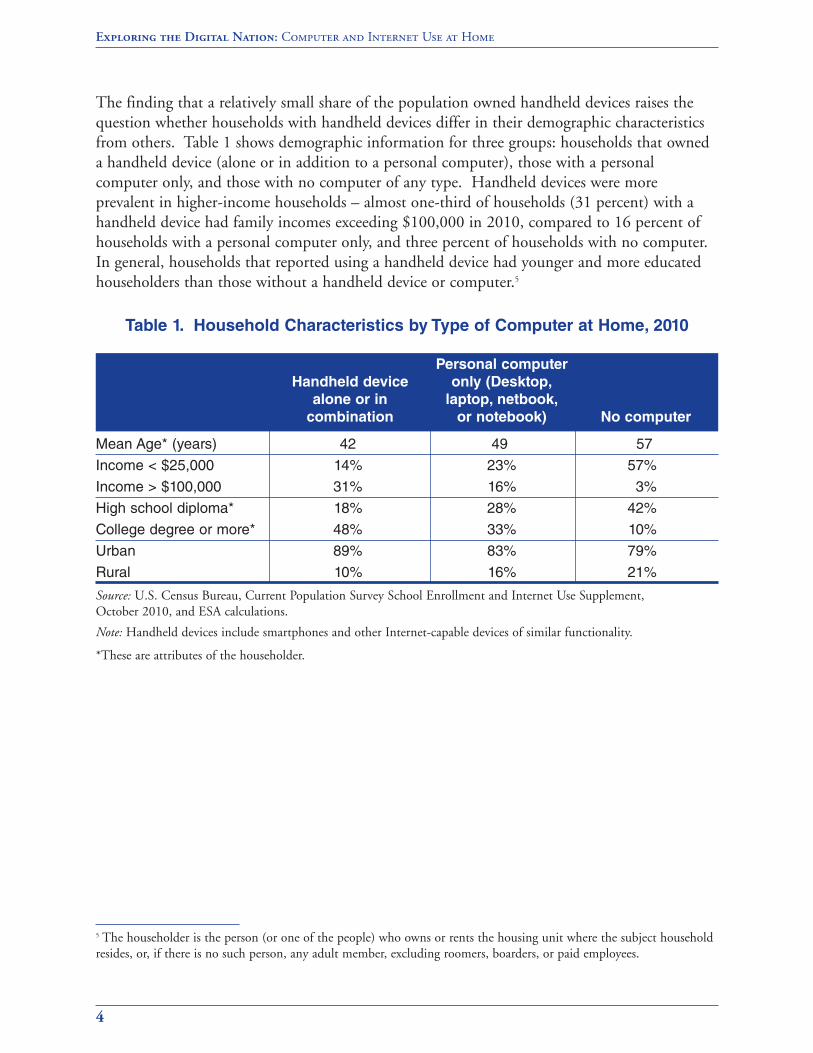
The finding that a relatively small share of the population owned handheld devices raises thequestion whether households with handheld devices differ in their demographic characteristicsfrom others. Table 1 shows demographic information for three groups: households that owneda handheld device (alone or in addition to a personal computer), those with a personalcomputer only, and those with no computer of any type. Handheld devices were moreprevalent in higher-income households – almost one-third of households (31 percent) with ahandheld device had family incomes exceeding $100,000 in 2010, compared to 16 percent ofhouseholds with a personal computer only, and three percent of households with no computer.In general, households that reported using a handheld device had younger and more educatedhouseholders than those without a handheld device or computer.5
Table 1. Household Characteristics by Type of Computer at Home, 2010
Source: U.S. Census Bureau, Current Population Survey School Enrollment and Internet Use Supplement,October 2010, and ESA calculations.
Note: Handheld devices include smartphones and other Internet-capable devices of similar functionality.
*These are attributes of the householder.
Exploring the Digital Nation: Computer and Internet Use at Home
4
Personal computer
Handheld device only (Desktop,
alone or in laptop, netbook,
combination or notebook) No computer
Mean Age* (years) 42 49 57
Income < $25,000 14% 23% 57%
Income > $100,000 31% 16% 3%
High school diploma* 18% 28% 42%
College degree or more* 48% 33% 10%
Urban 89% 83% 79%
Rural 10% 16% 21%
5 The householder is the person (or one of the people) who owns or rents the housing unit where the subject householdresides, or, if there is no such person, any adult member, excluding roomers, boarders, or paid employees.

3. Household Internet Adoption, 2010
3.1 Types of Household Internet Adoption
In 2010, more than two-thirds (68 percent) of all American households utilized broadbandInternet access services, up four percentage points (64 percent) from the previous year.6 Figure3 shows that cable modem and DSL were, by far, the leading broadband technologies forresidential Internet access, with 32 percent and 23 percent of households, respectively, utilizingthese services.7 Other broadband technologies, such as mobile broadband, fiber optics, andsatellite technologies, accounted for a small segment of household Internet connections.
A shrinking share of home Internet users – about three percent of households in 2010 – useddial-up to access the Internet, down from five percent in 2009. By combining the percentagesof households with broadband Internet access and those with dial-up services, we note thatseven out of every ten (71 percent) American households had home Internet access service in2010. Another nine percent of households had Internet users who only accessed the Internetoutside the home. Together, these figures suggest that 80 percent of American households in2010 had at least one Internet user, up three percentage points from the previous year.
Exploring the Digital Nation: Computer and Internet Use at Home
5
6 A household with at least one of the following high-speed, high capacity, two-way Internet services is considered tohave broadband: DSL, cable modem, fiber optics, satellite, mobile broadband, or some other non-dial-up Internetconnection. The CPS did not ask about the speed of the particular broadband service a household uses because of thedifficulty of gathering the information. The household-level estimate on broadband Internet access based on the totalsample has a margin of error of plus or minus 0.38 percentage points, based on a standard of error of 0.23 percentagepoints. See Appendix B, Table B2 for estimates of Internet access and standard errors for population subgroups. 7 The shares of households with DSL, cable modem, fiber optics, and satellite technologies shown in Figure 3 includehouseholds that reported having only that specific type of technology. The vast majority of households with thesetechnologies had only one type of Internet technology. In contrast, the six percent of households with mobilebroadband includes households that reported having mobile broadband, either alone or in addition to other types oftechnologies. The category “Other broadband services” includes unspecified technology types, or any othercombination of listed technology types excluding mobile broadband. For example, the total share of households withDSL was 24.6 percent, including 23.4 percent with DSL alone, 0.8 percent with DSL and mobile broadband, and 0.4percent with DSL and other broadband service. Similarly, the total share of households with cable modem was 33.9percent, with 32.0 percent with cable modem alone, 1.4 percent with cable modem and mobile broadband, and 0.5percent with cable modem and other broadband service.
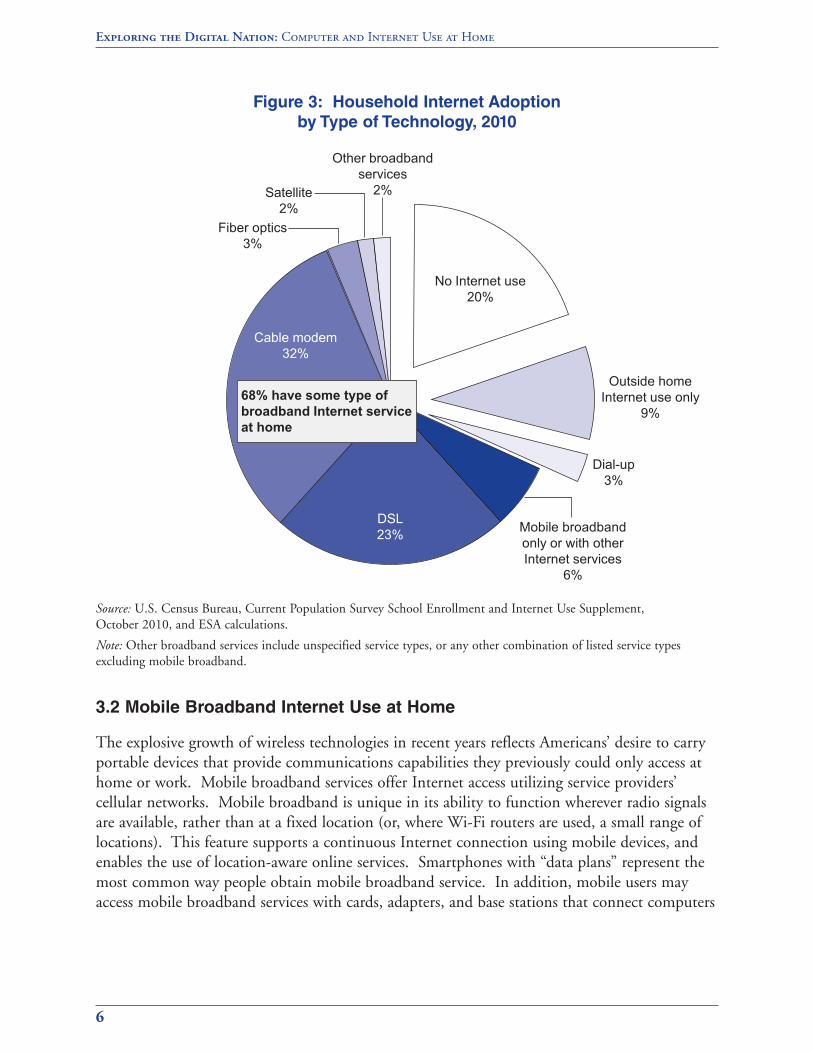
Figure 3: Household Internet Adoption
by Type of Technology, 2010
Source: U.S. Census Bureau, Current Population Survey School Enrollment and Internet Use Supplement,October 2010, and ESA calculations.
Note: Other broadband services include unspecified service types, or any other combination of listed service typesexcluding mobile broadband.
3.2 Mobile Broadband Internet Use at Home
The explosive growth of wireless technologies in recent years reflects Americans’ desire to carryportable devices that provide communications capabilities they previously could only access athome or work. Mobile broadband services offer Internet access utilizing service providers’cellular networks. Mobile broadband is unique in its ability to function wherever radio signalsare available, rather than at a fixed location (or, where Wi-Fi routers are used, a small range oflocations). This feature supports a continuous Internet connection using mobile devices, andenables the use of location-aware online services. Smartphones with “data plans” represent themost common way people obtain mobile broadband service. In addition, mobile users mayaccess mobile broadband services with cards, adapters, and base stations that connect computers
Exploring the Digital Nation: Computer and Internet Use at Home
6
Mobile broadband only or with other Internet services
6%
Satellite2%
Dial-up3%
Outside home Internet use only
9%
No Internet use20%
Other broadband services
2%
Fiber optics3%
Cable modem32%
68% have some type ofbroadband Internet service at home
DSL23%
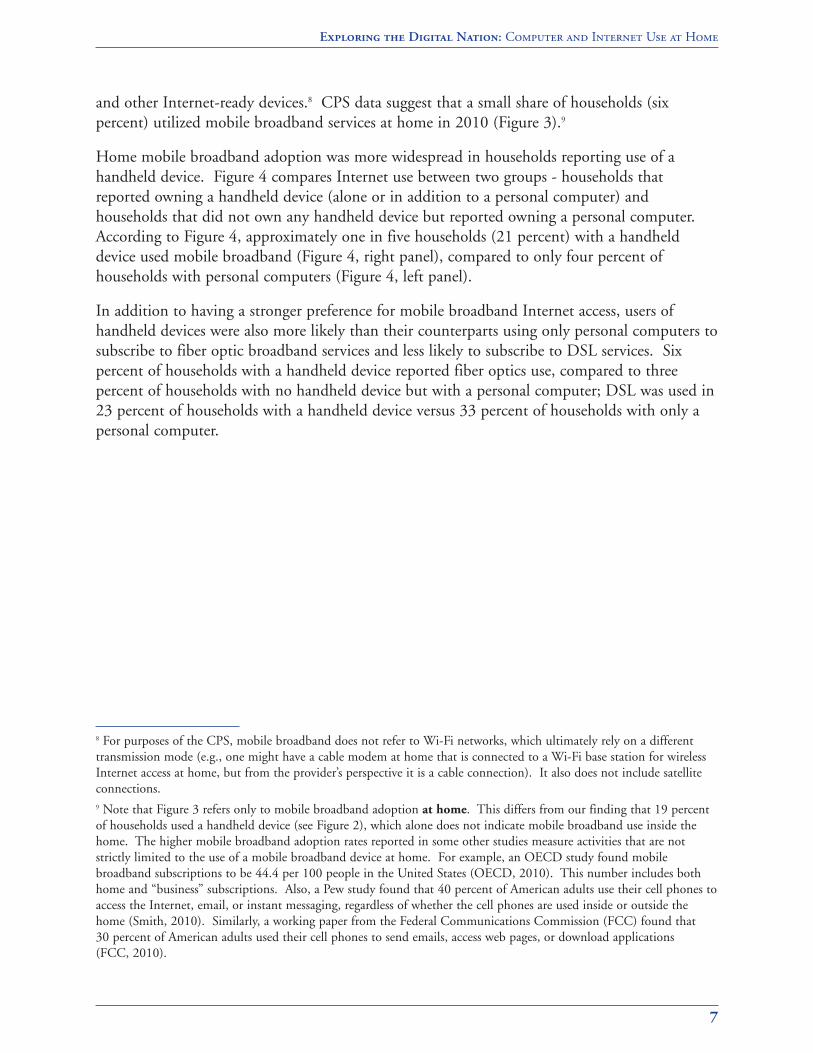
and other Internet-ready devices.8 CPS data suggest that a small share of households (sixpercent) utilized mobile broadband services at home in 2010 (Figure 3).9
Home mobile broadband adoption was more widespread in households reporting use of ahandheld device. Figure 4 compares Internet use between two groups - households thatreported owning a handheld device (alone or in addition to a personal computer) andhouseholds that did not own any handheld device but reported owning a personal computer.According to Figure 4, approximately one in five households (21 percent) with a handhelddevice used mobile broadband (Figure 4, right panel), compared to only four percent ofhouseholds with personal computers (Figure 4, left panel).
In addition to having a stronger preference for mobile broadband Internet access, users ofhandheld devices were also more likely than their counterparts using only personal computers tosubscribe to fiber optic broadband services and less likely to subscribe to DSL services. Sixpercent of households with a handheld device reported fiber optics use, compared to threepercent of households with no handheld device but with a personal computer; DSL was used in23 percent of households with a handheld device versus 33 percent of households with only apersonal computer.
Exploring the Digital Nation: Computer and Internet Use at Home
7
8 For purposes of the CPS, mobile broadband does not refer to Wi-Fi networks, which ultimately rely on a differenttransmission mode (e.g., one might have a cable modem at home that is connected to a Wi-Fi base station for wirelessInternet access at home, but from the provider’s perspective it is a cable connection). It also does not include satelliteconnections.9 Note that Figure 3 refers only to mobile broadband adoption at home. This differs from our finding that 19 percentof households used a handheld device (see Figure 2), which alone does not indicate mobile broadband use inside thehome. The higher mobile broadband adoption rates reported in some other studies measure activities that are notstrictly limited to the use of a mobile broadband device at home. For example, an OECD study found mobilebroadband subscriptions to be 44.4 per 100 people in the United States (OECD, 2010). This number includes bothhome and “business” subscriptions. Also, a Pew study found that 40 percent of American adults use their cell phones toaccess the Internet, email, or instant messaging, regardless of whether the cell phones are used inside or outside thehome (Smith, 2010). Similarly, a working paper from the Federal Communications Commission (FCC) found that30 percent of American adults used their cell phones to send emails, access web pages, or download applications(FCC, 2010).
Fig
ure
4:
Inte
rnet
Co
nn
ecti
on
Tech
no
log
y b
y H
om
e C
om
pu
ter
Typ
e,H
ou
seh
old
s,2010
Sour
ce: U
.S. C
ensu
s B
urea
u, C
urre
nt P
opul
atio
n Su
rvey
Sch
ool E
nrol
lmen
t an
d In
tern
et U
se S
uppl
emen
t, O
ctob
er 2
010,
and
ESA
cal
cula
tion
s.
Exploring the Digital Nation: Computer and Internet Use at Home
8
Fibe
r opt
ics
3%
Oth
erbr
oadb
and
serv
ices
2%M
obile
broa
dban
d4%
Sate
llite
2%
Con
nect
ion
Type
, Per
sona
l Com
pute
r Use
rsC
onne
ctio
n Ty
pe, H
andh
eld
Dev
ice
Use
rs
(alo
ne o
r in
com
bina
tion)
No
Inte
rnet
8%
DSL
33%
Cab
le m
odem
43%
Dia
l-up
4%
Fibe
r opt
ics
6%
Oth
erbr
oadb
and
serv
ices
3%
Mob
ilebr
oadb
and
21%
Sat
ellit
e2%
No
Inte
rnet
4%
DSL
23%
Cab
le m
odem
39%
Dia
l-up
1%

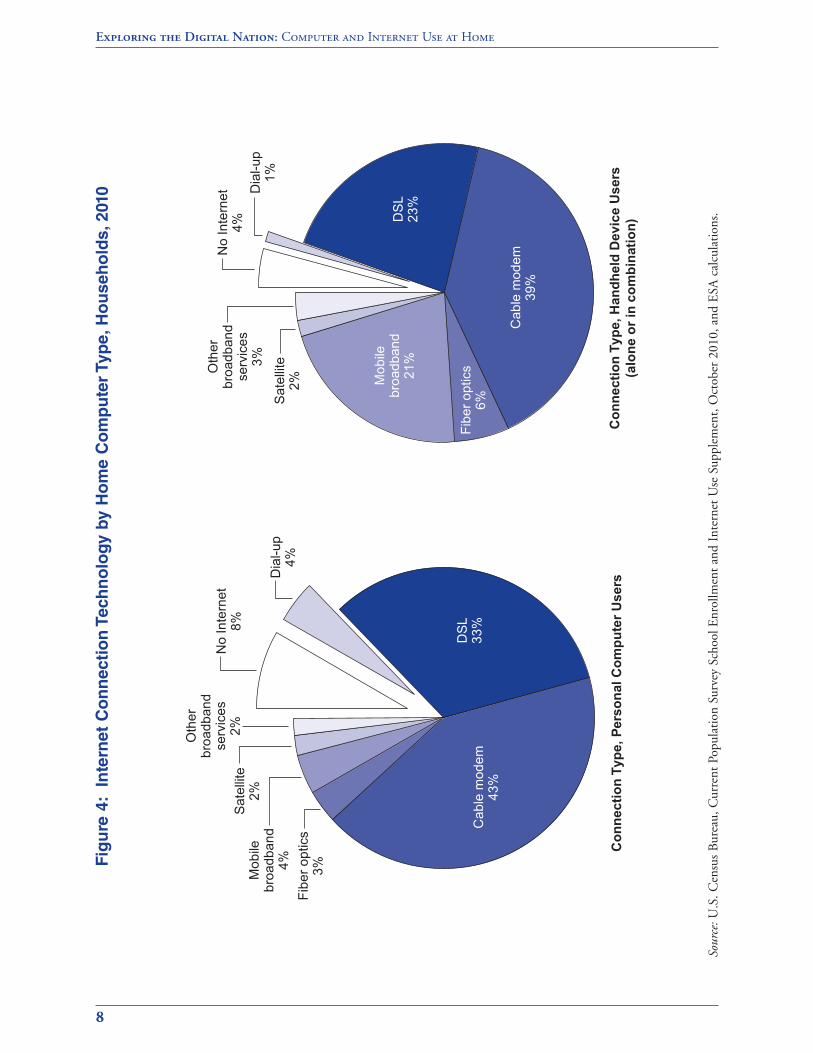
Figure 5 compares Internet use for urban and rural households. Note that this report usesmetropolitan and nonmetropolitan areas as proxies for urban and rural areas, respectively.10
Home mobile broadband penetration in 2010 was similar among urban (7 percent) and ruralhouseholds (6 percent). Both urban and rural households report cable modem and DSL as theleading broadband technologies for residential broadband Internet access. Urban households,however, were more likely to use fiber optics and cable modem connections, and less likely toutilize DSL and dial-up services than their rural counterparts.
Exploring the Digital Nation: Computer and Internet Use at Home
9
10 The geographic variable for identifying a household’s location as urban or rural is not available in the CPS public usefiles. This report uses the terms “urban” and “rural” to refer to metropolitan and nonmetropolitan areas, respectively.The definition of a metropolitan area (effective since 2000) is based on “core based statistical area” (CBSA), whichincludes both metropolitan and micropolitan statistical areas. According to the 2000 standards, each CBSA must haveat least one urban area with at least 10,000 inhabitants. Each metropolitan statistical area must contain at least oneurbanized area with a population of 50,000 or more. Each micropolitan statistical area must contain at least one urbancluster with population of between 10,000 and 50,000. As of June 6, 2003, there are 362 metropolitan statistical areasand 560 micropolitan statistical areas in the United States. For more information, see U.S. Census Bureau (2010a) andOffice of Management and Budget (2010).
Fig
ure
5:
Inte
rnet
Co
nn
ecti
on
Typ
e b
y U
rban
an
d R
ura
l L
ocati
on
,2010
Sour
ce: U
.S. C
ensu
s B
urea
u, C
urre
nt P
opul
atio
n Su
rvey
Sch
ool E
nrol
lmen
t an
d In
tern
et U
se S
uppl
emen
t, O
ctob
er 2
010,
and
ESA
cal
cula
tion
s.
Exploring the Digital Nation: Computer and Internet Use at Home
10
Rur
al H
ouse
hold
s
Cab
le m
odem
39%
Mob
ilebr
oadb
and
only
or w
ith o
ther
Inte
rnet
ser
vice
s7%
Urb
an H
ouse
hold
s
Fibe
r opt
ics
4%
Oth
erbr
oadb
and
serv
ices
2%Sa
tellit
e1%
No
Inte
rnet
use
18%
Dia
l-up
2%D
SL23
%
Cab
le m
odem
35%
Mob
ilebr
oadb
and
only
or w
ith o
ther
Inte
rnet
ser
vice
s6%
DSL
27%
Cab
le m
odem
19%
Out
side
hom
eIn
tern
etus
e on
ly11
%
Out
side
hom
eIn
tern
etus
e on
ly9%
Dia
l-up
5%
Fibe
rop
tics
1%
Sate
llite
3%N
o In
tern
etus
e28
%
Oth
erbr
oadb
and
serv
ices
1%

4. Computer and Home Internet Use by Household
Demographic Characteristics and Geography, 2010
This section studies how computer use and home Internet adoption vary across households withdifferent demographic and socio-economic backgrounds. It also examines the impact ofgeographic location on computer ownership and home Internet access. The results are useful toidentify groups that lagged – or led – in adoption of these technologies in 2010. Sections 4.1and 4.2 look at Internet adoption rates by demographic attributes and geography. Section 4.3utilizes regression analysis to evaluate specifically broadband Internet adoption amongcomparable households.
The results indicate that households with lower incomes and less education, as well as Blacks,Hispanics, people with disabilities, and rural residents were less likely to have home Internetaccess service. However, differences in socio-economic attributes do not entirely explain whycertain racial and ethnic groups or rural residents lagged in adoption. Further, householdswithout computers comprised the vast majority of non-adopters of home broadband Internetaccess services. Predictably, the majority of computer users also utilized broadband at home.
4.1 Demographic and Geographic Gaps in Computer and Internet Use
Figure 6 shows that home computer use and Internet adoption are strongly associated withincome. Almost half (46 percent) of the households in the lowest-income category did not havea computer, compared to only four percent of the highest-income households.
Focusing on broadband, adoption exhibited a similar relationship with income. Less than half(43 percent) of all households with annual household incomes below $25,000 in 2010 reportedhaving broadband Internet access at home, compared with the vast majority (93 percent) ofhouseholds with incomes exceeding $100,000. Dial-up service, however, accounted for a verysmall segment of households with Internet access irrespective of income (ranging from onepercent to three percent of all households depending on income).
The total share of households with computers, as shown by the blue segments of each verticalbar in Figure 6, consists of households with broadband, dial-up, and those that reported havinga computer, but no Internet access. The vast majority of this computer-using group hadbroadband Internet access at home. Moreover, this pattern was visible across income groups,suggesting that broadband adoption was more consistent among computer users than among allhouseholds across income groups. Almost four-fifths (79 percent) of households with computersand incomes below $25,000 used broadband at home, compared to 96 percent of computer-using households with incomes exceeding $100,000.11
Exploring the Digital Nation: Computer and Internet Use at Home
11
11 These percentages are based on calculations set forth in Appendix B, Table B2.

Figure 6: Computer and Internet Use
by Household Income, 2010
Source: U.S. Census Bureau, Current Population Survey School Enrollment and Internet Use Supplement,October 2010, and ESA calculations.
Figure 7 illustrates home Internet access and computer ownership by presence of school-agechildren (between 6 and 17 years of age). Households with one or more children between 6 and17 years of age were more likely to own a computer (86 percent) and to have home broadbandInternet access services (78 percent) than households with no school-age children (computerand broadband adoption rates were 74 percent and 65 percent, respectively).12 Dial-up Internetaccess service was also less prevalent among households with school-age children (2 percent)than those without children (3 percent).
Exploring the Digital Nation: Computer and Internet Use at Home
12
12 Percentages in this paragraph are based on calculations of the actual numbers (see Appendix B, Table B2) and may notprecisely equal the sum of the percentages shown in the accompanying figure due to rounding.
43%
66%
81%88%
93%3%
3%
3%
2% 1%
8%
7%
4%
3%2%
46%
24%
12%7% 4%
0%
10%
20%
30%
40%
50%
60%
70%
80%
90%
100%
Less than $25,0000
$25,000-$50,000
$50,000-$75,000
$75,000-$100,000
$100,000or more
No computer
Computer, no Internet
Dial-up
Broadband

Figure 7: Computer and Internet Use
by Presence of School-Age Children, 2010
Source: U.S. Census Bureau, Current Population Survey School Enrollment and Internet Use Supplement,October 2010, and ESA calculations.
We find a similar relationship between home computer use and broadband adoption. Thesubstantial majority of households with computers had broadband Internet access. Amongcomputer owners, 91 percent of households with one or more school-age children, and 88percent of households with no school-age child, utilized broadband (see Appendix B, Table B2).
Figure 8 shows home computer use and Internet adoption by householder age. Olderhouseholders, particularly those ages 65 and older, were less likely than their youngercounterparts to live in a home with a computer (55 percent) or have broadband Internet accessservice at home (45 percent). Unsurprisingly, the differences in broadband adoption across agecategories were much less pronounced among computer owners. Among households withcomputers, 91 percent of householders ages 16 to 44 years had broadband service, compared to82 percent of their older counterparts, 65 years and older (see Appendix B, Table B2).
Exploring the Digital Nation: Computer and Internet Use at Home
13
No computer
Computer, no Internet
Dial-up
Broadband78%
65%
2%
3%
6%
6%
14%
27%
0%
10%
20%
30%
40%
50%
60%
70%
80%
90%
100%
Households with school-age children
Households without school-age children

Figure 8: Computer and Internet Use
by Householder Age, 2010
Source: U.S. Census Bureau, Current Population Survey School Enrollment and Internet Use Supplement,October 2010, and ESA calculations.
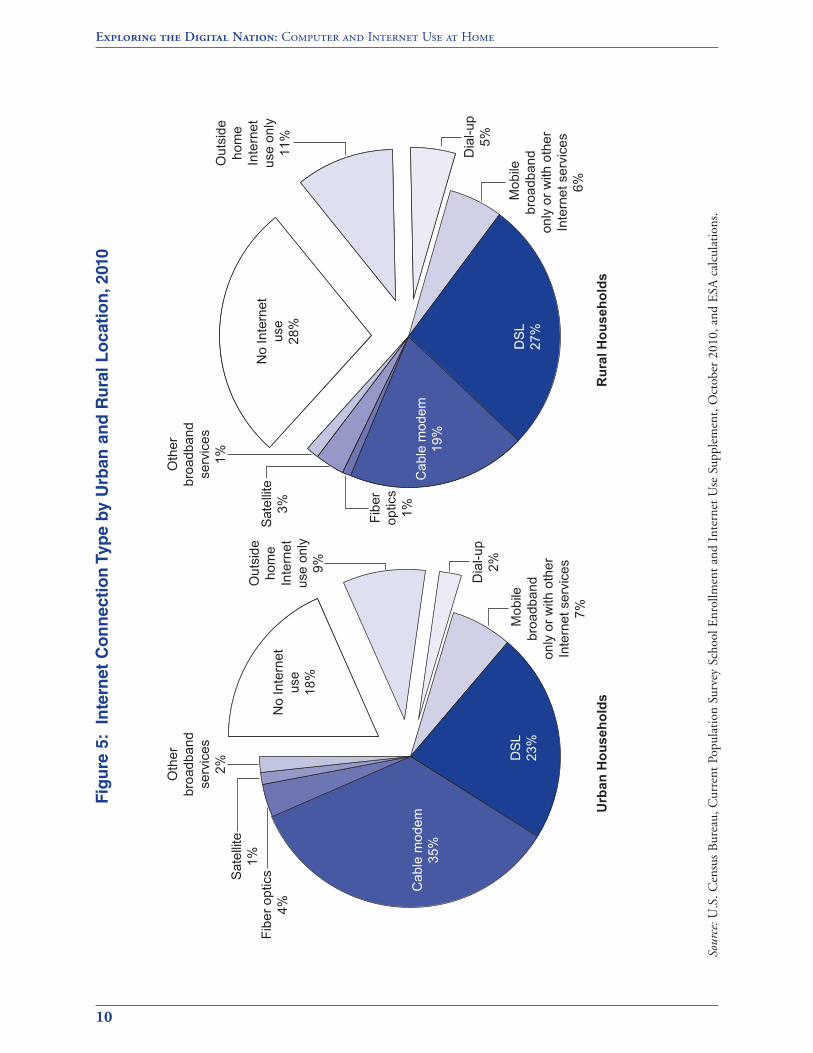
Figure 9 displays the data by race and ethnicity. Asian households exhibited the highest rates ofhome computer ownership (86 percent) and broadband service (81 percent), followed by Whitehouseholds (80 percent owned a computer and 72 percent had home broadband Internetservices).13 Hispanic households and Black households lagged behind – only about two-thirdsof Black households and Hispanic households (65 percent and 67 percent, respectively) had acomputer at home, and only slightly more than half of all Black and Hispanic households (55percent and 57 percent, respectively) had broadband service.14 Households headed by American
Exploring the Digital Nation: Computer and Internet Use at Home
14
No computer
Computer, no Internet
Dial-up
Broadband77%72%
45%
2% 3%
4%
6%5%
6%
16%20%
45%
0%
10%
20%
30%
40%
50%
60%
70%
80%
90%
100%
16-44 years 45-64 years 65 years and older
13 As described in the Data and Methodology section (Appendix A), the data on race and ethnicity (as well as education,age, disability status, and foreign-born status) are for the householder. As a result, “White households” (for example)refer to households headed by a White person. The same definition applies to Black, Hispanic, Asian, and AmericanIndian or Alaska Native households. Data for Whites, Blacks, Asians, and American Indians and Alaska Natives do notinclude people of Hispanic origin. Persons of Hispanic origin may be of any race.14 Percentages in this paragraph are based on calculations of the actual numbers (see Appendix B, Table B2) and may notprecisely equal the sum of the percentages shown in the accompanying figure due to rounding.
Indian or Alaska Native householders also had computer use (66 percent) and broadbandadoption (52 percent) rates that trailed the national average (see Appendix B, Table B2).15
Figure 9: Computer and Internet Use
by Householder Race and Ethnicity, 2010
Source: U.S. Census Bureau, Current Population Survey School Enrollment and Internet Use Supplement,October 2010, and ESA calculations.
Note: Data for Whites, Blacks, Asians, and American Indians and Alaska Natives do not include people of Hispanicorigin. Persons of Hispanic origin may be of any race.
Data for only computer-using households show a less pronounced race- and ethnicity-relatedgap in broadband adoption. Among households using computers, broadband Internet adoptionrates were 94 percent for Asians, 90 percent for Whites, and 86 percent for both Black andHispanic households (see Appendix B, Table B2). This again suggests that computer use isstrongly correlated with broadband Internet access at home.
Exploring the Digital Nation: Computer and Internet Use at Home
15
15 Figure 9 does not include data on American Indian and Alaska Native householders due to data limitations for thisgroup by Internet connection technology.
No computer
Computer, no Internet
Dial-up
Broadband81%72%
55% 57%
2%3%
2% 2%
4%
5%
7% 7%
14%20%
35% 33%
0%
10%
20%
30%
40%
50%
60%
70%
80%
90%
100%
HispanicAsian, non-Hispanic
White, non-Hispanic
Black, non-Hispanic
Exploring the Digital Nation: Computer and Internet Use at Home
16
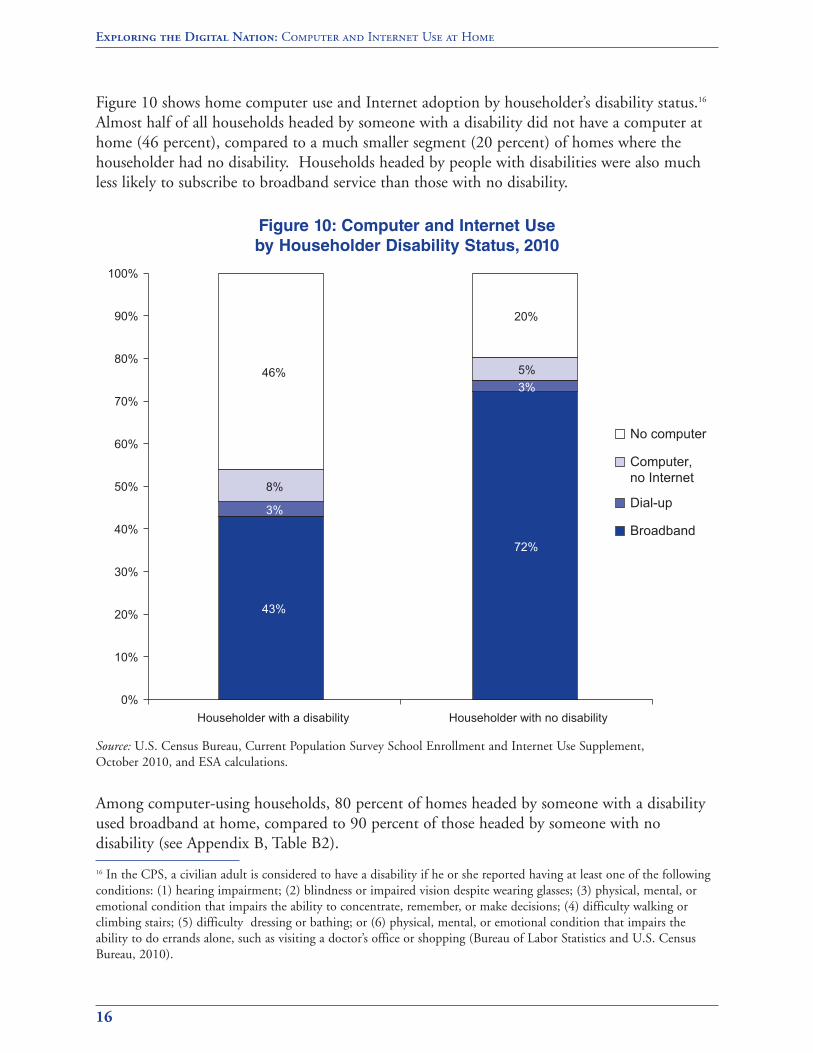
Figure 10 shows home computer use and Internet adoption by householder’s disability status.16
Almost half of all households headed by someone with a disability did not have a computer athome (46 percent), compared to a much smaller segment (20 percent) of homes where thehouseholder had no disability. Households headed by people with disabilities were also muchless likely to subscribe to broadband service than those with no disability.
Figure 10: Computer and Internet Use
by Householder Disability Status, 2010
Source: U.S. Census Bureau, Current Population Survey School Enrollment and Internet Use Supplement,October 2010, and ESA calculations.
Among computer-using households, 80 percent of homes headed by someone with a disabilityused broadband at home, compared to 90 percent of those headed by someone with nodisability (see Appendix B, Table B2).
16 In the CPS, a civilian adult is considered to have a disability if he or she reported having at least one of the followingconditions: (1) hearing impairment; (2) blindness or impaired vision despite wearing glasses; (3) physical, mental, oremotional condition that impairs the ability to concentrate, remember, or make decisions; (4) difficulty walking orclimbing stairs; (5) difficulty dressing or bathing; or (6) physical, mental, or emotional condition that impairs theability to do errands alone, such as visiting a doctor’s office or shopping (Bureau of Labor Statistics and U.S. CensusBureau, 2010).
No computer
Computer, no Internet
Dial-up
Broadband
43%
72%
3%
3%
8%
5%46%
20%
0%
10%
20%
30%
40%
50%
60%
70%
80%
90%
100%
Householder with a disability Householder with no disability

Exploring the Digital Nation: Computer and Internet Use at Home
17
The next three figures show household computer ownership and Internet use data bygeographic location. Figure 11 demonstrates that one out of five urban households (22 percent)did not own a computer in 2010, compared to roughly one out of three (30 percent) ruralhouseholds. Urban (metropolitan) dwellers also were more likely than their rural (non-metropolitan) counterparts to have broadband Internet access at home (70 percent comparedto 57 percent). Rural residents were more likely to utilize dial-up services to go online – fivepercent of rural households utilized dial-up services, compared with two percent of urban dwellers.
Figure 11: Computer and Internet Use
by Urban and Rural Location, 2010
Source: U.S. Census Bureau, Current Population Survey School Enrollment and Internet Use Supplement,October 2010, and ESA calculations.
Among computer owners, 90 percent of urban households and 82 percent of rural householdsused broadband services (see Appendix B, Table B2).
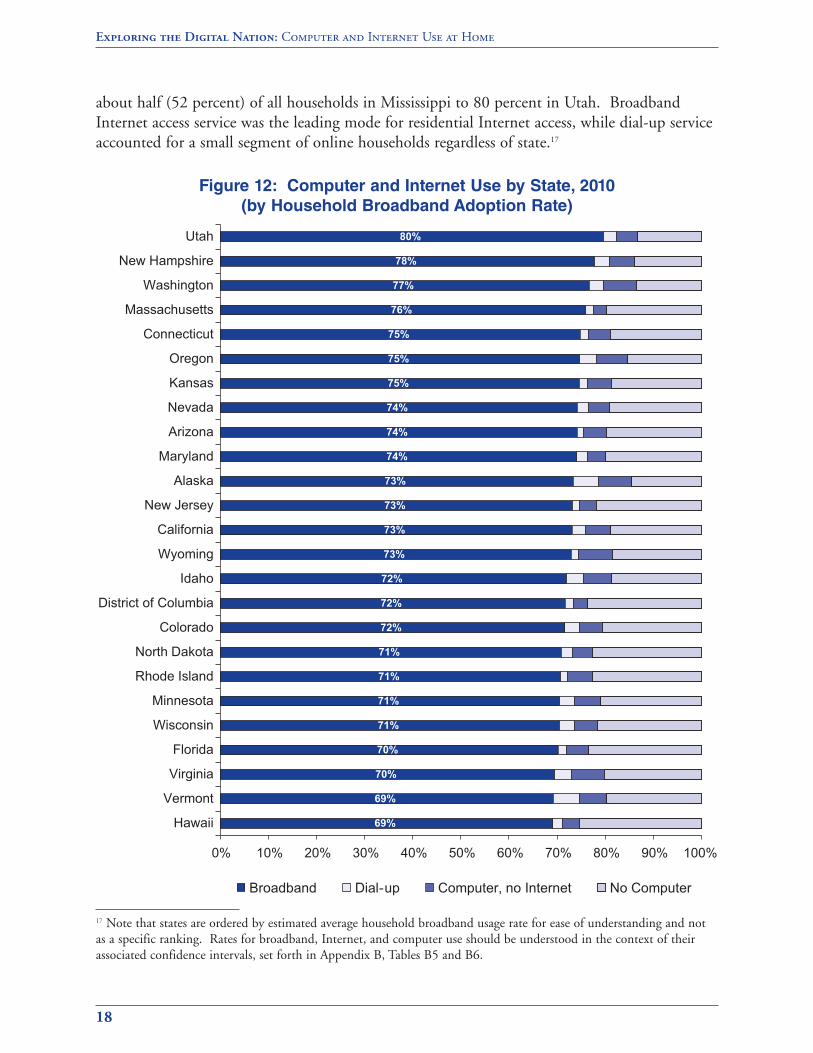
Figure 12 shows computer and Internet use by state. Proportions of households without acomputer at home ranged from about one-third of households (33 percent) in Mississippi to13 percent of households in Utah. Average broadband adoption in 2010 varied by state from
No computer
Computer, no Internet
Dial-up
Broadband70%
57%
2%
5%
5%
8%
22%30%
0%
10%
20%
30%
40%
50%
60%
70%
80%
90%
100%
Urban (Metropolitan) Rural (Non-metropolitan)
Exploring the Digital Nation: Computer and Internet Use at Home
18
about half (52 percent) of all households in Mississippi to 80 percent in Utah. BroadbandInternet access service was the leading mode for residential Internet access, while dial-up serviceaccounted for a small segment of online households regardless of state.17
Figure 12: Computer and Internet Use by State, 2010
(by Household Broadband Adoption Rate)
17 Note that states are ordered by estimated average household broadband usage rate for ease of understanding and notas a specific ranking. Rates for broadband, Internet, and computer use should be understood in the context of theirassociated confidence intervals, set forth in Appendix B, Tables B5 and B6.
69%
69%
70%
70%
71%
71%
71%
71%
72%
72%
72%
73%
73%
73%
73%
74%
74%
74%
75%
75%
75%
76%
77%
78%
80%
0% 10% 20% 30% 40% 50% 60% 70% 80% 90% 100%
Hawaii
Vermont
Virginia
Florida
Wisconsin
Minnesota
Rhode Island
North Dakota
Colorado
District of Columbia
Idaho
Wyoming
California
New Jersey
Alaska
Maryland
Arizona
Nevada
Kansas
Oregon
Connecticut
Massachusetts
Washington
New Hampshire
Utah
Broadband Dial-up Computer, no Internet No Computer

Exploring the Digital Nation: Computer and Internet Use at Home
19
Figure 12: Computer and Internet Use by State, 2010, cont’d
(by Household Broadband Adoption Rate)
Source: U.S. Census Bureau, Current Population Survey School Enrollment and Internet Use Supplement,October 2010, and ESA calculations.
Note: Because of sampling variability, average adoption rates for two states may not be different from one another in astatistically significant way. Tables B5 and B6 in Appendix B provide the 90 percent confidence interval for each state.
Broadband Dial-up Computer, no Internet No Computer
52%
52%
56%
58%
58%
59%
59%
59%
60%
60%
61%
62%
64%
64%
65%
66%
66%
67%
67%
67%
67%
68%
69%
69%
69%
69%
0% 10% 20% 30% 40% 50% 60% 70% 80% 90% 100%
Mississippi
Arkansas
Alabama
New Mexico
Kentucky
Indiana
West Virginia
Tennessee
South Carolina
Louisiana
Montana
Oklahoma
Ohio
Missouri
North Carolina
South Dakota
Michigan
Texas
Maine
Pennsylvania
Iowa
Delaware
Georgia
Illinois
Nebraska
New York
Exploring the Digital Nation: Computer and Internet Use at Home
20
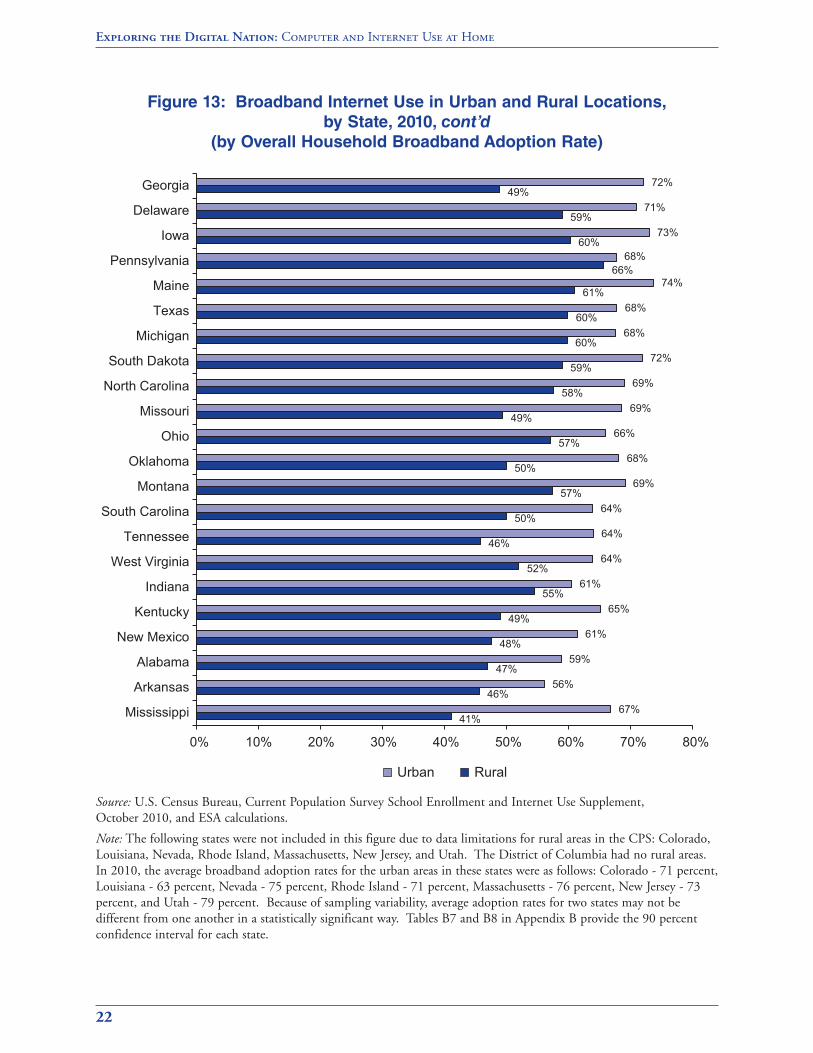
The pattern of generally higher broadband adoption in urban compared to rural areas occurredacross states. Figure 13 shows the share of urban and rural households with broadband serviceby state. The urban-rural gap in broadband adoption varied from zero percent in California(that is, average broadband adoption rates were practically the same in urban and rural areas ofCalifornia) to 26 percent in Mississippi, where the average broadband adoption rates rangedfrom 67 percent in urban areas to 41 percent in rural areas.18
18 Id. See Appendix B, Tables B7, B8.

Figure 13: Broadband Internet Use in Urban and Rural Locations,
by State, 2010
(by Overall Household Broadband Adoption Rate)
Exploring the Digital Nation: Computer and Internet Use at Home
21
58%
59%
64%
64%
64%
49%
60%
65%
65%
64%
62%
71%
73%
66%
64%
64%
67%
66%
69%
68%
72%
70%
75%
69%
71%
81%
73%
71%
72%
72%
78%
78%
78%
73%
77%
75%
76%
79%
77%
75%
77%
81%
0% 10% 20% 30% 40% 50% 60% 70% 80% 90%
Illinois
Nebraska
New York
Hawaii
Vermont
Virginia
Florida
Wisconsin
Minnesota
North Dakota
Idaho
Wyoming
California
Alaska
Maryland
Arizona
Kansas
Oregon
Connecticut
Washington
New Hampshire
Urban Rural
Exploring the Digital Nation: Computer and Internet Use at Home
22
Figure 13: Broadband Internet Use in Urban and Rural Locations,
by State, 2010, cont’d
(by Overall Household Broadband Adoption Rate)
Source: U.S. Census Bureau, Current Population Survey School Enrollment and Internet Use Supplement,October 2010, and ESA calculations.
Note: The following states were not included in this figure due to data limitations for rural areas in the CPS: Colorado,Louisiana, Nevada, Rhode Island, Massachusetts, New Jersey, and Utah. The District of Columbia had no rural areas.In 2010, the average broadband adoption rates for the urban areas in these states were as follows: Colorado - 71 percent,Louisiana - 63 percent, Nevada - 75 percent, Rhode Island - 71 percent, Massachusetts - 76 percent, New Jersey - 73percent, and Utah - 79 percent. Because of sampling variability, average adoption rates for two states may not bedifferent from one another in a statistically significant way. Tables B7 and B8 in Appendix B provide the 90 percentconfidence interval for each state.
Urban Rural
41%
46%
47%
48%
49%
55%
52%
46%
50%
57%
50%
57%
49%
58%
59%
60%
60%
61%
66%
60%
59%
49%
67%
56%
59%
61%
65%
61%
64%
64%
64%
69%
68%
66%
69%
69%
72%
68%
68%
74%
68%
73%
71%
72%
0% 10% 20% 30% 40% 50% 60% 70% 80%
Mississippi
Arkansas
Alabama
New Mexico
Kentucky
Indiana
West Virginia
Tennessee
South Carolina
Montana
Oklahoma
Ohio
Missouri
North Carolina
South Dakota
Michigan
Texas
Maine
Pennsylvania
Iowa
Delaware
Georgia
4.2 A Detailed Look at Computer and Broadband Internet Use by
Demographic Characteristics and Geography
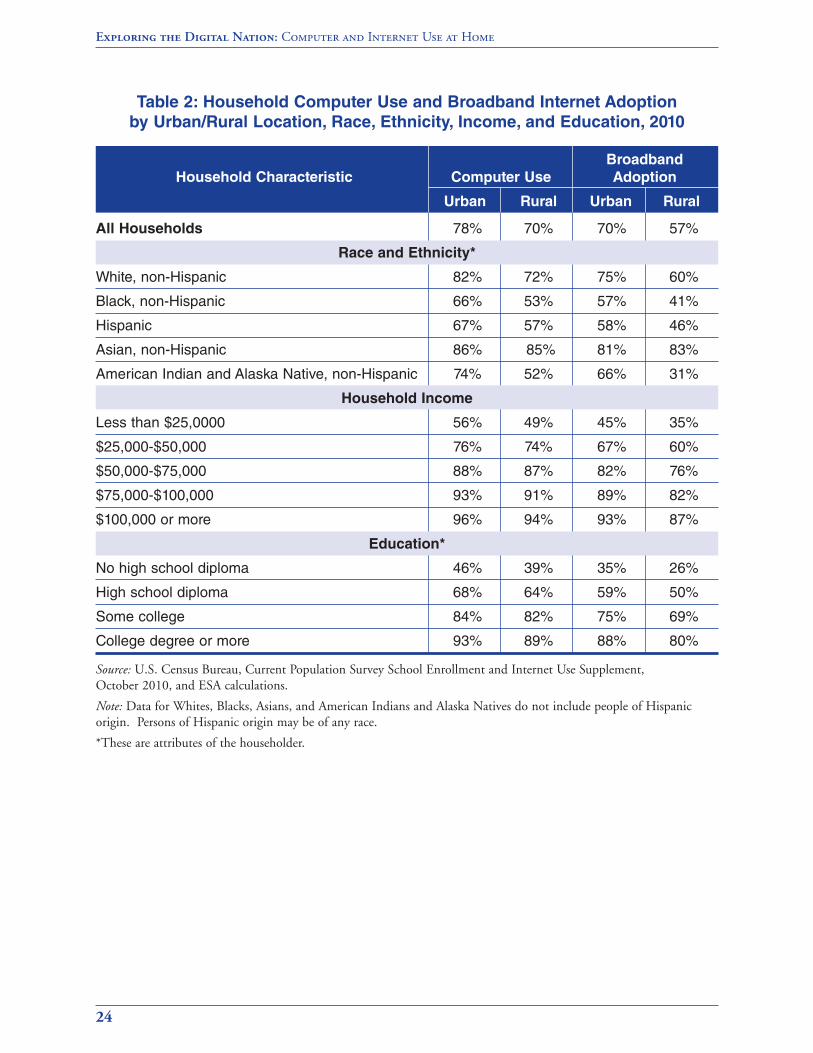
This section provides a more detailed analysis of the survey results with respect to demographiccharacteristics and geography. The previous section identified the households exhibiting lowand high levels of computer use and Internet access service adoption, and separately, their urbanor rural locations. This section combines the “who” and “where” in our identification of lowand high adopters.
Table 2 shows computer use and broadband Internet adoption by race, ethnicity, income, andeducation within urban and rural areas. Households headed by someone without a high schooldiploma had particularly low home computer use and broadband service adoption, while ruralhouseholds displayed slightly lower rates than their urban counterparts. Among householdsheaded by someone without a high school diploma, 39 percent of rural households and46 percent of urban households used a computer; and 26 percent of rural households and35 percent of urban households had broadband service. Compared to the national average of68 percent, broadband Internet adoption was also particularly low among rural households withincomes less than $25,000 (35 percent), and rural households headed by someone of AmericanIndian or Alaska Native background (31 percent).
Exploring the Digital Nation: Computer and Internet Use at Home
23
Exploring the Digital Nation: Computer and Internet Use at Home
24
Table 2: Household Computer Use and Broadband Internet Adoption
by Urban/Rural Location, Race, Ethnicity, Income, and Education, 2010
Source: U.S. Census Bureau, Current Population Survey School Enrollment and Internet Use Supplement,October 2010, and ESA calculations.
Note: Data for Whites, Blacks, Asians, and American Indians and Alaska Natives do not include people of Hispanicorigin. Persons of Hispanic origin may be of any race.
*These are attributes of the householder.
Broadband
Household Characteristic Computer Use Adoption
Urban Rural Urban Rural
All Households 78% 70% 70% 57%
Race and Ethnicity*
White, non-Hispanic 82% 72% 75% 60%
Black, non-Hispanic 66% 53% 57% 41%
Hispanic 67% 57% 58% 46%
Asian, non-Hispanic 86% 85% 81% 83%
American Indian and Alaska Native, non-Hispanic 74% 52% 66% 31%
Household Income
Less than $25,0000 56% 49% 45% 35%
$25,000-$50,000 76% 74% 67% 60%
$50,000-$75,000 88% 87% 82% 76%
$75,000-$100,000 93% 91% 89% 82%
$100,000 or more 96% 94% 93% 87%
Education*
No high school diploma 46% 39% 35% 26%
High school diploma 68% 64% 59% 50%
Some college 84% 82% 75% 69%
College degree or more 93% 89% 88% 80%

Exploring the Digital Nation: Computer and Internet Use at Home
25
Table 3 contains data on computer use and broadband Internet adoption by race, ethnicity,family income, and urban or rural location. Rural Black and Hispanic households with familyincomes below $25,000 had the lowest rates of home computer use (44 percent for Blacks,45 percent for Hispanics) and broadband Internet adoption (32 percent for Blacks, 30 percentfor Hispanics).
Table 3: Household Computer Use and Broadband Internet Adoption
by Urban/Rural Location, Race, Ethnicity, and Income, 2010
Source: U.S. Census Bureau, Current Population Survey School Enrollment and Internet Use Supplement,October 2010, and ESA calculations.
Note: Data for Whites, Blacks, Asians, and American Indians and Alaska Natives do not include people of Hispanicorigin. Persons of Hispanic origin may be of any race. Non-Hispanic Asians, and non-Hispanic American Indians andAlaska Natives are not included in this table due to small sample issues.
Table 4 displays a similar pattern of computer use and broadband Internet adoption by race andeducational attainment, and by urban or rural location. Households headed by a Blackhouseholder without a high school diploma and living in rural areas exhibited the lowest levelsof home computer use (27 percent) and broadband Internet adoption (16 percent).
Broadband
Race, Ethnicity, and Income Computer Use Adoption
Urban Rural Urban Rural
All Households 78% 70% 70% 57%
White, non-Hispanic
Less than $25,0000 60% 50% 49% 36%
$25,000-$50,000 78% 75% 69% 62%
$50,000-$75,000 89% 87% 83% 76%
$75,000 or more 96% 93% 92% 85%
Black, non-Hispanic
Less than $25,0000 49% 44% 39% 32%
$25,000-$50,000 70% 64% 60% 47%
$50,000-$75,000 83% 77% 76% 70%
$75,000 or more 90% 85% 84% 81%
Hispanic
Less than $25,0000 49% 45% 38% 30%
$25,000-$50,000 71% 60% 60% 53%
$50,000-$75,000 84% 85% 77% 79%
$75,000 or more 93% 86% 88% 76%

Table 4: Household Computer Use and Broadband Internet Adoption
by Urban/Rural Location, Race, Ethnicity, and Education 2010
Source: U.S. Census Bureau, Current Population Survey School Enrollment and Internet Use Supplement,October 2010, and ESA calculations.
Note: Data for Whites, Blacks, Asians, and American Indians and Alaska Natives do not include people of Hispanicorigin. Persons of Hispanic origin may be of any race. Non-Hispanic Asians, and non-Hispanic American Indians andAlaska Natives are not included in this table due to small sample issues.
4.3 Marginal Effects of Household Characteristics on the Likelihood that a
Household Uses Broadband Internet Access Service
The finding that socio-economic characteristics, as well as race, ethnicity, and geographiclocation are highly correlated with household technology usage patterns might be misleading, asthese household attributes are themselves correlated with each other. For instance, income andeducation are likely to be higher in urban areas if employment opportunities requiring highlevels of skill and specialization are disproportionately located in urban areas. As a result, it isnot clear from the tabulations how much of the urban-rural gap in home broadband adoptionresults from socio-economic differences between urban and rural residents. The same issueapplies for the tabulations by race and ethnicity.
Exploring the Digital Nation: Computer and Internet Use at Home
26
Computer Broadband
Householder Characteristic Use Adoption
Urban Rural Urban Rural
All Households 78% 70% 70% 57%
White, non-Hispanic
No high school diploma 47% 42% 37% 27%
High school diploma 70% 65% 62% 52%
Some college 86% 83% 78% 70%
College degree or more 93% 90% 89% 80%
Black, non-Hispanic
No high school diploma 36% 27% 27% 16%
High school diploma 57% 50% 47% 38%
Some college 74% 73% 64% 56%
College degree or more 87% 82% 81% 75%
Hispanic
No high school diploma 47% 38% 35% 28%
High school diploma 65% 59% 56% 45%
Some college 83% 81% 74% 73%
College degree or more 90% 83% 84% 72%
Exploring the Digital Nation: Computer and Internet Use at Home
27
By utilizing regression analysis, we can estimate the marginal or “isolated” association betweentechnology usage and a particular household characteristic.19 For example, one way ofestimating the marginal effect of living in an urban area on broadband adoption is bycomparing broadband adoption among urban and rural households that are otherwise similarwith respect to key determinants of broadband adoption, such as income, education, race,ethnicity, age, state of residence, and other factors. In other words, the marginal effect of livingin an urban rather than a rural location is the gap in average broadband adoption betweenurban and rural households, after accounting for differences in socio-economic anddemographic characteristics.
The rest of this section utilizes regression analysis to estimate the relationship between selecteddemographic and geographic characteristics and home broadband Internet adoption. Thefactors for which we control in this analysis include household income, education, age, race,ethnicity, foreign-born status, household composition (total number of persons in a householdand whether a related school-age child lives there), disability status, and geographic location(urban-rural location and state). For characteristics like education, race, ethnicity, age, disabilitystatus, and foreign-born status, we use information for the householder.
Note that the CPS data do not provide information on availability and price of Internet accessservices in a household’s immediate location, both of which are important determinants ofadoption. Even though we are unable to control directly for price and availability, theregression analysis accounts for a household’s geographic location (urban or rural location, thepopulation size of a household’s urban area, and state) and therefore would capture some of thevariation in price and availability along these geographic dimensions.20
We present the results from this regression analysis in Table B4 of Appendix B. Figures 14-18graphically present the gaps in broadband adoption. Each figure uses a pair of bars to displaythe adoption gap between two groups of households. Within each pair, the left bar (which isalso the longer bar) shows the simple gap in average adoption before controlling for otherhousehold attributes. The right bar (which is also the shorter bar) shows the remainingadoption gap which is unexplained by our model, that is, it is the remaining gap afteraccounting for differences in household demographic, socio-economic, and geographiccharacteristics. Within each figure, the left panel (or pair of bars) presents the adoption gapinformation based on data for all households, and the right panel shows the information basedon the sample of computer owners only.
19 Household characteristics include income, education, age, race, disability status, citizenship status, presence ofchildren, and population density. See Table B4 in Appendix B for more detail.20 The results presented in Appendix B, Table B4 show the urban-rural gap by urban area size.
Exploring the Digital Nation: Computer and Internet Use at Home
28
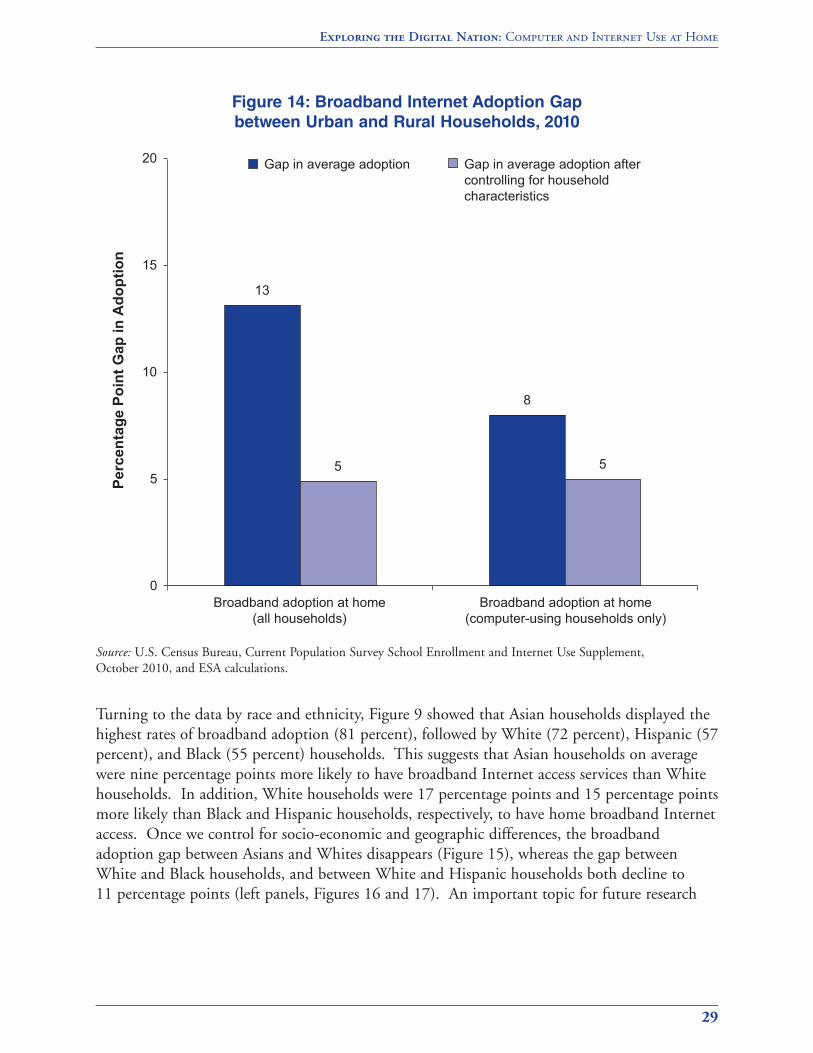
Figure 14 shows the adoption gaps between urban and rural households. According to Figure11 from the previous section, 70 percent and 57 percent of urban and rural households,respectively, reported having broadband service at home, identifying a 13 percentage point gapin broadband adoption between urban and rural households (represented by the left bar in theleft panel of Figure 14). After we account for socio-economic and demographic differencesbetween urban and rural households, the remaining adoption gap is five percentage points(represented by the right bar in the left panel of Figure 14).
The right panel of Figure 14 shows the urban-rural adoption gap among computer users only.Ninety percent of urban households with computers and 82 percent of rural households withcomputers reported having broadband at home, indicating an eight percentage point gap.After accounting for socio-economic and demographic attributes, the gap declines to fivepercentage points. This suggests that, even among computer owners of similar income,education, age, and other demographic characteristics, urban dwellers were on average fivepercentage points more likely than their rural counterparts to adopt home broadband service.The variation in price and availability of broadband services could account for part of thisunexplained urban-rural gap.
Exploring the Digital Nation: Computer and Internet Use at Home
29
Figure 14: Broadband Internet Adoption Gap
between Urban and Rural Households, 2010
Source: U.S. Census Bureau, Current Population Survey School Enrollment and Internet Use Supplement,October 2010, and ESA calculations.
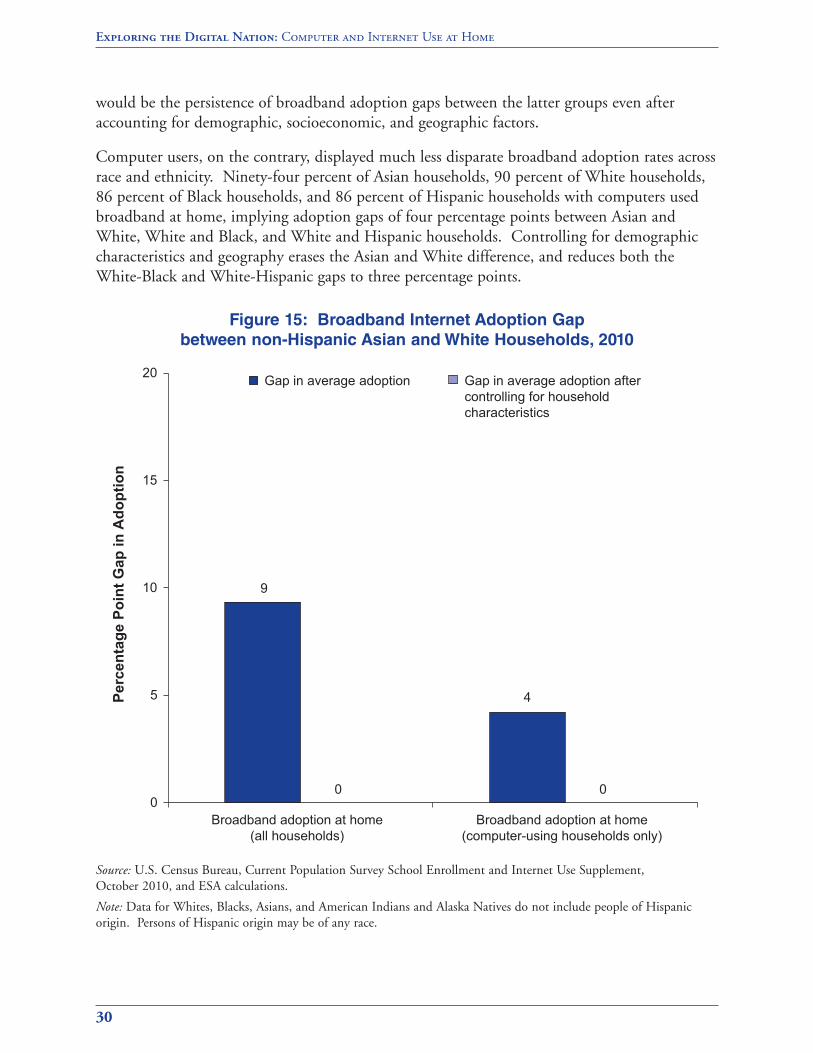
Turning to the data by race and ethnicity, Figure 9 showed that Asian households displayed thehighest rates of broadband adoption (81 percent), followed by White (72 percent), Hispanic (57percent), and Black (55 percent) households. This suggests that Asian households on averagewere nine percentage points more likely to have broadband Internet access services than Whitehouseholds. In addition, White households were 17 percentage points and 15 percentage pointsmore likely than Black and Hispanic households, respectively, to have home broadband Internetaccess. Once we control for socio-economic and geographic differences, the broadbandadoption gap between Asians and Whites disappears (Figure 15), whereas the gap betweenWhite and Black households, and between White and Hispanic households both decline to11 percentage points (left panels, Figures 16 and 17). An important topic for future research
13
8
5 5
0
5
10
15
20
Perc
enta
ge P
oint
Gap
in A
dopt
ion
Gap in average adoption Gap in average adoption aftercontrolling for householdcharacteristics
Broadband adoption at home(all households)
Broadband adoption at home(computer-using households only)
Exploring the Digital Nation: Computer and Internet Use at Home
30
would be the persistence of broadband adoption gaps between the latter groups even afteraccounting for demographic, socioeconomic, and geographic factors.
Computer users, on the contrary, displayed much less disparate broadband adoption rates acrossrace and ethnicity. Ninety-four percent of Asian households, 90 percent of White households,86 percent of Black households, and 86 percent of Hispanic households with computers usedbroadband at home, implying adoption gaps of four percentage points between Asian andWhite, White and Black, and White and Hispanic households. Controlling for demographiccharacteristics and geography erases the Asian and White difference, and reduces both theWhite-Black and White-Hispanic gaps to three percentage points.
Figure 15: Broadband Internet Adoption Gap
between non-Hispanic Asian and White Households, 2010
Source: U.S. Census Bureau, Current Population Survey School Enrollment and Internet Use Supplement,October 2010, and ESA calculations.
Note: Data for Whites, Blacks, Asians, and American Indians and Alaska Natives do not include people of Hispanicorigin. Persons of Hispanic origin may be of any race.
9
4
0 00
5
10
15
20
Perc
enta
ge P
oint
Gap
in A
dopt
ion
Broadband adoption at home(all households)
Broadband adoption at home(computer-using households only)
Gap in average adoption Gap in average adoption aftercontrolling for householdcharacteristics
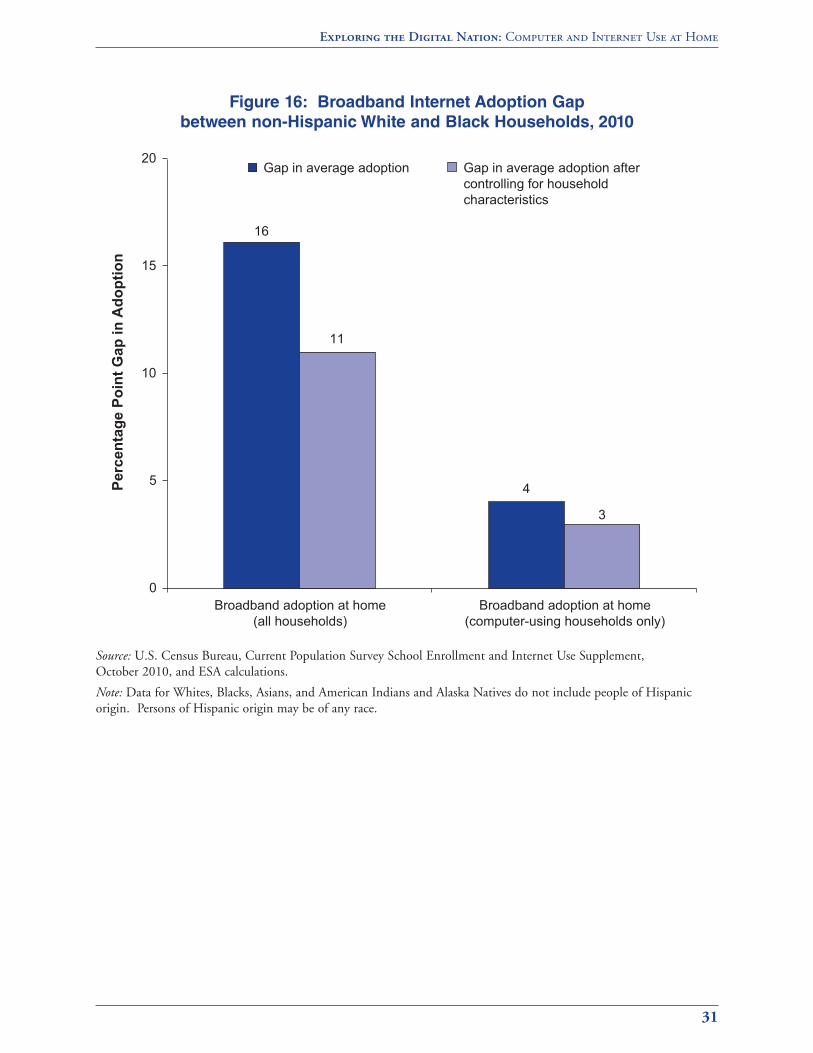
Figure 16: Broadband Internet Adoption Gap
between non-Hispanic White and Black Households, 2010
Source: U.S. Census Bureau, Current Population Survey School Enrollment and Internet Use Supplement,October 2010, and ESA calculations.
Note: Data for Whites, Blacks, Asians, and American Indians and Alaska Natives do not include people of Hispanicorigin. Persons of Hispanic origin may be of any race.
Exploring the Digital Nation: Computer and Internet Use at Home
31
16
4
11
3
0
5
10
15
20
Perc
enta
ge P
oint
Gap
in A
dopt
ion
Broadband adoption at home(all households)
Broadband adoption at home(computer-using households only)
Gap in average adoption Gap in average adoption aftercontrolling for householdcharacteristics

Exploring the Digital Nation: Computer and Internet Use at Home
32
Figure 17: Broadband Internet Adoption Gap
between non-Hispanic White and Hispanic Households, 2010
Source: U.S. Census Bureau, Current Population Survey School Enrollment and Internet Use Supplement,October 2010, and ESA calculations.
Note: Data for Whites, Blacks, Asians, and American Indians and Alaska Natives do not include people of Hispanicorigin. Persons of Hispanic origin may be of any race.
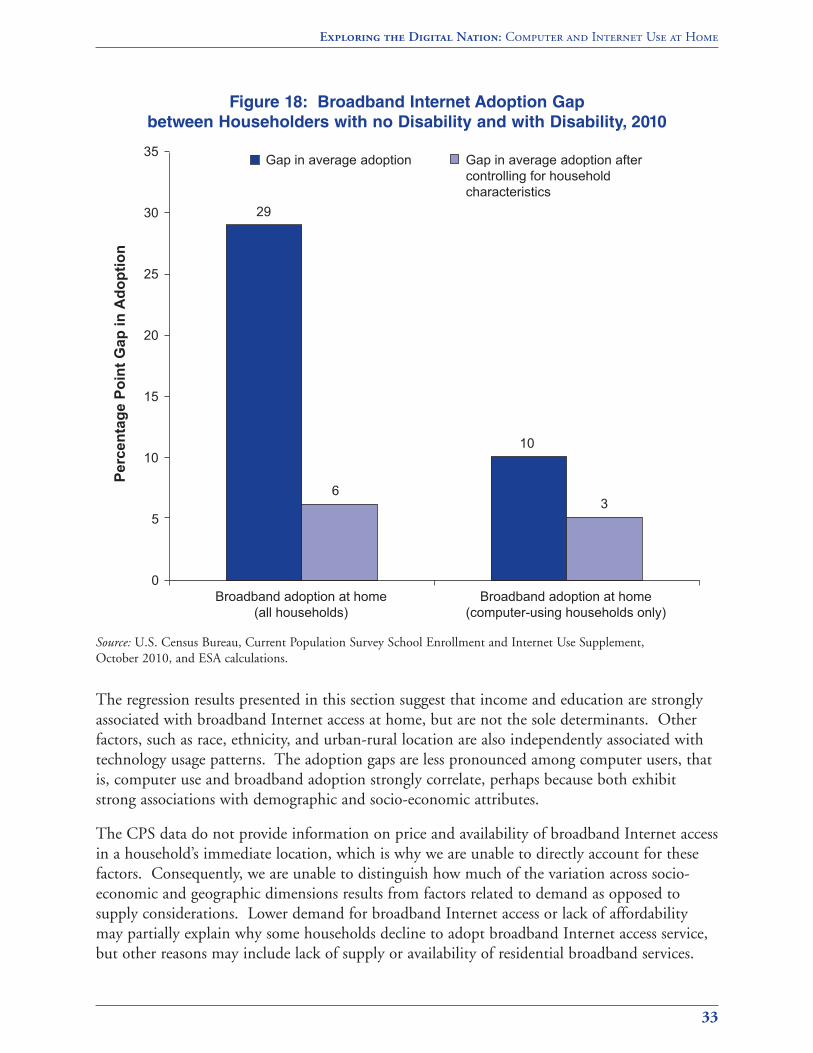
Turning to the data by disability status, Figure 10 showed 43 percent of households headed bysomeone with a disability used broadband, compared to 72 percent of households headed bysomeone with no disability, implying a 29 percentage point gap in broadband Internet access.Once we control for income, education, age, and other key attributes, the gap in broadbandInternet access declines to six percentage points or about one-fifth of the original gap (see leftpanel, Figure 18). Looking at computer owners exclusively shows smaller differences (10percentage point difference before and three percentage point difference after controlling fordemographic factors and geography, as shown in Figure 18, right panel). This suggests thatdifferences in demographic and socio-economic attributes and geography explain a substantialportion of the disability-related broadband gap, even among computer owners.
15
4
11
3
0
5
10
15
20
Perc
enta
ge P
oint
Gap
in A
dopt
ion
Broadband adoption at home(all households)
Broadband adoption at home(computer-using households only)
Gap in average adoption Gap in average adoption aftercontrolling for householdcharacteristics
Exploring the Digital Nation: Computer and Internet Use at Home
33
Figure 18: Broadband Internet Adoption Gap
between Householders with no Disability and with Disability, 2010
Source: U.S. Census Bureau, Current Population Survey School Enrollment and Internet Use Supplement,October 2010, and ESA calculations.
The regression results presented in this section suggest that income and education are stronglyassociated with broadband Internet access at home, but are not the sole determinants. Otherfactors, such as race, ethnicity, and urban-rural location are also independently associated withtechnology usage patterns. The adoption gaps are less pronounced among computer users, thatis, computer use and broadband adoption strongly correlate, perhaps because both exhibitstrong associations with demographic and socio-economic attributes.
The CPS data do not provide information on price and availability of broadband Internet accessin a household’s immediate location, which is why we are unable to directly account for thesefactors. Consequently, we are unable to distinguish how much of the variation across socio-economic and geographic dimensions results from factors related to demand as opposed tosupply considerations. Lower demand for broadband Internet access or lack of affordabilitymay partially explain why some households decline to adopt broadband Internet access service,but other reasons may include lack of supply or availability of residential broadband services.
29
10
63
0
5
10
15
20
35
30
25
Perc
enta
ge P
oint
Gap
in A
dopt
ion
Broadband adoption at home(all households)
Broadband adoption at home(computer-using households only)
Gap in average adoption Gap in average adoption aftercontrolling for householdcharacteristics
Exploring the Digital Nation: Computer and Internet Use at Home
34
5. Non-Adoption of Internet Access Services at Home, 2010
The CPS Supplement asked households using dial-up Internet access services (hereafter referredto as “dial-up households”) to state their main reason for not having broadband Internet serviceat home (tabulations shown on the left panel of Figure 19). In addition, the CPS askedhouseholds without Internet service or a home computer to state their main reason for nothaving home Internet access (tabulations shown on the right panel of Figure 19). The reasonsfor non-adoption are likely to have significant policy implications. For example, if lack ofavailability of broadband services is the main impediment to broadband adoption at home, thenpolicies to expand usage may require attracting broadband providers to offer service. However,if there is a lack of information about broadband service availability, or a perceived lack of needor interest in broadband, then policies may incorporate public awareness campaigns.
Note that households’ responses on the main reason for not using broadband Internet at homereflect their subjective opinions since the survey respondent may not have adequate informationon pricing, availability, or the value of Internet access services. For instance, one may believethat broadband Internet access is not available in the area, but be misinformed. As a result, wecaution that any comparison across households, while informative, requires careful analysis.
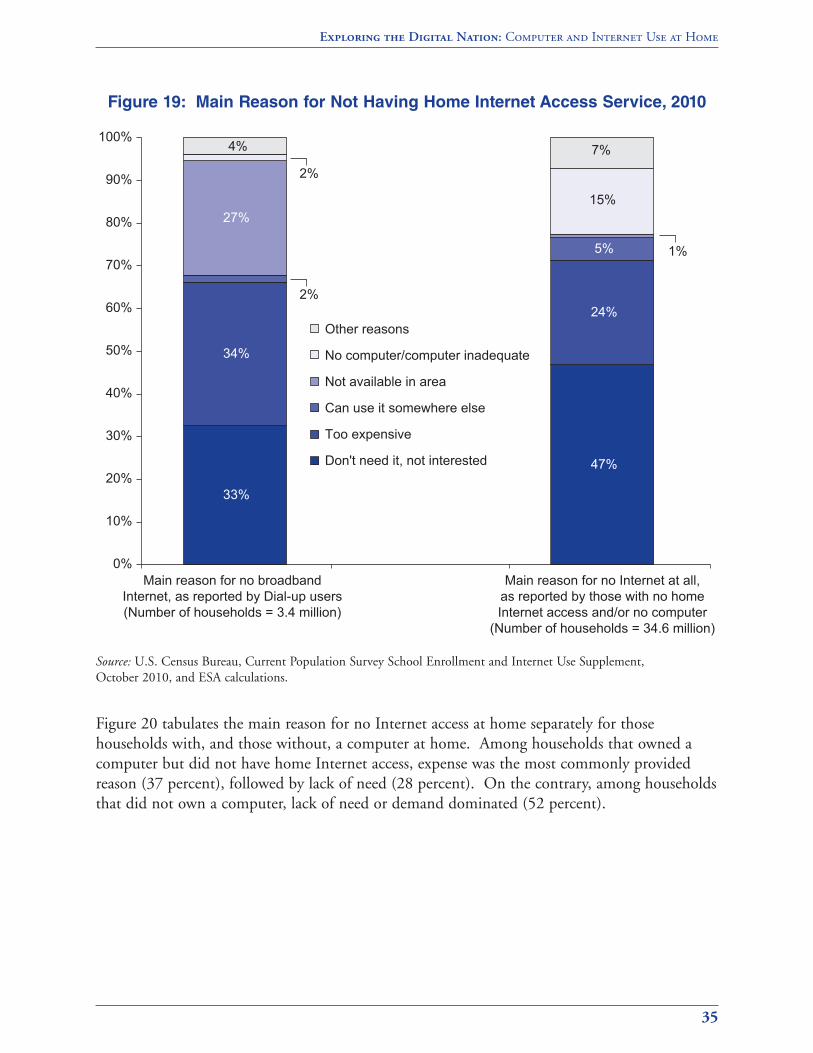
The left panel of Figure 19 shows that expense, lack of need, and lack of availability were themain impediments to broadband adoption for dial-up households. One-third of dial-up usersreported “lack of need” (33 percent), about one-third reported “too expensive” (34 percent),and about one-fourth (27 percent) reported “lack of availability.” Note that dial-up householdsaccounted for three percent of American households in 2010.
In contrast, almost half (47 percent) of households without a computer or home Internet accessstated lack of need as their main reason for not having home Internet services (right panel ofFigure 19). About one-fourth (24 percent) reported affordability, and 15 percent reportedinadequate computer as the primary reason for no home Internet access. Note that thosehouseholds reporting no Internet access or home computer were a much larger group (29percent) than the collective dial-up households (representing about three percent of Americanhouseholds).
Exploring the Digital Nation: Computer and Internet Use at Home
35
Figure 19: Main Reason for Not Having Home Internet Access Service, 2010
Source: U.S. Census Bureau, Current Population Survey School Enrollment and Internet Use Supplement,October 2010, and ESA calculations.
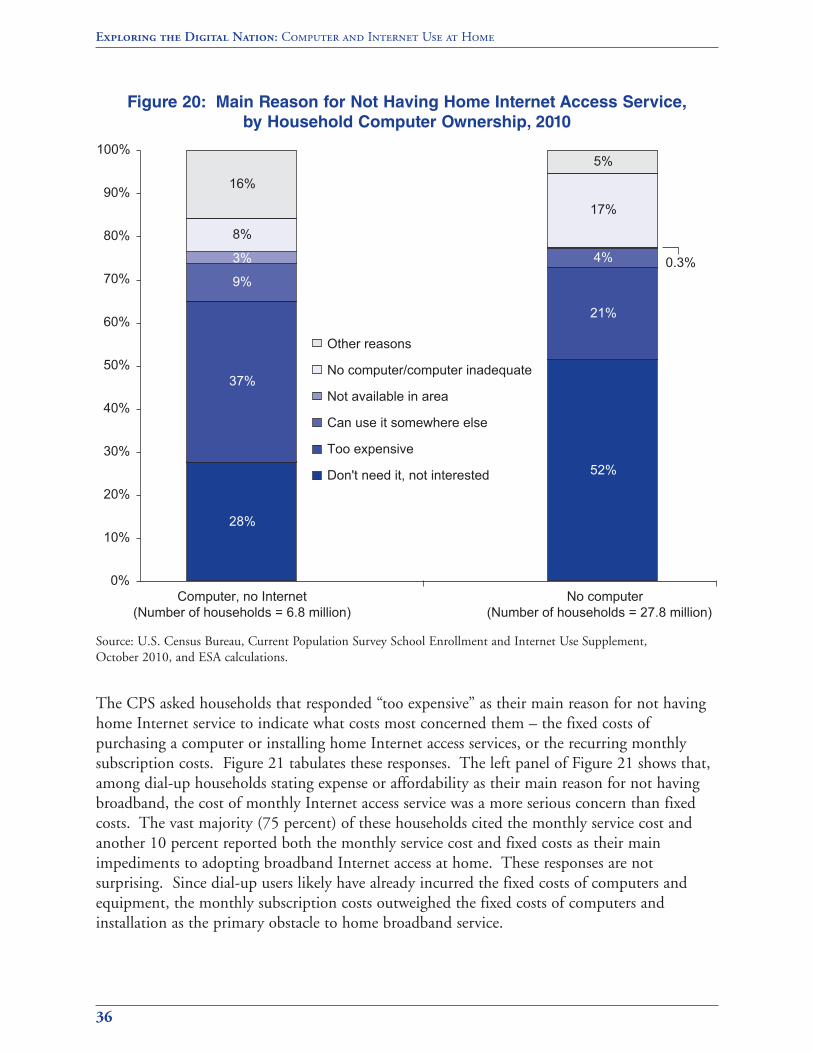
Figure 20 tabulates the main reason for no Internet access at home separately for thosehouseholds with, and those without, a computer at home. Among households that owned acomputer but did not have home Internet access, expense was the most commonly providedreason (37 percent), followed by lack of need (28 percent). On the contrary, among householdsthat did not own a computer, lack of need or demand dominated (52 percent).
33%
47%
34%
24%
5%
27%
1%
2%
15%
4% 7%
0%
10%
20%
30%
40%
50%
60%
70%
80%
90%
100%
Other reasons
No computer/computer inadequate
Not available in area
Can use it somewhere else
Too expensive
Don't need it, not interested
Main reason for no broadband Internet, as reported by Dial-up users (Number of households = 3.4 million)
Main reason for no Internet at all, as reported by those with no home Internet access and/or no computer
(Number of households = 34.6 million)
2%
Exploring the Digital Nation: Computer and Internet Use at Home
36
Figure 20: Main Reason for Not Having Home Internet Access Service,
by Household Computer Ownership, 2010
Source: U.S. Census Bureau, Current Population Survey School Enrollment and Internet Use Supplement,October 2010, and ESA calculations.
The CPS asked households that responded “too expensive” as their main reason for not havinghome Internet service to indicate what costs most concerned them – the fixed costs ofpurchasing a computer or installing home Internet access services, or the recurring monthlysubscription costs. Figure 21 tabulates these responses. The left panel of Figure 21 shows that,among dial-up households stating expense or affordability as their main reason for not havingbroadband, the cost of monthly Internet access service was a more serious concern than fixedcosts. The vast majority (75 percent) of these households cited the monthly service cost andanother 10 percent reported both the monthly service cost and fixed costs as their mainimpediments to adopting broadband Internet access at home. These responses are notsurprising. Since dial-up users likely have already incurred the fixed costs of computers andequipment, the monthly subscription costs outweighed the fixed costs of computers andinstallation as the primary obstacle to home broadband service.
28%
52%
37%
21%
9%
4%3% 0.3%
8%
17%
16%
5%
0%
10%
20%
30%
40%
50%
60%
70%
80%
90%
100%
Computer, no Internet (Number of households = 6.8 million)
No computer(Number of households = 27.8 million)
Other reasons
No computer/computer inadequate
Not available in area
Can use it somewhere else
Too expensive
Don't need it, not interested
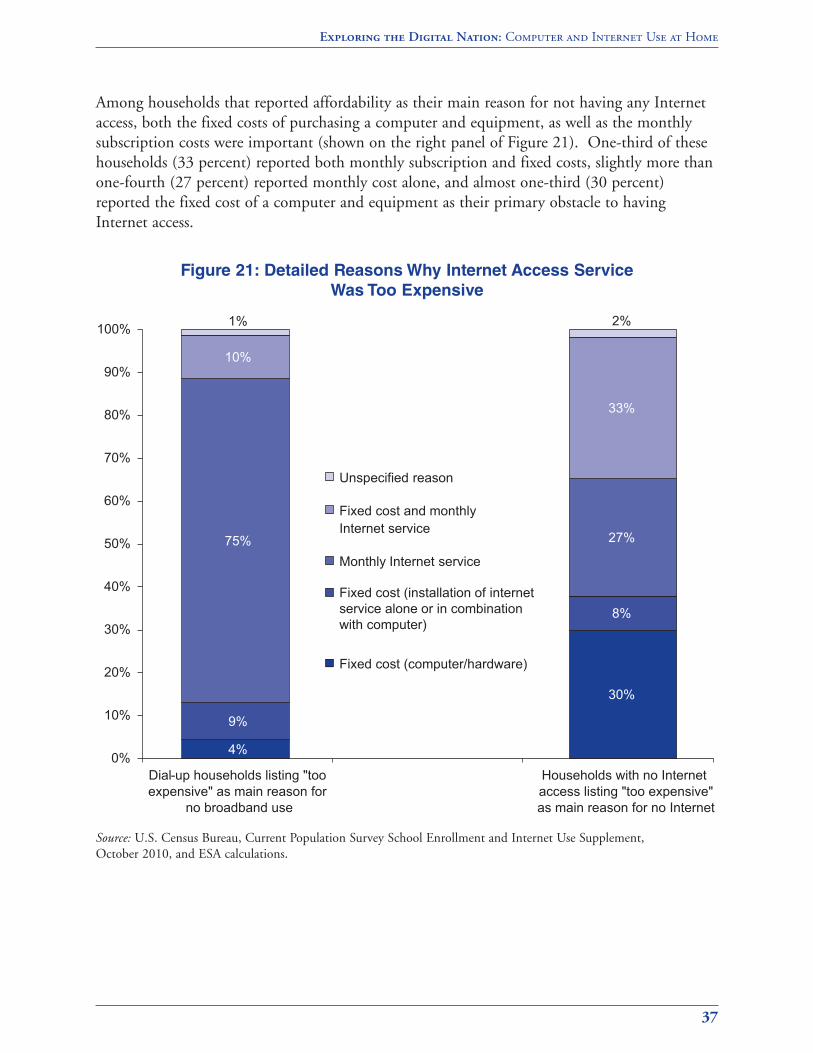
Among households that reported affordability as their main reason for not having any Internetaccess, both the fixed costs of purchasing a computer and equipment, as well as the monthlysubscription costs were important (shown on the right panel of Figure 21). One-third of thesehouseholds (33 percent) reported both monthly subscription and fixed costs, slightly more thanone-fourth (27 percent) reported monthly cost alone, and almost one-third (30 percent)reported the fixed cost of a computer and equipment as their primary obstacle to havingInternet access.
Figure 21: Detailed Reasons Why Internet Access Service
Was Too Expensive
Source: U.S. Census Bureau, Current Population Survey School Enrollment and Internet Use Supplement,October 2010, and ESA calculations.
Exploring the Digital Nation: Computer and Internet Use at Home
37
4%
30%
9%
8%
75% 27%
10%
33%
1% 2%
0%
10%
20%
30%
40%
50%
60%
70%
80%
90%
100%
Dial-up households listing "too expensive" as main reason for
no broadband use
Households with no Internet access listing "too expensive"as main reason for no Internet
Unspecified reason
Fixed cost and monthlyInternet service
Monthly Internet service
Fixed cost (computer/hardware)
Fixed cost (installation of internet service alone or in combination with computer)
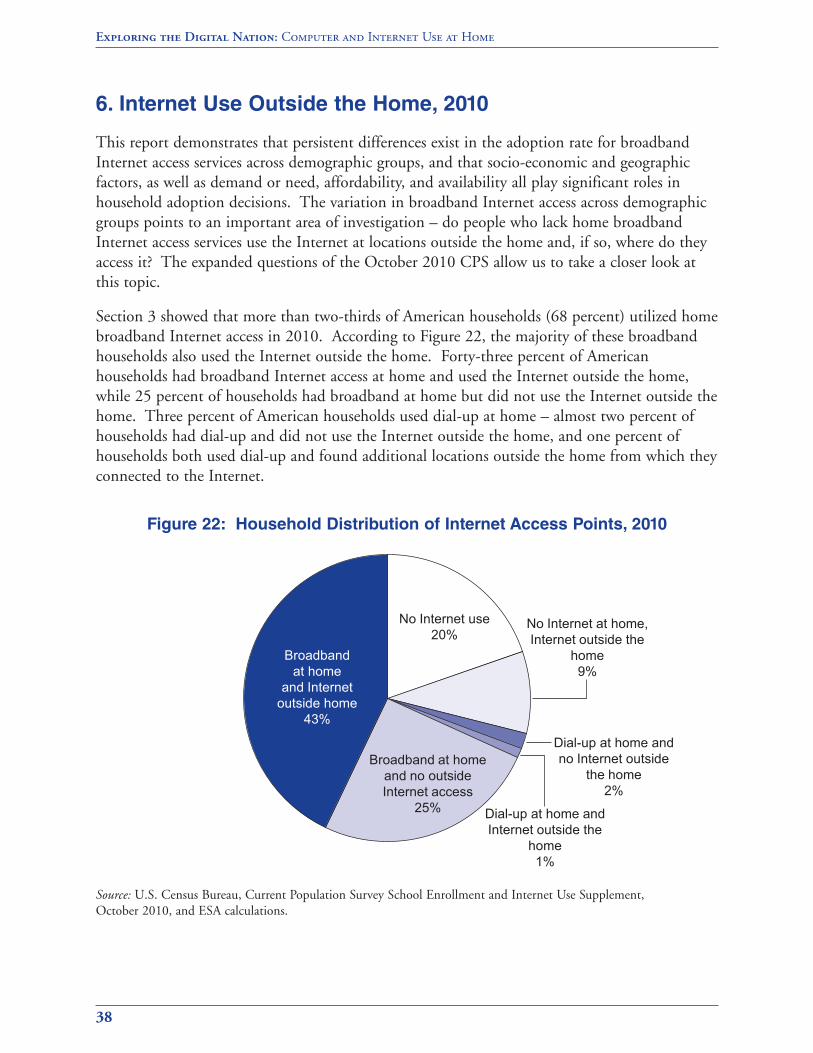
Exploring the Digital Nation: Computer and Internet Use at Home
38
6. Internet Use Outside the Home, 2010
This report demonstrates that persistent differences exist in the adoption rate for broadbandInternet access services across demographic groups, and that socio-economic and geographicfactors, as well as demand or need, affordability, and availability all play significant roles inhousehold adoption decisions. The variation in broadband Internet access across demographicgroups points to an important area of investigation – do people who lack home broadbandInternet access services use the Internet at locations outside the home and, if so, where do theyaccess it? The expanded questions of the October 2010 CPS allow us to take a closer look atthis topic.
Section 3 showed that more than two-thirds of American households (68 percent) utilized homebroadband Internet access in 2010. According to Figure 22, the majority of these broadbandhouseholds also used the Internet outside the home. Forty-three percent of Americanhouseholds had broadband Internet access at home and used the Internet outside the home,while 25 percent of households had broadband at home but did not use the Internet outside thehome. Three percent of American households used dial-up at home – almost two percent ofhouseholds had dial-up and did not use the Internet outside the home, and one percent ofhouseholds both used dial-up and found additional locations outside the home from which theyconnected to the Internet.
Figure 22: Household Distribution of Internet Access Points, 2010
Source: U.S. Census Bureau, Current Population Survey School Enrollment and Internet Use Supplement,October 2010, and ESA calculations.
No Internet use20%
No Internet at home, Internet outside the
home9%
Dial-up at home and no Internet outside
the home2%
Dial-up at home and Internet outside the
home1%
Broadband at homeand no outsideInternet access
25%
Broadband at home
and Internet outside home
43%
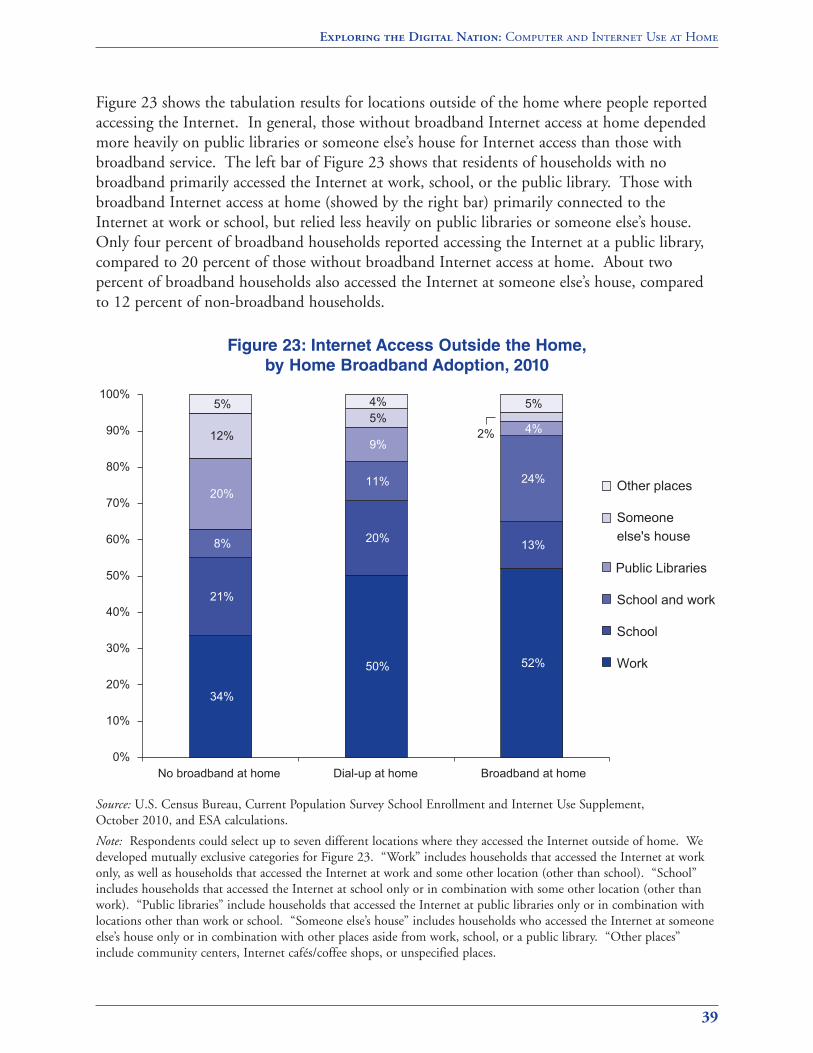
Figure 23 shows the tabulation results for locations outside of the home where people reportedaccessing the Internet. In general, those without broadband Internet access at home dependedmore heavily on public libraries or someone else’s house for Internet access than those withbroadband service. The left bar of Figure 23 shows that residents of households with nobroadband primarily accessed the Internet at work, school, or the public library. Those withbroadband Internet access at home (showed by the right bar) primarily connected to theInternet at work or school, but relied less heavily on public libraries or someone else’s house.Only four percent of broadband households reported accessing the Internet at a public library,compared to 20 percent of those without broadband Internet access at home. About twopercent of broadband households also accessed the Internet at someone else’s house, comparedto 12 percent of non-broadband households.
Figure 23: Internet Access Outside the Home,
by Home Broadband Adoption, 2010
Source: U.S. Census Bureau, Current Population Survey School Enrollment and Internet Use Supplement,October 2010, and ESA calculations.
Note: Respondents could select up to seven different locations where they accessed the Internet outside of home. Wedeveloped mutually exclusive categories for Figure 23. “Work” includes households that accessed the Internet at workonly, as well as households that accessed the Internet at work and some other location (other than school). “School”includes households that accessed the Internet at school only or in combination with some other location (other thanwork). “Public libraries” include households that accessed the Internet at public libraries only or in combination withlocations other than work or school. “Someone else’s house” includes households who accessed the Internet at someoneelse’s house only or in combination with other places aside from work, school, or a public library. “Other places”include community centers, Internet cafés/coffee shops, or unspecified places.
Exploring the Digital Nation: Computer and Internet Use at Home
39
34%
50% 52%
21%
20% 13%8%
11% 24%20%
9%4%12%
5%2%
5% 4% 5%
0%
10%
20%
30%
40%
50%
60%
70%
80%
90%
100%
No broadband at home Dial-up at home Broadband at home
Other places
Someone else's house
School and work
School
Work
Public Libraries
Exploring the Digital Nation: Computer and Internet Use at Home
40
7. Conclusion
President Obama is dedicated to “connecting every part of America to the digital age” (NTIA,2011). For policymakers, that commitment means ensuring that households have access tobroadband services to give them the opportunity to participate in the information economy. Asdemonstrated in this report, while broadband adoption continues to grow, disparities persist.Households in certain demographic and geographic groups are less likely than their peers to usebroadband services and, more importantly, these gaps remain to varying degrees even aftersocio-economic and geographic factors have been taken into account. The data and analysesprovide policymakers with empirical evidence to help them address such disparities and findways to enable all Americans to embrace the digital age.
References
Bureau of Labor Statistics and U.S. Bureau of the Census. “CPS Record Layout for Basic LaborForce Items, Standard Public Use Files.” Current Population Survey, January 2010, AccessedJune 12, 2011. http://smpbff2.dsd.census.gov/pub/cps/basic/201001-/jan10dd.txt
Economics and Statistics Administration and National Telecommunications and InformationAdministration. “Exploring the Digital Nation: Home Broadband Internet Adoption in theUnited States.” November 2010, Accessed May 26, 2011. http://www.esa.doc.gov/Reports/exploring-digital-nation-home-broadband-Internet-adoption-united-states
Federal Communications Commission. “Broadband Adoption and Use in America.” OBIWorking Paper Series No. 1, February 2010, Accessed September 7, 2011.http://hraunfoss.fcc.gov/edocs_public/attachmatch/DOC-296442A1.pdf
National Telecommunications and Information Administration. “Digital Nation: ExpandingInternet Usage.” February 2011, Accessed May 26, 2011. http://www.ntia.doc.gov/report/2011/digital-nation-expanding-internet-usage-ntia-research-preview
National Telecommunications and Information Administration. Digital Nation: 21st CenturyAmerica’s Progress Toward Universal Broadband Internet Access, February 2010, AccessedJune 15, 2011.http://www.ntia.doc.gov/files/ntia/publications/ntia_internet_use_report_february_2011.pdf
Organisation for Economic Co-operation and Development (OECD). OECD BroadbandStatistics. “Table 1d (2): OECD Terrestrial mobile wireless broadband subscriptions per 100inhabitants, by technology, June 2010.” Accessed May 26, 2011.http://www.oecd.org/dataoecd/21/35/39574709.xls
Office of Management and Budget (OMB). OMB Bulletin No. 04-03, “Update of StatisticalArea Definitions and Additional Guidance on Their Uses.” Accessed June 23, 2010.http://www.whitehouse.gov/omb/bulletins_fy04_b04-03/
Smith, Aaron. “Mobile Access 2010.” Pew Internet and American Life Project, Pew ResearchCenter, July 7, 2010, Accessed September 7, 2011.http://www.pewinternet.org/Reports/2010/Mobile-Access-2010.aspx
U.S. Bureau of the Census. “School Enrollment and Internet Use Supplement File TechnicalDocumentation, CPS-09.” Current Population Survey, October 2009, Accessed September 7,2011. http://www.census.gov/apsd/techdoc/cps/cpsoct09.pdf
U.S. Bureau of the Census (a). “Metropolitan and Micropolitan Statistical Areas.” AccessedSeptember 7, 2011. http://www.census.gov/population/www/metroareas/aboutmetro.html
White House Office of the Press Secretary. Remarks by the President on Fiscal Policy inWashington, DC April 13, 2011, Accessed September 21, 2011.http://www.whitehouse.gov/the-press-office/2011/04/13/remarks-president-fiscal-policy
Exploring the Digital Nation: Computer and Internet Use at Home
41
Exploring the Digital Nation: Computer and Internet Use at Home
42
21 This report analyzes data from the most recent survey conducted in October 2010, the ninth such Internet surveyconducted since the early 1990s. For a more detailed description of the survey, see Bureau of Labor Statistics andU.S. Census Bureau, 2010.22 The householder is the person (or one of the people) who owns or rents the housing unit, or, if there is no suchperson, any adult member, excluding roomers, boarders, or paid employees. 23 Detailed data on computer use and broadband adoption both at the household and individual level are presented inAppendix B, Tables B1, B2, and B3.
Appendix A: Data and Methodology
This report uses data from the October 2010 Current Population Survey (CPS), a monthlysurvey of a representative sample of the U.S. noninstitutional population that provides data onlabor force participation, income, and demographic characteristics of households. In addition,this report analyzes data from the most recent (October 2010) CPS School Enrollment andInternet Use Supplement, a special supplement to the CPS that periodically gathers informationon Internet use.21
The October 2010 School Enrollment and Internet Use Supplement asked each surveyedhousehold whether someone in that household used or owned a computer, used the Internet,and the locations from which they accessed the Internet (home, office, school, library, and otherplaces). In addition, the survey asked the household which of the following technologiesmembers utilized to connect to the Internet from home: dial-up service, DSL, cable modem,fiber optics, satellite, mobile broadband, or some other Internet connection technology. Usingthese data, it is possible to determine whether a household owned a personal computer (i.e.,desktop, laptop, netbook, or notebook) or a handheld device, as well as the type of broadbandtechnology (i.e., DSL, cable modem, fiber optics, satellite, or mobile broadband) membersutilized to connect to the Internet. The survey also asked those households that did not accessInternet services to state their main reason for not doing so.
Our sample consists of all households where the head of the household or “householder” is atleast 16 years of age.22 About 54,300 household records comprise our sample, representing119.5 million American households. We analyze computer ownership and broadband Internetuse at the household level and its association with household-level characteristics, such asincome, size and composition, and geographic location.23 For characteristics like education,race, ethnicity, age, disability status, and foreign-born status, we use information for thehouseholder. In this report we use the words “adoption,” “use,” “utilization,” and “access”interchangeably to indicate that a household reported having Internet access.
Data on computer use, as well as the types of broadband technology that online householdsutilized, have not been available since the early 2000s. The supply and demand for both mobiledevices and residential Internet access services have changed enormously during this period.The data from the October 2010 CPS make it possible to identify the preferred or mostcommon types of computers and access technologies used for residential Internet access,including the prevalence of mobile broadband technologies and handheld devices.
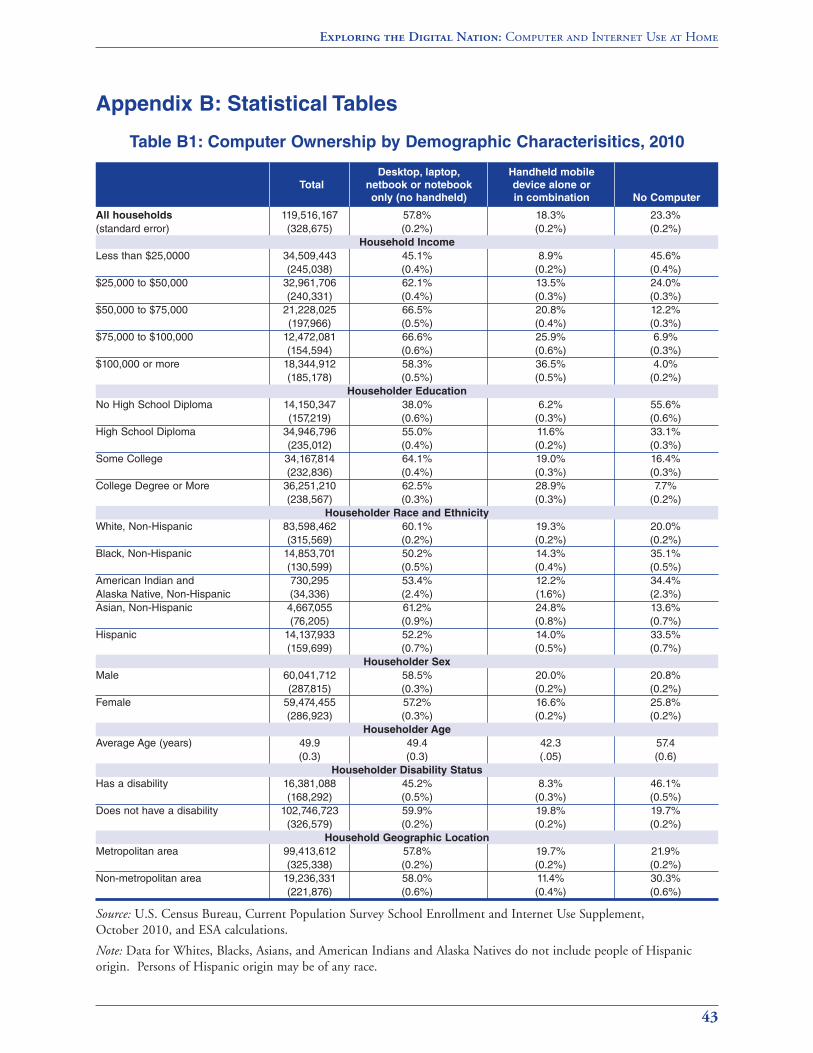
Exploring the Digital Nation: Computer and Internet Use at Home
43
Appendix B: Statistical Tables
Table B1: Computer Ownership by Demographic Characterisitics, 2010
Source: U.S. Census Bureau, Current Population Survey School Enrollment and Internet Use Supplement,October 2010, and ESA calculations.
Note: Data for Whites, Blacks, Asians, and American Indians and Alaska Natives do not include people of Hispanicorigin. Persons of Hispanic origin may be of any race.
Desktop, laptop, Handheld mobile
Total netbook or notebook device alone or
only (no handheld) in combination No Computer
All households 119,516,167 57.8% 18.3% 23.3%
(standard error) (328,675) (0.2%) (0.2%) (0.2%)
Household Income
Less than $25,0000 34,509,443 45.1% 8.9% 45.6%
(245,038) (0.4%) (0.2%) (0.4%)
$25,000 to $50,000 32,961,706 62.1% 13.5% 24.0%
(240,331) (0.4%) (0.3%) (0.3%)
$50,000 to $75,000 21,228,025 66.5% 20.8% 12.2%
(197,966) (0.5%) (0.4%) (0.3%)
$75,000 to $100,000 12,472,081 66.6% 25.9% 6.9%
(154,594) (0.6%) (0.6%) (0.3%)
$100,000 or more 18,344,912 58.3% 36.5% 4.0%
(185,178) (0.5%) (0.5%) (0.2%)
Householder Education
No High School Diploma 14,150,347 38.0% 6.2% 55.6%
(157,219) (0.6%) (0.3%) (0.6%)
High School Diploma 34,946,796 55.0% 11.6% 33.1%
(235,012) (0.4%) (0.2%) (0.3%)
Some College 34,167,814 64.1% 19.0% 16.4%
(232,836) (0.4%) (0.3%) (0.3%)
College Degree or More 36,251,210 62.5% 28.9% 7.7%
(238,567) (0.3%) (0.3%) (0.2%)
Householder Race and Ethnicity
White, Non-Hispanic 83,598,462 60.1% 19.3% 20.0%
(315,569) (0.2%) (0.2%) (0.2%)
Black, Non-Hispanic 14,853,701 50.2% 14.3% 35.1%
(130,599) (0.5%) (0.4%) (0.5%)
American Indian and 730,295 53.4% 12.2% 34.4%
Alaska Native, Non-Hispanic (34,336) (2.4%) (1.6%) (2.3%)
Asian, Non-Hispanic 4,667,055 61.2% 24.8% 13.6%
(76,205) (0.9%) (0.8%) (0.7%)
Hispanic 14,137,933 52.2% 14.0% 33.5%
(159,699) (0.7%) (0.5%) (0.7%)
Householder Sex
Male 60,041,712 58.5% 20.0% 20.8%
(287,815) (0.3%) (0.2%) (0.2%)
Female 59,474,455 57.2% 16.6% 25.8%
(286,923) (0.3%) (0.2%) (0.2%)
Householder Age
Average Age (years) 49.9 49.4 42.3 57.4
(0.3) (0.3) (.05) (0.6)
Householder Disability Status
Has a disability 16,381,088 45.2% 8.3% 46.1%
(168,292) (0.5%) (0.3%) (0.5%)
Does not have a disability 102,746,723 59.9% 19.8% 19.7%
(326,579) (0.2%) (0.2%) (0.2%)
Household Geographic Location
Metropolitan area 99,413,612 57.8% 19.7% 21.9%
(325,338) (0.2%) (0.2%) (0.2%)
Non-metropolitan area 19,236,331 58.0% 11.4% 30.3%
(221,876) (0.6%) (0.4%) (0.6%)

Exploring the Digital Nation: Computer and Internet Use at Home
44
Table B2: Computer Use, Internet and Broadband Adoption at the Household
Level, by Demographic Characteristics and Geographic Locations, 2010
Computer use Internet use Broadband adoption
All All All Computer-using
Total households households households households
All households 119,516,167 76.7% 71.1% 68.2% 88.9%
(standard error) (328,675) (0.2%) (0.2%) (0.2%) (0.1%)
Household Income
Less than $25,0000 34,509,443 54.4% 45.9% 42.9% 78.8%
(245,038) (0.4%) (0.4%) (0.4%) (0.4%)
$25,000 to $50,000 32,961,706 76.1% 69.3% 65.8% 86.6%
(240,331) (0.3%) (0.4%) (0.4%) (0.3%)
$50,000 to $75,000 21,228,025 87.8% 83.7% 80.7% 91.9%
(197,966) (0.3%) (0.4%) (0.4%) (0.3%)
$75,000 to $100,000 12,472,081 93.1% 90.1% 87.8% 94.4%
(154,594) (0.3%) (0.4%) (0.4%) (0.3%)
$100,000 or more 18,344,912 96.0% 94.1% 92.6% 96.4%
(185,178) (0.2%) (0.2%) (0.3%) (0.2%)
Householder Education
No High School Diploma 14,150,347 44.5% 35.7% 33.1% 74.6%
(157,219) (0.6%) (0.5%) (0.5%) (0.7%)
High School Diploma 34,946,796 66.9% 60.3% 56.9% 85.0%
(235,012) (0.3%) (0.4%) (0.4%) (0.3%)
Some College 34,167,814 83.6% 77.4% 74.3% 88.9%
(232,836) (0.3%) (0.3%) (0.3%) (0.3%)
College Degree or More 36,251,210 92.3% 89.2% 87.2% 94.5%
(238,567) (0.2%) (0.2%) (0.2%) (0.2%)
Householder Race and Ethnicity
White, Non-Hispanic 83,598,462 80.0% 74.9% 71.8% 89.7%
(315,569) (0.2%) (0.2%) (0.2%) (0.2%)
Black, Non-Hispanic 14,853,701 64.9% 57.8% 55.5% 85.5%
(130,599) (0.5%) (0.5%) (0.5%) (0.5%)
American Indian and Alaska Native, Non-Hispanic 730,295 65.6% 56.8% 52.3% 79.6%
(34,336) (2.3%) (2.4%) (2.4%) (2.4%)
Asian, Non-Hispanic 4,667,055 86.4% 82.8% 80.9% 93.7%
(76,205) (0.7%) (0.7%) (0.7%) (0.5%)
Hispanic 14,137,933 66.6% 59.1% 56.9% 85.5%
(159,699) (0.7%) (0.7%) (0.7%) (0.6%)
Householder Sex
Male 60,041,712 79.2% 74.0% 71.2% 89.9%
(287,815) (0.2%) (0.2%) (0.3%) (0.2%)
Female 59,474,455 74.2% 68.1% 65.3% 87.9%
(286,923) (0.2%) (0.3%) (0.3%) (0.2%)
Householder Age
16 to 44 years 47,979,027 84.4% 78.3% 76.7% 90.8%
(266,130) (0.2%) (0.3%) (0.3%) (0.2%)
45 to 64 years 46,162,699 80.4% 75.3% 72.0% 89.5%
(262,325) (0.3%) (0.3%) (0.3%) (0.2%)
65 years and older 25,374,441 55.4% 49.6% 45.5% 82.1%
(205,050) (0.4%) (0.4%) (0.4%) (0.4%)
Household Type
Households with school-age children 29,996,963 86.3% 80.4% 78.1% 90.5%
(220,445) (0.3%) (0.3%) (0.3%) (0.2%)
Households without school-age children 89,519,204 73.5% 67.9% 64.9% 88.3%
(319,994) (0.2%) (0.2%) (0.2%) (0.2%)
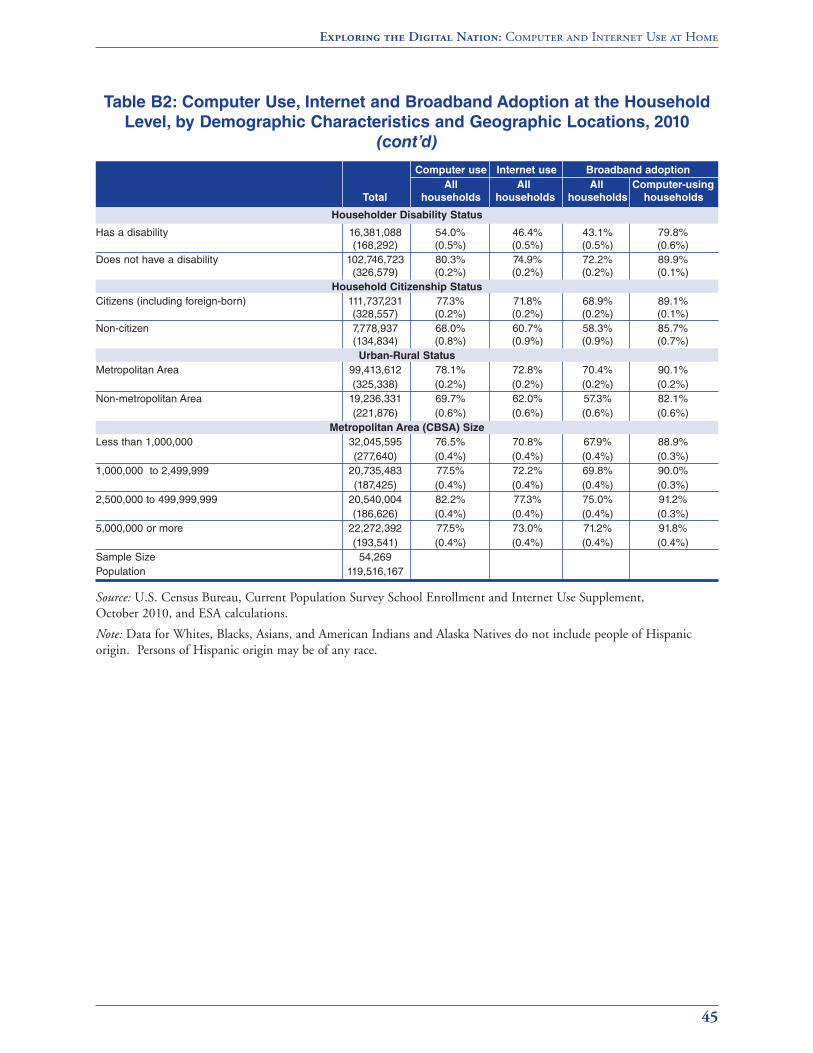
Table B2: Computer Use, Internet and Broadband Adoption at the Household
Level, by Demographic Characteristics and Geographic Locations, 2010
(cont’d)
Source: U.S. Census Bureau, Current Population Survey School Enrollment and Internet Use Supplement,October 2010, and ESA calculations.
Note: Data for Whites, Blacks, Asians, and American Indians and Alaska Natives do not include people of Hispanicorigin. Persons of Hispanic origin may be of any race.
Exploring the Digital Nation: Computer and Internet Use at Home
45
Computer use Internet use Broadband adoption
All All All Computer-using
Total households households households households
Householder Disability Status
Has a disability 16,381,088 54.0% 46.4% 43.1% 79.8%
(168,292) (0.5%) (0.5%) (0.5%) (0.6%)
Does not have a disability 102,746,723 80.3% 74.9% 72.2% 89.9%
(326,579) (0.2%) (0.2%) (0.2%) (0.1%)
Household Citizenship Status
Citizens (including foreign-born) 111,737,231 77.3% 71.8% 68.9% 89.1%
(328,557) (0.2%) (0.2%) (0.2%) (0.1%)
Non-citizen 7,778,937 68.0% 60.7% 58.3% 85.7%
(134,834) (0.8%) (0.9%) (0.9%) (0.7%)
Urban-Rural Status
Metropolitan Area 99,413,612 78.1% 72.8% 70.4% 90.1%
(325,338) (0.2%) (0.2%) (0.2%) (0.2%)
Non-metropolitan Area 19,236,331 69.7% 62.0% 57.3% 82.1%
(221,876) (0.6%) (0.6%) (0.6%) (0.6%)
Metropolitan Area (CBSA) Size
Less than 1,000,000 32,045,595 76.5% 70.8% 67.9% 88.9%
(277,640) (0.4%) (0.4%) (0.4%) (0.3%)
1,000,000 to 2,499,999 20,735,483 77.5% 72.2% 69.8% 90.0%
(187,425) (0.4%) (0.4%) (0.4%) (0.3%)
2,500,000 to 499,999,999 20,540,004 82.2% 77.3% 75.0% 91.2%
(186,626) (0.4%) (0.4%) (0.4%) (0.3%)
5,000,000 or more 22,272,392 77.5% 73.0% 71.2% 91.8%
(193,541) (0.4%) (0.4%) (0.4%) (0.4%)
Sample Size 54,269
Population 119,516,167
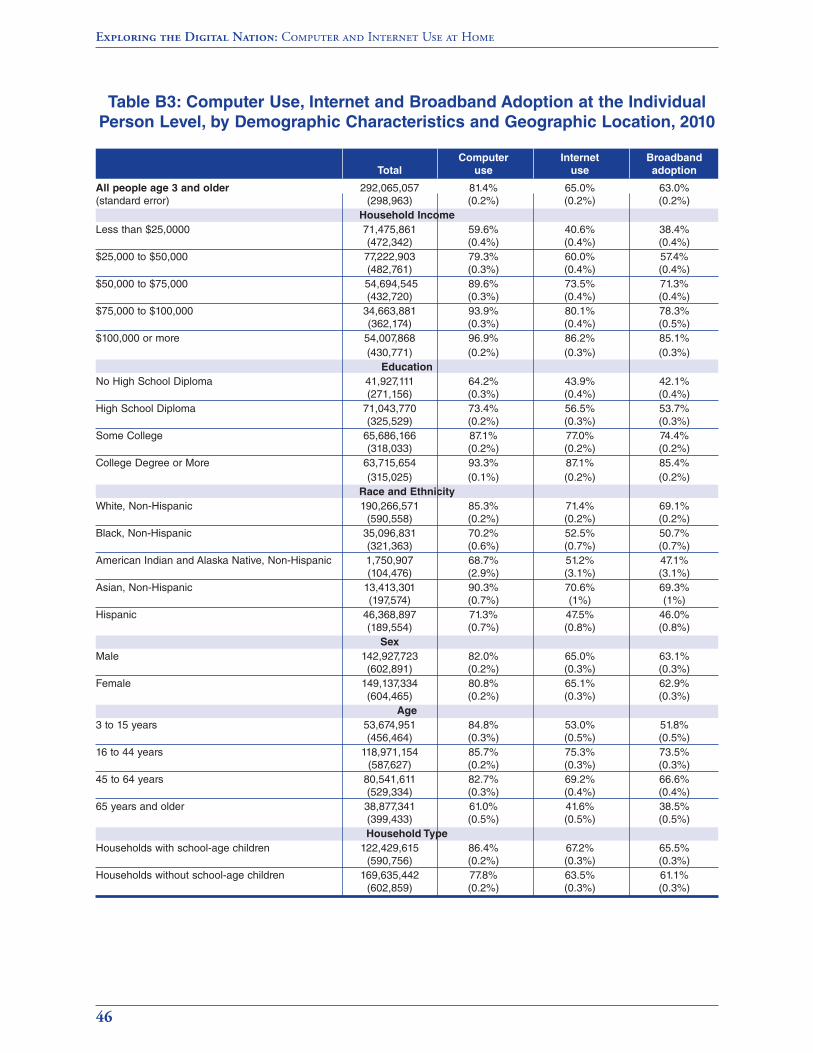
Exploring the Digital Nation: Computer and Internet Use at Home
46
Computer Internet Broadband
Total use use adoption
All people age 3 and older 292,065,057 81.4% 65.0% 63.0%
(standard error) (298,963) (0.2%) (0.2%) (0.2%)
Household Income
Less than $25,0000 71,475,861 59.6% 40.6% 38.4%
(472,342) (0.4%) (0.4%) (0.4%)
$25,000 to $50,000 77,222,903 79.3% 60.0% 57.4%
(482,761) (0.3%) (0.4%) (0.4%)
$50,000 to $75,000 54,694,545 89.6% 73.5% 71.3%
(432,720) (0.3%) (0.4%) (0.4%)
$75,000 to $100,000 34,663,881 93.9% 80.1% 78.3%
(362,174) (0.3%) (0.4%) (0.5%)
$100,000 or more 54,007,868 96.9% 86.2% 85.1%
(430,771) (0.2%) (0.3%) (0.3%)
Education
No High School Diploma 41,927,111 64.2% 43.9% 42.1%
(271,156) (0.3%) (0.4%) (0.4%)
High School Diploma 71,043,770 73.4% 56.5% 53.7%
(325,529) (0.2%) (0.3%) (0.3%)
Some College 65,686,166 87.1% 77.0% 74.4%
(318,033) (0.2%) (0.2%) (0.2%)
College Degree or More 63,715,654 93.3% 87.1% 85.4%
(315,025) (0.1%) (0.2%) (0.2%)
Race and Ethnicity
White, Non-Hispanic 190,266,571 85.3% 71.4% 69.1%
(590,558) (0.2%) (0.2%) (0.2%)
Black, Non-Hispanic 35,096,831 70.2% 52.5% 50.7%
(321,363) (0.6%) (0.7%) (0.7%)
American Indian and Alaska Native, Non-Hispanic 1,750,907 68.7% 51.2% 47.1%
(104,476) (2.9%) (3.1%) (3.1%)
Asian, Non-Hispanic 13,413,301 90.3% 70.6% 69.3%
(197,574) (0.7%) (1%) (1%)
Hispanic 46,368,897 71.3% 47.5% 46.0%
(189,554) (0.7%) (0.8%) (0.8%)
Sex
Male 142,927,723 82.0% 65.0% 63.1%
(602,891) (0.2%) (0.3%) (0.3%)
Female 149,137,334 80.8% 65.1% 62.9%
(604,465) (0.2%) (0.3%) (0.3%)
Age
3 to 15 years 53,674,951 84.8% 53.0% 51.8%
(456,464) (0.3%) (0.5%) (0.5%)
16 to 44 years 118,971,154 85.7% 75.3% 73.5%
(587,627) (0.2%) (0.3%) (0.3%)
45 to 64 years 80,541,611 82.7% 69.2% 66.6%
(529,334) (0.3%) (0.4%) (0.4%)
65 years and older 38,877,341 61.0% 41.6% 38.5%
(399,433) (0.5%) (0.5%) (0.5%)
Household Type
Households with school-age children 122,429,615 86.4% 67.2% 65.5%
(590,756) (0.2%) (0.3%) (0.3%)
Households without school-age children 169,635,442 77.8% 63.5% 61.1%
(602,859) (0.2%) (0.3%) (0.3%)
Table B3: Computer Use, Internet and Broadband Adoption at the Individual
Person Level, by Demographic Characteristics and Geographic Location, 2010
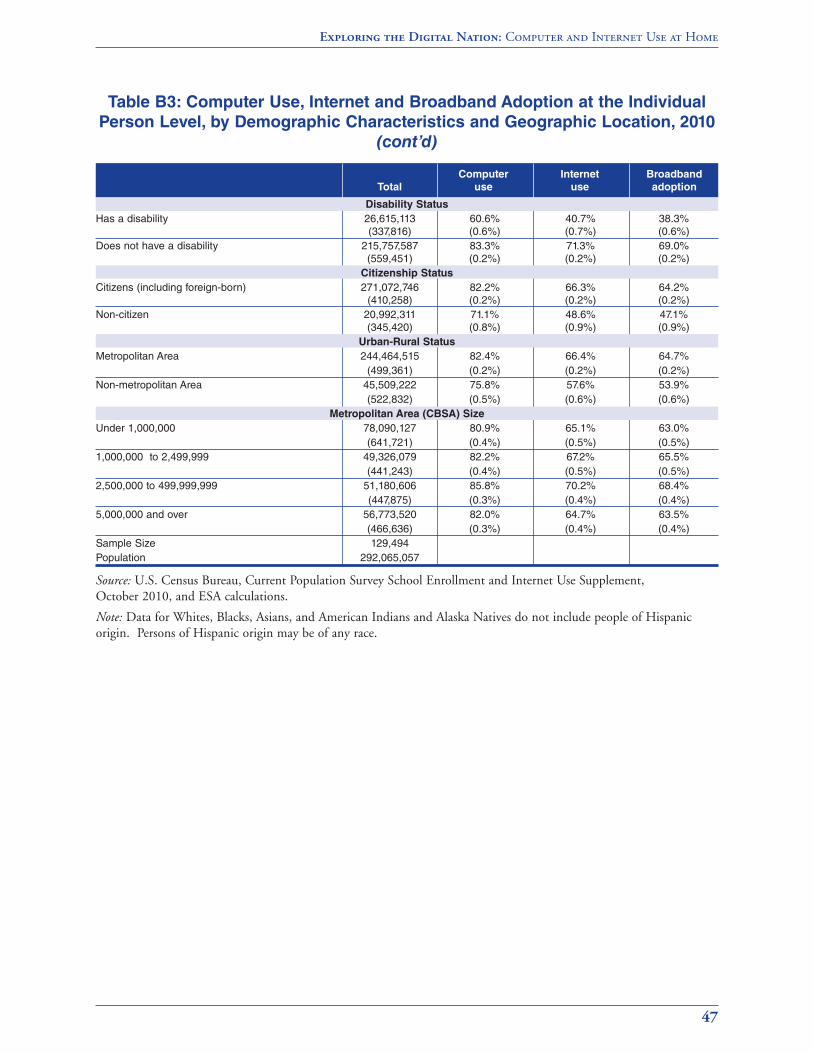
Table B3: Computer Use, Internet and Broadband Adoption at the Individual
Person Level, by Demographic Characteristics and Geographic Location, 2010
(cont’d)
Source: U.S. Census Bureau, Current Population Survey School Enrollment and Internet Use Supplement,October 2010, and ESA calculations.
Note: Data for Whites, Blacks, Asians, and American Indians and Alaska Natives do not include people of Hispanicorigin. Persons of Hispanic origin may be of any race.
Exploring the Digital Nation: Computer and Internet Use at Home
47
Computer Internet Broadband
Total use use adoption
Disability Status
Has a disability 26,615,113 60.6% 40.7% 38.3%
(337,816) (0.6%) (0.7%) (0.6%)
Does not have a disability 215,757,587 83.3% 71.3% 69.0%
(559,451) (0.2%) (0.2%) (0.2%)
Citizenship Status
Citizens (including foreign-born) 271,072,746 82.2% 66.3% 64.2%
(410,258) (0.2%) (0.2%) (0.2%)
Non-citizen 20,992,311 71.1% 48.6% 47.1%
(345,420) (0.8%) (0.9%) (0.9%)
Urban-Rural Status
Metropolitan Area 244,464,515 82.4% 66.4% 64.7%
(499,361) (0.2%) (0.2%) (0.2%)
Non-metropolitan Area 45,509,222 75.8% 57.6% 53.9%
(522,832) (0.5%) (0.6%) (0.6%)
Metropolitan Area (CBSA) Size
Under 1,000,000 78,090,127 80.9% 65.1% 63.0%
(641,721) (0.4%) (0.5%) (0.5%)
1,000,000 to 2,499,999 49,326,079 82.2% 67.2% 65.5%
(441,243) (0.4%) (0.5%) (0.5%)
2,500,000 to 499,999,999 51,180,606 85.8% 70.2% 68.4%
(447,875) (0.3%) (0.4%) (0.4%)
5,000,000 and over 56,773,520 82.0% 64.7% 63.5%
(466,636) (0.3%) (0.4%) (0.4%)
Sample Size 129,494
Population 292,065,057
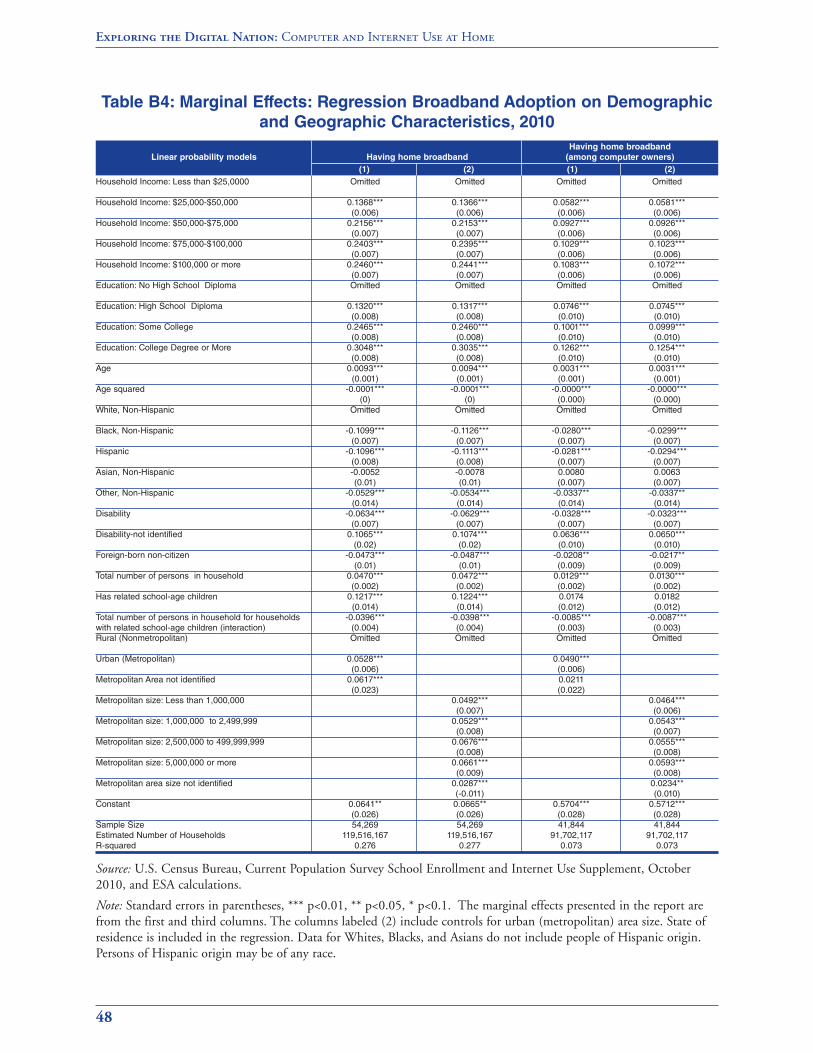
Exploring the Digital Nation: Computer and Internet Use at Home
48
Table B4: Marginal Effects: Regression Broadband Adoption on Demographic
and Geographic Characteristics, 2010
Source: U.S. Census Bureau, Current Population Survey School Enrollment and Internet Use Supplement, October2010, and ESA calculations.
Note: Standard errors in parentheses, *** p<0.01, ** p<0.05, * p<0.1. The marginal effects presented in the report arefrom the first and third columns. The columns labeled (2) include controls for urban (metropolitan) area size. State ofresidence is included in the regression. Data for Whites, Blacks, and Asians do not include people of Hispanic origin.Persons of Hispanic origin may be of any race.
Having home broadband
Linear probability models Having home broadband (among computer owners)
(1) (2) (1) (2)
Household Income: Less than $25,0000 Omitted Omitted Omitted Omitted
Household Income: $25,000-$50,000 0.1368*** 0.1366*** 0.0582*** 0.0581***
(0.006) (0.006) (0.006) (0.006)
Household Income: $50,000-$75,000 0.2156*** 0.2153*** 0.0927*** 0.0926***
(0.007) (0.007) (0.006) (0.006)
Household Income: $75,000-$100,000 0.2403*** 0.2395*** 0.1029*** 0.1023***
(0.007) (0.007) (0.006) (0.006)
Household Income: $100,000 or more 0.2460*** 0.2441*** 0.1083*** 0.1072***
(0.007) (0.007) (0.006) (0.006)
Education: No High School Diploma Omitted Omitted Omitted Omitted
Education: High School Diploma 0.1320*** 0.1317*** 0.0746*** 0.0745***
(0.008) (0.008) (0.010) (0.010)
Education: Some College 0.2465*** 0.2460*** 0.1001*** 0.0999***
(0.008) (0.008) (0.010) (0.010)
Education: College Degree or More 0.3048*** 0.3035*** 0.1262*** 0.1254***
(0.008) (0.008) (0.010) (0.010)
Age 0.0093*** 0.0094*** 0.0031*** 0.0031***
(0.001) (0.001) (0.001) (0.001)
Age squared -0.0001*** -0.0001*** -0.0000*** -0.0000***
(0) (0) (0.000) (0.000)
White, Non-Hispanic Omitted Omitted Omitted Omitted
Black, Non-Hispanic -0.1099*** -0.1126*** -0.0280*** -0.0299***
(0.007) (0.007) (0.007) (0.007)
Hispanic -0.1096*** -0.1113*** -0.0281*** -0.0294***
(0.008) (0.008) (0.007) (0.007)
Asian, Non-Hispanic -0.0052 -0.0078 0.0080 0.0063
(0.01) (0.01) (0.007) (0.007)
Other, Non-Hispanic -0.0529*** -0.0534*** -0.0337** -0.0337**
(0.014) (0.014) (0.014) (0.014)
Disability -0.0634*** -0.0629*** -0.0328*** -0.0323***
(0.007) (0.007) (0.007) (0.007)
Disability-not identified 0.1065*** 0.1074*** 0.0636*** 0.0650***
(0.02) (0.02) (0.010) (0.010)
Foreign-born non-citizen -0.0473*** -0.0487*** -0.0208** -0.0217**
(0.01) (0.01) (0.009) (0.009)
Total number of persons in household 0.0470*** 0.0472*** 0.0129*** 0.0130***
(0.002) (0.002) (0.002) (0.002)
Has related school-age children 0.1217*** 0.1224*** 0.0174 0.0182
(0.014) (0.014) (0.012) (0.012)
Total number of persons in household for households -0.0396*** -0.0398*** -0.0085*** -0.0087***
with related school-age children (interaction) (0.004) (0.004) (0.003) (0.003)
Rural (Nonmetropolitan) Omitted Omitted Omitted Omitted
Urban (Metropolitan) 0.0528*** 0.0490***
(0.006) (0.006)
Metropolitan Area not identified 0.0617*** 0.0211
(0.023) (0.022)
Metropolitan size: Less than 1,000,000 0.0492*** 0.0464***
(0.007) (0.006)
Metropolitan size: 1,000,000 to 2,499,999 0.0529*** 0.0543***
(0.008) (0.007)
Metropolitan size: 2,500,000 to 499,999,999 0.0676*** 0.0555***
(0.008) (0.008)
Metropolitan size: 5,000,000 or more 0.0661*** 0.0593***
(0.009) (0.008)
Metropolitan area size not identified 0.0287*** 0.0234**
(-0.011) (0.010)
Constant 0.0641** 0.0665** 0.5704*** 0.5712***
(0.026) (0.026) (0.028) (0.028)
Sample Size 54,269 54,269 41,844 41,844
Estimated Number of Households 119,516,167 119,516,167 91,702,117 91,702,117
R-squared 0.276 0.277 0.073 0.073
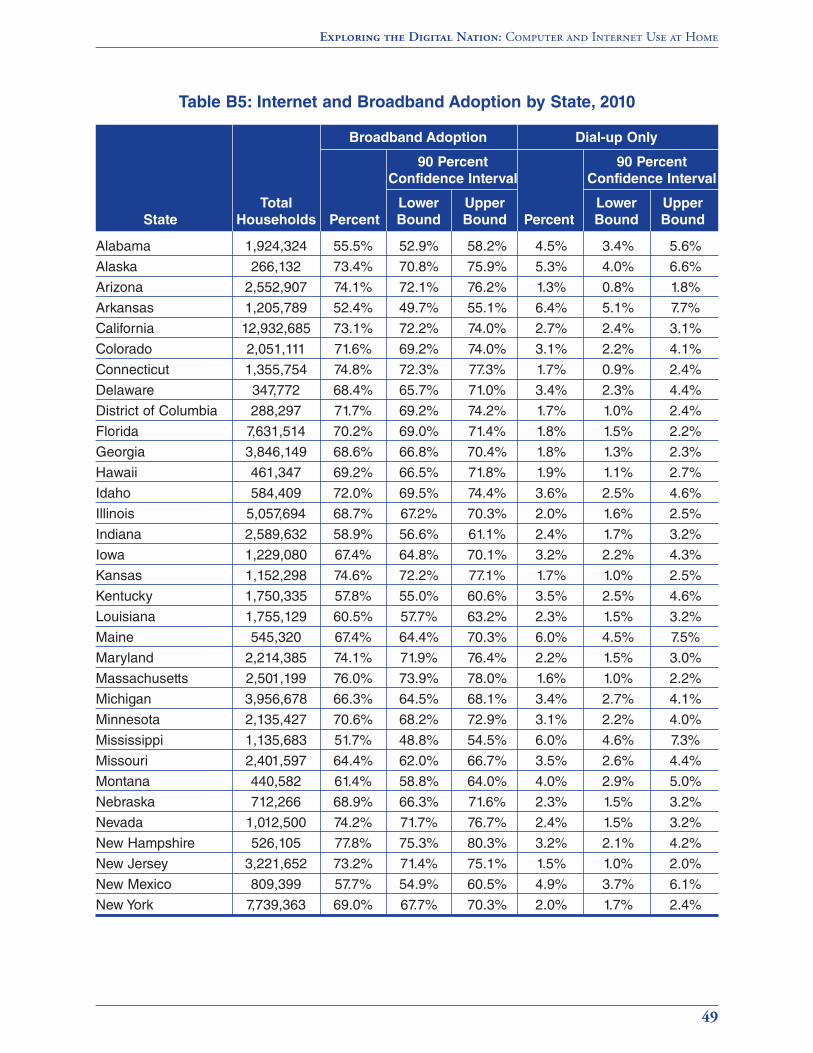
Exploring the Digital Nation: Computer and Internet Use at Home
49
Table B5: Internet and Broadband Adoption by State, 2010
Broadband Adoption Dial-up Only
90 Percent 90 Percent
Confidence Interval Confidence Interval
Total Lower Upper Lower Upper
State Households Percent Bound Bound Percent Bound Bound
Alabama 1,924,324 55.5% 52.9% 58.2% 4.5% 3.4% 5.6%
Alaska 266,132 73.4% 70.8% 75.9% 5.3% 4.0% 6.6%
Arizona 2,552,907 74.1% 72.1% 76.2% 1.3% 0.8% 1.8%
Arkansas 1,205,789 52.4% 49.7% 55.1% 6.4% 5.1% 7.7%
California 12,932,685 73.1% 72.2% 74.0% 2.7% 2.4% 3.1%
Colorado 2,051,111 71.6% 69.2% 74.0% 3.1% 2.2% 4.1%
Connecticut 1,355,754 74.8% 72.3% 77.3% 1.7% 0.9% 2.4%
Delaware 347,772 68.4% 65.7% 71.0% 3.4% 2.3% 4.4%
District of Columbia 288,297 71.7% 69.2% 74.2% 1.7% 1.0% 2.4%
Florida 7,631,514 70.2% 69.0% 71.4% 1.8% 1.5% 2.2%
Georgia 3,846,149 68.6% 66.8% 70.4% 1.8% 1.3% 2.3%
Hawaii 461,347 69.2% 66.5% 71.8% 1.9% 1.1% 2.7%
Idaho 584,409 72.0% 69.5% 74.4% 3.6% 2.5% 4.6%
Illinois 5,057,694 68.7% 67.2% 70.3% 2.0% 1.6% 2.5%
Indiana 2,589,632 58.9% 56.6% 61.1% 2.4% 1.7% 3.2%
Iowa 1,229,080 67.4% 64.8% 70.1% 3.2% 2.2% 4.3%
Kansas 1,152,298 74.6% 72.2% 77.1% 1.7% 1.0% 2.5%
Kentucky 1,750,335 57.8% 55.0% 60.6% 3.5% 2.5% 4.6%
Louisiana 1,755,129 60.5% 57.7% 63.2% 2.3% 1.5% 3.2%
Maine 545,320 67.4% 64.4% 70.3% 6.0% 4.5% 7.5%
Maryland 2,214,385 74.1% 71.9% 76.4% 2.2% 1.5% 3.0%
Massachusetts 2,501,199 76.0% 73.9% 78.0% 1.6% 1.0% 2.2%
Michigan 3,956,678 66.3% 64.5% 68.1% 3.4% 2.7% 4.1%
Minnesota 2,135,427 70.6% 68.2% 72.9% 3.1% 2.2% 4.0%
Mississippi 1,135,683 51.7% 48.8% 54.5% 6.0% 4.6% 7.3%
Missouri 2,401,597 64.4% 62.0% 66.7% 3.5% 2.6% 4.4%
Montana 440,582 61.4% 58.8% 64.0% 4.0% 2.9% 5.0%
Nebraska 712,266 68.9% 66.3% 71.6% 2.3% 1.5% 3.2%
Nevada 1,012,500 74.2% 71.7% 76.7% 2.4% 1.5% 3.2%
New Hampshire 526,105 77.8% 75.3% 80.3% 3.2% 2.1% 4.2%
New Jersey 3,221,652 73.2% 71.4% 75.1% 1.5% 1.0% 2.0%
New Mexico 809,399 57.7% 54.9% 60.5% 4.9% 3.7% 6.1%
New York 7,739,363 69.0% 67.7% 70.3% 2.0% 1.7% 2.4%
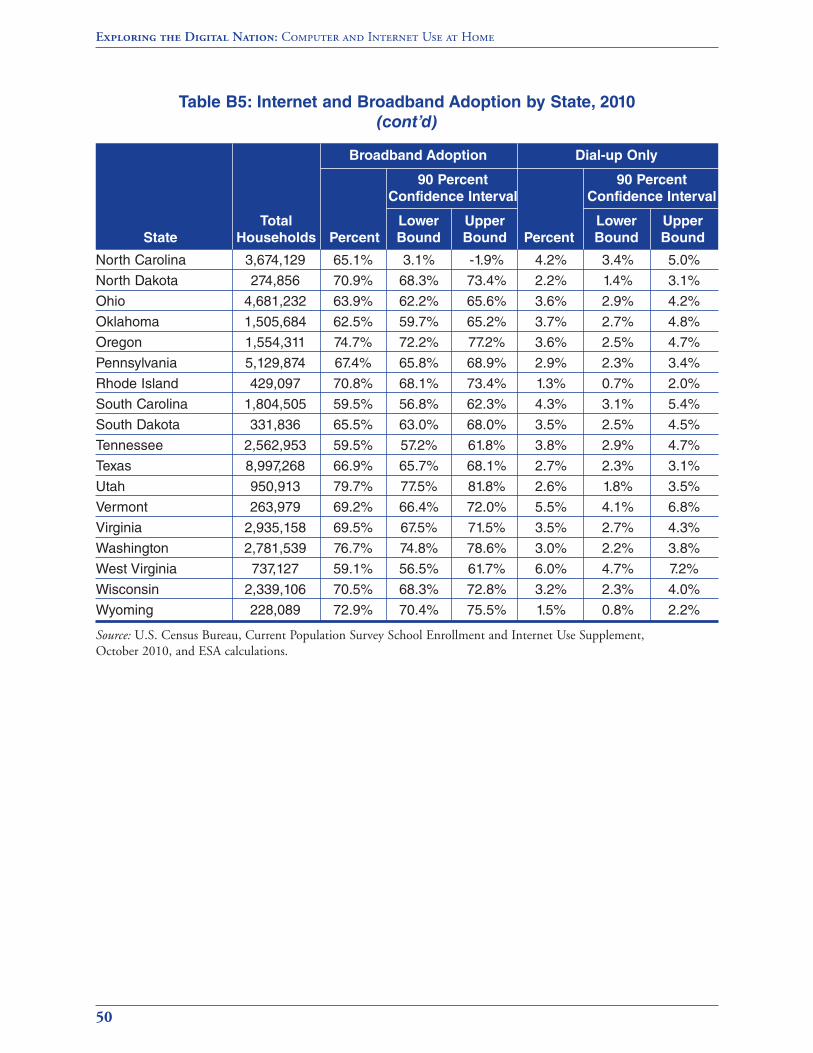
Table B5: Internet and Broadband Adoption by State, 2010
(cont’d)
Source: U.S. Census Bureau, Current Population Survey School Enrollment and Internet Use Supplement,October 2010, and ESA calculations.
Exploring the Digital Nation: Computer and Internet Use at Home
50
Broadband Adoption Dial-up Only
90 Percent 90 Percent
Confidence Interval Confidence Interval
Total Lower Upper Lower Upper
State Households Percent Bound Bound Percent Bound Bound
North Carolina 3,674,129 65.1% 3.1% -1.9% 4.2% 3.4% 5.0%
North Dakota 274,856 70.9% 68.3% 73.4% 2.2% 1.4% 3.1%
Ohio 4,681,232 63.9% 62.2% 65.6% 3.6% 2.9% 4.2%
Oklahoma 1,505,684 62.5% 59.7% 65.2% 3.7% 2.7% 4.8%
Oregon 1,554,311 74.7% 72.2% 77.2% 3.6% 2.5% 4.7%
Pennsylvania 5,129,874 67.4% 65.8% 68.9% 2.9% 2.3% 3.4%
Rhode Island 429,097 70.8% 68.1% 73.4% 1.3% 0.7% 2.0%
South Carolina 1,804,505 59.5% 56.8% 62.3% 4.3% 3.1% 5.4%
South Dakota 331,836 65.5% 63.0% 68.0% 3.5% 2.5% 4.5%
Tennessee 2,562,953 59.5% 57.2% 61.8% 3.8% 2.9% 4.7%
Texas 8,997,268 66.9% 65.7% 68.1% 2.7% 2.3% 3.1%
Utah 950,913 79.7% 77.5% 81.8% 2.6% 1.8% 3.5%
Vermont 263,979 69.2% 66.4% 72.0% 5.5% 4.1% 6.8%
Virginia 2,935,158 69.5% 67.5% 71.5% 3.5% 2.7% 4.3%
Washington 2,781,539 76.7% 74.8% 78.6% 3.0% 2.2% 3.8%
West Virginia 737,127 59.1% 56.5% 61.7% 6.0% 4.7% 7.2%
Wisconsin 2,339,106 70.5% 68.3% 72.8% 3.2% 2.3% 4.0%
Wyoming 228,089 72.9% 70.4% 75.5% 1.5% 0.8% 2.2%
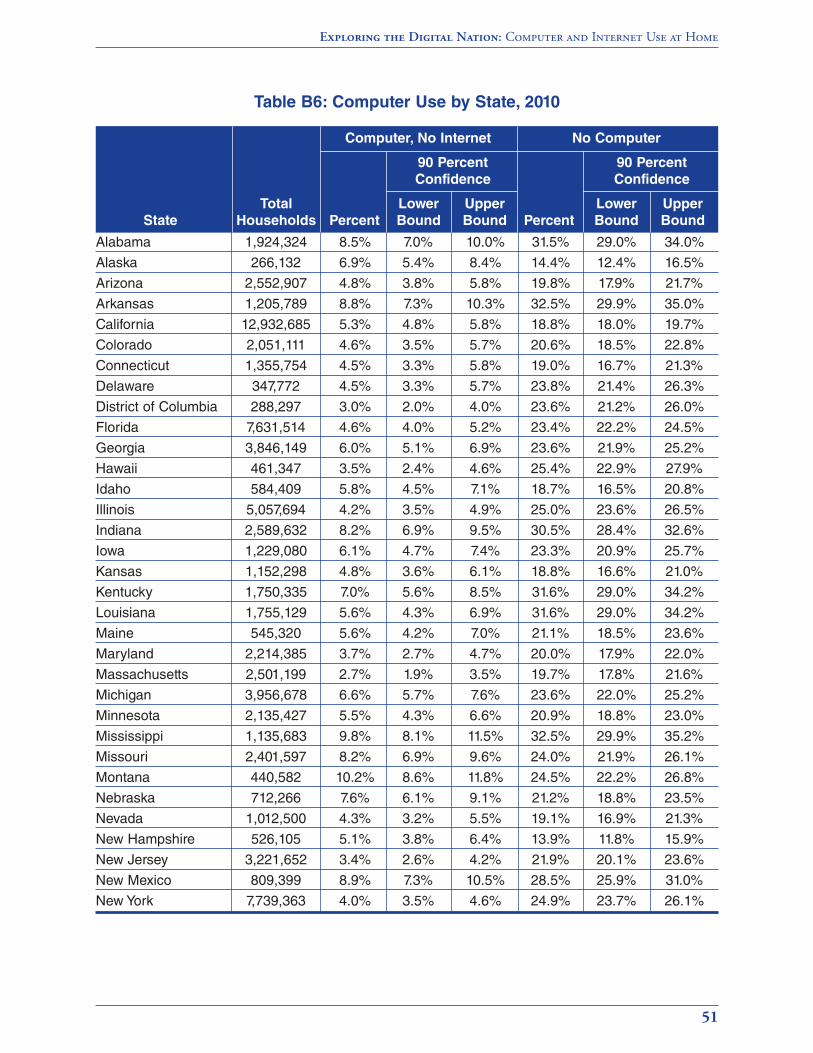
Exploring the Digital Nation: Computer and Internet Use at Home
51
Table B6: Computer Use by State, 2010
Computer, No Internet No Computer
90 Percent 90 Percent
Confidence Confidence
Total Lower Upper Lower Upper
State Households Percent Bound Bound Percent Bound Bound
Alabama 1,924,324 8.5% 7.0% 10.0% 31.5% 29.0% 34.0%
Alaska 266,132 6.9% 5.4% 8.4% 14.4% 12.4% 16.5%
Arizona 2,552,907 4.8% 3.8% 5.8% 19.8% 17.9% 21.7%
Arkansas 1,205,789 8.8% 7.3% 10.3% 32.5% 29.9% 35.0%
California 12,932,685 5.3% 4.8% 5.8% 18.8% 18.0% 19.7%
Colorado 2,051,111 4.6% 3.5% 5.7% 20.6% 18.5% 22.8%
Connecticut 1,355,754 4.5% 3.3% 5.8% 19.0% 16.7% 21.3%
Delaware 347,772 4.5% 3.3% 5.7% 23.8% 21.4% 26.3%
District of Columbia 288,297 3.0% 2.0% 4.0% 23.6% 21.2% 26.0%
Florida 7,631,514 4.6% 4.0% 5.2% 23.4% 22.2% 24.5%
Georgia 3,846,149 6.0% 5.1% 6.9% 23.6% 21.9% 25.2%
Hawaii 461,347 3.5% 2.4% 4.6% 25.4% 22.9% 27.9%
Idaho 584,409 5.8% 4.5% 7.1% 18.7% 16.5% 20.8%
Illinois 5,057,694 4.2% 3.5% 4.9% 25.0% 23.6% 26.5%
Indiana 2,589,632 8.2% 6.9% 9.5% 30.5% 28.4% 32.6%
Iowa 1,229,080 6.1% 4.7% 7.4% 23.3% 20.9% 25.7%
Kansas 1,152,298 4.8% 3.6% 6.1% 18.8% 16.6% 21.0%
Kentucky 1,750,335 7.0% 5.6% 8.5% 31.6% 29.0% 34.2%
Louisiana 1,755,129 5.6% 4.3% 6.9% 31.6% 29.0% 34.2%
Maine 545,320 5.6% 4.2% 7.0% 21.1% 18.5% 23.6%
Maryland 2,214,385 3.7% 2.7% 4.7% 20.0% 17.9% 22.0%
Massachusetts 2,501,199 2.7% 1.9% 3.5% 19.7% 17.8% 21.6%
Michigan 3,956,678 6.6% 5.7% 7.6% 23.6% 22.0% 25.2%
Minnesota 2,135,427 5.5% 4.3% 6.6% 20.9% 18.8% 23.0%
Mississippi 1,135,683 9.8% 8.1% 11.5% 32.5% 29.9% 35.2%
Missouri 2,401,597 8.2% 6.9% 9.6% 24.0% 21.9% 26.1%
Montana 440,582 10.2% 8.6% 11.8% 24.5% 22.2% 26.8%
Nebraska 712,266 7.6% 6.1% 9.1% 21.2% 18.8% 23.5%
Nevada 1,012,500 4.3% 3.2% 5.5% 19.1% 16.9% 21.3%
New Hampshire 526,105 5.1% 3.8% 6.4% 13.9% 11.8% 15.9%
New Jersey 3,221,652 3.4% 2.6% 4.2% 21.9% 20.1% 23.6%
New Mexico 809,399 8.9% 7.3% 10.5% 28.5% 25.9% 31.0%
New York 7,739,363 4.0% 3.5% 4.6% 24.9% 23.7% 26.1%

Table B6: Computer Use by State, 2010
(cont’d)
Source: U.S. Census Bureau, Current Population Survey School Enrollment and Internet Use Supplement,October 2010, and ESA calculations.
Exploring the Digital Nation: Computer and Internet Use at Home
52
Computer, No Internet No Computer
90 Percent 90 Percent
Confidence Confidence
Total Lower Upper Lower Upper
State Households Percent Bound Bound Percent Bound Bound
North Carolina 3,674,129 4.5% 3.6% 5.3% 27.1% 25.4% 28.9%
North Dakota 274,856 4.2% 3.1% 5.3% 22.7% 20.3% 25.0%
Ohio 4,681,232 6.8% 5.9% 7.7% 25.7% 24.2% 27.3%
Oklahoma 1,505,684 6.3% 4.9% 7.6% 27.5% 25.0% 30.0%
Oregon 1,554,311 6.3% 4.9% 7.7% 15.4% 13.3% 17.4%
Pennsylvania 5,129,874 4.7% 4.0% 5.4% 25.1% 23.7% 26.6%
Rhode Island 429,097 5.3% 3.9% 6.6% 22.7% 20.2% 25.2%
South Carolina 1,804,505 6.4% 5.0% 7.7% 29.9% 27.3% 32.4%
South Dakota 331,836 7.2% 5.8% 8.5% 23.8% 21.6% 26.0%
Tennessee 2,562,953 7.0% 5.8% 8.2% 29.7% 27.6% 31.9%
Texas 8,997,268 7.2% 6.6% 7.9% 23.2% 22.2% 24.3%
Utah 950,913 4.4% 3.3% 5.5% 13.3% 11.4% 15.1%
Vermont 263,979 5.7% 4.3% 7.1% 19.6% 17.2% 22.0%
Virginia 2,935,158 6.8% 5.7% 7.9% 20.2% 18.5% 22.0%
Washington 2,781,539 6.8% 5.7% 8.0% 13.5% 11.9% 15.0%
West Virginia 737,127 8.7% 7.2% 10.2% 26.2% 23.8% 28.5%
Wisconsin 2,339,106 4.7% 3.7% 5.7% 21.6% 19.6% 23.6%
Wyoming 228,089 7.1% 5.6% 8.5% 18.6% 16.3% 20.8%
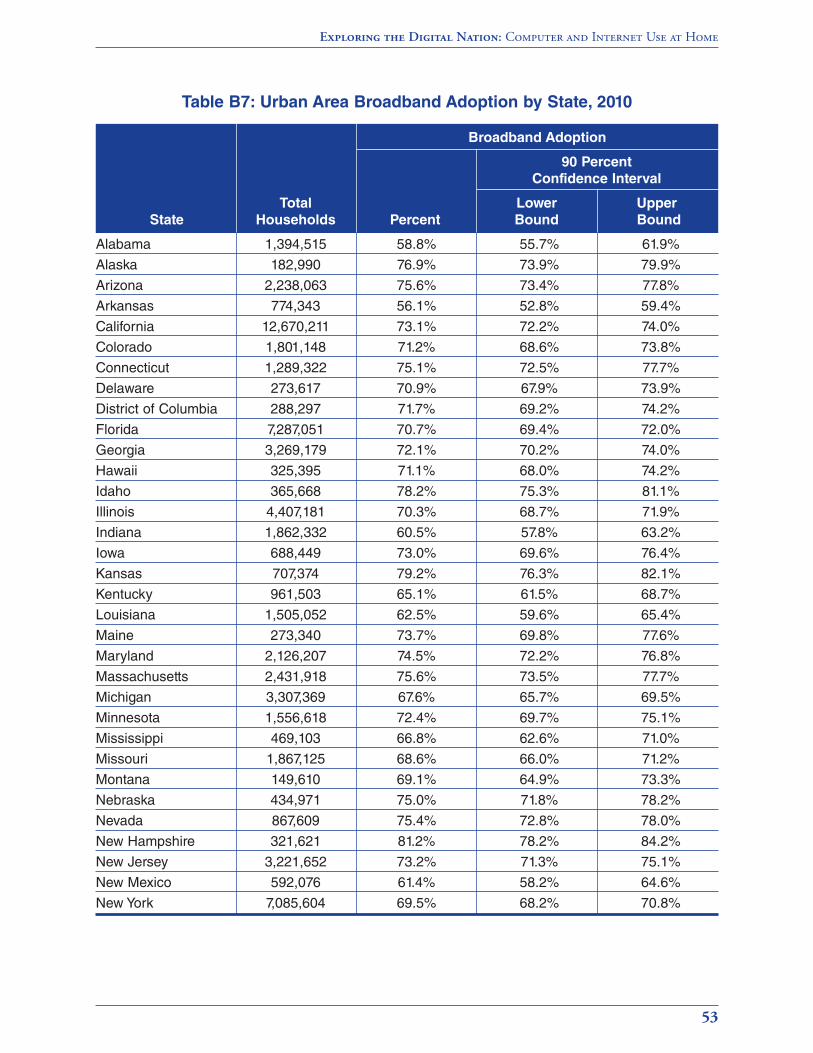
Exploring the Digital Nation: Computer and Internet Use at Home
53
Table B7: Urban Area Broadband Adoption by State, 2010
Broadband Adoption
90 Percent
Confidence Interval
Total Lower Upper
State Households Percent Bound Bound
Alabama 1,394,515 58.8% 55.7% 61.9%
Alaska 182,990 76.9% 73.9% 79.9%
Arizona 2,238,063 75.6% 73.4% 77.8%
Arkansas 774,343 56.1% 52.8% 59.4%
California 12,670,211 73.1% 72.2% 74.0%
Colorado 1,801,148 71.2% 68.6% 73.8%
Connecticut 1,289,322 75.1% 72.5% 77.7%
Delaware 273,617 70.9% 67.9% 73.9%
District of Columbia 288,297 71.7% 69.2% 74.2%
Florida 7,287,051 70.7% 69.4% 72.0%
Georgia 3,269,179 72.1% 70.2% 74.0%
Hawaii 325,395 71.1% 68.0% 74.2%
Idaho 365,668 78.2% 75.3% 81.1%
Illinois 4,407,181 70.3% 68.7% 71.9%
Indiana 1,862,332 60.5% 57.8% 63.2%
Iowa 688,449 73.0% 69.6% 76.4%
Kansas 707,374 79.2% 76.3% 82.1%
Kentucky 961,503 65.1% 61.5% 68.7%
Louisiana 1,505,052 62.5% 59.6% 65.4%
Maine 273,340 73.7% 69.8% 77.6%
Maryland 2,126,207 74.5% 72.2% 76.8%
Massachusetts 2,431,918 75.6% 73.5% 77.7%
Michigan 3,307,369 67.6% 65.7% 69.5%
Minnesota 1,556,618 72.4% 69.7% 75.1%
Mississippi 469,103 66.8% 62.6% 71.0%
Missouri 1,867,125 68.6% 66.0% 71.2%
Montana 149,610 69.1% 64.9% 73.3%
Nebraska 434,971 75.0% 71.8% 78.2%
Nevada 867,609 75.4% 72.8% 78.0%
New Hampshire 321,621 81.2% 78.2% 84.2%
New Jersey 3,221,652 73.2% 71.3% 75.1%
New Mexico 592,076 61.4% 58.2% 64.6%
New York 7,085,604 69.5% 68.2% 70.8%
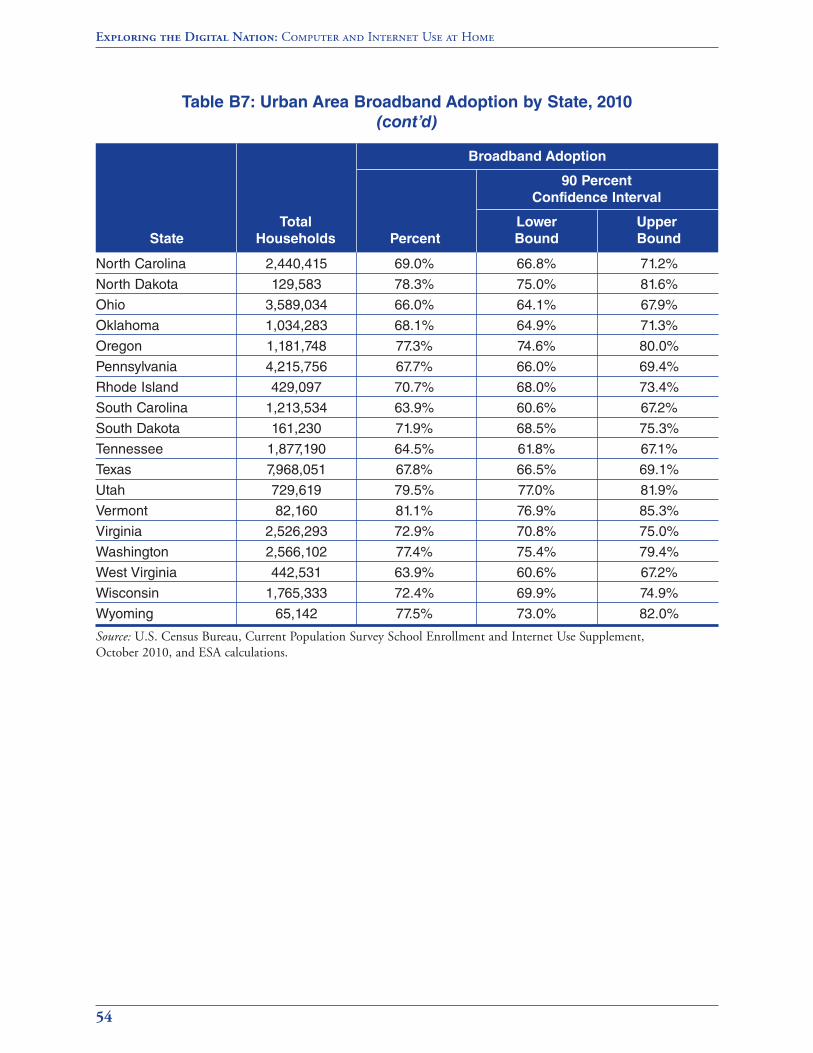
Table B7: Urban Area Broadband Adoption by State, 2010
(cont’d)
Source: U.S. Census Bureau, Current Population Survey School Enrollment and Internet Use Supplement,October 2010, and ESA calculations.
Exploring the Digital Nation: Computer and Internet Use at Home
54
Broadband Adoption
90 Percent
Confidence Interval
Total Lower Upper
State Households Percent Bound Bound
North Carolina 2,440,415 69.0% 66.8% 71.2%
North Dakota 129,583 78.3% 75.0% 81.6%
Ohio 3,589,034 66.0% 64.1% 67.9%
Oklahoma 1,034,283 68.1% 64.9% 71.3%
Oregon 1,181,748 77.3% 74.6% 80.0%
Pennsylvania 4,215,756 67.7% 66.0% 69.4%
Rhode Island 429,097 70.7% 68.0% 73.4%
South Carolina 1,213,534 63.9% 60.6% 67.2%
South Dakota 161,230 71.9% 68.5% 75.3%
Tennessee 1,877,190 64.5% 61.8% 67.1%
Texas 7,968,051 67.8% 66.5% 69.1%
Utah 729,619 79.5% 77.0% 81.9%
Vermont 82,160 81.1% 76.9% 85.3%
Virginia 2,526,293 72.9% 70.8% 75.0%
Washington 2,566,102 77.4% 75.4% 79.4%
West Virginia 442,531 63.9% 60.6% 67.2%
Wisconsin 1,765,333 72.4% 69.9% 74.9%
Wyoming 65,142 77.5% 73.0% 82.0%
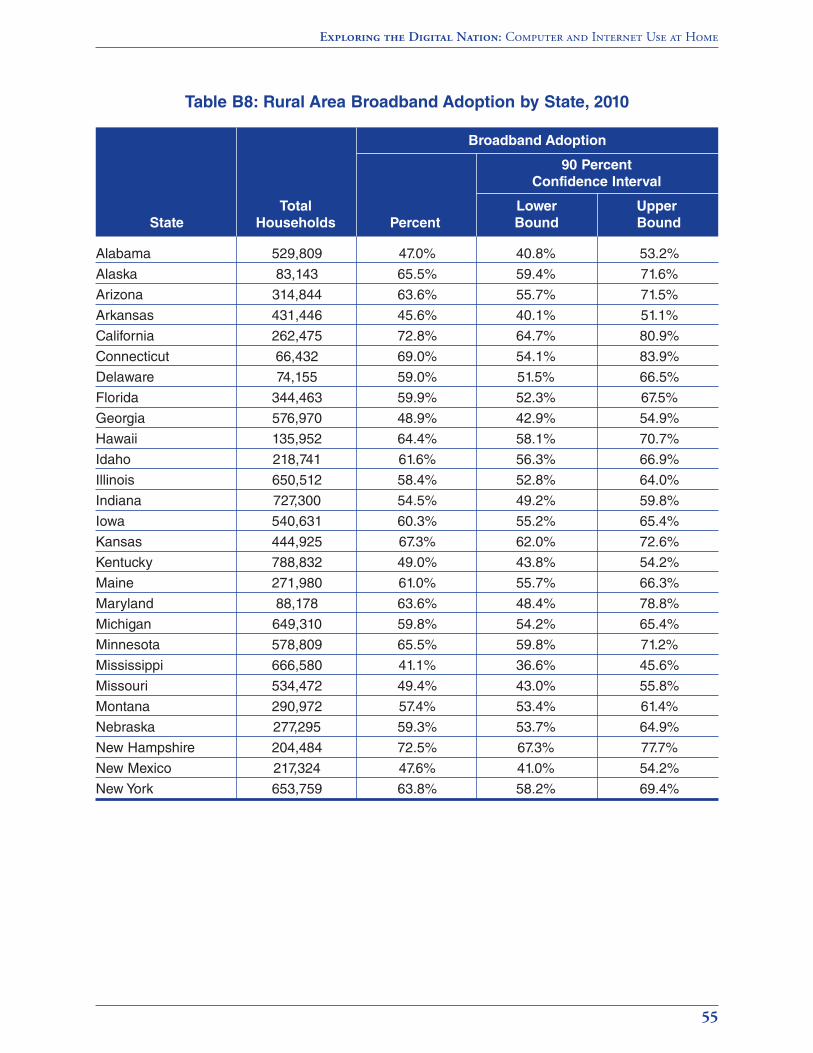
Exploring the Digital Nation: Computer and Internet Use at Home
55
Table B8: Rural Area Broadband Adoption by State, 2010
Broadband Adoption
90 Percent
Confidence Interval
Total Lower Upper
State Households Percent Bound Bound
Alabama 529,809 47.0% 40.8% 53.2%
Alaska 83,143 65.5% 59.4% 71.6%
Arizona 314,844 63.6% 55.7% 71.5%
Arkansas 431,446 45.6% 40.1% 51.1%
California 262,475 72.8% 64.7% 80.9%
Connecticut 66,432 69.0% 54.1% 83.9%
Delaware 74,155 59.0% 51.5% 66.5%
Florida 344,463 59.9% 52.3% 67.5%
Georgia 576,970 48.9% 42.9% 54.9%
Hawaii 135,952 64.4% 58.1% 70.7%
Idaho 218,741 61.6% 56.3% 66.9%
Illinois 650,512 58.4% 52.8% 64.0%
Indiana 727,300 54.5% 49.2% 59.8%
Iowa 540,631 60.3% 55.2% 65.4%
Kansas 444,925 67.3% 62.0% 72.6%
Kentucky 788,832 49.0% 43.8% 54.2%
Maine 271,980 61.0% 55.7% 66.3%
Maryland 88,178 63.6% 48.4% 78.8%
Michigan 649,310 59.8% 54.2% 65.4%
Minnesota 578,809 65.5% 59.8% 71.2%
Mississippi 666,580 41.1% 36.6% 45.6%
Missouri 534,472 49.4% 43.0% 55.8%
Montana 290,972 57.4% 53.4% 61.4%
Nebraska 277,295 59.3% 53.7% 64.9%
New Hampshire 204,484 72.5% 67.3% 77.7%
New Mexico 217,324 47.6% 41.0% 54.2%
New York 653,759 63.8% 58.2% 69.4%
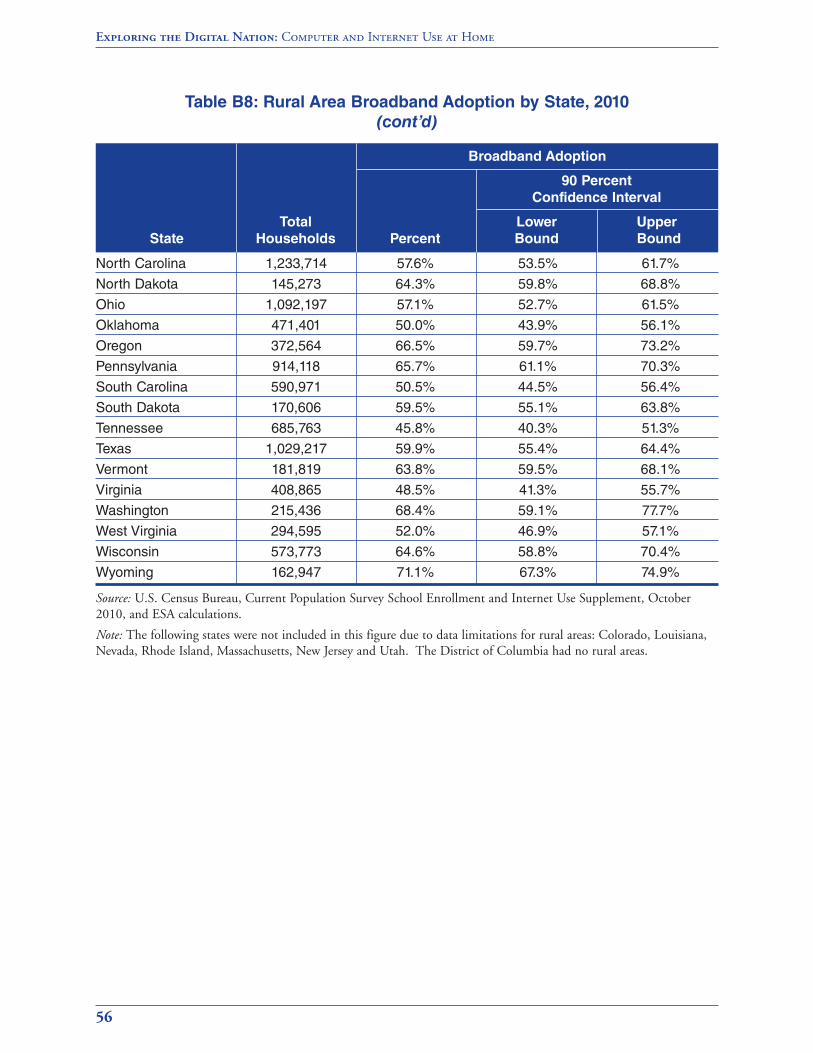
Table B8: Rural Area Broadband Adoption by State, 2010
(cont’d)
Source: U.S. Census Bureau, Current Population Survey School Enrollment and Internet Use Supplement, October2010, and ESA calculations.
Note: The following states were not included in this figure due to data limitations for rural areas: Colorado, Louisiana,Nevada, Rhode Island, Massachusetts, New Jersey and Utah. The District of Columbia had no rural areas.
Exploring the Digital Nation: Computer and Internet Use at Home
56
Broadband Adoption
90 Percent
Confidence Interval
Total Lower Upper
State Households Percent Bound Bound
North Carolina 1,233,714 57.6% 53.5% 61.7%
North Dakota 145,273 64.3% 59.8% 68.8%
Ohio 1,092,197 57.1% 52.7% 61.5%
Oklahoma 471,401 50.0% 43.9% 56.1%
Oregon 372,564 66.5% 59.7% 73.2%
Pennsylvania 914,118 65.7% 61.1% 70.3%
South Carolina 590,971 50.5% 44.5% 56.4%
South Dakota 170,606 59.5% 55.1% 63.8%
Tennessee 685,763 45.8% 40.3% 51.3%
Texas 1,029,217 59.9% 55.4% 64.4%
Vermont 181,819 63.8% 59.5% 68.1%
Virginia 408,865 48.5% 41.3% 55.7%
Washington 215,436 68.4% 59.1% 77.7%
West Virginia 294,595 52.0% 46.9% 57.1%
Wisconsin 573,773 64.6% 58.8% 70.4%
Wyoming 162,947 71.1% 67.3% 74.9%


Final Digital Nation covers.qxd 11/1/11 11:01 AM Page 2

Final Digital Nation covers.qxd 11/1/11 11:01 AM Page 1