exploring silver as a contrast agent for contrast-enhanced dual-energy x-ray breast imaging
TRANSCRIPT

BJR © 2014 The Authors. Published by the British Institute of Radiology
Received:23 January 2014
Revised:27 May 2014
Accepted:2 July 2014
doi: 10.1259/bjr.20140081
Cite this article as:Karunamuni R, Tsourkas A, Maidment ADA. Exploring silver as a contrast agent for contrast-enhanced dual-energy X-ray breast imaging. Br JRadiol 2014;87:20140081.
FULL PAPER
Exploring silver as a contrast agent for contrast-enhanceddual-energy X-ray breast imaging
1R KARUNAMUNI, PhD, 2A TSOURKAS, PhD and 1A D A MAIDMENT, PhD
1Department of Radiology, University of Pennsylvania, Philadelphia, PA, USA2Department of Bioengineering, University of Pennsylvania, Philadelphia, PA, USA
Address correspondence to: Mr Roshan KarunamuniE-mail: [email protected]
Objective: Through prior monoenergetic modelling, we
have identified silver as a potential alternative to iodine in
dual-energy (DE) X-ray breast imaging. The purpose of
this study was to compare the performance of silver and
iodine contrast agents in a commercially available DE
imaging system through a quantitative analysis of signal
difference-to-noise ratio (SDNR).
Methods: A polyenergetic simulation algorithm was de-
veloped to model the signal intensity and noise. The model
identified the influence of various technique parameters on
SDNR. The model was also used to identify the optimal
imaging techniques for silver and iodine, so that the two
contrast materials could be objectively compared.
Results: The major influences on the SDNR were the low-
energy dose fraction and breast thickness. An increase in
the value of either of these parameters resulted in
a decrease in SDNR. The SDNR for silver was on average
43% higher than that for iodine when imaged at their
respective optimal conditions, and 40% higher when both
were imaged at the optimal conditions for iodine.
Conclusion: A silver contrast agent should provide
benefit over iodine, even when translated to the clinic
without modification of imaging system or protocol. If the
system were slightly modified to reflect the lower k-edge
of silver, the difference in SDNR between the two
materials would be increased.
Advances in knowledge: These data are the first to
demonstrate the suitability of silver as a contrast material
in a clinical contrast-enhanced DE image acquisition
system.
Contrast-enhanced (CE) dual-energy (DE) X-ray breastimaging provides quantitative functional information withhigh-resolution anatomical data in a single imaging pro-cedure. DE images can be used to identify tumour neo-vasculature and morphology, and consequently aid in thedetection and diagnosis of breast cancer.1–7 The mostwidely used approach for DE imaging is k-edge imaging. Inthis technique, two distinct energy spectra [low energy (LE)and high energy (HE)] are placed on either side of the k-edge of the contrast material. Through a weighted sub-traction of the LE and HE images, it is possible to suppressthe anatomical background signal and enhance the visu-alization of the contrast agent. The total dose of the twoimages is judiciously allocated so as to maximize the visi-bility of the contrast agent while providing an anatomicalimage of diagnostic quality. DE X-ray breast imaging hasbeen shown to aid visualization of lesions that are other-wise mammographically occult as well as to providefunctional blood flow information consistent with MRI—the current gold standard in functional breastimaging.1–3,7,8 This has led to the development of severalDE imaging systems by Hologic® (Bedford, MA), General
Electric (GE; Fairfield, CT) and Royal Philips (Amsterdam,Netherlands).7,9,10
Currently, CEDE breast imaging is performed with an iodin-ated contrast agent. These agents are typically small moleculesconsisting of tri-iodinated benzene rings with substitutions forimproved solubility. They are extremely stable in the body andare excreted via urine without undergoing biochemical change.However, they are plagued by several limitations. Owing totheir small size, these agents are rapidly filtered by the kidneyand therefore necessitate immediate post-injection imaging.11
Filtration by the kidneys can lead to contrast-media-inducednephropathy in patients with pre-existing renal insufficiency,such as diabetes mellitus.12,13 The non-specific nature of thecontrast agents results in random vascular permeation andlow tumour-targeting potential. These limitations can beovercome with the use of a nanoparticle-based imaging agent.Nanoparticles can be targeted with surface ligands to attach tospecific cell-surface antigens, increasing the amount of con-trast material at the tumour.14–16 The nanoparticle surface canalso be modified to prolong circulation times and therebyincrease the dose delivered to the target site.14,17–19

We have previously developed a theoretical framework toidentify new, candidate materials for DE X-ray breast imaging.20
The framework quantifies the DE signal difference-to-noise ratio(SDNR) as a function of atomic number (Z). The resultsdemonstrated an optimal group of materials with Z from 42 to63 in which the maximum SDNR varies by ,15%. However,there are certain caveats to be considered before experimentallytesting any of these materials. The theoretical model is based ona monoenergetic source of X-rays and demonstrated that as Zincreases, the optimal X-ray energy for the HE image increases,while the allocation of dose to the LE image decreases. Froma practical perspective, substantial filtration is necessary to ob-tain HE spectra with high mean energy. This results in infeasiblylarge tube current–time products (mAs) to ensure clinical imagequality. In addition, LE images acquired with low doses willresult in noisier anatomic images that will limit the effectivenessand applications of the imaging technique. Upon considerationof these constraints, contrast materials with lower atomicnumbers are more suitable for testing. As iodine (I; Z5 53) iscurrently the standard in DE breast imaging and notably suffersfrom these limitations, it can be treated as the highest feasibleatomic number for use as a contrast material.
Theoretical modelling and practical considerations have nar-rowed the list of potential DE contrast materials to those withatomic numbers ranging from 42 to 52. Silver (Ag; Z5 47) waschosen based on the following additional considerations. Agrepresents a viable choice because of the large amount of liter-ature already available on the development and manufacture ofAg nanoparticles.21–24 In addition, the prevalent use of silverfilters in CEDE imaging means that the LE spectrum can befiltered to remove the energies above the k-edge of Ag contrastmaterial. This is important because DE contrast can be onlyobserved when the LE and HE spectra are predominantly onopposite sides of the k-edge of the imaging agent.
Nano-Ag represents the largest (25%) and fastest growing cate-gory of nanotechnology-based consumer products.25 Many ofthese applications make use of the broad-spectrum antimicrobialand optical scattering properties of Ag.21,26–32 For example,Kumar et al31 embedded Ag nanoparticles in household paint todevelop an antimicrobial coating that can be directly applied towood, glass and polymers. The surfaces coated with the Ag-embedded paint showed excellent antimicrobial effects on bothGram-positive and Gram-negative human pathogens. McFarlandand Van Duyne32 used Ag nanoparticles in combination withdark-field microscopy for the quantitative sensing of streptavidinwith a subpicomolar limit of detection. To our knowledge, therehas been no work reported to date where the potential role of Agnanoparticles as a radiographic agent is demonstrated.
In this work, we explore the feasibility of a Ag-based agent forDE X-ray breast imaging. The primary goal of this manuscript isto determine if a Ag agent could outperform an iodinatedcontrast agent on a commercially available imaging system withlittle or no modification to the existing system design. Theimaging system investigated in this work is the commercialHologic Dimensions™ CEDE X-ray acquisition system. Thetechnique parameters, including LE and HE tube potential, filter
material and mAs are pre-selected based on the thickness of thebreast. These parameters were determined by Hologic usingsimulations and experimental validation using iodinated insertsin a Computerized Imaging Reference Systems phantom (CIRSInc., Norfolk, VA). The total mean glandular dose (MGD) of theLE and HE image pair is set to equate roughly to a standard two-view mammographic examination.
For this article, a computational algorithm was developed inMATLAB® (MathWorks®, Natick, MA) to identify the set ofimage parameters, particular to this system, that optimize theSDNR for a Ag and I contrast agent. The algorithm was con-strained by the values of HE and LE tube potential, filters anddose utilized by the imaging system. Thus, the findings pre-sented here are not those of an optimization search, in thestrictest sense. The algorithm was designed to test the perfor-mance of a Ag agent on an existing imaging system to determinethe ease with which a potential agent could be transferred to theclinic. The algorithm was validated by comparing simulatedmetrics of DE SDNR with experimentally obtained values. Thealgorithm was then used to identify parameters with which tocompare the performance of Ag and I using physical phantomsexperimentally.
METHODS AND MATERIALSDevelopment of simulation algorithmA simulation algorithm was developed in MATLAB to identifythe set of clinically feasible technique factors and image processingparameters that maximized the SDNR for various imaging agents.The values of tube potential, filter materials and filter thicknesseschosen for the search reflect those that are available on the pro-totype Hologic CEDE Dimensions system (Table 1).
Four constraints are placed on the simulation algorithm:(1) The total MGD to the breast was calculated using the Dance
model33,34 and set to match the Hologic system as a functionof breast thickness.
(2) The allocation of the MGD between the LE and HE images(dose fraction) was allowed to vary from 10% (majority of thedose in HE) to 90% (majority of the dose in LE).
(3) The maximum mAs for each of the LE or HE image is 240.Techniques that produce LE or HE images above this valuewere eliminated from further study.
Table 1. Values of parameters used in the simulation algorithm
Parameter Values
Target Tungsten
LE 23–35 kV
HE 36–49 kV
Filter materialsLE: silver (50mm), rhodium (50mm) andaluminium (700mm)HE: copper (300mm)
Detector Selenium, energy integrating, 200mm
Breast thickness 2–8 cm
HE, high energy; LE, low energy.
BJR R Karunamuni et al
2 of 13 birpublications.org/bjr Br J Radiol;87:20140081

(4) A minimum signal threshold was required. Techniques thatproduced LE or HE images below the threshold wereeliminated from further study.
The spectra (LE and HE) were generated using the interpolatingpolynomial method described by Boone et al.35 The spectra werethen attenuated using the Beer–Lambert law through a combi-nation of the filter material, air and 0.7mm of beryllium. Thesource to image distance was 70 cm on the Hologic system. Thespectra were then scaled appropriately to ensure that the totalMGD to the breast from the LE and HE images matched theHologic dose (Constraint 1). The mAs required to achieve thisdose was then calculated. The mAs and signal intensity (SI)were tested to ensure they were within the limitations of thephysical system (Constraints 3 and 4). If the mAs and SI cri-teria were met for the DE spectral pair, the simulation algo-rithm calculated the DE weighting factor, W, and the SDNR. Intotal, 26,460 unique combinations of imaging parameters werestudied.
Calculation of W and signal difference-to-noise ratioThe SI recorded by the energy-integrating detector is givenby:
SI5+kVE51ðId 3 E3DEÞ (1)
where Id is the spectral photon fluence incident on the detector,E is the energy (keV), ΔE is the size of the energy bins and kV isthe applied tube potential difference. The standard deviation, s,of the SI is calculated as:
s5 SI0:46 (2)
The exponent of 0.46 was obtained from Marshall et al.36 Avalue of 0.5 would correspond to a Poisson distribution of SI.This value is used directly under the assumption that the de-tector response of the Hologic Dimensions CEDE system is thesame as that studied by Marshall (Selenia®; Hologic, Waltham,MA). In addition, the exponent is assumed to be constant acrossthe various X-ray energies used in this analysis. The DEweighting factor is calculated as:
W 5ln�SIaHE
�2 lnðSIgHEÞ
ln�SIaLE
�2 lnðSIgLEÞ
(3)
The superscripts, a and g, refer to adipose and glandular tissue,respectively. This formulation is adapted from our previoustheoretical model to account for polyenergetic spectra.20 Theweighting factor is calculated so as to remove the signal variationthat arises from various admixtures of adipose and glandulartissue. The expression of W is similar to the subtractionweighting factors used in the literature.37,38 DE SI (SIDE) iscalculated from the LE and HE SI as:
SIDE 5 lnðSIHEÞ2W 3 lnðSILEÞ (4)
This calculation is performed for breast tissue with andwithout added contrast material (superscripts cont and bkg,
respectively). The resulting imaging contrast is quantified usingSDNR:
SDNR5SIcontDE 2 SIbkgDE
sbkgDE
(5)
The DE standard deviation (sDE) is calculated as:
sDE5
ffiffiffiffiffiffiffiffiffiffiffiffiffiffiffiffiffiffiffiffiffiffiffiffiffiffiffiffiffiffiffiffiffiffiffiffiffiffiffiffiffiffiffiffiffiffiffiffiffiffiffiffiffiffiffiffiffiffiffiffiffiffiffiffiffiffiffiffiffiffiffiffiffiffiffiffiffiffiffiffiffiffiffiffiffiffiffiffiffiffiffiffiffiffiffiffiffiffiffiffiffiffiffiffiffiffiffis2HE 1W2 3s2
LE 2 23W 3 covhln�SIbkgHE
�; ln
�SIbkgLE
�ir
(6)
The expression of sDE is the propagation of error resulting fromthe weighted subtraction of the LE and HE signal intensities.The covariance term (cov) was experimentally measured byimaging a 4-cm block acrylic phantom using combinations ofLE and HE spectral pairs. The resulting values of sDE, sLE andsHE were used with Equation (6) to obtain the covariance. Arepresentative value of the covariance, averaged over the spectralpairs, was used for the analysis. The effect of filter material, dosefraction and breast thickness on the values of W and SDNR ofa Ag contrast agent were then studied.
Validating the simulation algorithmThe results of the simulation algorithm were validated usingphysical phantoms. 10 spectral pairs were chosen to be experi-mentally measured on the prototype Hologic Dimensions CEDEsystem (Table 2). These were chosen to encompass a variety ofLE and HE tube potential pairs, filter materials and LE dosefractions. In all cases, raw images (“For Processing” in Hologic)were used for quantitative analysis. These images have minimalimage processing applied to them and have pixel values that areanalogous to the signal intensities derived by the simulation. Wand SDNR were obtained experimentally and compared with thevalues obtained from the simulation.
W was measured using phantoms consisting of blocks of100% adipose-equivalent and 100% glandular-equivalentCIRS materials. The phantom materials were placed upona lead sheet having a 10-mm diameter aperture to reduce theinfluence of scatter. Similarly, the assembly was imaged usinga geometric magnification of 1.4 to reduce the number ofscattered photons further (Figure 1). The raw pixel valueswere measured in a region of interest (3.53 3.5 mm) afterthe system-specific flat-fielding algorithm was applied. W wasthen calculated using Equation (3). Multiple regions ofinterest were used to determine the error in the calculationof W.
To measure SDNR, the lead sheet was removed, and a 50-mmstrip of Ag foil was placed on the surface of a 4-cm step phantomset directly on the breast support. LE and HE images were ac-quired for each spectral pair and subtracted to create DE images.Regions of interest (3.53 3.5mm) in the DE image were chosenin the background and Ag foil to correspond to SIbkgDE and SIcontDE ,respectively. SDNR was calculated using Equations (4)–(6).Multiple regions of interest were used to determine the error inthe calculation of SDNR.
Full paper: Silver as contrast agent for dual-energy X-ray breast imaging BJR
3 of 13 birpublications.org/bjr Br J Radiol;87:20140081

Comparing signal difference-to-noise ratio betweensilver and iodineA solution of Omnipaque™ (GE Healthcare, Little Chalfont,UK) iodinated contrast material was diluted to a final concen-tration of 16mgml21 of I. An equivalent concentration of Agwas obtained by dissolving the required amount of silver nitratein water. The two solutions were used to compare the SDNR ofAg and I contrast materials in a specially fabricated contrast-embedded step phantom. The phantom measured33 43 10 cm (height3width3 length). The phantom waspositioned such that the X-ray path length through the phantomwas equal to the height of the phantom (3 cm). A 4-mm holewas bored along the longitudinal direction to accommodate aTygon® (Saint-Gobain, Courbevoie, France) R-3603 plastic tube(inner diameter, 3/32 inches; outer diameter, 5/32 inches) con-taining the contrast agents to be imaged against varying glan-dular percentages (from 0% to 100% glandularity, in 25%increments).
Using the simulation, the maximum SDNR at a thickness of3 cm was determined for each of the three LE filter materials.This was performed for both I and Ag, yielding six optimalspectral pairs. For each filter material, four imaging con-ditions were then carried out: (i) Ag at optimal Ag imagingconditions, (ii) I at optimal I imaging conditions, (iii) Ag atoptimal I imaging conditions and (iv) I at optimal Ag imagingconditions.
RESULTSSimulationIf the simulation were to include all the possible combina-tions available on the prototype Hologic Dimensions CEDEsystem, as determined by Constraints 1 and 2 described in theDevelopment of simulation algorithm section, it would bepossible to obtain values of SDNR for 26,460 unique com-binations of imaging parameters. However, many of thesecombinations would be infeasible because they would eitherrequire impractical mAs or result in insufficient SI. Therefore,the mAs and SI criteria in Constraints 3 and 4 require that
76% of these combinations be eliminated. The followingresults were obtained using the remaining 6366 combinationsof spectral pairs.
Table 2. Representative spectral pairs that were chosen to validate the simulation results
Spectral pair HE (kV) LE (kV) LE filter LE dose fraction (%)
1 36 28 Aluminium 70
2 42 28 Aluminium 60
3 49 28 Aluminium 60
4 36 26 Rhodium 90
5 42 26 Rhodium 50
6 49 26 Rhodium 40
7 42 32 Silver 40
8 42 35 Silver 80
9 49 32 Silver 70
10 49 35 Silver 60
HE, high energy; LE, low energy.The representative spectral pairs consist of a mixture of LE, HE tube potential combinations, filter materials and LE dose fraction.
Figure 1. Experimental set-up for determining W. Adipose-
or glandular-equivalent materials of Computerized Imag-
ing Reference Systems Inc., Norfolk, VA, were placed on
a lead sheet with a hole and imaged under geometric
magnification.
BJR R Karunamuni et al
4 of 13 birpublications.org/bjr Br J Radiol;87:20140081

Weighting factorWeighting factor, W, is calculated using Equation (3). Fromits formulation, W would be expected to show a dependenceon the separation between the LE and HE spectra. This isdemonstrated in Figure 2, where W is plotted as a function ofthe mean energies of the LE and HE spectra. The 6366 datapoints were fit to a second order polynomial surface witha root mean square error of 0.03. W is shown to decrease asthe separation between the two spectra increases. This can beexplained by an examination of the dependency of W on thesignal intensities of adipose and glandular tissue. The naturallogarithm of the SI is primarily dependent on the linear at-tenuation coefficient of the material. Thus, Equation (3) canbe thought of as the difference in linear attenuation co-efficient between adipose and glandular tissue at the HE di-vided by the difference at the LE. As the energy increases, thedifference in linear attenuation coefficient between these twomaterials decreases. These data agree with previous mono-energetic calculations that show that W is smaller when theLE and HE values are further apart.20
The relationship between W and the LE and HE mean energiescan be used to explain the variation in W with all of the algo-rithm parameters. For example, Figure 3 shows W plotted forbreast thicknesses ranging from 2 to 8 cm for a spectral pair of46 kV HE with copper filtration and a 28 kV LE with rhodiumfiltration at a LE dose fraction of 40%. W increases with in-creasing breast thickness owing to beam hardening; as breastthickness increases, a greater proportion of the LE photons areattenuated. Although beam hardening affects both LE and HEspectra, the increase in mean energy is more noticeable in the LEspectrum owing to the higher proportion of LE photons. Asa result, the mean energy of the LE spectrum increases fasterthan that of the HE spectrum. The reduction in spectral sepa-ration with increasing thickness results in an increase in thevalue of W.
Signal difference-to-noise ratioThe SDNR for a Ag contrast agent was calculated usingEquation (5). When SDNR was plotted against the mean ener-gies of the LE and HE spectra, as in Figure 2, no correlation wasobserved. The effect of other compounding factors, such as doseand noise, mask any relationship that may otherwise exist.Therefore, the influence of individual imaging parameters onSDNR was studied to identify trends in the data.
The first parameter examined is the choice of filter material. TheHE filter is always set to copper, as this is the only optionavailable on the Hologic image acquisition system. Thus, thesimulation exclusively selected copper for the HE spectrum, andany reference to filter material or thickness from this pointforward corresponds to the LE filter. The effect of the three filtermaterial choices on the SDNR is illustrated as a box plot inFigure 4. For these data points, the central mark is the median,the edges of the box are the 25th and 75th percentile and thewhiskers extend to the most extreme data. The data for eachfilter material encompass multiple energy pairs, dose fractionsand breast thicknesses. The data for aluminium, rhodium andAg comprise 1753, 2349 and 2265 spectral pairs, respectively.Both the mean and the maximum SDNR are slightly greaterfor the higher Z filter materials (rhodium and Ag) than those ofaluminium. This can be attributed to the fact that the rhodiumand Ag filters are better able to position the mean energy ofthe LE spectrum immediately below the k-edge of Ag contrastmaterial.
The effect of the LE dose fraction on the SDNR is illustrated asa box plot in Figure 5 using the same convention as Figure 4.Over the range plotted, the SDNR decreases with increasing doseto the LE image. Although the drop in SDNR is gradual whenthe dose fraction is between 30% and 50%, the decrease is more
Figure 2. Surface plot of W as a function of the mean energy of
the low-energy (LE) and high-energy (HE) spectra. The fitted
surface is shown alone for better visibility. W is greatest when
the two spectra are closest together and the least when the
spectra are the furthest apart.
Figure 3. The effect of breast thickness on W. In this example,
a 46-kV high-energy beam with copper filtration was paired
with a 26-kV low-energy (LE) beam with rhodium filtration at
a LE dose fraction of 40%. W increases as the breast thickness
increases owing to beam hardening.
Full paper: Silver as contrast agent for dual-energy X-ray breast imaging BJR
5 of 13 birpublications.org/bjr Br J Radiol;87:20140081
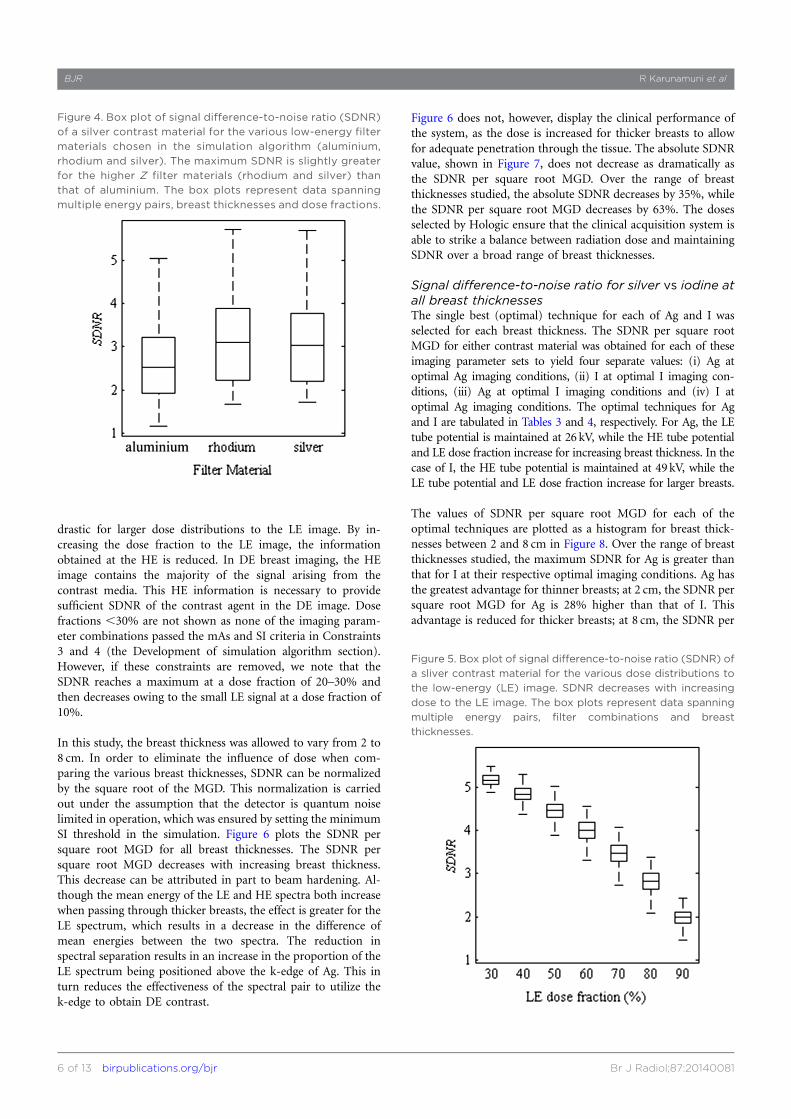
drastic for larger dose distributions to the LE image. By in-creasing the dose fraction to the LE image, the informationobtained at the HE is reduced. In DE breast imaging, the HEimage contains the majority of the signal arising from thecontrast media. This HE information is necessary to providesufficient SDNR of the contrast agent in the DE image. Dosefractions ,30% are not shown as none of the imaging param-eter combinations passed the mAs and SI criteria in Constraints3 and 4 (the Development of simulation algorithm section).However, if these constraints are removed, we note that theSDNR reaches a maximum at a dose fraction of 20–30% andthen decreases owing to the small LE signal at a dose fraction of10%.
In this study, the breast thickness was allowed to vary from 2 to8 cm. In order to eliminate the influence of dose when com-paring the various breast thicknesses, SDNR can be normalizedby the square root of the MGD. This normalization is carriedout under the assumption that the detector is quantum noiselimited in operation, which was ensured by setting the minimumSI threshold in the simulation. Figure 6 plots the SDNR persquare root MGD for all breast thicknesses. The SDNR persquare root MGD decreases with increasing breast thickness.This decrease can be attributed in part to beam hardening. Al-though the mean energy of the LE and HE spectra both increasewhen passing through thicker breasts, the effect is greater for theLE spectrum, which results in a decrease in the difference ofmean energies between the two spectra. The reduction inspectral separation results in an increase in the proportion of theLE spectrum being positioned above the k-edge of Ag. This inturn reduces the effectiveness of the spectral pair to utilize thek-edge to obtain DE contrast.
Figure 6 does not, however, display the clinical performance ofthe system, as the dose is increased for thicker breasts to allowfor adequate penetration through the tissue. The absolute SDNRvalue, shown in Figure 7, does not decrease as dramatically asthe SDNR per square root MGD. Over the range of breastthicknesses studied, the absolute SDNR decreases by 35%, whilethe SDNR per square root MGD decreases by 63%. The dosesselected by Hologic ensure that the clinical acquisition system isable to strike a balance between radiation dose and maintainingSDNR over a broad range of breast thicknesses.
Signal difference-to-noise ratio for silver vs iodine atall breast thicknessesThe single best (optimal) technique for each of Ag and I wasselected for each breast thickness. The SDNR per square rootMGD for either contrast material was obtained for each of theseimaging parameter sets to yield four separate values: (i) Ag atoptimal Ag imaging conditions, (ii) I at optimal I imaging con-ditions, (iii) Ag at optimal I imaging conditions and (iv) I atoptimal Ag imaging conditions. The optimal techniques for Agand I are tabulated in Tables 3 and 4, respectively. For Ag, the LEtube potential is maintained at 26 kV, while the HE tube potentialand LE dose fraction increase for increasing breast thickness. In thecase of I, the HE tube potential is maintained at 49kV, while theLE tube potential and LE dose fraction increase for larger breasts.
The values of SDNR per square root MGD for each of theoptimal techniques are plotted as a histogram for breast thick-nesses between 2 and 8 cm in Figure 8. Over the range of breastthicknesses studied, the maximum SDNR for Ag is greater thanthat for I at their respective optimal imaging conditions. Ag hasthe greatest advantage for thinner breasts; at 2 cm, the SDNR persquare root MGD for Ag is 28% higher than that of I. Thisadvantage is reduced for thicker breasts; at 8 cm, the SDNR per
Figure 4. Box plot of signal difference-to-noise ratio (SDNR)
of a silver contrast material for the various low-energy filter
materials chosen in the simulation algorithm (aluminium,
rhodium and silver). The maximum SDNR is slightly greater
for the higher Z filter materials (rhodium and silver) than
that of aluminium. The box plots represent data spanning
multiple energy pairs, breast thicknesses and dose fractions.
Figure 5. Box plot of signal difference-to-noise ratio (SDNR) of
a sliver contrast material for the various dose distributions to
the low-energy (LE) image. SDNR decreases with increasing
dose to the LE image. The box plots represent data spanning
multiple energy pairs, filter combinations and breast
thicknesses.
BJR R Karunamuni et al
6 of 13 birpublications.org/bjr Br J Radiol;87:20140081

square root MGD for Ag is only 3% higher than that of I. This isdue in part to the fact that the HE tube potential must beincreased with increasing breast thickness to ensure that a suf-ficient number of X-rays pass through the breast and arerecorded by the detector. Increasing the HE tube potentialresults in the mean energy of the spectrum being located furtheraway from the k-edge of Ag, which in turn decreases the SDNR.This effect is not as prominent with I owing to its higher k-edge,and the optimal HE spectra was the maximum tube potentialavailable on the Hologic system.
Interestingly, the SDNR per square root MGD for Ag at theoptimal imaging conditions for I is consistently greater than theoptimal SDNR for I using the same imaging conditions. Thus,despite the fact that the clinical system under study was ex-plicitly designed for iodinated contrast agents, our results sug-gest that Ag performs better as a contrast agent than I for everythickness from 2 to 8 cm even when using the imaging param-eters that are optimal for I. Thus, a Ag contrast agent should bedirectly translatable to the clinic without any modification of theexisting image acquisition systems or protocols.
Validating the simulation algorithmThe simulation was validated by testing in physical phantomsusing the 10 spectral pairs tabulated in Table 2. These spectralpairs encompass a range of LE and HE tube potential, filtermaterial and dose fraction. They do not represent optimal im-aging conditions and were specifically chosen to provide a suf-ficiently, broad distribution of W and SDNR values with whichto validate the simulation. The values of W and SDNR for Ag ateach of the spectral pairs were obtained from the simulation.The spectral pairs were then used along with the method de-scribed in the Validating the simulation algorithm section toobtain experimental values of W and SDNR.
The simulated and experimentally obtained values of W areplotted parametrically in Figure 9. The data were fit to a linearregression (shown as a dashed line) with a Pearson correlationcoefficient of 0.94. The slope of the fit is 1.02, while they-intercept is 0.10. Similarly, the experimentally obtained val-ues of SDNR using the contrast-embedded step phantom arecompared with those obtained from the simulation algorithmin Figure 10. A Pearson correlation coefficient of 0.95 wasobtained, and the slope and y-intercept of the linear fit are 0.18and 7.83. The high Pearson correlation coefficients obtainedfor both W and SDNR indicate that the simulation algorithm isable to correctly predict the trends in SI observed in the pro-totype Hologic Dimensions CEDE system. The algorithm doesnot, however, perfectly predict the pixel values and will need toinclude additional processes such as detector gain in a futurerefinement.
Comparing signal difference-to-noise ratio betweensilver and iodineSix optimal spectral pairs were identified to compare the SDNRbetween Ag and I contrast agents. The optimal imaging tech-nique parameters for either contrast material were insensitive ofthe LE filter. The optimal technique for Ag is a 45-kV HEspectrum with a 26-kV LE spectrum at a dose fraction of 30%.While, that for I is a 49-kV HE spectrum and a 26-kV LEspectrum at a dose fraction of 30%.
SDNR was calculated using the method in described in theCalculation of W and signal difference-to-noise ratio section forequal volumetric concentrations of Ag and I using spectral pairsthat comprised the optimal Ag and I imaging conditions for eachof the three LE filter materials (aluminium, rhodium and Ag).An example of the LE, HE and DE images of the contrast-embedded step phantom obtained for one spectral pair are
Figure 6. Box plot of signal difference-to-noise ratio (SDNR)
per square root mean glandular dose (MGD) of a silver contrast
material for the breast thicknesses from 2 to 8cm. Across the
range of breast thickness values, the SDNR decreases by 67%.
The box plots represent data spanning multiple energy pairs,
filter combinations and dose fractions.
Figure 7. Box plot of signal difference-to-noise ratio (SDNR) of
a silver contrast material for the breast thicknesses from 2 to
8cm. As the thickness increases from 2 to 8cm, the SDNR
decreases by 36%. The box plots represent data spanning
multiple energy pairs, filter combinations and dose fractions.
Full paper: Silver as contrast agent for dual-energy X-ray breast imaging BJR
7 of 13 birpublications.org/bjr Br J Radiol;87:20140081

shown in Figure 11. The contrast material is observed within theplastic tubing as a region of low-intensity pixel values. The valuesof SDNR obtained for each contrast material are plotted inFigure 12. When imaged at their respective optimal conditions, Agoutperforms I regardless of the filter material chosen. On average,the SDNR for Ag is 43% higher than that of I. The superiority ofAg is such that the lowest SDNR for Ag is still 34% higher thanthe highest SDNR for I. The superior SDNR of Ag can be at-tributed to the lower k-edge, which means that the HE spectrumis better positioned for optimal DE subtraction. A theoreticalstudy using monoenergetic models20 demonstrated that DEcontrast is very sensitive to the placement of the HE value; thecontrast decreases rapidly as the HE value is moved further fromthe k-edge of the contrast material. However, it is difficult toobtain HE spectra with mean energies in the range of 34–38keV(above the k-edge of I) using a mammographic X-ray imagingsystem. In order to achieve suitable HE spectra, the imagingsystem would require tube potential values in excess of 50 kV withthicker filtration than is currently used in mammography.
Ag also performs better than I when imaging at the optimalconditions for I. For example, using the rhodium filter, theSDNR for Ag is 40% higher than that of I even though both wereimaged at the optimal conditions for the latter. The maximum
SDNR for I occurs at a HE tube potential value of 49. This isneeded to ensure that a large portion of the spectrum is abovethe k-edge of I. However, even at the maximum tube potentialvalue, a substantial portion of the HE spectrum is below thek-edge of I, and thus not contributing to the SDNR. When usinga 49-kV HE spectrum with the copper filtration available on theHologic CEDE system, 99% of the spectrum (in terms of thenumber of photons) is above the k-edge of Ag, whereas only78% is above the k-edge of I. The remaining 22% of the spec-trum that lies below the k-edge of I cannot contribute to theSDNR, providing Ag with an advantage, even at the best possibleconditions for I. This is graphically illustrated in Figure 13,where the optimal LE and HE spectra for a 5-cm thick breastare overlaid with the mass attenuation coefficients for Ag and I.
DISCUSSIONOur previous monoenergetic study20 identified several potentialcontrast materials as alternatives to I in CEDE breast imaging.That study predicted that materials with Z from 42 to 52 wouldprovide the maximum contrast in DE imaging while still allo-cating a sufficient dose fraction to the LE image for clinicallyacceptable anatomical images. Upon further consideration, Ag(Z5 47) was chosen owing to the abundant availability of lit-erature on the development of Ag nanoparticles, as well as the
Table 3. Optimal combinations of parameters to maximize signal difference-to-noise ratio of silver at breast thicknesses from 2 to8cm
Breast thickness (cm) HE (kV) LE (kV) LE filter LE dose fraction (%)
2 44 26 Rhodium 30
3 45 26 Rhodium 30
4 49 26 Rhodium 30
5 49 26 Rhodium 40
6 49 26 Rhodium 60
7 47 26 Rhodium 70
8 49 26 Silver 70
HE, high energy; LE, low energy.The LE tube potential is maintained at 26 kV, while the HE tube potential and LE dose fraction is increased as the breast thickness increases.
Table 4. The optimal imaging conditions to maximize signal difference-to-noise ratio for iodine identified by the simulationalgorithm
Breast thickness (cm) HE (kV) LE (kV) LE filter LE dose fraction (%)
2 49 26 Rhodium 30 (50)
3 49 26 Rhodium 30 (50)
4 49 26 (28) Rhodium 30 (50)
5 49 26 (29) Rhodium 30 (50)
6 49 27 (31) Rhodium 50
7 49 28 (30) Rhodium (silver) 60
8 49 29 (32) Rhodium (silver) 60 (70)
HE, high energy; LE, low energy.Where different, the values used by Hologic® (Bedford, MA) are presented in parentheses.
BJR R Karunamuni et al
8 of 13 birpublications.org/bjr Br J Radiol;87:20140081

prevalent use of Ag filters in CEDE imaging. The former isimportant as it provides a solid base from which to developa prototype contrast agent, whereas the latter implies that the LEspectrum can be filtered to provide a mean energy as close to thek-edge of Ag as possible.
The purpose of this study was to test the applicability of a Agcontrast agent, predicted by the theoretical model, in a com-mercially available DE breast imaging system. This is an im-portant predicate step before significant effort is expended ondeveloping novel contrast agents. The model is constrained inthat it does not attempt to search all the possible techniqueparameters (such as filter materials) that could be used but isrestricted to those that are available on the system being studied.This was performed to determine whether a Ag agent couldreplace an iodinated agent using an existing CEDE imagingsystem that was explicitly designed for iodine contrast imaging.The system under investigation in this work is the commercialHologic Dimensions CEDE X-ray acquisition system. A poly-energetic simulation algorithm was developed to model the SIand noise of the clinical system. The simulation algorithm wasthen used to provide insight into the influence of imagingparameters on SDNR as well as identify techniques with whichto compare the SDNR of Ag and I, objectively.
The DE weighting factor,W, is plotted in Figure 2 for the variouscombinations of mean energies available on the prototypeHologic system. The polyenergetic model of W follows the sametrend as the monoenergetic model;Wdecreases as the separationbetween the LE and HE values increases. It is important to notethat, similar to the monoenergetic calculation, W does notchange with the choice of contrast agent and is only dependenton the linear attenuation coefficient of adipose and glandulartissue. However, secondary effects such as scatter will introducea thickness dependency on the overall attenuation of tissue, andconsequently on the value ofW. These effects are not included inthe current simulation algorithm and may need to be taken intoconsideration for further refinement.
The simulation algorithm was also used to analyse the influence ofthe technique parameters on the SDNR of a potential Ag contrastagent. The choice of filter material was not shown to exert asimportant a role as initially thought. Although the k-edge filterspresent in the system (Ag and rhodium) exhibited slightly highermean and maximum values of SDNR than the non-k-edge filter(aluminium), the difference between the two groups was minimal.The thicknesses of the silver and rhodium filters used on theHologic machine are not sufficient to completely remove X-rayphotons above their respective k-edges. However, excessively thickhigh Z filter materials would require infeasibly large values of mAsto allow the spectra to penetrate the filter with sufficient fluence.However, given that the optimal LE spectra for Ag were limited to26kV, it may be possible to consider thicker filter thicknesses whilecompensating with high LE tube potential values.
Figure 8. Comparison of simulated signal difference-to-noise ratio (SDNR) per square root mean glandular dose (MGD) between
silver and iodine at breast thicknesses between 2 and 8cm. Silver performs better than iodine at their respective optimal conditions
for every thickness studied. Moreover, silver performed better than iodine when imaged using the optimal conditions for iodine.
Figure 9. The experimentally obtained values of W are highly
correlated with the simulated values. A Pearson correlation
coefficient of 0.89 was calculated for the two data sets. Error
bars indicate standard deviation.
Full paper: Silver as contrast agent for dual-energy X-ray breast imaging BJR
9 of 13 birpublications.org/bjr Br J Radiol;87:20140081

The major influences on the SDNR of Ag were found to bethe LE dose fraction and the breast thickness. An increase in thevalues of either of these parameters resulted in a decrease in thevalue of SDNR. By allocating a larger dose to the LE image, thetechnique is unable to utilize the contrast information that ispresent in the HE image and therefore results in a reduction inSDNR. Thus, while it is common practice to equally distributethe dose between the LE and HE images, our results suggest thatthe information contained in the HE image is more important tothe SDNR of the contrast agent. However, additional practicalconsiderations such as the quality of the anatomical image fordiagnostic purposes must be taken into consideration beforeaccepting the use of a lower dose fraction to the LE image.Therefore, a compromise must be struck between obtaininga good quality anatomical image to aid in the diagnosis, and thevisualization and characterization of CE anatomical structures.
As previously mentioned, an increase in the breast thickness alsoresults in a decrease in the value of SDNR. This is due to theincrease in the mean energy of the HE spectrum as a result ofbeam hardening and the tube potential value being increased topenetrate through thicker tissue. As the HE spectrum is posi-tioned further away from the k-edge of Ag, the ability of the DEtechnique to fully utilize the k-edge for contrast decreases.However, this effect can be reduced by increasing the allocateddose for thicker breasts—a practice that is clinically imple-mented. By following the dose scheme utilized by Hologic fortheir CEDE examinations, it is possible to maintain the SDNR ofa Ag contrast over a substantial range of breast thicknesses, withonly a slight degradation observed for thicker breasts (Figure 7).
The simulation algorithm identified the techniques that maxi-mized the SDNR for Ag and I contrast agents over the range ofbreast thicknesses studied (Tables 3 and 4, respectively). For Ag,the optimal HE tube potential value is increased from 44 to49 kV as breast thickness increases, while the LE tube potential
value is maintained at 26 kV. A rhodium filter is optimal, exceptfor the largest breast thickness studied where a Ag filter is pre-ferred. The LE image, consisting of a 26-kV tungsten spectrafiltered with rhodium is a classic example of a soft-tissue ana-tomical image obtained clinically. Therefore, the LE imagewould provide excellent anatomical and spatial localization ofstructures (calcifications and lesions), whereas the DE image canbe used for quantitative analysis of contrast agent uptake. Theoptimal LE tube potential value agrees with the previous theo-retical modelling using monoenergetic simulations20 thatshowed an optimal contrast LE value of 18 keV; roughly themean energy of a 26-kV spectrum.
Conversely, the optimal HE tube potential for I is maintained at49, while the LE tube potential value is increased from 26 to 29as breast thickness increases. A rhodium filter is used through-out. The higher k-edge of I requires the HE tube potential valueto be set to the maximum in an effort to ensure that the majorityof the HE spectrum is above the k-edge of I. As a result, the LEtube potential value is forced to increase for thicker breasts.While this increase is not substantial, the LE anatomical imageof thicker breasts may not provide the same level of detail astheir thinner counterparts because the difference in attenuationbetween adipose and glandular tissue is reduced for higher LEtube potential values. The optimal technique parameters for I, asdetermined by the model, also presents an interesting oppor-tunity to evaluate the technique parameters currently used byHologic. By and large, the optimal simulated techniqueparameters agreed with those used clinically. There are, however,several instances where the techniques differ. The minimum LEdose fraction used by Hologic is 50%, while that used by the
Figure 10. The experimentally obtained values of signal
difference-to-noise ratio (SDNR) correlate well with the
simulated values. A Pearson correlation coefficient of 0.93
was obtained between the two data sets.
Figure 11. Example of low-energy (LE), high-energy (HE) and
dual-energy (DE) images of the contrast-embedded step
phantom with silver contrast material. The DE subtraction
method removes the signal variation that exists in the
background steps while maintaining the signal intensity within
the contrast material.
BJR R Karunamuni et al
10 of 13 birpublications.org/bjr Br J Radiol;87:20140081

model is 30%. We presume that Hologic set this minimum dosefraction primarily to ensure a good quality LE anatomical image.In addition, the LE tube potential is increased faster as a func-tion of breast thickness on the clinical system by Hologic thanpredicted by the model. These differences are minimal and thelarge level of concordance between the two techniques help tofurther validate the results of our algorithm.
The SDNR at each of the optimal techniques for Ag and I can becompared by examination of the simulation and experimentalresults (Figures 8 and 12, respectively). The simulation can beused to compare the two contrast agents over the range of breastthicknesses; a singular thickness was used for the experimentalvalidation. Both methods support the same two conclusions:(1) If the established technique parameters that are currently
utilized in the clinic are considered, Ag provides a highervalue of SDNR than I. This suggests that Ag is better suitedas a DE imaging agent than I in the mammographic energyrange. A biologically stable Ag imaging agent could bedirectly translated from development to clinical implemen-tation without the need for modification or redesign ofimage acquisition systems.
(2) If the technique parameters are slightly modified to reflect thelower k-edge of Ag, the difference in SDNR between the twomaterialswould be further increased. Thesemodificationswouldconsist primarily lower HE and LE tube potential values. Thelower LE tube potential value may serve to boost the diagnosticapplication of the CEDE technique further by providing a goodquality anatomical image with excellent soft-tissue contrast.
There are, however, several improvements that can be made tothe simulation algorithm. For example, the algorithm does notincorporate the effects of scatter. The energy dependence ofCompton and coherent scattering may have implications on theimage quality when using a Ag or I imaging agent. The detri-mental effect of scatter should be greater for I because of thehigher LE and HE tube potential values used. The greater effectof scatter will result in a reduced SDNR for I compared with Agthan currently predicted. The algorithm will need to be modifiedwith a Monte Carlo-type X-ray interaction simulation to
adequately test this hypothesis. In addition, the SI generated bythe model is not the same as the pixel value obtained usinga particular imaging technique. This can be remedied by in-corporating into the simulation the gain factors involved in theconversion of X-ray photons attenuated by the detector toa digital value. Once the pixel value is predicted exactly, thesimulation algorithm could be used in assisting the system de-sign process by identifying optimal filter materials and thick-nesses for imaging either a Ag or I contrast agent.
CONCLUSIONThis work explores the use of a Ag imaging agent as an alter-native to I in CEDE X-ray breast imaging. Iodinated agents areused extensively in X-ray projection imaging and display ex-cellent biocompatibility and stability within the body. However,the lower energies available to clinical DE X-ray breast imagingthan those of other organs in the body suggests that an alter-native material may be better suited. Previously conductedtheoretical analysis demonstrated that materials with atomicnumbers from 42 to 52 should be explored as potential candi-dates. From these materials, Ag was chosen for further in-vestigation. The prominence of Ag filters in breast X-ray imagingdevices and Ag nanoparticles in consumer products suggestedthat a Ag-based imaging agent might have practical applicationin CEDE X-ray breast imaging.
An algorithm was developed in MATLAB to simulate the imageacquisition of the Hologic Dimensions CEDE system. TheSDNR of Ag was compared with that of I for imaging param-eters that comprised the optimal conditions for either material.Not only does Ag perform better than I when imaged at theirrespective optimal conditions but also Ag is able to providegreater SDNR than I when imaged with protocols that are op-timal for I. This means that a Ag contrast agent could betranslated to the clinic without modification of machine orprotocol. Work into developing a biologically stable Ag nano-particle agent, although outside of the scope of this manuscript,is warranted and preliminary data show promise.39
Figure 12. Comparison of experimental values of signal
difference-to-noise ratio (SDNR) between silver (Ag) and
iodine (I) for the optimal imaging parameters at each low-
energy filter material. Ag performs better that I at their
respective optimal imaging conditions, as well as the optimal
conditions for I. The results are for a 3-cm step phantom.
Figure 13. Overlay of the optimal low-energy (LE) and high-
energy (HE) spectral pair for a 5-cm thick breast with the mass
attenuation coefficients of silver and iodine. 99% of the HE
spectrum is above the k-edge of silver. By contrast, only 78% of
the HE spectrum is above the k-edge of iodine and thus
contributing to the signal difference-to-noise ratio.
Full paper: Silver as contrast agent for dual-energy X-ray breast imaging BJR
11 of 13 birpublications.org/bjr Br J Radiol;87:20140081

FUNDINGThis work was supported by the Department of Defense(W81XWH-09-1-0055 and W81XWH-11-1-0246) and the Na-tional Institute of Health (NIH/NBIB R21-EB013754).
ACKNOWLEDGMENTSThe authors would like to thank Cornell Williams (Hologic Inc.,Bedford, MA) for his expertise with the prototype contrast-enhanced dual-energy acquisition system.
REFERENCES
1. Jochelson MS, Dershaw DD, Sung JS,
Heerdt AS, Thornton C, Moskowitz CS,
et al. Bilateral contrast-enhanced dual-
energy digital mammography: feasibility
and comparison with conventional digital
mammography and MR imaging in women
with known breast carcinoma. Radiology
2013; 266: 743–51.
2. Froeling V, Diekmann F, Renz DM,
Fallenberg EM, Steffen IG, Diekmann S, et al.
Correlation of contrast agent kinetics be-
tween iodinated contrast-enhanced spectral
tomosynthesis and gadolinium-enhanced
MRI of breast lesions. Eur Radiol 2013; 23:
1528–36.
3. Dromain C, Thibault F, Diekmann F,
Fallenberg EM, Jong RA, Koomen M, et al.
Dual-energy contrast-enhanced digital
mammography: initial clinical results of
a multireader, multicase study. Breast Can-
cer Res 2012; 14: R94. doi: 10.1186/
bcr3210
4. Carton A-K, Ullberg C, Maidment AD.
Optimization of a dual-energy contrast-
enhanced technique for a photon-counting
digital breast tomosynthesis system: II. An
experimental validation. Med Phys 2010; 37:
5908–13.
5. Carton AK, Ullberg C, Lindman K, Acciavatti
R, Francke T, Maidment AD. Optimization of
a dual-energy contrast-enhanced technique
for a photon-counting digital breast tomo-
synthesis system: I. A theoretical model. Med
Phys 2010; 37: 5896–907.
6. Carton AK, Gavenonis SC, Currivan JA,
Conant EF, Schnall MD, Maidment AD.
Dual-energy contrast-enhanced digital breast
tomosynthesis—a feasibility study. Br J
Radiol 2010; 83: 344–50. doi: 10.1259/bjr/
80279516
7. Chen SC, Carton AK, Albert M, Conant EF,
Schnall MD, Maidment ADA. Initial clinical
experience with contrast-enhanced digital
breast tomosynthesis. Acad Radiol 2008; 14:
229–38. doi: 10.1016/j.acra.2006.10.022
8. Lewin JM, Isaacs PK, Vance V, Larke FJ. Dual-
energy contrast-enhanced digital subtraction
mammography: feasibility. Radiology 2003; 229:
261–8. doi: 10.1148/radiol.2291021276
9. MedImaging.net. Contrast-enhanced spectral
mammography offers dual-energy image
acquisition [Cited 3 September 2013.]
Available from: http://www.medimaging.
net/radiography/articles/294737841/
contrastenhanced_spectral_mammography_
offers_dualenergy_image_acquisition.html
10. Molloi S. Spectral mammography using
a photon counting detector provides a unique
method for measurements of breast density.
Amsterdam, Netherlands: Philips Healthcare;
2013.
11. Hainfeld JF, Slatkin DN, Focella TM, Smilo-
witz HM. Gold nanoparticles: a new X-ray
contrast agent. Br J Radiol 2006; 79: 248–53.
doi: 10.1259/bjr/13169882
12. Weisberg LS, Kurnik PB, Kurnik BR. Risk of
radiocontrast nephropathy in patients with
and without diabetes mellitus. Kidney Int
1994; 45: 259–65.
13. Cigarroa RG, Lange RA, Williams RH, Hillis
LD. Dosing of contrast material to prevent
contrast nephropathy in patients with renal
disease. Am J Med 1989; 86: 649–52.
14. Wang M, Thanou M. Targeting nanoparticles
to cancer. Pharmacol Res 2010; 62: 90–9. doi:
10.1016/j.phrs.2010.03.005
15. Han H, Davis ME. Single-antibody, targeted
nanoparticle delivery of camptothecin. Mol
Pharm 2013; 10: 2558–67. doi: 10.1021/
mp300702x
16. Vlashi E, Kelderhouse LE, Sturgis JE, Low PS.
Effect of folate-targeted nanoparticle size on
their rates of penetration into solid tumors.
ACS Nano 2013; 7: 8573–82. doi: 10.1021/
nn402644g
17. Fang C, Shi B, Pei YY, Hong MH, Wu J, Chen
HZ. In vivo tumor targeting of tumor
necrosis factor-alpha-loaded stealth nano-
particles: effect of MePEG molecular weight
and particle size. Eur J Pharm Sci 2006; 27:
27–36. doi: 10.1016/j.ejps.2005.08.002
18. Cheng L, Yang K, Chen Q, Liu Z. Organic
stealth nanoparticles for highly effective
in vivo near-infrared photothermal therapy of
cancer. ACS Nano 2012; 6: 5605–13. doi:
10.1021/nn301539m
19. Marra M, Salzano G, Leonetti C, Porru M,
Franco R, Zappavigna S, et al. New self-
assembly nanoparticles and stealth liposomes
for the delivery of zoledronic acid: a com-
parative study. Biotechnol Adv 2012; 30:
302–9. doi: 10.1016/j.biotechadv.2011.06.018
20. Karunamuni R, Maidment ADA. Search for
novel contrast materials in dual-energy x-ray
breast imaging using theoretical modeling of
contrast-to-noise ratio. Phys Med Biol 2014;
59: 4311–24.
21. Nabikhan A, Kandasamy K, Raj A, Alikunhi
NM. Synthesis of antimicrobial silver nano-
particles by callus and leaf extracts from
saltmarsh plant, Sesuvium portulacastrum L.
Colloids Surf B Biointerfaces 2010; 79: 488–93.
doi: 10.1016/j.colsurfb.2010.05.018
22. Vaidyanathan R, Gopalram S, Kalishwaralal
K, Deepak V, Pandian SR, Gurunathan S.
Enhanced silver nanoparticle synthesis by
optimization of nitrate reductase activity.
Colloids Surf B Biointerfaces 2010; 75: 335–41.
doi: 10.1016/j.colsurfb.2009.09.006
23. Silvert P, Duvauchelle N, Vijayakrishnan V,
Elhsissen KT. Preparation of colloidal silver
dispersions by the polyol process. J Mater
Chem 1996; 6: 573–7.
24. Wiley B, Herricks T, Sun Y, Xia Y. Polyol
synthesis of silver nanoparticles: use of
chloride and oxygen to promote the forma-
tion of single-crystal, truncated cubes and
tetrahedrons. Nano Lett 2004; 4: 1733–9.
25. Liu J, Hurt RH. Ion release kinetics and
particle persistence in aqueous nano-silver
colloids. Environ Sci Technol 2010; 44:
2169–75. doi: 10.1021/es9035557
26. Verma VC, Kharwar RN, Gange AC. Bio-
synthesis of antimicrobial silver nanoparticles
by the endophytic fungus Aspergillus clavatus.
Nanomedicine (Lond) 2010; 5: 33–40. doi:
10.2217/nnm.09.77
27. Musarrat J, Dwivedi S, Singh BR, Al-
Khedhairy AA, Azam A, Naqvi A. Production
of antimicrobial silver nanoparticles in
water extracts of the fungus Amylomyces
rouxii strain KSU-09. Bioresour Technol 2010;
101: 8772–6. doi: 10.1016/j.
biortech.2010.06.065
28. Mehra S, Christoforo MG, Peumans P, Salleo
A. Solution processed zinc oxide
nanopyramid/silver nanowire transparent
network films with highly tunable light
scattering properties. Nanoscale 2013; 5:
4400–3.
29. Kahraman M, Sur I, Mustafa C. Label-free
detection of proteins from self-assembled
protein-silver nanoparticle structures using
BJR R Karunamuni et al
12 of 13 birpublications.org/bjr Br J Radiol;87:20140081
surface-enhanced Raman scattering. Anal Chem
2010; 82: 7596–602. doi: 10.1021/ac101720s
30. Chen LQ, Xiao SJ, Peng L, Wu T, Ling J, Li
YF, et al. Aptamer-based silver nanoparticles
used for intracellular protein imaging and
single nanoparticle spectral analysis. J Phys
Chem B 2010; 114: 3655–9. doi: 10.1021/
jp9104618
31. Kumar A, Vemula PK, Ajayan PM, John G.
Silver-nanoparticle-embedded antimicrobial
paints based on vegetable oil. Nat Mater
2008; 7: 236–41. doi: 10.1038/nmat2099
32. McFarland AD, Van Duyne RP. Single silver
nanoparticles as real-time optical sensors with
zeptomole sensitivity.Nano Lett 2003; 3: 1057–62.
33. Dance DR, Skinner CL, Young KC, Beckett
JR, Kotre CJ. Additional factors for the
estimation of mean glandular breast dose
using the UK mammography dosimetry
protocol. Phys Med Biol 2000; 45: 3225–40.
34. Dance DR. Monte Carlo calculation of
conversion factors for the estimation of mean
glandular breast dose. Phys Med Biol 1990;
35: 1211–19.
35. Boone JM, Fewell TR, Jennings RJ. Molyb-
denum, rhodium, and tungsten anode spec-
tral models using interpolating polynomials
with application to mammography. Med Phys
1997; 24: 1863–74.
36. Marshall NW, Monnin P, Bosmans H,
Bochud FO, Verdun FR. Image quality
assessment in digital mammography: part I.
Technical characterization of the systems.
Phys Med Biol 2011; 56: 4201–20.
37. Brettle DS, Cowen AR. Dual-energy digital
mammography utilizing stimulated phos-
phor computed radiography. Phys Med Biol
1994; 39: 1989–2004.
38. Bliznakova K, Kolitsi Z, Pallikarakis N.
Dual-energy mammography: simulation
studies. Phys Med Biol 2006; 51:
4497–515. doi: 10.1088/0031-9155/51/
18/004
39. Karunamuni R, Zaki AA, Popov AV,
Delikatny EJ, Gavenonis S, Tsourkas A, et al.
An examination of silver as a radiographic
contrast agent in dual-energy breast X-ray
imaging. In: IWDM 12 Proceedings of the 11th
International Conference on Breast Imaging.
Berlin, Germany: Springer-Verlag. pp.
418–25.
Full paper: Silver as contrast agent for dual-energy X-ray breast imaging BJR
13 of 13 birpublications.org/bjr Br J Radiol;87:20140081