exploring investor attention in financial models
TRANSCRIPT

Exploring Investor Attention in Financial Models
The Honors Program Senior Capstone Project
Student’s Name: Anna Rodier Faculty Sponsor: Rick Smith
Editorial Reviewer: A. Can Inci Student Editorial Reviewer: Joel Moffit
May 2017

Table of Contents Abstract………………………………………………………………………………………...1 Introduction…………………………………………………………………………………….2 Literature Review ……………………………………………………………………………...5 Pricing Models ………………………………………………………………………...6 Individual Investors ……………………………………………………………………7 Implications…………………………………………………………………………….9 Investment Advice …………………………………………………………………...10 Hypothesis…………………………………………………………………………………….11 Method………………………………………………………………………………………..11 Results………………………………………………………………………………………...14 Observation 1 ………………………………………………………………………...15
Observation 2 ………………………………………………………………………...16 Observation 3 ………………………………………………………………………...19
Limitations and Future Research……………………………………………………………..19 Conclusion and Discussion …………………………………………………………………..21 Appendices……………………………………………………………………………………23 References…………………………………………………………………………………….27

Exploring Investor Attention in Financial Models Senior Capstone Project for Anna Rodier
- 1 -
ABSTRACT The purpose of this study is to investigate whether stock prices are influenced by investor
attention and how this, in turn, can be used to better advise the financial decisions of the
everyday investor. Using weekly adjusted close data, weekly traded volumes, and weekly
company searches using Google Trends, I tested my hypothesis that including the frequency
of company searches, found through consumers using Google, in financial models will help
better predict stock returns. Using S&P 500 company data from February 2012 to February
2017, frequency is a better predictor of price in comparison to trading volumes. But, to
maximize predictability, both frequency and volume should be used to predict price. Further
investigation revealed that the Health Care and Energy sectors tend to have the strongest
correlation between frequency and volume, compared to the Consumer Staples and Utilities
sectors, which tend to attract individual investors.

Exploring Investor Attention in Financial Models Senior Capstone Project for Anna Rodier
- 2 -
INTRODUCTION
Since early civilization, humans have used trade and barter systems. Centuries later,
the stock market was installed and Wall Street became a word in everyday vernacular. Since
the modern day stock market’s creation, financial professionals have been trying to find
models to accurately predict the price of stocks. Several models are accepted today, including
the Capital Asset Pricing Model, the Fama-French three-factor model, and the Carhart four-
factor model. These models include factors such as market risk, size, value, and momentum
factors, all in an effort to accurately predict price. Even with these strong, widely accepted
price predicting models, there is still variation between stocks’ predicted price and real price.
Elements influencing the difference between predicted and real price have been studied, but
not identified explicitly. Through this study, I hope to find additional factors to help better
eliminate the variation in predicted price.
A major issue when predicting price is the constant volatility of the stock market.
Stock exchanges, such as the New York Stock Exchange (NYSE) and the National
Association of Securities Dealers Automated Quotations (NASDAQ), are centers that host
billions of trades each month. Options to buy or sell, in short or long positions, create many
choices for investors. Markets are volatile by nature and reflect business changes, economic
expansion or contraction, and shifts in perceived risks. When entering into the stock market,
the investor must determine and accept the amount of risk they are willing to take when
purchasing shares of stock. Changes in a business, such as department shifts or mergers and
acquisitions, can cause huge discrepancies in price. Sharp rises or drops in price are central to
market volatility. Additionally, the U.S. economy is unpredictable. It is dependent on the
world economy and can either expand or contract due to world finances. Economic expansion

Exploring Investor Attention in Financial Models Senior Capstone Project for Anna Rodier
- 3 -
or contraction causes market volatility. Risk could fluctuate due to impending business
success or failures, but is unavoidable. When determining a company’s price, risk is taken
into account, but its effects will never be eliminated from price. Therefore, risk causes market
volatility. While volatility is unavoidable, finance professionals hope to eliminate some of the
variation and better predict stock prices through more accurate models.
The stock market is open to any willing individual interested in investing. Investors
have different approaches, such as active or passive strategies, is related to the time
commitment each wants to devote to investing. Strategies and assets are tailored towards the
varying types of investors and their wide range of commitment levels. With different types of
strategies, investors, and commitments, the stock market can be quite chaotic and, at times,
even scary.
Investors participate in the market for different reasons. Some simply look to speculate
and make a quick dollar, and some invest for more weighty reasons such as funding their
retirement. When analysts think about the reasons why someone is investing, they also
consider what age groups are participating in the stock market. The baby boomers are now
bordering retirement age, hopefully, influencing them to invest more conservatively.
Conversely, millennials who are now entering the market have more leeway in holding riskier
stocks because they have more time to recover from any adverse investing results. The
divergent needs of baby boomers and millennials lead them to be interested in vastly different
stocks, and this can contribute to stock market volatility.
Financial intermediaries have grown in popularity over the past few decades. With
more Americans busier than ever but still interested in the stock market, financial advisors
and stock brokers are necessary experts for this complicated market. In a survey conducted

Exploring Investor Attention in Financial Models Senior Capstone Project for Anna Rodier
- 4 -
by Certified Financial Planners across America, Americans agreed “with more complexity
and uncertainty in today’s economy… they need better financial guidance” (News & Events).
These institutions are considerable in size, owning about 85 percent of stocks in the market,
and hold large portfolios that can help eliminate some volatility. While they do own a larger
percentage than individuals, these institutions are acting on behalf of their clients and
performing trades in their favor. Institutions, however, work specifically to find profitable
returns; they have the time and resources to research companies extensively and build strong
portfolios. For the purpose of this study, I will be focusing on individual investors, who own
about 15 percent of the market. These individuals have to make a decision on what to
purchase in order to build a strong portfolio. These individuals do not have the resources an
institution would readily have, and, therefore, are seen to be at a disadvantage in this study.
With institutional and individual investors trading in the same market, volatility can
easily occur due to the resources each have. There are different methods investors use when
gathering information before they buy or sell shares of stock. Active investors might track a
company’s every move, from product and price changes, to department shifts, to mergers and
acquisitions. Passive investors tend to put their money in safer stocks with a guaranteed, but
lower, return. Investors that want to make a quick profit will focus on truly volatile stocks,
while investors focusing on retirement accounts will have safer investments.
Any type of news reported on, or by, a company is reflected in its stock price, but
delays in processing information can occur. In a study completed by Vlastakis and Markellos
in 2009, the two researchers claimed “the internet has nowadays revolutionized the
production, intermediation, dissemination and consumption of information in the financial
industry.” Various studies conducted by financial analysts have shown that there often are

Exploring Investor Attention in Financial Models Senior Capstone Project for Anna Rodier
- 5 -
informed investors and uninformed investors. Informed investors make decisions based on the
information they have gathered. Uninformed investors tend to follow the market, but they do
not realize the underlying reasons why. When uninformed investors try to fix their actions
afterwards, they tend to cause volatility in the markets. The excess or lack of information
investors have can heavily influence the volatility in the stock market.
The combination of stock market volatility, different types and strategies of investors,
and the dissemination of information continually cause instability in stock market returns.
Financial models have been tested and widely accepted to better predict prices. However, with
uncertainty in the markets and a variety of investors, there is always variation between
predicted and real prices. The purpose of this study is to derive new factors to help provide
further explanation for variances in predicted prices.
LITERATURE REVIEW
In order to complete my testing and fully develop a hypothesis that would enable more
accurate prediction of returns, I had to invest myself in literature concerning the topic. By
looking at widely accepted pricing models, previous studies completed by financial analysts,
and surveys completed by certified associations across America, I was able to develop a more
refined viewpoint as to what could be missing from pricing models. Currently, there is no
way to account for the popularity of a stock due to news announcements. While the efficient
market hypothesis states that news is automatically reflected in the price and that beating the
market is impossible, volatility still occurs due to gaps in information and arbitrage
opportunities.

Exploring Investor Attention in Financial Models Senior Capstone Project for Anna Rodier
- 6 -
With a wavering economy and dynamic investors involved in the market, there seem
to be many factors driving the unexplained gap between predicted and real returns.
Throughout my literature review, I found four main areas that cause concern when pricing the
returns of stocks. These four areas were pricing models, individual investors, implications in
the industry and in information about companies in the market, and differing investment
advice.
Pricing Models
In 2015, researchers John Goddard, Arben Kita, and Qingwei Wang observed the
amount of time and effort individual investors required to research their investment options
and make their portfolio investment decisions based on the attention a firm received in the
news (79). They researched foreign exchange markets and found a positive, significant
relationship between investor attention and volatility. Investors’ attention changes with the
increases and decreases in trading volume for a particular stock and affects the risk-aversion
of some investors (95). For example, an investor will pay more attention to a stock if there
are many trades occurring around a news outbreak. Some investors may be caused to stray
away from the risk, and others to be drawn towards the risk. Regardless, search volume
indices will increase during news and earnings announcements, which means investors are
heavily researching any released public information. Goddard, Kita, and Wang claim
“Standard asset pricing models have difficulty in explaining some stylized empirical facts on
price dynamics that are unrelated to fundamentals.” Another researcher, Tijmen Kampman,

Exploring Investor Attention in Financial Models Senior Capstone Project for Anna Rodier
- 7 -
states that finance professions have been studying financial models for years in hopes of
better predicting future returns and valuing investments (4).
An important theory to include and analyze in this study is the efficient market hypothesis,
which states that prices are adjusted instantaneously as news is released about a company.
The EMH states that it is impossible to beat the market because the price reflects all current
and known information about a stock. The limitation of the EMH is that news is
unpredictable; the U.S. and global economies can change suddenly or businesses can merge.
Each event causes unknown shifts in our market and volatility in stock prices. Financial
models today do not account for these nuances, and the uncertainty that is unavoidable.
Individual Investors
As stated before, the purpose of this study is to identify the different types of investors
and their strategies in the market, and then to watch how they could consequently affect
market volatility through their trades. According to Gallup, a research-based consulting
company, fifty-five percent of Americans participate in the stock market. While this
percentage fluctuates, it has been on the lower end in the past few decades due to other
investment options, such as ETFs, bonds, and mutual funds. A study conducted by Investment
Trends U.S. concluded that seventy-five percent of millennials believe the economy is
strengthening and are more apt to optimistically invest in the stock market (Investment
Trends).
A few researchers have taken new approaches by looking at investor attention theory.
In 2007, Brad M. Barber and Terrance Odean explored the individual investor’s buying

Exploring Investor Attention in Financial Models Senior Capstone Project for Anna Rodier
- 8 -
decisions and discovered that individual investors tend to buy “attention-grabbing” stocks
(785). They argued there is only so much information an individual investor is willing to
digest, and there are only few common stocks in an individual investor’s portfolio. Barber
and Odean believe investors use the “news, unusual trading volume, and extreme returns” as
information to buy or sell their stocks (787). Results of this study concluded that “attention-
based purchases by many investors could temporarily inflate stock’s price,” and that investor
attention is important when predicting the returns of stocks (788).
Another study conducted by researchers Henrik Cronqvist and Stephan Siegel concluded
that individuals exhibit investment biases because their environments, experiences, and events
shape their investment choices. Cronqvist and Siegel explained this occurrence stating:
In a hunter-gatherer society, it may generally have been harmful for humans to explore
or invest in the unfamiliar, which may explain a strong preference for investing in the
familiar, even today.
In 2014, Xunan Feng and Na Hu studied how individual investor behavior is influenced
by attention; they discovered that attention is selective because of the limited capacity an
investor can give to specific firms due to the excessive time and effort required to research a
stock (289). “Attention becomes crucial” when allocating limited attention to certain firms
and their stocks (290). Feng and Hu concluded that attention can severely affect a stock’s
price because investors focus solely on the news of a specific firm.
An example in Feng and Hu’s study declared that certain outlets and news mediums carry
more weight with individual investors. Previously, it was assumed all investors received the

Exploring Investor Attention in Financial Models Senior Capstone Project for Anna Rodier
- 9 -
same amount of information about a company at the same time, but Feng and Hu realized that
information is disseminated differently. For example, in November 1997, a scientific
magazine reported a medical company produced a new anti-cancer drug, which consequently
increased the price of the stock slightly (290). In May of 1998 (six months later), the New
York Times reported the news of the new anti-cancer drug on the front page of the paper. The
company closed at $12 on Friday and opened at $52 on the following Monday. Feng and Hu
concluded that investor attention is the “driving factor” simply because “investors pay more
attention to New York Times than Nature” (291).
Implications
As I aim to better the current financial models predicting stocks, it is important that I
look at what problems past researchers have faced when completing these models in the first
place. A study completed by Investments Trends U.S. claims that “the investing industry is
facing many challenges: investors are getting younger, technology is playing a greater role,
and people are becoming more optimistic about the economy as it continues to improve”. An
additional study, completed in 2007, looked at the thirty stocks with the highest market value
in the NYSE (Vlastakis & Markellos). This study collected the supply and demand of these
thirty stocks simultaneously and found that market information demand has a significant
relationship with volatility in price and trading volume. This means that when investors are
demanding and searching for more information on a given stock, the price of that stock
follows the level of demand. If a stock has a major news story leak, investors will try to find
out as much information as possible and make appropriate investment decisions. The

Exploring Investor Attention in Financial Models Senior Capstone Project for Anna Rodier
- 10 -
researchers state “the internet has nowadays revolutionized the production, intermediation,
dissemination and consumption of the information in the financial industry.”
A difficult implication that deals with the dissemination of information is that
“traditional asset pricing models assume that information is instantaneously incorporated into
prices when it arrives” (Da, Engelberg, &Gao, 1461) In 2011, researchers Zhi Da, Joseph
Engelberg, and Pengjie Gao focused on trying to directly measure investor attention and
assumption revealed in Google searches (1461). They believe Google is an unambiguous way
to look into research because it is commonly used by all Americans and is a good source to
distribute information because it is less sophisticated for individual investors to use. Da,
Engelberg, and Gao believe that Google searches are a clear cut way to measure investor
attention and frequency rather than indirect methods, like news outbreaks and extreme
returns, which cannot be disseminated at the same time (1497). These researchers were the
first to propose using Google’s Search Volume Index as a way to measure investor attention-
for the remainder of this study, I will follow their mode of thought and use Google’s
calculation of the frequency of searches in order to obtain data pertaining to investor attention.
Investment Advice
The stock market tends to be chaotic and scary for many investors. With the market
crash in 2008 and the ensuing pessimism, individuals tend to be nervous about investing.
While financial advisers and intermediaries can be helpful, many individuals need help with
their finances and how to properly plan for their future. A quote taken from a survey
completed by the Certified Financial Planners board states that “with more complexity and

Exploring Investor Attention in Financial Models Senior Capstone Project for Anna Rodier
- 11 -
uncertainty in today’s economy, Americans are saying they need better financial guidance.”
Through this study, I hope to provide better guidance for individuals interested in investing.
HYPOTHESIS
With the vary uncertainty in the market, different types of investors involved in
trading, and the dissemination of information, I hypothesize that investor attention should be
used to predict stock prices. Investor attention, as measured by the frequency of company
searches, can be an additional factor used in financial models to help better predict the
returns from stocks in the S&P 500. Further, trading volume can be used, in addition to the
frequency of searches, to provide more effective investment decisions.
METHOD
In order to test my hypothesis, I needed to collect data on various stocks to see if I
could find a pattern. After looking at a variety of stock indices, I decided the S&P 500 would
be the best representation for this study. The S&P 500 includes 500 different stocks, varying
in sector, industry, and market capitalization. By using this variety, I am able to test if
investor attention and trading volume can predict price.
The main purpose of this project is to examine the types of investors in the market,
how they receive information, and how their reactions consequently affect stock price. The
next piece of data I had to collect was the percentage of total shares per stock that are owned
by institutional investors. By identifying this, I could later determine which stocks are less

Exploring Investor Attention in Financial Models Senior Capstone Project for Anna Rodier
- 12 -
dominated by institutional investors. Because of this, these stocks would be more influenced
by the actions of individual investors, and I would expect the price to fluctuate the most. I
was able to gather this data using Google Finance.
The next important piece of data I needed to determine was the time frame. I decided
five years would be a long enough period in the stock market. Five years covers a wide range
of time; it is longer than the term of the President and can show the effects of politics, and it is
longer than the term of the chairman of the Federal Reserve and can truly show the effects of
a wavering economy. I gathered data from February 2012 to February 2017.
To predict price using frequency of company searches and trading volume, I needed to
gather this data and test. I collected the weekly adjusted closing price and weekly trading
volumes for each company in the S&P 500 using Yahoo Finance.
To gather investor attention data, measured by the frequency of company searches, I
used Google Trends, an offspring of the search engine Google. Google is a main source used
by individual investors to gather information; it is a direct measure to see what kind of
information people are truly searching for. According to Da, Engelberg, and Gao, it is a
“revealed attention” measure because people have to actively seek out information about a
specific search term. Additionally, Google is one of the largest search engines in the world.
With around 3.5 billion searches a day, and with almost 81 percent of searches worldwide
being completed on Google’s search engine (Appendix 1), gathering Google data will provide
me with the best measure of investor attention. Google Trends reports the frequency of a
search term per week over a specified time period. When entering a search term, Google
Trends produces a graph, in which one can see the highest and lowest popularity by week
over the 5 year span.

Exploring Investor Attention in Financial Models Senior Capstone Project for Anna Rodier
- 13 -
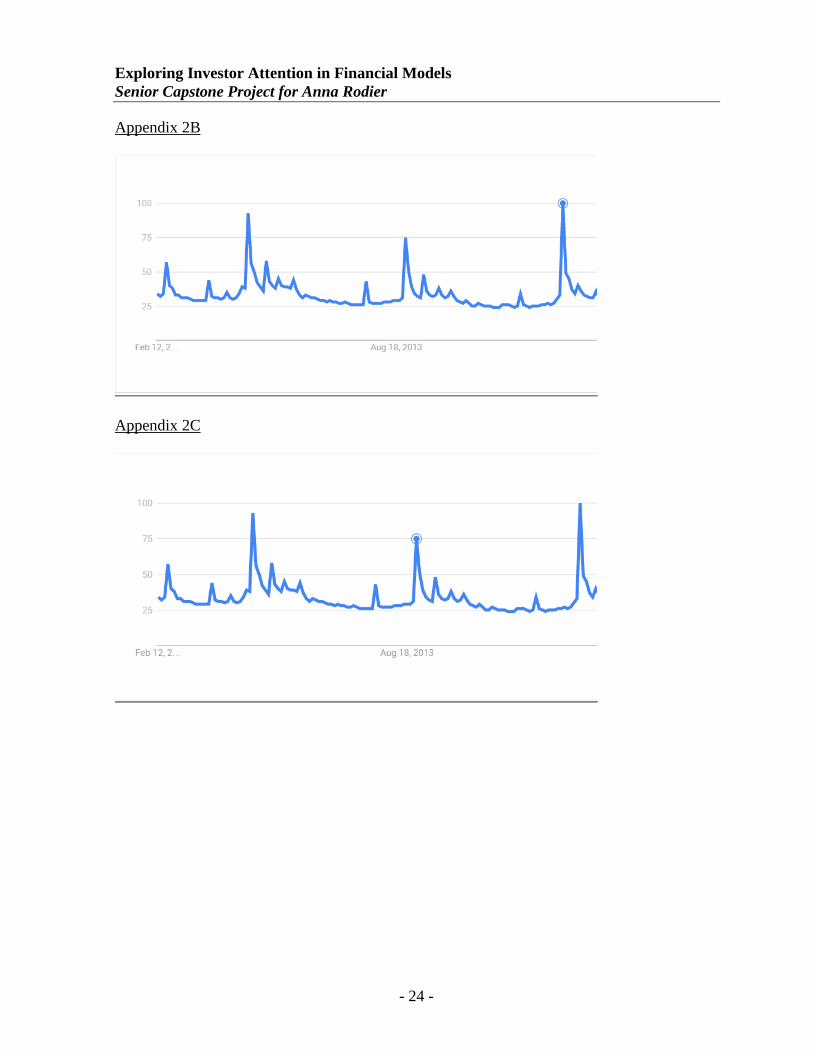
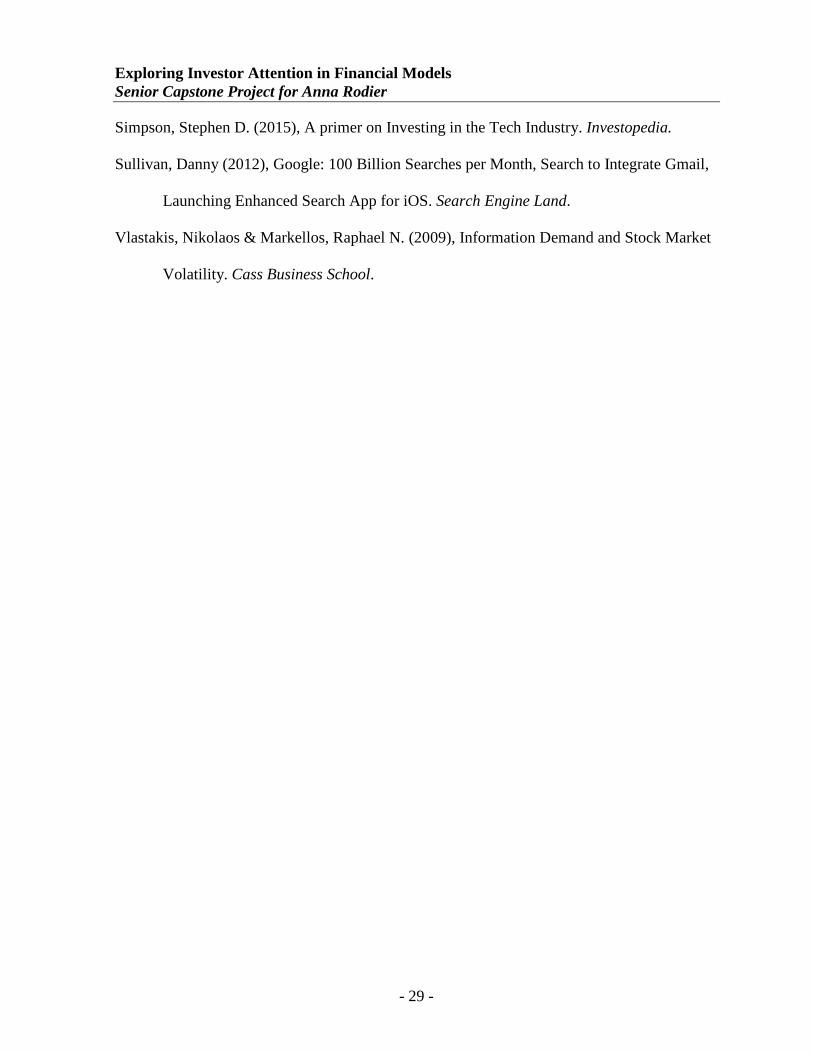
To quantitatively test the frequency of searches, these graphical values must be able to be
compared. Appendix 2A shows an example of Apple’s five year graph of the frequency of
company searches. The highest point, or points, on the graph over the five years is given a
value of 100 (Appendix 2B). This value means this week had the most amount of searches
compared to any other week over the five years. Simply stating, 100 means the most popular
week. Each point following the peak point, or points, on the graph is relative to the highest.
This means that subsequent points are measured through comparison to the most popular
point in time. For example, in Appendix 2C, a point marked 75 means this week was 75
percent as popular as the most popular week in time over the five years. In other words, this
week had 75 percent of the amount of searches completed on the highest searched week
during this time period.
When collecting data, I used the same time period to ensure I was comparing similar
economic times and news events. This methodology works when quantitatively assigning
values to the frequency because it gives companies, no matter how many searches are
completed on them, a relationship that could be compared to each other. Companies like
Apple and Alphabet might be searched more often, but ranking these companies based on
their own search popularity allows me to best compare and see what is truly affecting their
price.
In order to test my hypothesis, I completed regression testing to see if the independent
variables could properly predict the dependent variables. More specifically, I will be looking
at the R^2 values to see if the predictor is a good fit for the dependent variable. An R^2 that
is closer to 1 is perfect, meaning the independent variable is a great predictor of the dependent
variable and there is no gap. Due to the uncertainty and chaos surrounding the stock market, I

Exploring Investor Attention in Financial Models Senior Capstone Project for Anna Rodier
- 14 -
am not expecting extremely high R^2 values because there is much variation between real and
predicted price in the stock market.
I completed two simple regressions to predict price. In the first regression I ran, I set the
independent variable equal to the weekly frequency of company searches and used this to
predict the dependent variable weekly adjusted closing price. I ran a second simple regression
where I set the independent variable equal to the weekly trading volume and the dependent
variable equal to the weekly adjusted closing price. According to my hypothesis, these simple
regressions are significant in predicting price.
The next step from this was to complete a multiple regression using my two original
independent variables, weekly frequency of company searches and weekly trading volume, to
predict the dependent variable of weekly adjusted closing price. According to my hypothesis,
I would expect the multiple regression R^2 to be higher than either of the two simple
regressions, showing that using both independent variables is more useful and better predicts
price.
RESULTS
After running two simple regressions for every company in the S&P 500, I determined
that frequency of company searches produced a higher adjusted R^2 than trading volume 55
percent of the time. This means that frequency is a slightly better predictor than trading
volume, but is not a conclusive answer.
When analyzing the multiple regressions, I found that seventy-four percent of all the
multiple regressions run had a higher adjusted R^2 than either of the two simple regressions

Exploring Investor Attention in Financial Models Senior Capstone Project for Anna Rodier
- 15 -
run. This is to be predicted because additional independent factors that forecast the dependent
variable should produce better predictions when combined. This means that both frequency
of searches and trading volume together should be used to predict price. There were some
complications in my results due to adjusting the coefficient of determination (R^2) when it
was lower than either of the simple regressions R^2. This can occur when one of the
variables takes away from the other, or they are perfectly correlated. While this did not occur
the majority of the time, this is something to consider.
Observation 1
When looking at the simple and multiple regression analysis, nothing stood out. I
looked deeper in the data and realized that 31 percent of all stocks in the S&P 500 have a
higher adjusted R^2 from the multiple regression than the sum of the two simple regressions.
This simply reveals that the multiple regression explains away much more variation in price
using two independent variables than using either of the two independent variables separately.
By using both the frequency of company searches and trading volume to predict price, there is
more accuracy and a better fit overall.
When looking at the thirty-one percent of the S&P 500 stocks that have a higher multi
regression than sum, these stocks tended to have a high-to-moderate inter-correlation between
frequency and volume. I found the Pearson correlation coefficient y looking at the linear
relationship between the two independent variables. A high-to-moderate inter-correlation is to
be expected because these two independent variables are best at predicting price by working
together, showing that they have a significant relationship. As the difference between the

Exploring Investor Attention in Financial Models Senior Capstone Project for Anna Rodier
- 16 -
multiple regression adjusted R^2 and the sum of the simple regression adjusted R^2’s
decreased, the inter-correlation became less significant. This decrease means that as the gap
declines, so does the strength of the relationship between the two independent variables,
frequency of company searches and trading volume.
Observation 2
A pattern that I had noticed and wanted to investigate further dealt with the different
sectors in the stock market. I found after further investigation that individual investors are not
investing in stocks that are highly predicted using the frequency of company searches and
volume. To determine this, I used the percentage of ownership by individual investors for
each stock in the S&P 500, and their sector information.
In order to determine which stocks in the S&P 500 were most influenced by individual
investors, I had to determine who owned what stocks. In the S&P 500, institutional
ownership ranges from two percent to one hundred percent. I took an average of the
ownership among every stock in the S&P 500 and found institutional ownership averaged 85
percent. When looking deeper into my results to determine which stocks were most affected
by individual investors, I felt that 85 percent was too high to really be affected by individuals.
I completed further research, and found that one of the Commissioners from the
Securities and Exchange Commission claimed that in 2009 the 25 largest market valued U.S.
corporations had an average of over 60 percent institutional ownership. Further, the top 1,000
market valued U.S. corporations had 73 percent owned by institutional investors. I felt this
value was more relevant to my study, and determined that any stock in the S&P 500 that had

Exploring Investor Attention in Financial Models Senior Capstone Project for Anna Rodier
- 17 -
less than 73 percent institutional ownership was less dominated by institutional investors. In
other words, stocks with less than 73 percent institutional ownership were more influenced by
individual investors compared to other stocks in the S&P 500.
In Appendix 3, two separate charts are presented. The chart on the right displays the
total amount of stocks in the S&P 500 that have less than 73 percent institutional ownership.
This totals 93 companies out of the 500 in this stock index that are more influenced by
individual investors. The chart on the left in Appendix 3 shows the total amount of stocks in
the S&P 500 that have a higher multiple regression adjusted R^2 than the sum of simple
regressions adjusted R^2. This totals 155 companies. I have ordered these graphs according
to sectors in order to see what stocks individual investors tend to invest in, and if they are the
same as the best performing sectors according to my study.
In Appendix 4, I examine what stocks individual investors are investing in and
expecting to perform well, and determine if these stocks actually do. Sectors, such as
consumer staples, telecommunication, and utilities tend to be more backed by individual
investors. Due to research completed, these sectors tend to be familiar to individual investors
and are generally less risky to invest in. When comparing the sectors individual investors are
investing in to the sectors in my study that predict price well, these sectors do not line up. For
example, the 51.85 percent of utilities stocks in the S&P 500 are less dominated by
institutional investors, and consequently, more influenced by individual investors. However,
only 18.52 percent of utilities stocks in the S&P 500 have a higher multiple regression
adjusted R^2 than sum of the simple regressions adjusted R^2. This shows that the utilities
sector is not as highly predicted by frequency and trade by this study, and that individual

Exploring Investor Attention in Financial Models Senior Capstone Project for Anna Rodier
- 18 -
investors might have a difficult time making investment decisions in this sector due to the
uncertainty.
Appendix 5 shows the sectors that this study predicts well. The chart on the right
shows what sectors will perform well due to significant predictions using both independent
variables to predict the dependent variable in my study. The sectors I would predict to
perform successfully in the market are energy, healthcare, industrials, and telecommunication.
But, when looking at the chart on the left and examining the individual ownership per each
sector, many individual investors are not investing in these well-performing sectors. For
example, only 12.07 percent of healthcare stocks in the S&P 500 are less dominated by
institutional investors, but 46.55 percent of stocks in this sector have a higher multiple
regressions adjusted R^2 than the sum of the simple regressions adjusted R^2. This is
important because the healthcare sector can be best predicted using both the frequency of
company searches and trading volume, but many individual investors are not taking advantage
of this benefit. Additionally, 22.22 percent of energy stocks in the S&P 500 are less
dominated by institutional investors, and more influenced by individual investors. But the
energy sector in the S&P 500 has a 41.67 percent higher multiple regression adjusted R^2
than sum of simple regression R^2, which shows that the energy sector can best be predicted
using both of the independent variables.
Through Observation 2, I was able to see what sectors were more influenced by
individual investors, and, consequently, can see which sectors can best predict price. This is
interesting because the sectors that are less dominated by institutional investors tend not to be
as significant when predicting price using both of the independent variables. Further research
would have to be completed to examine why these sectors do not predict price as well,

Exploring Investor Attention in Financial Models Senior Capstone Project for Anna Rodier
- 19 -
compared to the other sectors in the S&P 500. Additionally, one should see if individual
investors truly account for why these stocks aren’t as highly predicted. Following my
research and hypothesis, I would argue individual investors are one of the many driving
factors in the volatility of stock prices because they are not investing in sectors that are highly
predicted.
Observation 3
When looking further into the simple regression results, I noticed that many adjusted
R^2 values were not significant. Moreover, almost every pair of simple regressions had one
significant R^2 value, while the other was not. In Observation 3, I saw that only 17
companies, out of the entire S&P 500, had both significant adjusted R^2 values over 30
percent. A significant R^2 shows that the variable explains a good amount of discrepancy
when predicting the dependent variable. With so few companies producing both significant
values, I wanted to look at the sector information. I found that 6 out of the 17 companies
were Information Technology companies. I conclude that Information Technology companies
in the S&P 500 tend to have significant simple regression coefficient of determination, which
tends to explain away more variability when predicting price.
LIMITATIONS AND FUTURE RESEARCH
When completing a project of this scope, I had to determine a stock index to use in
order to fully encompass the nature of the market. I decided to use the S&P 500 because it

Exploring Investor Attention in Financial Models Senior Capstone Project for Anna Rodier
- 20 -
includes a variety of well-performing stocks with different market capitalizations and sector
information. To make this study more robust in the future, I would urge one to look at other
stock indices, such as the Russell 3000 or Wilshire 5000. I believe these indices might provide
similar results, but regardless will help to provide more research surrounding the topic of
investor attention in the stock market.
Additionally, I decided to use a five year time period from February 2012 to February
2017. I decided to use this five year term to have a long enough time period for individual
stocks to be able to bounce back after significant, negative news releases or positive company
outcomes. I wanted to ensure I gathered “normal” stock movement data, and I felt that I
needed to use a long enough time period to reflect any company changes. In future research,
one could look at a longer or shorter time period. This might provide similar or different
results, but would ultimately shed greater light on my findings. Further, I used recent years
where the economy has been relatively stable with wavering optimism. It would be interesting
to look at different time periods, like during the 1990s and early 2000s, when there was high
financial optimism, and the stock market was brimming with popularity. Also, looking at the
years 2007 and 2008 during the stock market crash would be interesting to see if investor
attention affected some of the chaos in the market. I believe that looking at different time
periods might provide similar results to my study and will help to better view investor
attention in the market.
I used weekly compiled data throughout my study in order to see the effects of
frequency and volume on price. I believe daily data might produce a more accurate result
when looking at investor attention and volume due to the daily decisions an investor has to
make in their portfolio. While weekly data does produce the result I was looking for, I

Exploring Investor Attention in Financial Models Senior Capstone Project for Anna Rodier
- 21 -
believe intraday trading and attention paid to a company would result in more precise
measures of investor attention. Future research should look into this claim and examine the
differences between weekly compiled data and daily data.
CONCLUSION AND DISCUSSION
In summary, I have found that frequency of searches tends to produce a higher
adjusted R^2 than the trading volume. This occurred in 55 percent of S&P 500 stocks, so
frequency is only a slightly better predictor than trading volume. When combined together,
frequency and trading volume work well together to best predict price. It is important for
individual investors, because they have fewer resources and time when making investment
decisions, to use these two factors when investing to truly maximize their expected returns.
Additionally, I found that investors are investing in sectors they are familiar with, like
Utilities and Consumer Staples sectors. However, these sectors do not seem to be best
predicted using frequency of searches and trading volume. Sectors, like Healthcare and
Energy, are best predicted using frequency and volume, but individual investors do not tend to
invest in these sectors. There could be a deeper, underlying issue here that individual
investors are so heavily influencing sectors, like Consumer Staples and Utilities, that these
sectors are no longer predictable. Investment advice would show that individual investors
should focus on specific sectors this study produced, such as Healthcare and Energy sectors,
to truly invest in better predicted stocks.
Lastly, I saw that very few companies in the S&P 500 produced two significant simple
regressions adjusted R^2 values, showing that only one of the independent variables was

Exploring Investor Attention in Financial Models Senior Capstone Project for Anna Rodier
- 22 -
really working to predict price. Only 17 companies out of 500 in this stock index produced
significant values. Moreover, 6 out of the 17 were Information Technology companies. This
shows that frequency and volume are important factors in explaining price in IT companies
and can help best predict price. More research should be completed in this sector to see if
most IT companies follow this trend.
In conclusion, when an individual investor is trying to make an important investment
decision and maximize their portfolio’s earnings, they should look at the intercorrelation
between frequency of company searches and trading volume. If the intercorrelation is
moderate to highly intercorrelated, the relationship between independent variables is strong
and will, therefore, better predict the dependent variable. Some of the volatility will be
eliminated by using both independent factors to predict price. Additionally, sectors that are
highly influenced by individual investors tend to not predict price as well as sectors that are
more dominated by institutional investors. It is important to note that individual investors
might be a driving factor in this variation, but individual investors can benefit from this
disparity by switching to highly dominated institutional investor stocks.
With wavering financial optimism and younger investors in the market, stock prices
seem to be unpredictable. However, significant factors surrounding investor attention, such as
the frequency of company searches and trading volume, can possibly lead to stronger price
predictions in the future. Researcher Tijmen Kampan claims that “being able to explain the
returns might give you a better idea about how the stock will perform in the future.” With
extended research and future outlooks on the involvement of investor attention in stock prices,
individual investors could make stronger investment decisions and help improve predictability
of the market.

Exploring Investor Attention in Financial Models Senior Capstone Project for Anna Rodier
- 23 -
APPENDICES Appendix 1
Appendix 2A
Exploring Investor Attention in Financial Models Senior Capstone Project for Anna Rodier
- 24 -
Appendix 2B
Appendix 2C

Exploring Investor Attention in Financial Models Senior Capstone Project for Anna Rodier
- 25 -
Appendix 3
Appendix 4

Exploring Investor Attention in Financial Models Senior Capstone Project for Anna Rodier
- 26 -
Appendix 5

Exploring Investor Attention in Financial Models Senior Capstone Project for Anna Rodier
- 27 -
REFERENCES Barber, Brad M. & Odean, Terrance (2007), All that Glitters: The Effect of Attention and
News on the Buying Behavior of Individual and Institutional Investors. Oxford
University Press.
Barry, Christopher B. & Brown, Stephen J. (1983), Differential Information and the Small
Firm Effect. Journal of Financial Economics, 13, 283-294.
Barry, Christopher B. & Brown, Stephen J. (1986), Limited Information as a source of Risk.
The Journal of Portfolio Management, 12, 66-72.
Cecchetti, Stephen G. & Kharroubi, Enisse (2014), Why does Financial Sector Growth crowd
out real Economic Growth? Bank for International Settlements.
Cronqvist, Henrik and Siegel, Stephan, Why Do Individuals Exhibit Investment Biases?
(February 19, 2012).
Da, Zhi, Engelberg, Joseph & Gao, Pengtje (2011), In Search of attention. Wiley for the
American Finance Association, 66, 1461-1499.
De Bondy, Werner F.M (1998), A Portrait of the Individual Investor. European Economic
Review, 42, 831-844.
Feng, X., & Hu, N. (2014). Are individual investors affected by attention? China Finance
Review International, 4(3), 289.
Foucault, Thierry, Sraer, David, & Thesmar, David (2011), Individual Investor Volatility.
Wiley for the American Finance Association, 66, 1369-1406.
Gallup, Inc. "Little Change in Percentage of Americans Who Own Stocks." Gallup.com. N.p.,
22 Apr. 2015. Web. 28 Mar. 2017.

Exploring Investor Attention in Financial Models Senior Capstone Project for Anna Rodier
- 28 -
Goddard, J., Kita, A., & Wang, Q. (2015). Investor attention and FX market volatility.Journal
of International Financial Markets, Institutions & Money, 38, 79.
Google Trends (2016). Google.
Hu, N., Dong, Y., Liu, L., & Yao, L. J. (2013). Not All That Glitters Is Gold: The Effect of
Attention and Blogs on Investors’ Investing Behaviors. Journal Of Accounting,
Auditing & Finance, 28(1), 4-19.
Investment Trends US, February 2016. Mintel Group Ltd.
Jiang Wang , "A Model of Competitive Stock Trading Volume," Journal of Political
Economy102, no. 1 (Feb., 1994): 127-168.
Kampman, Tijmen (2011), Explaining Stock Returns: the CAPM, Fama-French Three Factor
Model and Carhart’s Four Factor Model. Tilburg University.
Kaniel, Ron, Liu, Shuming, Saar, Gideon, & Titman, Sheridan (2012), Individual Investor
Trading and Return Patterns around Earnings Announcements. Wiley for the American
Finance Association, 67, 639-680.
Lease, Ronald C., Lewellen, Wilbur G., & Schlarbaum, Gary G. (1974), The Individual
Investor:
Lee, Samuel (2013), Understanding Factor Models. Morningstar.
Mishra, Dev R. & O’Brien, Thomas J. (2015), Fama-French, CAPM, and Implied Cost of
Equity. Social Science Research Network.
"News & Events." Survey: Americans' Use of Financial Advisors, CFP® Professionals Rises;
Agree Advice Should Be in Their Best Interest. Web. 28 Mar. 2017.
Ro, Sam. (2013) "CHART OF THE DAY: Here's Who Owns The Stock Market. "Business
Insider. Business Insider, Inc.
Exploring Investor Attention in Financial Models Senior Capstone Project for Anna Rodier
- 29 -
Simpson, Stephen D. (2015), A primer on Investing in the Tech Industry. Investopedia.
Sullivan, Danny (2012), Google: 100 Billion Searches per Month, Search to Integrate Gmail,
Launching Enhanced Search App for iOS. Search Engine Land.
Vlastakis, Nikolaos & Markellos, Raphael N. (2009), Information Demand and Stock Market
Volatility. Cass Business School.