exploring galaxy evolution with current and future deep surveys henry ferguson space telescope...
TRANSCRIPT

Exploring Galaxy Evolution with Current and Future Deep Surveys
Henry Ferguson
Space Telescope Science Institute
STScI, June 2010

Collaborators
• Mauro Giavalisco, Mark Dickinson, Adam Riess, Stefano Casertano, Norman Grogin, Vicki Laidler, Ranga-Ram Chary, Bahram Mobasher, Swara Ravindranath, Tommy Wiklind, Tomas Dahlen, Rachel Somerville, Kyoung-Soo Lee, Brian Siana, Harry Teplitz…and the GOODS team
• Students Rafal Idzi, Joshua Lee, Huang Kuang-Han, Tim Dolch
Outline
• Motivations for Deep Fields• Current open issues in understanding high-
redshift galaxies• The upcoming CANDELS Multi-Cycle
Treasury Program

Early Motivation
Where’s the kaboom? There was supposed to be an earth-shattering kaboom!

1995
• Increasing tension between “standard” CDM (Ωtot, Ωm, ΩΛ=1,1,0) and observations.
• Highest redshifts for normal galaxies were z~1. Radio galaxies and QSOs seen out to z~4.
• Searches for high-z galaxies through Lyman-breaks and Lyman-α were yielding null results.
• Early returns from refurbished HST showed that at least some distant galaxies had high surface brightnesses


Deep and Deepest Fields
GOODS~330 arcmin2 = ~0.09 deg2
= 66 x WFPC2 HDF-N
HUDF~12 arcmin2
6x deeper than HDF-N
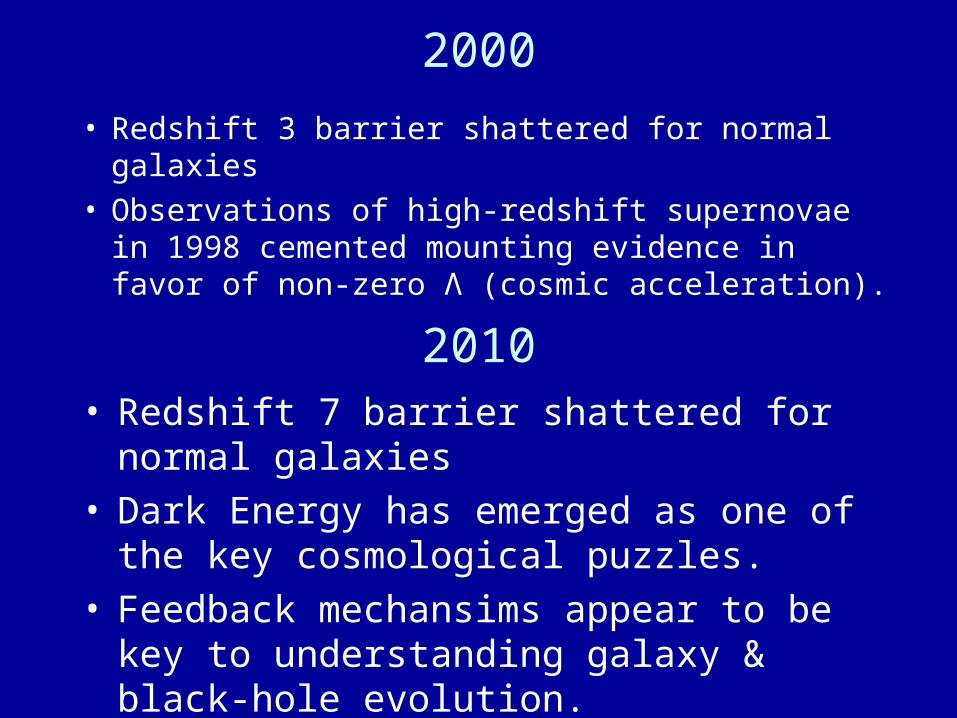
2000
• Redshift 3 barrier shattered for normal galaxies• Observations of high-redshift supernovae in
1998 cemented mounting evidence in favor of non-zero Λ (cosmic acceleration).
2010• Redshift 7 barrier shattered for normal galaxies• Dark Energy has emerged as one of the key
cosmological puzzles.• Feedback mechansims appear to be key to
understanding galaxy & black-hole evolution.


Standard ruler
R~H(z)-2/3
R~H(z)-1
Ferguson et al. 2004
Galaxies get bigger…
At fixed UV luminosity

Galaxies get brighter
• The Luminosity function is evolving– Consistent with L* increasing toward
lower redshift
Bouwens+ 2010

Not a pure mix of disks and spheroids
• More elongated objects than seen locally– Pairs?– Bars?– Filaments?
Ravindranath et al. 2006
Spheroid-like Disk-like & Merger-like
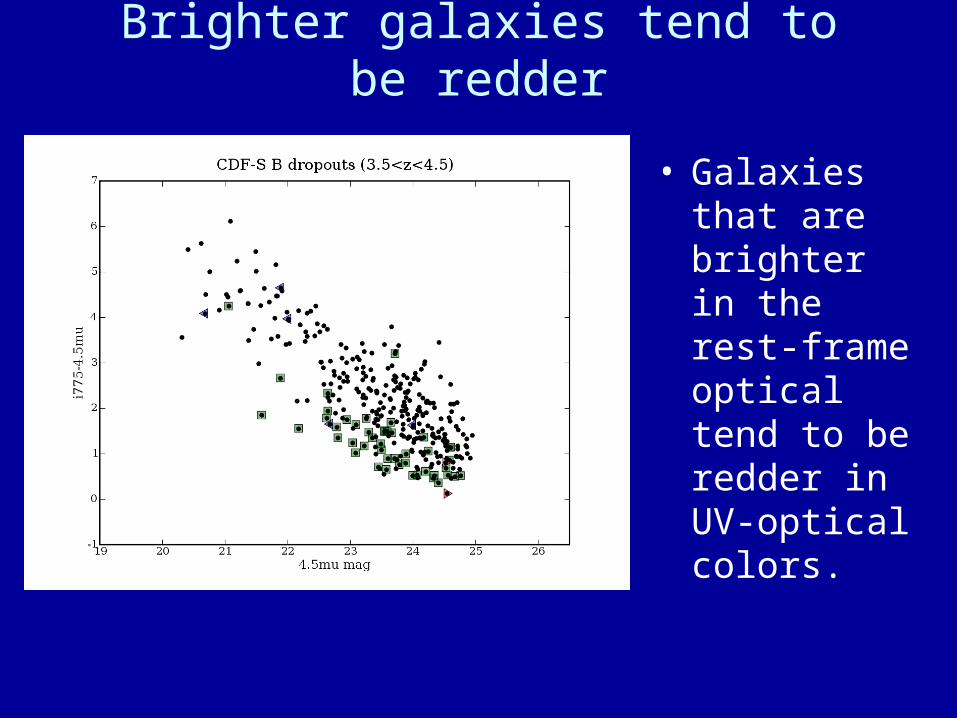
Brighter galaxies tend to be redder
• Galaxies that are brighter in the rest-frame optical tend to be redder in UV-optical colors.

Causes of the color-luminosity relation
• More massive galaxies are probably:– Older– Dustier– More metal rich

Color-luminosity trend at z~7
• UV slopes appear to be getting bluer – Toward high redshift– Toward lower luminosity
Finkelstein+ 2010

2010 Open Issues for high-z galaxies
• The Energy-budget problem– Hard to find enough UV light to reionize the IGM
• The Stellar-mass problem– Instantaneous SFR about a factor of 4 higher than inferred
from stellar mass history at z>3
• The Age problem– Lyman break galaxies do not appear to be getting much older
as the universe ages– Where are the descendents of the galaxies that reionized the
IGM?
• The metals problem– Measured density of metals is lower than inferred from SFR(t)
• The Extragalactic Background Problem– Hard to explain NIR EBL measurements

Are galaxies getting older?

Age vs. redshift from SED fitting
Papovich 2002
CDF-S spec-z sample

The problem with ages
• SED-fitting ages can be strongly biased – We fit simple τ-models to the complex star-forming
histories from Somerville’s semi-analytic models• Used UBRizJHK + 4 IRAC bands
– Same BC03 code and IMF used for SAM and τ-models
– Stellar masses typically 75-80% of “true” mass– SFRs typically ~40% of “true” SFR– Mass-weighted mean ages typically overestimated
by a factor of 2

Fitting with τ models
• Stellar masses are okay
• Star-formation rates are underestimated
• Ages are overestimated
Lee, S.-K. et al. 2009

Lee 2010
Galaxies for which ages come out about right

Lee 2010
Galaxies with particularly bad age estimates

Alternative star-forming histories
• Same number of free parameters, better estimates
€
Ψ(t,τ )∝t
τ 2e−t /τ
Lee, S.-K. et al. 2010

Discrepancies are greatly reduced
• Top is the original τ model
• Three lower panels are delayed star-formation histories.
Lee, S.-K. et al. 2010
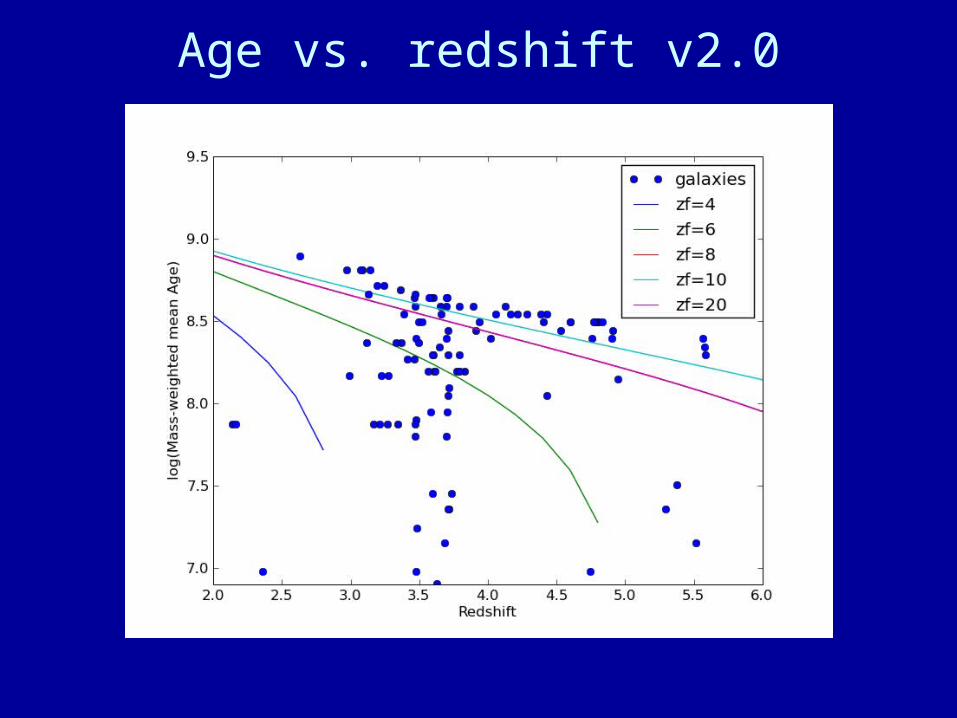
Age vs. redshift v2.0

Extragalactic Background Light
•Is this peak real?•Is it too bright?
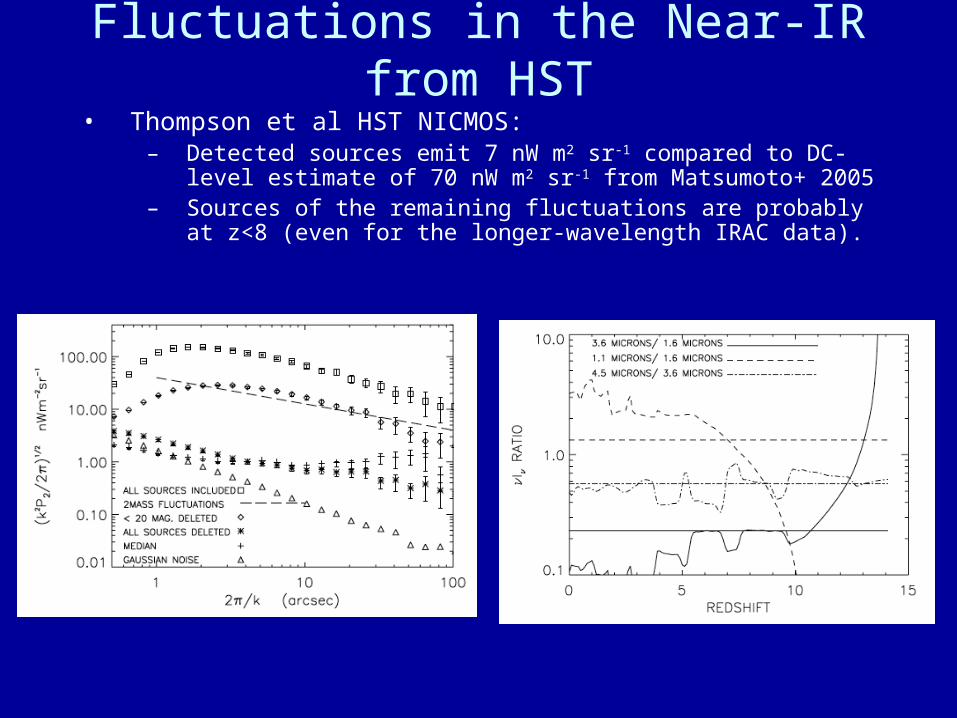
Fluctuations in the Near-IR from HST• Thompson et al HST NICMOS:
– Detected sources emit 7 nW m2 sr-1 compared to DC-level estimate of 70 nW m2 sr-1 from Matsumoto+ 2005
– Sources of the remaining fluctuations are probably at z<8 (even for the longer-wavelength IRAC data).

WFC3 power spectrum
Reionization Simulation from Trac and Cen 2007
• Small scale power is sensitive to the slope and normalization of the luminosity function.
• The large angle (θ ~ 1/30 °) peak (green curve) is a linear-theory prediction of clustering of reionization sources.
• large area surveys with WFC3 can (barely) reach large angle peak
Large θ Small θ

WFC3 H-band
• WFC3 Collaborators:– Tim Dolch, Ranga-Ram Chary, Asantha Cooray, Anton Koekemoer,
Swara Ravindranath
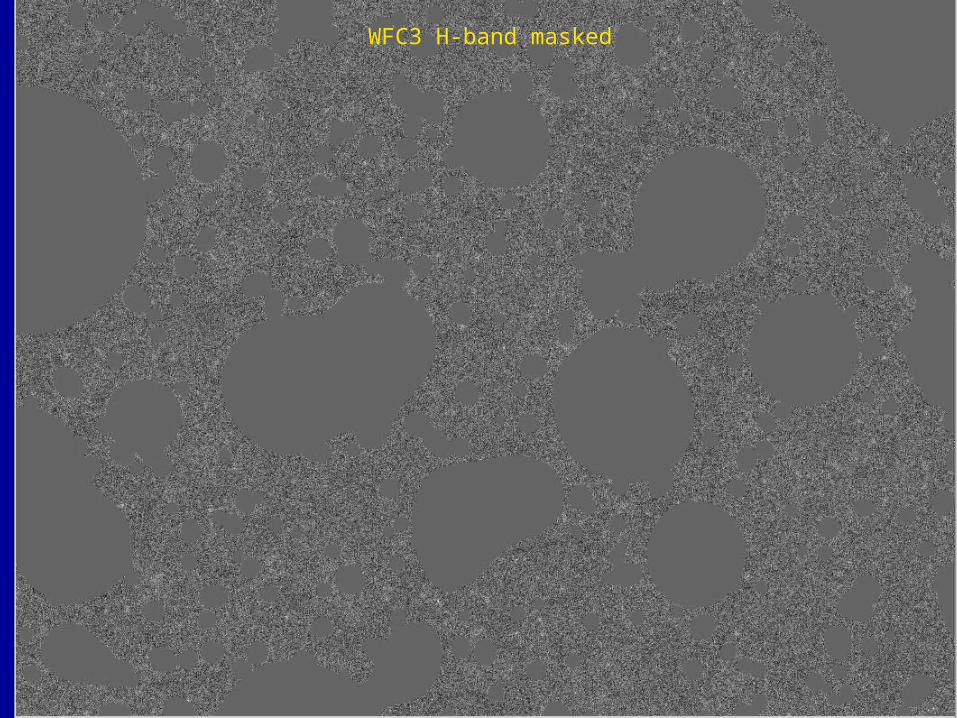
WFC3 H-band masked
Data Preparation
• Iteratively remove detector blemishes– Combined dithered images with some masking– Transfer combined image back to original image
geometries and subtract– Smooth and detect blemishes or persistence– Mask and recombine for the final image
• Create pure noise images in original detector coordinates
– Gaussian statistics okay for these images; match sky background
– Predicted RMS matches measured RMS to within a few percent
– Combine these just as for the real images
• Mask the detected sources– Ideally -- subtract the galaxy wings (work in progress)

Analysis Procedure• Create a shuffled version of the
image– Unmasked pixels are randomly
shuffled, removing correlations
• For both the shuffled and unshuffled version:
– Convolve the masked images with kernels of various sizes
– Compute the histogram of pixel intensities P(D)
• Subtract the shuffled P(D) from the unshuffled P(D).
– Excess is amplified when kernel matches the characteristic size of the sources
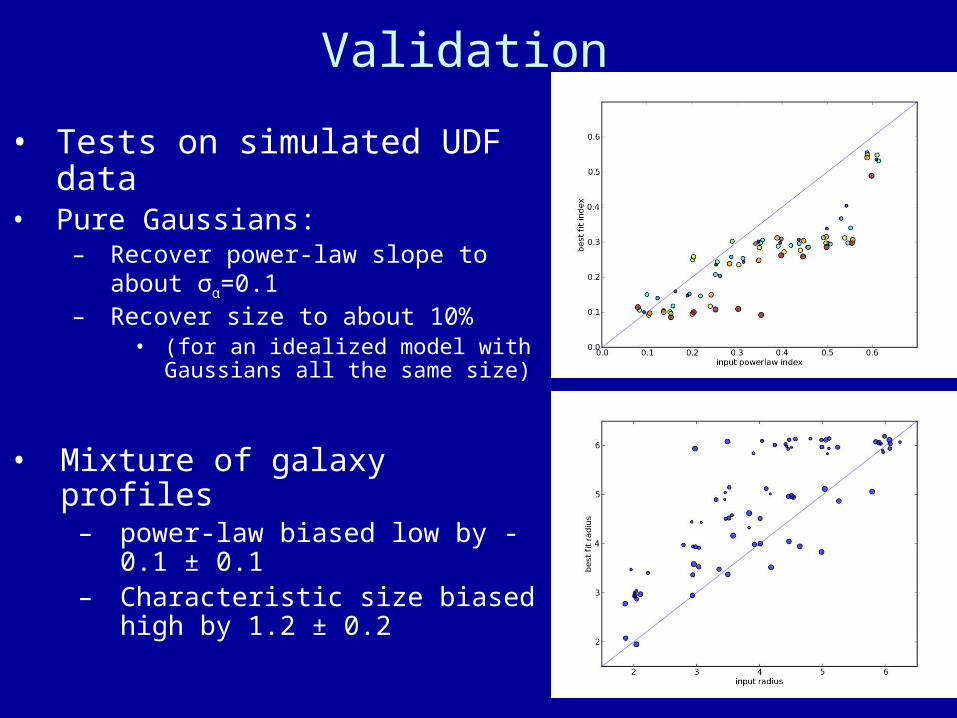
Validation
• Tests on simulated UDF data
• Pure Gaussians: – Recover power-law slope to about
σα=0.1– Recover size to about 10%
• (for an idealized model with Gaussians all the same size)
• Mixture of galaxy profiles– power-law biased low by -0.1 ± 0.1– Characteristic size biased high by
1.2 ± 0.2

Simulated dataα=0.1,r=0.12” α=0.1,r=0.36”
α=0.5,r=0.12” α=0.5,r=0.36”

Preliminary results
• Simple power-law model:– N(M)~10αm
– Normalization fixed to match total counts 27<m<28
– Constant size modeled with Gaussians
• Best fit– F105W: α = 0.7, r = 0.24’’– F125W: α = 0.65, r = 0.24’’– F160W: α = 0.65, r = 0.24’’
• Steep slope is intriguing
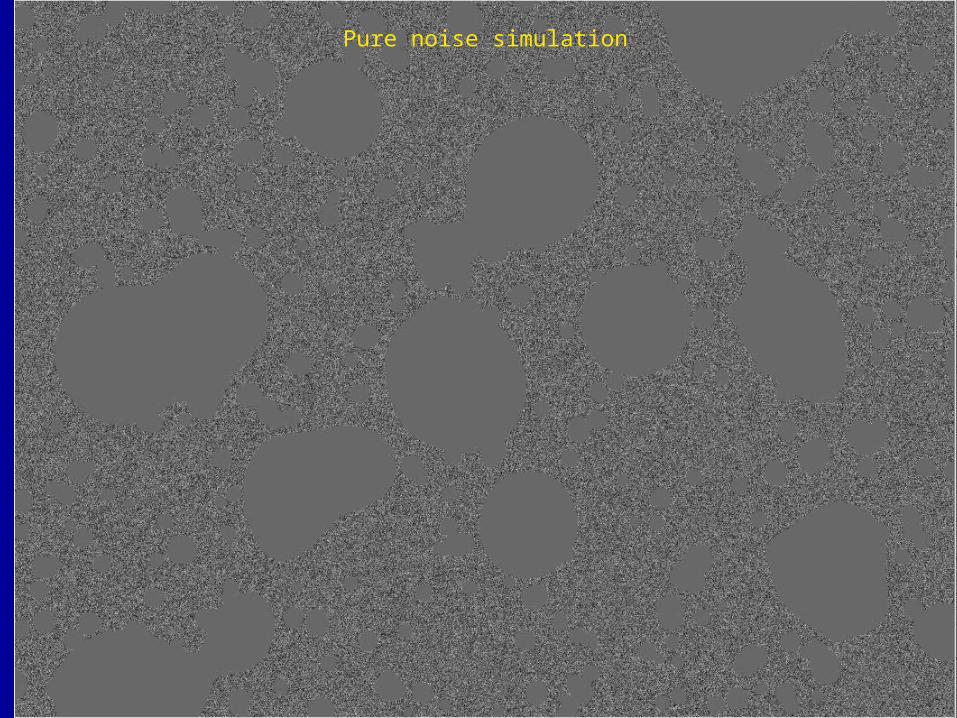
Pure noise simulation
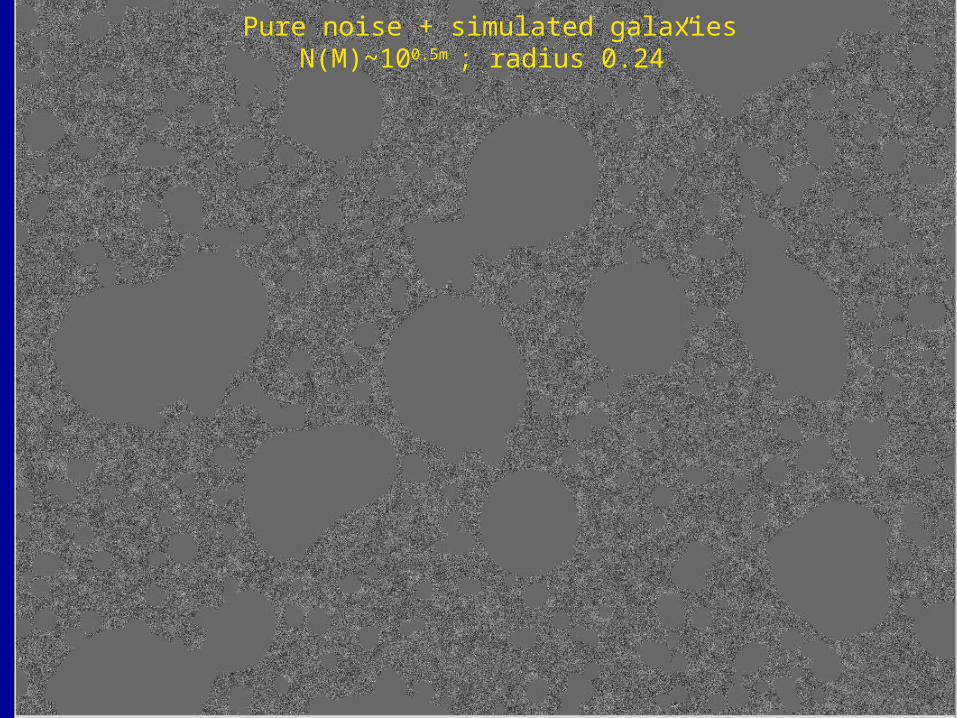
Pure noise + simulated galaxiesN(M)~100.5m ; radius 0.24”

WFC3 H-band masked

Near-IR Galaxy counts
• Faint-end slope is:– Much flatter than α=0.6– Similar in all three bands
• Less than 5% of the galaxies at H>26.5 are identified as Lyman-break galaxies at z>6.5

Future Efforts
• Galaxy subtraction• More sophisticated models
– Galaxy size magnitude relation with scatter
• Better calibration of hot pixels and persistence
• More data
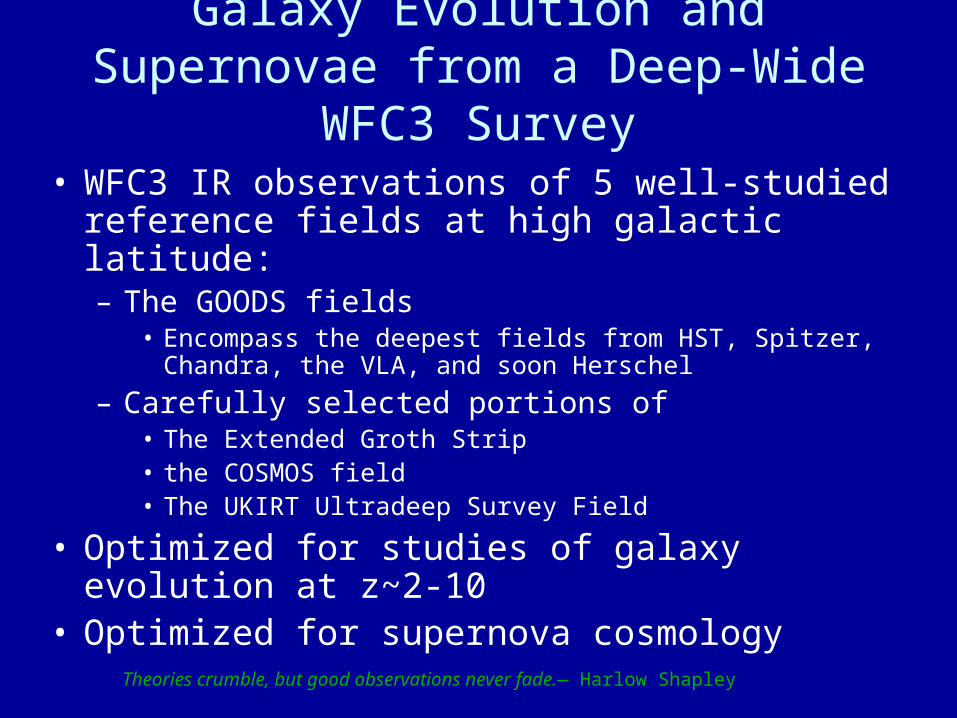
Galaxy Evolution and Supernovae from a Deep-Wide WFC3 Survey
• WFC3 IR observations of 5 well-studied reference fields at high galactic latitude:– The GOODS fields
• Encompass the deepest fields from HST, Spitzer, Chandra, the VLA, and soon Herschel
– Carefully selected portions of • The Extended Groth Strip• the COSMOS field• The UKIRT Ultradeep Survey Field
• Optimized for studies of galaxy evolution at z~2-10• Optimized for supernova cosmology
Theories crumble, but good observations never fade.— Harlow Shapley

90 Co-investigators
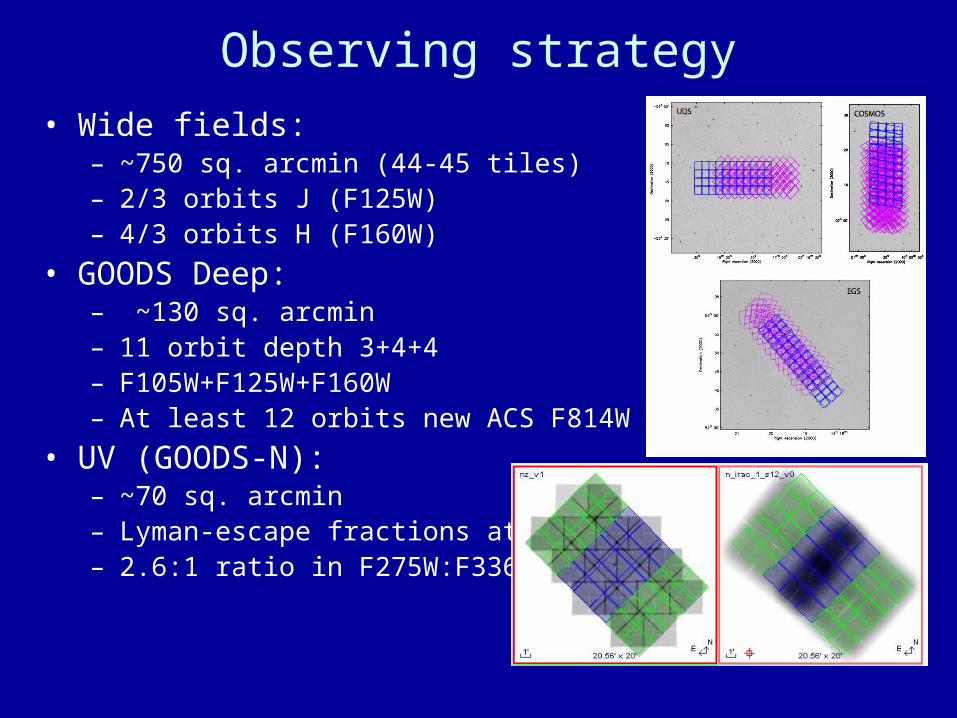
Observing strategy
• Wide fields:– ~750 sq. arcmin (44-45 tiles)– 2/3 orbits J (F125W)– 4/3 orbits H (F160W)
• GOODS Deep:– ~130 sq. arcmin– 11 orbit depth 3+4+4 – F105W+F125W+F160W– At least 12 orbits new ACS F814W
• UV (GOODS-N):– ~70 sq. arcmin– Lyman-escape fractions at z~2.5– 2.6:1 ratio in F275W:F336W

Supernova Cosmology
• Redshift 1-1.5 range is aimed at improving dark-energy constraints
• Redshift >1.5 range is aimed at:– Validating SNIa as
standard candles.
– Testing SNIa evolution models
• Minimum goal is to find and followup – ~18 SNe Ia at z>1
– ~8 of these at z>1.5
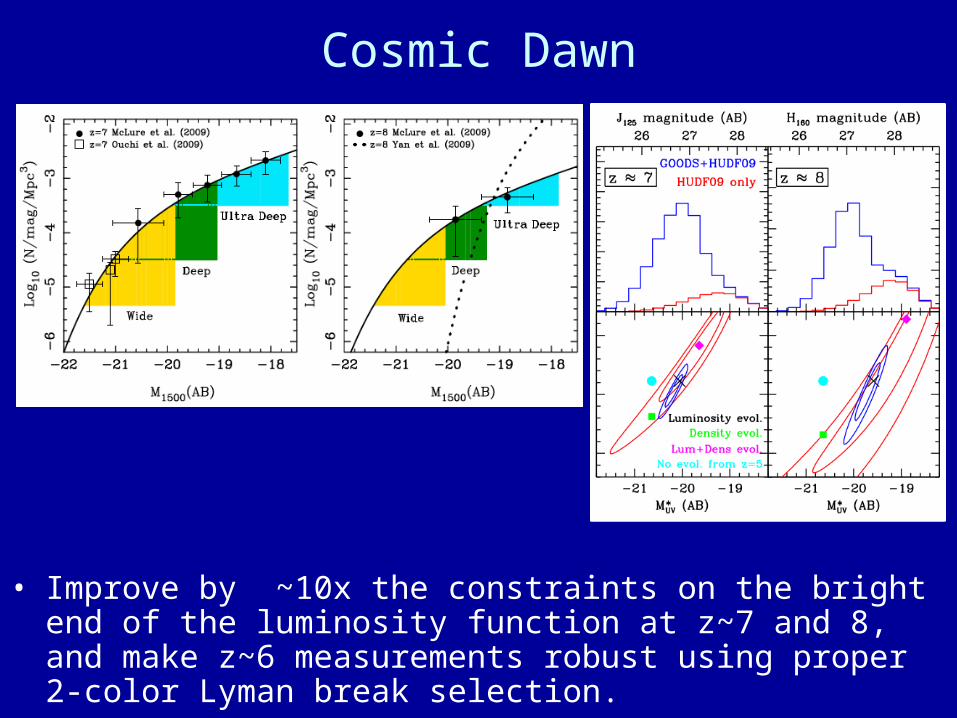
Cosmic Dawn
• Improve by ~10x the constraints on the bright end of the luminosity function at z~7 and 8, and make z~6 measurements robust using proper 2-color Lyman break selection.
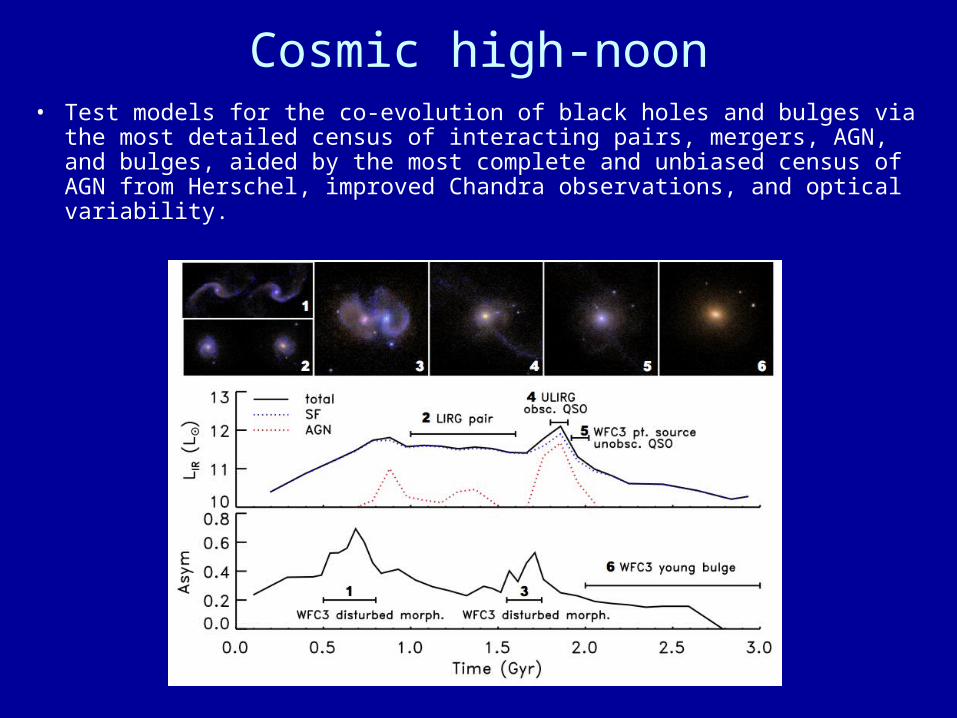
• Test models for the co-evolution of black holes and bulges via the most detailed census of interacting pairs, mergers, AGN, and bulges, aided by the most complete and unbiased census of AGN from Herschel, improved Chandra observations, and optical variability.
Cosmic high-noon

Summary
• Deep fields provide a wealth of information– Cosmology -- lots of bang for the buck from combining galaxy-
evolution studies with lensing and SNe surveys– Galaxy evolution -- Finally getting samples large enough for real
statistics
• At the moment we see some inconsistencies– Various consistency checks don’t quite work
• Stellar mass vs. integral of SFR(t)• Age vs. redshift• Metals budget• Photons for reionization• Extragalactic backgrounds
• Bright prospects for future Deep Fields