exploring data, inspiring innovation - jmp software … data, inspiring innovation september 13 ......
TRANSCRIPT

Exploring data, inspiring innovation
September 13 – 16
SAS World Headquarters
Cary, North Carolina

SAS and all other SAS Institute Inc. product or service names are registered trademarks or trademarks of SAS Institute Inc. in the USA and other countries. ® indicates USA registration. Other brand and product names are trademarks of their respective companies. © 2010 SAS Institute Inc. All rights reserved. 59150US.0710
What if you could streamline everyday operations, satisfying millions with your service?
JMP® Statistical Discovery. From SAS.
Exploratory Data Analysis | Design of Experiments | Business Visualization | Interactive Data Mining
Visual Six Sigma | Modeling | Quality Improvement | Statistics | Analytical Application Development
You can. JMP makes statistical discovery quick and easy.
For 20 years, JMP software has brought the power of analytics to businesses around the world.
www.jmp.com/ef� cientto see how one of the world’s most successful operations uses JMP
1
Every time I visit researchers, I acquire new perspectives on the art of learning through data. I grasp new ideas about modeling,
about graphical techniques, experimental design, and many other innovative ways to make discoveries with the information we have
right at our fingertips.
At the Discovery Summit, we will accelerate learning together, sharing our new skills and cooperating with each other to enrich our
experience. We will hear from both the experts we read in the literature, and the experts we have become ourselves. We will see
previews of new work on discovery software, and have an opportunity to shape future development.
Let us go beyond simply witnessing creative and effective uses of analytics. This is our time to explore data fully and collaboratively,
and to lend our voices to conversations about how to become agents of analytic change. I’ve learned that when you put the right
people in the right setting, innovation follows.
Please be friendly and introduce yourselves to the very skilled group of people around you. Also, please accept our thanks for
joining our community. Welcome to the Discovery Summit.
John Sall
John Sall, Co-Founder and Executive Vice President, SAS
Discovery Through Data, Sharing the Experience
2
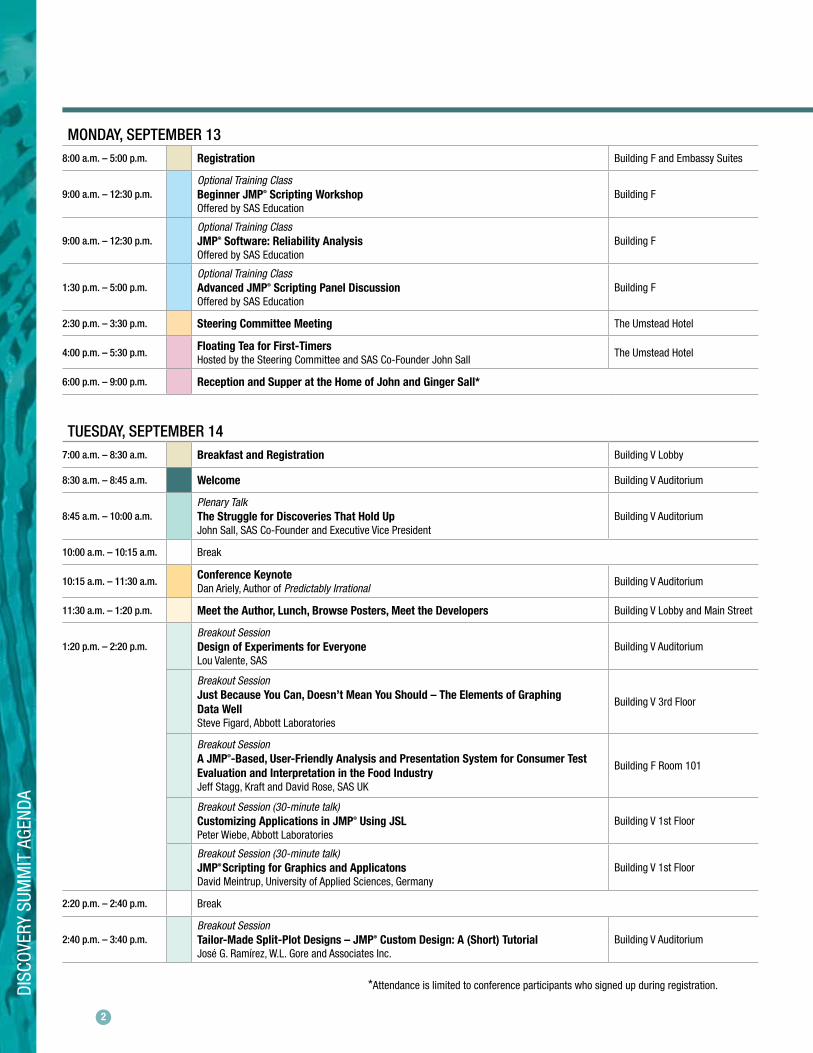
*Attendance is limited to conference participants who signed up during registration.
MONDAY, SEPTEMBER 138:00 a.m. – 5:00 p.m. Registration Building F and Embassy Suites
9:00 a.m. – 12:30 p.m.Optional Training Class Beginner JMP® Scripting Workshop Offered by SAS Education
Building F
9:00 a.m. – 12:30 p.m.Optional Training Class JMP® Software: Reliability AnalysisOffered by SAS Education
Building F
1:30 p.m. – 5:00 p.m.Optional Training Class Advanced JMP® Scripting Panel DiscussionOffered by SAS Education
Building F
2:30 p.m. – 3:30 p.m. Steering Committee Meeting The Umstead Hotel
4:00 p.m. – 5:30 p.m.Floating Tea for First-TimersHosted by the Steering Committee and SAS Co-Founder John Sall
The Umstead Hotel
6:00 p.m. – 9:00 p.m. Reception and Supper at the Home of John and Ginger Sall*
TUESDAY, SEPTEMBER 147:00 a.m. – 8:30 a.m. Breakfast and Registration Building V Lobby
8:30 a.m. – 8:45 a.m. Welcome Building V Auditorium
8:45 a.m. – 10:00 a.m.Plenary TalkThe Struggle for Discoveries That Hold UpJohn Sall, SAS Co-Founder and Executive Vice President
Building V Auditorium
10:00 a.m. – 10:15 a.m. Break
10:15 a.m. – 11:30 a.m.Conference Keynote Dan Ariely, Author of Predictably Irrational
Building V Auditorium
11:30 a.m. – 1:20 p.m. Meet the Author, Lunch, Browse Posters, Meet the Developers Building V Lobby and Main Street
1:20 p.m. – 2:20 p.m. Breakout SessionDesign of Experiments for EveryoneLou Valente, SAS
Building V Auditorium
Breakout SessionJust Because You Can, Doesn’t Mean You Should – The Elements of Graphing Data WellSteve Figard, Abbott Laboratories
Building V 3rd Floor
Breakout SessionA JMP®-Based, User-Friendly Analysis and Presentation System for Consumer Test Evaluation and Interpretation in the Food IndustryJeff Stagg, Kraft and David Rose, SAS UK
Building F Room 101
Breakout Session (30-minute talk)Customizing Applications in JMP® Using JSLPeter Wiebe, Abbott Laboratories
Building V 1st Floor
Breakout Session (30-minute talk)JMP® Scripting for Graphics and ApplicatonsDavid Meintrup, University of Applied Sciences, Germany
Building V 1st Floor
2:20 p.m. – 2:40 p.m. Break
2:40 p.m. – 3:40 p.m.Breakout SessionTailor-Made Split-Plot Designs – JMP® Custom Design: A (Short) TutorialJosé G. Ramírez, W.L. Gore and Associates Inc.
Building V Auditorium
DISC
OVER
y SU
MM
IT A
GEnD
A

3
2:40 p.m. – 3:40 p.m.Breakout SessionVisual Six Sigma: Making Data Analysis Lean with JMP® 9 Philip Ramsey, north Haven Group and University of new Hampshire
Building V 3rd Floor
Breakout SessionA Fresh Take on an Old Problem: Using Analytics to Gain New Insights into Ways to Reduce Fatal Motor Vehicle AccidentsJanel nixon, Integrative Engineering LLC
Building F Room 101
Breakout Session (30-minute talk)Accelerated Field TestingDeanna Starbuck, Aera Energy LLC
Building V 1st Floor
Breakout Session (30-minute talk)HOPE Theory and JMP® Software for Robust Design Takenori Takahashi, Keio University
Building V 1st Floor
3:40 p.m. – 4:00 p.m. Break
4:00 p.m. – 5:00 p.m.Breakout SessionClassical Design Structure of Nonregular Designs from the Custom Design PlatformMark Johnson, University of Central Florida
Building V Auditorium
Breakout Session It’s Not What the Community Can Do for Us, It’s What We Can Do for the CommunityMartin Owen, GlaxoSmithKline
Building V 3rd Floor
Breakout Session JMP® on the Trail!: Wildlife Detection Using FootprintsZoë Jewell and Sky Alibhai, WildTrack
Building F Room 101
Breakout Session (30-minute talk)Using JMP® Scripts to Generate SPC Dashboard with OBDC LinkGreg Flexman, Talecris Biotherapeutics
Building V 1st Floor
Breakout Session (30-minute talk)JSL to the Rescue: Coping Strategies for Making Sense of Real-Time Production Data in Vaccine ManufacturingAndrea Coombs, Emergent BioSolutions
Building V 1st Floor
6:30 p.m. – 9:30 p.m. Summit Soirée at NC Museum of Art
WEDNESDAY, SEPTEMBER 157:00 a.m. – 8:30 a.m. Breakfast, Browse Posters, Meet the Developers Building V Lobby and Main Street
8:30 a.m. – 8:45 a.m. Welcome Building V Auditorium
8:45 a.m. – 10:00 a.m.
Plenary TalkFrom Simple Traits to Complex Systems: What Do the Humble Plant Leaf and ‘Advanced’ Human Societies Tell Us About the Future of Planet Earth?Peter Reich, University of Minnesota
Building V Auditorium
10:00 a.m. – 10:15 a.m. Break
10:15 a.m. – 11:30 a.m.Plenary Talk What Happens After the Math Is Done?Kaiser Fung, Sirius XM Radio
Building V Auditorium
11:30 a.m. – 1:20 p.m. Book Signing, Lunch, Browse Posters, Meet the Developers Building V Lobby and Main Street
1:20 p.m. – 2:20 p.m.Breakout Session Exploring NFL Data with JMP®
Bradley Burch, nFL Data Visualization (nFLDV)Building V Auditorium
Breakout Session Information Visualization and Visual Data Mining with a Focus on New Graphic Tools Using Both JMP® and SAS® for Mortgage FraudAnders Hasslerot, Lloyds Banking Group and Daniel Keim, University of Konstanz
Building V 3rd Floor

4
WEDNESDAY, SEPTEMBER 15 (continued)
1:20 p.m. – 2:20 p.m.
Breakout Session Identification of Rogue Tools and Process Stage Drift by Using JMP® Software Visualization and Analytical TechniquesJim nelson, Freescale Semiconductor
Building F Room 101
Breakout Session (30-minute talk)Gillette – The Best a Man Can Get. Let’s Discover How JMP® Helps You Get the Best Shave in the Morning.Elisa Bonvini, Procter & Gamble
Building V 1st Floor
Breakout Session (30-minute talk)Application of JMP® and Design of Experiments to Security System Technology TestingKim Mitchiner, Sandia national Laboratories
Building V 1st Floor
2:20 p.m. – 2:40 p.m. Break
2:40 p.m. – 3:40 p.m.Breakout Session Making the Most of the New Mapping Features in JMP® 9Xan Gregg, SAS
Building V Auditorium
Breakout Session Data Mining for Vaccine ManufacturingJulia O’neill, Merck & Co. Inc.
Building V 3rd Floor
Breakout Session A Virtual Laboratory System for Tire CompoundingCraig Burkhart, The Goodyear Tire & Rubber Company and Philip Brown, Predictum Inc.
Building F Room 101
Breakout Session (30-minute talk)DOE and Green TechnologyVincent Wingate, Biolex Therapeutics
Building V 1st Floor
Breakout Session (30-minute talk)It’s Easy Being Green: JMP® for Building Energy Modeling Daniel Arneman, University of north Carolina at Chapel Hill
Building V 1st Floor
3:40 p.m. – 4:00 p.m. Break
4:00 p.m. – 5:00 p.m.Breakout Session A Comparison of the Neural Platform Across JMP® 7, 8 and 9Patrick Biltgen, BAE Systems
Building V Auditorium
Breakout Session Pulmonary Embolism Classification Using CT Images (and JMP® Pro!)Marie Gaudard, north Haven Group
Building V 3rd Floor
Breakout Session On Enhancing JMP®’s Visual Analytics Using JSLTheresa Utlaut and Georgia Morgan, Intel Corporation
Building F Room 101
Breakout Session (30-minute talk)Application of JMP® to the Analysis and Interpretation of Sensory and Consumer DataBrent Ginn, JM Smucker Co.
Building V 1st Floor
Breakout Session (30-minute talk)Visual Tolerance Analysis for Engineering OptimizationZhou Wei, SAS (Beijing)
Building V 1st Floor
6:00 p.m. – 10:00 p.m. Discovery Dinner at Prestonwood Country Club
DISC
OVER
y SU
MM
IT A
GEnD
A

5
SAS and all other SAS Institute Inc. product or service names are registered trademarks or trademarks of SAS Institute Inc. in the USA and other countries. ® indicates USA registration. Other brand and product names are trademarks of their respective companies. Copyright © 2010 SAS Institute Inc. Cary, NC, USA. All rights reserved. S57912US.0810
THURSDAY, SEPTEMBER 167:00 a.m. – 8:30 a.m. Breakfast, Executive Registration, Browse Posters, Meet the Developers Building V Lobby and Main Street
8:30 a.m. – 8:45 a.m. Welcome Building V Auditorium
8:45 a.m. – 9:45 a.m.Plenary TalkThe Seven Deadly Sins of Data Mining – and How to Avoid ThemRichard D. De Veaux, Williams College
Building V Auditorium
9:45 a.m. – 10:45 a.m.Plenary Talk Analytics at Work: Secrets of Data-Charged OrganizationsJeanne G. Harris, Accenture
Building V Auditorium
10:45 a.m. – 11:00 a.m. Break
11:00 a.m. – 12:00 p.m.Analytic Exchange PanelModerated by Michael Schrage, MIT
Building V Auditorium
12:00 p.m. – 12:30 p.m. Meet the Author Building V Lobby
12:30 p.m. Conference Adjourns
12:30 p.m. – 2:00 p.m. Post-Conference Lunch with the Developers Building F Café
2:30 p.m. – 4:00 p.m. Steering Committee Post-Conference Meeting
5:00 p.m. – 7:00 p.m. Optional Steering Committee Dinner The Umstead Hotel
FRIDAY, SEPTEMBER 17
9:00 a.m. – 12:30 p.m.Optional Training ClassWhat’s New in JMP® 9?Offered by SAS Education
Building F
1:30 p.m. – 5:00 p.m.Optional Training ClassUsing SAS® Simulation Studio for JMP®
Offered by SAS EducationBuilding F
9:00 a.m. – 5:00 p.m.Optional Training ClassDesign of Experiments for Measurement Systems Analysis (MSA)Offered by SAS Education
Building F
w
Got a minute?Stop by the social media kiosk in Building V Main Street to connect with other JMP users and experts.

6
Dan Obermiller, The Dow Chemical Company, Midland, MI
Jeff Perkinson, SAS, Cary, nC
Heath Rushing, Adsurgo LLC, Denver, CO
John Sall, SAS, Cary, nC
Deanna Starbuck, Aera Energy LLC, Bakersfield, CA
Mike Cramer, McDonald’s, Chicago, IL
Lynn Dickey, Biolex Therapeutics, Pittsboro, nC
Ed Hutchins, Cree, Durham, nC
Stan Koprowski, sanofi-aventis, Bridgewater, nJ
Don Lifke, Sandia national Laboratories, Albuquerque, nM
Di Michelson, SEMATECH, Austin, TX
MEET THE DIScOvERY SUMMIT STEERINg cOMMITTEE. They are the brains behind this operation, and we thank them for
sharing their time and talent. Engage these leaders in conversation; they’d love to hear how you’re making your mark with analytics.
Cree and the Cree logo are registered trademarks of Cree Inc. in the United States and/or other countries.DISC
OVER
y SU
MM
IT S
TEER
InG
COM
MIT
TEE
AnD
HOST
SDI
SCOV
ERy
SUM
MIT
STE
ERIn
G CO
MM
ITTE
E An
D HO
STS

7
Manny Uy, Johns Hopkins University, Laurel, MD
Cy Wegman, Procter & Gamble, West Chester, OH
MEET YOUR DIScOvERY SUMMIT HOSTS. They are the glue that holds this gig together. Look to them for speaker introductions,
question and answer facilitation and clever segues. And they’ll have some helpful logistical information, too.
CHUCK BOILER, JMP Systems Engineer Manager, SAS Chuck Boiler is the US Systems Engineer Manager for JMP, a business unit of SAS. Since joining SAS in 1997, Boiler
has held management roles with JMP and helped develop solutions for conducting many types of analysis, including
design of experiments for the semiconductor industry, quality control for pharmaceutical manufacturing, and market-
ing applications for survey analysis using JMP software. He now works with US field engineering staff and customers
to help them solve problems and discover hidden opportunities in the data. Also, he provides feedback to the JMP
development team, which uses the information as part of the continuous development cycle.
MICHAEL SCHRAGE, Research Fellow, MIT Center for Digital Business
Michael Schrage is one of the world’s leading experts on the economics of innovation. He helps companies world-
wide design innovation processes that maximize return on investment by managing the links between innovation, the
supply chain and the customer cost-effectively. Schrage is a research associate at MIT Media Lab and author of the
groundbreaking book, Serious Play: How the World’s Best Companies Simulate to Innovate (Harvard Business School
Press, 2000). Schrage lectures and consults on these themes at several MIT executive education programs, over-
seas business schools and corporate workshops worldwide, showing audiences how to become more innovative and
control costs without jeopardizing either their internal culture or their business model.

8
FLOATING TEA FOR FIRST-TIMERS
Welcome to the JMP community. Research suggests that there is a link between a warm beverage and warm behavior. There is something wonderful about a steaming drink
that evokes a sense of comfort and happiness among friends. If this is your first time attending Discovery Summit, please join us for a beautiful
tea service and accompanying fare at The Umstead Hotel. We look forward to spending time with you as we embrace a tradition shared by
cultures across the globe. It is our special way of extending a warm welcome to newcomers in the JMP community.
T H E U M S T E A D H O T E L 4 : 0 0 – 5 : 3 0 p . m .
WEL
COM
E TE
A, R
ECEP
TIOn
AnD
SUP
PER
Monday, September 13
9
T H E H O M E O f j O H n A n D g i n g E r S A L L 6 : 0 0 – 9 : 0 0 p . m .
RECEPTION AND SUPPER
More than a great place to work. If you research the word SAS, you’ll find it means different things to different people. To some, the acronym refers to Scandinavian Airlines.
Others think of San Antonio Shoes. Or the Society for Amateur Scientists.
To John Sall, SAS means statistics, work and, believe it or not, home. SAS World Headquarters in Cary, NC is where he fulfills his duties as an
Executive Vice President of the No. 1 enterprise on the 2010 FORTUNE 100 Best Companies to Work For list. But the verdant, private campus
is also where he and his wife, Ginger, have made their home.
They have graciously offered to host the opening night of Discovery Summit with a reception and supper. If you reserved your place in advance,
you’ll mingle with fellow attendees and meet members of the JMP division of SAS, who are excited to make you feel welcome in the place they
consider their home away from home.
Monday, September 13
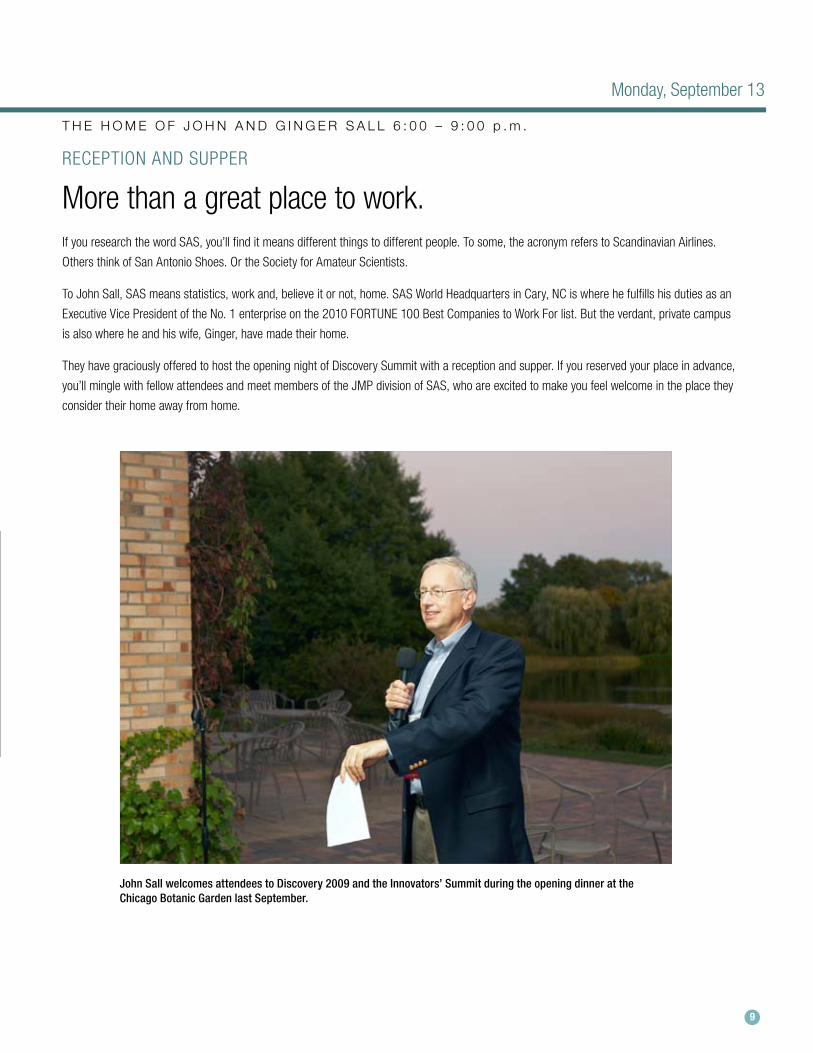
John Sall welcomes attendees to Discovery 2009 and the Innovators’ Summit during the opening dinner at the chicago Botanic garden last September.
10
PLEn
ARy
TALK
/ CO
nFER
EnCE
KEy
nOTE
B U i L D i n g V A U D i T O r i U M 8 : 4 5 a . m .
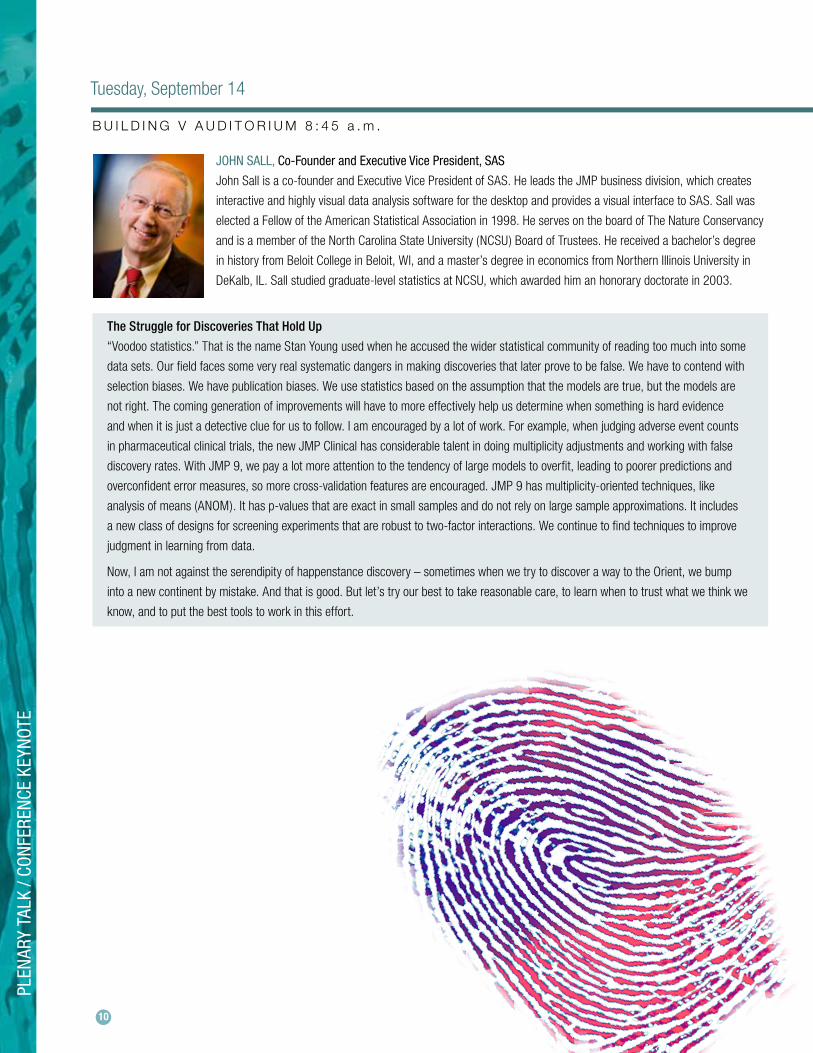
JOHn SALL, Co-Founder and Executive Vice President, SAS
John Sall is a co-founder and Executive Vice President of SAS. He leads the JMP business division, which creates
interactive and highly visual data analysis software for the desktop and provides a visual interface to SAS. Sall was
elected a Fellow of the American Statistical Association in 1998. He serves on the board of The Nature Conservancy
and is a member of the North Carolina State University (NCSU) Board of Trustees. He received a bachelor’s degree
in history from Beloit College in Beloit, WI, and a master’s degree in economics from Northern Illinois University in
DeKalb, IL. Sall studied graduate-level statistics at NCSU, which awarded him an honorary doctorate in 2003.
The Struggle for Discoveries That Hold Up
“Voodoo statistics.” That is the name Stan Young used when he accused the wider statistical community of reading too much into some
data sets. Our field faces some very real systematic dangers in making discoveries that later prove to be false. We have to contend with
selection biases. We have publication biases. We use statistics based on the assumption that the models are true, but the models are
not right. The coming generation of improvements will have to more effectively help us determine when something is hard evidence
and when it is just a detective clue for us to follow. I am encouraged by a lot of work. For example, when judging adverse event counts
in pharmaceutical clinical trials, the new JMP Clinical has considerable talent in doing multiplicity adjustments and working with false
discovery rates. With JMP 9, we pay a lot more attention to the tendency of large models to overfit, leading to poorer predictions and
overconfident error measures, so more cross-validation features are encouraged. JMP 9 has multiplicity-oriented techniques, like
analysis of means (ANOM). It has p-values that are exact in small samples and do not rely on large sample approximations. It includes
a new class of designs for screening experiments that are robust to two-factor interactions. We continue to find techniques to improve
judgment in learning from data.
Now, I am not against the serendipity of happenstance discovery – sometimes when we try to discover a way to the Orient, we bump
into a new continent by mistake. And that is good. But let’s try our best to take reasonable care, to learn when to trust what we think we
know, and to put the best tools to work in this effort.
Tuesday, September 14

11
B U i L D i n g V A U D i T O r i U M 1 0 : 1 5 a . m .
Dan Ariely AUTHOR, PREDICTABLY IRRATIONAL
We cheat. We disregard nutrition labels. We let short-term
emotions affect long-term business decisions. Why? Because
we are predictably irrational. While classic economic theory is
based on the assumption that humans act in a logical manner,
Dan Ariely’s observations run contrary to popular belief.
Ariely has dedicated his career to behavioral economics, or how
people actually act when making real-life decisions. His immer-
sive introduction to irrationality took place many years ago while
undergoing painful and persistent treatments to overcome injuries
sustained in an explosion. He left inspired to conduct research on
why hospitals continue to use these methods despite the agony
they cause. Now, as the James B. Duke Professor of Behavioral
Economics at Duke University and a founding member of the Center for Advanced Hindsight, Ariely is interested in the many variables that
cloud our judgment – and the implications of our resulting actions.
We’ve invited Ariely, author of The New York Times best-seller Predictably Irrational: The Hidden Forces That Shape Our Decisions, to highlight
this surprising science at Discovery Summit 2010. He has more than his fair share of findings to discuss, including ones from his newly
released book, The Upside of Irrationality: The Unexpected Benefits of Defying Logic at Work and at Home.
If you’ve read his books, you know his mantra: We may believe we have the ability to make rational choices, but our conduct is highly illogical –
in a predictable sort of way. In fact, Ariely writes that we are less like “hyper-rational Mr. Spock” and more like the “fallible, myopic, vindictive,
emotional, biased Homer Simpson.” But there is hope. He says that if understanding decision making could help him convince his wife to marry
him, it could help anyone.
Think about the applications.
Did you know that we all have a personal fudge factor, or level at which we can cheat and still feel good about ourselves? For instance, we are
more likely to take a mulligan on the first hole of golf than we are to alter the final score. But how much does our propensity to cheat decrease
when we are primed with an honor code?
Or consider why you shouldn’t try to pay your mother-in-law for preparing that mouthwatering holiday dinner. When social norms and market
norms collide, life gets uncomfortable.
And while you may not like it, extremely large bonuses can be counterproductive. The promise of a hefty windfall can cause such overwhelming
pressure that work performance slides. So what are the best practices for motivating our employees without diminishing results?
Ariely illustrates his conclusions – on topics ranging from online dating to the desire for revenge – in an approachable manner, in hopes that
you will discover the excitement of behavioral economics and use these insights to make better decisions. Even if those decisions are not
always rational. And that’s OK.
Tuesday, September 14

12
Tuesday, September 14
B U i L D i n g V A U D i T O r i U M 1 : 2 0 p . m .
Design of Experiments for EveryoneBRADLEy JOnES, PhD, JMP Principal Research Fellow – SASLOU VALEnTE, MS, JMP Product Manager – SASThere is a general perception that designed experiments are esoteric and a tool only for the advanced user. We believe this perception is false and counterproductive because it provides a rationalization for not conducting experiments. In this presentation, we will design, perform and analyze an experiment to show how straightforward the process of experimentation can be.
B U i L D i n g V 3 r D f L O O r 1 : 2 0 p . m .
Just Because you Can Doesn’t Mean you Should – The Elements of Graphing Data WellSTEVE FIGARD, PhD, Senior Scientist – Abbott Laboratories Most software packages that revolve around and/or include the creation of graphs and the representation of data in graphical format provide today’s users with an unprecedented (and sometimes confusing) plethora of options to use and graphs to make. Data analysis and presentation are highly facilitated by the proper use of graphics. Indeed, the Graph Builder platform of JMP® 8 is the greatest thing since sliced bread for the rapid visual presentation of quantitative information. With the great power of these and other graphics packages comes not just great responsibility (thank you, Spidey), but also an increased probability of lack of clarity, error and actual abuse from simple ignorance of principles of good graph construction. The software can only provide so much protection, for as Richard Cook (science fiction author, The Wizardry Compiled ) has so well observed, “Programming today is a race between software engineers striving to build bigger and better idiot-proof programs, and the Universe trying to produce bigger and better idiots. So far, the Universe is winning.” The objective of this presentation is to provide the audience with the principles gleaned from such giants as Cleveland and Tufte (along with anyone else I find in the interim) within the context of JMP, in an effort to combat graphic entropy.
B U i L D i n g f r O O M 1 0 1 1 : 2 0 p . m .
A JMP®-Based, User-Friendly Analysis and Presentation System for Consumer Test Evaluation and Interpretation in the Food Industry JEFF STAGG, Principal Scientist – KraftDAVID ROSE, Principal Solutions Implementation Consultant – SAS UKKraft promotes statistical thinking and best practices globally with the development of software tools that execute complex data handling and calculation. The choice of software platform depends on both software capability and customer requirements to determine the optimal cost/quality solution. JMP software was selected as the platform to provide a CONSUMER TEST EVALUATION tool for the global Sensory/Consumer function in Kraft. It replaces a set of Kraft-developed data analysis macros written in various other software packages. JMP scripts combine data handling and calculation requirements with novel high-quality graphical output tailored for import into PowerPoint presentations. Products are assigned names, labels and multiple color profiles that are automatically used in all graphical routines. Statistical analysis methods within the Kraft application include principal components analysis (PCA), regression, clustering and multiple range tests and graphical output including customized histogram, frequency, stacked, scatter, star plots and both 2D and 3D PCA charts. Importantly, all native JMP software capabilities remain available to users of the package, but the Kraft application product names and color profiles are not tied to these procedures. The CONSUMER TEST EVALUATION tool has halved analysis time, significantly reduced training time, minimized calculation error, ensured/increased use of Kraft best practices and reduced software costs. Its success results from a close collaboration between Kraft UK Banbury and SAS Professional Services in Marlow. The application is now deployed globally under International and US Master License Agreements, which enables flexibility of deployment to an evolving customer base.
B U i L D i n g V 1 S T f L O O r 1 : 2 0 p . m .
Customizing Applications in JMP® Using JSLPETER WIEBE, PhD, Senior Quality Engineer – Abbott Laboratories KRISTA M. BIRCH, ASQ CSSBB; MORIA TRAUTMAn; TOny ORZECHOWSKI, MS, ASQ CSSBB, Co-Authors – Abbott LaboratoriesThe JMP Scripting Language (JSL) allows a user to harness the powerful analytics and graphing capabilities of JMP to generate dynamic customized applications. Three critical elements of an application are the user interface, the analysis and the output. The designs of these elements are dependent on the business need of the application; however, JSL offers the flexibility to tie these elements together and maintain the performance intrinsic to JMP software. As an example, we have developed a JMP software application that uses historical performance data to predict its future capability. Unlike the built-in functions in JMP, we perform this using a bootstrapping simulation method. The user has the option to use a random normal distribution with a specified mean and CV, or reference any table of historical values, so that no assumptions regarding the distribution are required. We have added the ability to dynamically add other sources of variation, either through the user interface
BREA
KOUT
SES
SOnS

13
Tuesday, September 14
or through a referenced data table. The analysis is performed using matrix algebra, and the output is created with existing JMP graphing and analysis tools. Outputs that previously required hours of repetitive manual analysis activities now take place in a matter of seconds. The objective here is to emphasize that by using JSL we can enhance the existing capabilities that allow users to create applications in JMP that have the power and feel of features intrinsic to JMP, yet have features required to meet a business need.
JMP® Scripting for Graphics and ApplicationsDAVID MEInTRUP, PhD, Professor of Mathematics, Statistics and Operations Research – University of Applied Sciences, GermanyUsing the JMP Scripting Language (JSL) for graphs joins two of JMP’s best capabilities: the flexibility of adding features that the scripting language offers and the interactive visualization that makes JMP graphs indispensable. We will start with a short introduction to the different options of scripting for graphs. The main focus will consist of a wide range of scripted graphical applications that were deemed important from customer interactions. We will start with an easy example script for graphical clustering, and we will then present an adverse event-relative risk map (drug development), wafermaps (semiconducter) and a visual tool for testing significant differences for the partial areas under two ROC curves (diagnostic medicine). We will end with a presentation of the concept of a row-based graphical object and show its applications, including choropleth maps and visualization of gene expression.
B U i L D i n g V A U D i T O r i U M 2 : 4 0 p . m .
Tailor-Made Split-Plot Designs – JMP® Custom Design: A (Short) TutorialJOSÉ G. RAMÍREZ, PhD, Industrial Statistician – W.L. Gore and Associates Inc.Most, if not all, industrial experiments face restrictions in randomization due to hard-to-vary factors of different sizes of experimental units. These situations induce what is called a split-unit, or split-plot structure. This structure must be taken into account when designing the experiment to reflect how the experiment will be run, and in the analysis to avoid making the wrong conclusions. JMP’s Custom Design is a very flexible and powerful platform that allows us to easily tailor the design to the experimental situation at hand. In this tutorial, I will give an overview of important things to consider when designing an experiment, like treatment and unit structure, as well as tips for how to easily recognize a split-unit structure. I will also walk you through the design of a split-split-plot experiment, exploring the unique Design Diagnostics of JMP’s Custom Design platform and some of its options, including Optimality Criterion, Simulate Responses and Advanced Options. If time permits, I will cover the analysis of split-unit experiments using the Fit Model and the Graph Builder platforms.
B U i L D i n g V 3 r D f L O O r 2 : 4 0 p . m .
Visual Six Sigma: Making Data Analysis Lean with JMP® 9PHILIP RAMSEy, PhD, Consultant and Educator – north Haven Group and University of new HampshireVisual Six Sigma (VSS) emphasizes the use of dynamic data visualization to accelerate the process of transforming data into sound business decisions. The analytic and graphical tools generally used in Six Sigma today have changed little since the introduction of Six Sigma in the late 1980s. In contrast, VSS seeks to leverage the powerful dynamic visualization and enhanced modeling capabilities in JMP in support of sound and timely improvements to business processes. In this talk, three case studies – drawn from health care, aerospace and manufacturing – will be used to demonstrate how VSS, paired with JMP 9, can make the process of identifying root causes and formulating effective solutions lean. In addition to illustrating the powerful interactive visualization capabilities in JMP 9, new features in the Partition and Neural Net platforms will be demonstrated.
B U i L D i n g f r O O M 1 0 1 2 : 4 0 p . m .
A Fresh Take on an Old Problem: Using Analytics to Gain new Insights into Ways to Reduce Fatal Motor Vehicle AccidentsJAnEL nIXOn, PhD, President and Founder – Integrative Engineering LLCEach year, 40,000 Americans die in motor vehicle crashes, making motor vehicle crashes the leading cause of death among Americans between the ages of 3 and 36. According to the U.S. Department of Transportation, the total societal cost of these crashes exceeds $200 billion annually. Despite these staggering statistics, many of these research efforts to date have failed to draw the sort of definitive conclusions that could potentially lead to beneficial policy changes or new regulation. Researchers have attempted to detect trends involving the driver’s age or gender, vehicle speed, time of day or month, or the weight of the vehicle. However, the primary shortcoming of these studies is that they all tend to view the vehicle in a vacuum – they look at the data associated with individual vehicles without accounting for the interaction that occurred between the vehicles that crashed with each other. This paper explores the hypothesis that individual vehicle characteristics are less important than the compatibility of the vehicles involved in the accident. It’s not so much the weight of a vehicle that’s important, but rather it’s

14
the discrepancy in weight, center of gravity, and the delta in bumper height between the involved motor vehicles. This paper demonstrates how JMP is used to test this hypothesis, and to finally detect a trend that provides some new and valuable insight into this problem. It also stands as a case study for how analytics can be used across organizations to guide policy-making and new regulation in a way that delivers the maximum benefit to society.
B U i L D i n g V 1 S T f L O O r 2 : 4 0 p . m .
Accelerated Field TestingDEAnnA STARBUCK, MBA, Production Engineer – Aera Energy LLC MARIA WEESE, PhD, Co-Author – Miami UniversitySTEVE FOX, Co-Author – Aera Energy LLC
HOPE Theory and JMP® Software for Robust DesignTAKEnORI TAKAHASHI, PhD, Professor – Keio University Nowadays, robust design is an indispensable tool for manufacturing. Until recently, the Taguchi method has been mainly used for it. However, this paper proposes Hyper-structure Optimization for Prospective Engineering (HOPE). Signal-to-noise ratio (SNR) solution drawn from the Taguchi method is included as a special case solution in HOPE theory. By using the same crossed array experiment data, multiple reasonable solutions are created by HOPE theory, while an SNR solution is obtained uniquely by using the Taguchi method. All of the solutions are candidates for the final solution and, therefore, the reproducibility has to be examined by confirmation run. The final solution is selected from confirmed candidates whose reproducibility is clearly proven. The combination of JMP and HOPE software, which is a JSL application for JMP 8, is developed for both methods, and it enables us to perform robust design and the confirmation of reproducibility easily and quickly. It is new software based on JMP 8 and is developed in cooperation with Takahashi and SAS Japan. Many advantages of HOPE theory are demonstrated by examples of paper helicopter designs, which are used as an educational exercise worldwide. Education and implementations of HOPE theory are held in many Japanese enterprises. The presentation will demonstrate use of this software in real, successful cases.
B U i L D i n g V A U D i T O r i U M 4 : 0 0 p . m .
Classical Design Structure of nonregular Designs from the Custom Design PlatformMARK JOHnSOn, PhD, Professor – University of Central Florida BRADLEy JOnES, PhD, JMP Principal Research Fellow and Co-Author – SAS Custom Design in the DOE platform of JMP produces nonregular designs with desirable projection properties (Leoppky, Sitter and Tang, 2007). Jones and Montgomery (2010) further investigated nonregular designs to identify designs that allow for unambiguous estimation of main effects and a few two-way interactions. Adoption of these partially confounded designs by a statistical community accustomed to fully confounded designs could be enhanced by demonstrating their classical design features. For example, the recommended nonregular design for six factors in 16 runs can be shown to arise from 24 full factorial in factors A, B, C and D with additional factors introduced via the generators E = ½(AC+BC+AD-BD) and F = ½(-AC+BC+AD+BD) to yield the principal fraction. The remaining 26 two-level, non-regular orthogonal designs for 6-factors in 16 runs will be examined from the classical design perspective. Finally, an example involving the design of an experiment to assess arson fire patterns will be described in which the aforementioned nonregular design is ideally suited.
B U i L D i n g V 3 r D f L O O r 4 : 0 0 p . m .
It’s not What the Community Can Do for Us, It’s What We Can Do for the CommunityMARTIn OWEn, Manager, Chemical Development – GlaxoSmithKline“It’s not what the community can do for us, it’s what we can do for the community.” My intent is that this presentation is a continuation of a conversation, rather than a monologue. At the 2009 Discovery Conference and Innovators’ Summit in Chicago, my world was illuminated by the quality of the “big ideas” within the JMP community. But ideas are not enough. Innovation needs to be Developed, and others Empowered to Apply these ideas in a Sustainable way to add value. I intend to discuss “light-switch moments” and how they relate to the experimental design activities I’ve been involved with in the past and the Quality by Design activities that I am developing for GSK’s future. I will take you through the IDEAS journey – describing how to Innovate Develop Empower Apply Sustain – sharing the challenges of how we are using JMP software and working with the JMP community to accelerate our path along this journey.
Tuesday, September 14
BREA
KOUT
SES
SOnS

15
Tuesday, September 14
B U i L D i n g f r O O M 1 0 1 4 : 0 0 p . m .
JMP® on the Trail! Wildlife Detection Using FootprintsZOË JEWELL, VetMB; SKy ALIBHAI, DPhil, Project Co-Leaders – WildTrack2010 is the United Nations International Year of Biodiversity. We rely on the diversity of life to provide us with food, fuel and medicine, yet our activities are causing biodiversity to vanish at unprecedented rates. Twenty-five to 36 percent of mammal species are now in danger of extinction, and with them these resource-rich ecosystems. WildTrack (www.wildtrack.org) is working with JMP software to develop a footprint identification technique (FIT) which is helping to address this crisis. It’s a whole new approach to wildlife monitoring. Based on the ancient art of animal tracking, FIT distills traditional animal tracking skills into a robust scientific tool for endangered species conservation. We have more than 20 different species and project partners around the world. Our data have three levels of complexity: •Eachspecieshasuniquefootgeometry. •Eachindividualwithinagivenspecieshasauniquefootprint. •Eachtimeanindividualplacesitsfootitleavesbehindauniqueprint. Using JMP software, FIT extracts and distills data collected from footprints to identify animals at the species, individual, age-class or sex levels, with high accuracy. We will present the inspiration behind FIT and describe data collection in field situations ranging from work with the black rhino in the African bush to the polar bear in the Arctic tundra. We will show new developments in image-capture developed with tigers in North Carolina, and new techniques in image-manipulation in JMP. We will demonstrate statistical verification of FIT using multidimensional scaling and bagged prediction models in JMP.
B U i L D i n g V 1 S T f L O O r 4 : 0 0 p . m .
Using JMP® Scripts to Generate an SPC Dashboard with OBDC LinkGREG FLEXMAn, Process and Risk Analysis – Talecris BiotherapeuticsAs paper measurement and recording systems are replaced by advanced monitoring and electronic databases, there has been a proliferation in the amount of data generated and collected. The evolution and application of analytical tools to review this accumulation of data has in some cases lagged behind the volume of data collection. As the complexity of the technology required to archive and manage the volumes of data increases, the process owners can be left without a clear window into actionable understanding. Specialized software tools that are capable of consolidating and analyzing data from such reservoirs can require significant capital investment to implement and interpretation can be daunting for the non-analyst. The example JMP scripted application demonstrates how these issues were addressed in a cost-effective manner by developing a graphical SPC dashboard that was linked via OBDC to a data collection system. This enables the distribution of basic process monitoring tools broadly in the organization, allowing production and quality personnel to monitor operations more efficiently and frequently. The graphics were designed to be rapidly, visually interpretable and utilize a combination of SPC charts. This tool was developed without capital investment or external resources, and may be applied across all of the attributes that are archived in this system. The presentation will review not only the overall scripting architecture and graphical features employed, but the business factors related to process monitoring and deployment of a scripted analytic tool within an organization.
JSL to the Rescue: Coping Strategies for Making Sense of Real-Time Production Data in Vaccine ManufacturingAnDREA COOMBS, MS, Operations Research Analyst – Emergent BioSolutionsEmergent BioSolutions Inc. is a biopharmaceutical company that manufactures BioThrax® (Anthrax Vaccine Adsorbed), the only vaccine approved by the US Food and Drug Administration for the prevention of anthrax infection. BioThrax® production includes a two-stage fermentation of a non-virulent strain of Bacillus anthracis. In-line turbidity, temperature, and pH probes are used to monitor the fermentation process and real-time data can be viewed remotely and is available for analysis. JMP has been used to create a customized workflow to summarize data from multiple production trains. A “super” journal is the command central of this customized workflow that contains JSL scripts to access, process, track and analyze data. Central to this workflow are scripts to process real-time data into meaningful variables critical to the process, verify variables to ensure accuracy, and dynamic handling and visualization of data. As a result, an overwhelming amount of real-time production data has been summarized into the key variables that have been used to monitor, characterize and improve the fermentation process.

16
Tuesday, September 14
SUMMIT SOIRÉE
Refine your analytic craft. Analyzing your data is an art. You begin with volumes of raw data, sometimes as unrefined as a block of stone, a lump of clay, a ball of yarn or
an empty canvas. You chip away at the data, shape the relevant bits and pieces, weave together the meaning and display the significance for
others to see.
And that is why the Nc Museum of Art (NCMA) offers a backdrop befitting our Summit Soirée. This is where we will collaborate across
disciplines to share techniques and visually communicate our analytic results, and where artists, designers – even environmental scientists –
from many nations have come together to display their visions in a variety of media.
Both a space for quiet contemplation and active engagement, NCMA represents dichotomous worlds. The Rodin Court and Garden is the
largest collection of sculpture by Auguste Rodin in the southeastern United States, a restful oasis of reflection in the midst of our busy, modern
world. More than 12 monumental works of art decorate the 164-acre Museum Park, creating a diverse landscape of environmental systems
and man-made art.
For example, Askew, by the internationally acclaimed artist Roxy Paine, is a stainless steel, treelike “dendroid,” a juxtaposition of nature and
industry. Built in sections over the course of a year, it reaches to the height of the newly renovated museum. It is our hope that you will draw
inspiration from our Summit Soirée and other events of the week to refine your analytic craft, sending your work to new heights.
n C M U S E U M O f A r T 6 : 3 0 – 9 : 3 0 p . m .
SUM
MIT
SOI
RÉE
/ PLE
nAR
y TA
LKS
17
Wednesday, September 15
B U i L D i n g V A U D i T O r i U M 8 : 4 5 a . m .
PETER REICH, PhD, Regents Professor and Distinguished McKnight University Professor, University of Minnesota
Peter Reich is Regents Professor and Distinguished McKnight University Professor in the University of Minnesota’s
Department of Forest Resources. His teaching and research focus on ecology, global change and the sustainability
of managed and unmanaged terrestrial ecosystems. He is the 2009 recipient of the international BBVA Foundation
Frontiers of Knowledge Award in Ecology and Conservation Biology for work that “radically improves our
understanding of and ability to predict terrestrial ecosystem … responses to global environmental change,” including
climate change and biodiversity loss. The author of more than 300 peer-reviewed articles, Reich is one of the 10
most frequently cited ecological and environmental researchers in the world. He has presented at some 200 conferences around the globe.
From Simple Traits to complex Systems: What Do the Humble Plant Leaf and ‘Advanced’ Human Societies Tell Us About the Future of Planet Earth?The world is dynamic and ever changing. New technology and geopolitical cooperation offer opportunities for people to be better stewards of the intertwined ecology and economy of the planet. However, the challenges grow greater as human consumption and pollution continue to strain the capacity of the land, oceans and atmosphere to provide the ecosystem services we so depend on, such as clean air and water; food, fiber and fuel; and climate regulation. We’re not going to solve things overnight, but we need to start now. To begin the story we focus on the humble leaf and ask what it can tell us about human impacts on forests, grasslands, and croplands, and in turn the impacts of those changes on the provisioning of ecosystem services to human societies. Understanding the “hard” science of nature is necessary but insufficient: it is human nature – as individuals, communities, corporations and nation-states – that will dictate whether we act soon (enough) rather than later. Developing coupled human-natural systems that simultaneously meet our needs for economic advance while maintaining environmental quality is an enormous challenge – and one we have not yet met. This will require scientists, policymakers, business leaders and society at large to work together in new ways, and require decision-making capacity that does not exist at present.
B U i L D i n g V A U D i T O r i U M 1 0 : 1 5 a . m .
KAISER FUnG, MBA, Statistician, Sirius XM Radio and Author, Numbers Rule Your WorldKaiser Fung is a professional statistician with more than a decade of experience applying statistical methods to unlocking
the relationship between advertising and customer behaviors. He leads a team of statisticians at Sirius XM Radio that
is responsible for gleaning insight into customers and operational best practices. His blog, Junk Charts, pioneered the
critical examination of data and graphics in the mass media. He is also author of Numbers Rule Your World: The Hidden
Influence of Numbers and Statistics on Everything You Do. Fung is a fellow of the Royal Statistics Society and an adjunct
professor at New York University, where he teaches practical statistics to professionals. He holds an MBA from Harvard
Business School, in addition to statistics and engineering degrees from Princeton and Cambridge universities.
What Happens After the Math Is Done?The phenomenal recent success of the Freakonomics and Malcolm Gladwell franchises, and their offshoots, has sparked unprecedented curiosity in the analytics profession. Not long ago, business executives tended to see us as technocrats speaking an abstruse lingo engaged in niche activities with uncertain effects: smart, intimidating, hard to grasp, lost in details. Times are changing. Best-selling authors have demonstrated how to use low-density, soft-touch narratives to convey analytical results to broad audiences. They imagine the analytics professional as a kind of intellectual hero, wielding data as weapons against conventional wisdom. The common structure of these stories follows the well-known analytical process, beginning with defining the research question and ending with discovering the correct answer. All this is masterfully told, but represents only half the story. In my experience, the analytics job is less a solitary struggle for the scientific truth than a managerial challenge in balancing objectives, facilitating collaboration and creating consensus. In this talk, I will tell the second half of
the story, using materials from my recently published book, Numbers Rule Your World. The focus is on what happens after the math is done.

18
Wednesday, September 15
B U i L D i n g V A U D i T O r i U M 1 : 2 0 p . m .
Exploring nFL Data with JMP®
BRADLEy BURCH, Founder – nFL Data Visualization (nFLDV)The National Football League (NFL) is more popular than ever before. NFL fans and analysts thirst for more information about the performance of their favorite teams and players. There are hundreds of websites that specialize in providing users with tabular data, all similar in format and content. But the NFL fan deserves more. NFL Data Visualization uses JMP to analyze large amounts of NFL historical data for the purpose of visually displaying correlations between offense, defense and other categories normally consumed in tabular formats. Sophisticated outputs such as bubble plots, contour maps, overlay plots, tree maps – and many other JMP visualizations – allow NFL fans to discover trends and performance measures in new ways. JMP has revolutionized the way the non-statistician NFL fan can now consume football statistics and analyses. Now that sounds like fun!
B U i L D i n g V 3 r D f L O O r 1 : 2 0 p . m .
Information Visualization and Visual Data Mining with a Focus on new Graphic Tools Using Both JMP® and SAS® for Mortgage FraudAnDERS HASSELROT, PhD, Data Mining Manager – Lloyds Banking Group DAnIEL KEIM, PhD, Professor and Head of the Data Analysis and Visualization Research Group, Department of Computer Science – University of KonstanzMATTHIAS SCHAEFER, MS, Co-Author, Department of Computer Science – University of KonstanzNever before in history have data been generated at such high volumes as today. Exploring and analyzing the vast volumes of data becomes increasingly difficult. Information visualization and visual data mining can help to deal with the flood of information. The advantage of visual data exploration is that the user is directly involved in the data mining process. There are a large number of information visualization techniques that have been developed over the last decade to support the exploration of large data sets. In this paper, we propose a classification of information visualization and visual data mining techniques, which is based on the data type to be visualized, the visualization technique, and the interaction and distortion technique. We demonstrate the classification using a few examples, most of them referring to techniques and systems presented in this special issue.
B U i L D i n g f r O O M 1 0 1 1 : 2 0 p . m .
Identification of Rogue Tools and Process Stage Drift by using JMP® Software Visualization and Analytical Techniques JIM nELSOn, Engineering Data Specialist – Freescale SemiconductorThe making of integrated circuits (computer chips) takes hundreds of very exacting series of steps. Hundreds of different pieces of equipment are used within those steps. Process drift and yield drops are a feared fact of life in the semiconductor industry. Identification of which process steps and/or tool or combination of tools contributed to the process drift or yield drop is a time-consuming and complex process, taking up a considerable amount of the engineers’ time within Freescale. A combination of JMP software-delivered analytical tools, Freescale-developed statistical methodologies and Freescale-developed analytical and visualization JMP scripts is being used to solve these issues. This paper describes the use of partitioning, a Freescale-developed methodology, Step Origin of a Drift Analysis (SODA), and two Freescale-developed JMP software scripts. The scripts allow for ordering of the charts and graphs based upon statistical evaluation along with the ability to move from chart to chart very quickly. This methodology allows for a very positive combination of analytical guidance, coupled with tools that provide the engineers with visual evidence to match their knowledge and experience in making decisions on what needs to be done to bring the processes back into alignment.
B U i L D i n g V 1 S T f L O O r 1 : 2 0 p . m .
Gillette – The Best a Man Can Get. Let’s Discover How JMP® Helps you Get the Best Shave in the Morning.ELISA BOnVInI, PhD, Statistician – Procter & GambleEveryone knows Gillette and its famous slogan – The Best a Man Can Get. But how do we make sure we deliver on the promise? Although one might not see it, there are a lot of science and technologies behind those blades. And a lot of variables too. Together they play an important role in delivering a close and comfortable shave to men all over the world. At Gillette we are increasingly using JMP and the design of experiments (DOE) platform to model both technical data and consumer responses. We start from technical DOE, where we optimize our settings to achieve the optimal performance. Once we identify our best players, we then use DOE to understand consumers’ reactions and preferences. And this continuous iterative process is used alongside the product development journey, as we make our products better and better. Case study: the latest augmented design to understand consumers’ responses to various blade geometry options.
BREA
KOUT
SES
SOnS
19
Wednesday, September 15
Application of JMP® and Design of Experiments to Security System Technology TestingKIM MITCHInER, PhD, Principal Member of the Technical Staff – Sandia national Laboratories, Albuquerque, nMARTHUR P. HEATH, MS; THOMAS K. MACK; LARRy D. MILLER, MS; CARMELLA A. VAROZ, MS, Co-Authors – Sandia national Laboratories, Albuquerque, nMJMP and design of experiments (DOE) have been successfully applied to security system technologies from sensors to communication and display systems. In all cases, the technologies have been complex enough to warrant the need for a statistical determination of significant factors and/or the generation of predictive models. For the sensors, it was the task of calibrating a fiber optic intrusion detection sensor (FOIDS) with 32 adjustable settings. In addition to the numerous settings, the FOIDS also had two software processors for detecting different types of alarms. The problem was made more complex when the different types of alarms occurred on the wrong processors, causing nuisance alarms. JMP’s ability to optimize several predictive models simultaneously with JMP’s Prediction Profiler Flash files was an important factor in producing field solutions. For the Communications and Display testbed system, numerous hardware and software network components had been integrated to build a functional system. Although the components of the system had been tested individually, the system’s performance could not be piecewise evaluated. Through the application of JMP’s design of experiments and data mining capabilities, it was possible to test some of the factors affecting the system’s performance and to differentiate between some of the software and hardware contributors. This paper will discuss design of experiments and the JMP tools applied to the solutions for both security systems.
B U i L D i n g V A U D i T O r i U M 2 : 4 0 p . m .
Making the Most of the new Mapping Features in JMP® 9XAn GREGG, Software Development Manager – SASAfter touching on map visualizations prior to JMP 9, which involve custom graphics scripts, we explore the new mapping features in JMP 9 in depth. We cover the basic uses for maps that JMP 9 supports: providing context for geographic data and showing a measure that varies by map region (choropleths). Finally, we demonstrate JMP 9’s ability to import ESRI SHP files and use custom maps. Along the way, we invite discussion on the role of mapping visualizations in general. Where do they provide insight, and where do they lead to distortion?
B U i L D i n g V 3 r D f L O O r 2 : 4 0 p . m .
Data Mining for Vaccine ManufacturingJULIA O’nEILL, MS, Principal Engineer – Merck & Co. Inc.Vaccine manufacturing is a complex biological process composed of many steps carried out over months or even years. Hundreds of raw material characteristics and process variables are monitored for every lot. Although the final vaccine product is well characterized and controlled, identifying the root causes of variation in the intermediate bulk material is extremely challenging. Teams of engineers, statisticians and scientists have begun to apply and develop data mining techniques to overcome these challenges. CUSUM sequence plots, partial least squares (PLS) regression and random forests have proven extremely valuable in recent projects. These data mining methods have set a new standard for vaccine root cause investigations within Merck. Their effectiveness will be illustrated with a case study.
B U i L D i n g f r O O M 1 0 1 2 : 4 0 p . m .
A Virtual Laboratory System for Tire CompoundingCRAIG BURKHART, PhD, R&D Associate, Global Materials Science – The Goodyear Tire & Rubber Company PHILIP BROWn, MSc, Senior Applications Developer – Predictum Inc.Goodyear has used nonlinear modeling methods for tire rubber compound property prediction for more than 20 years, but their use was limited. The roadblocks preventing widespread use of such models have been due, in no small part, to the lack of DOE (design of experiments), analysis, data mining and visualization tools integrated with these models. Integrating JMP with SAS has allowed Goodyear to replace an old, obsolete system with a modern, standards-based, full-featured system. Goodyear materials scientists have thousands of formulary ingredients to consider when designing a new rubber compound. With the new JMP and SAS system, a friendly and dynamic user interface allows compounders to import compound formulations, develop variants of previous compound recipes, model them under SAS and evaluate the properties of these models using JMP’s modeling and visualization tools. All of this is done in the virtual world, allowing Goodyear compounders to fully consider potential recipes before producing them in the lab for physical evaluation. Goodyear now explores more possibilities in less time and with fewer resources, thereby accelerating and enhancing compound development by improving speed-to-understanding.

20
B U i L D i n g V 1 S T f L O O r 2 : 4 0 p . m .
DOE and Green TechnologyVInCEnT WInGATE, Associate Director of Upstream Process Development and Plant Biology – Biolex TherapeuticsLynn DICKEy, PhD; JEFF REGAn, Co-Authors – Biolex TherapeuticsBiolex Therapeutics uses a novel biomanufacturing platform (LEX SystemSM), the aquatic higher plant Lemna minor, genetically engineered to produce recombinant biopharmaceutical proteins. We use a small-scale process model to optimize critical factors to maximize the yield and quality of recombinant biopharmaceutical proteins. Using design of experiments (DOE) capabilities in JMP, we will discuss what data is required prior to setting up a DOE and how to set up a custom DOE and analyze the data. Using the small-scale model, we will discuss how we identified and optimized critical parameters and optimal ranges (both for environmental and media components) that affect the yield and quality of several different therapeutic proteins and how we used Failure Mode Effects Analysis (FMEA) to determine the effect of potential failures in critical upstream parameters on the therapeutic protein yield and quality measured responses and to assess the relevance of the small-scale process model to the large-scale production process and equipment.
It’s Easy Being Green: JMP® for Building Energy Modeling DAnIEL ARnEMAn, PhD, Environmental Analyst – University of north Carolina at Chapel Hill JAMES McADAM, PE, Co-Author – University of north Carolina at Chapel Hill Building energy efficiency is receiving more attention as a cost-effective way to cut fuel consumption and greenhouse gas emissions, but efficiency advocates face one small problem: measuring what didn’t happen. Savings and return on investment calculations are based on avoided cost, and it’s difficult to know just how much energy a building might have consumed if left to business as usual. Standard methods often compare to previous billing cycles, but ignore the effects of weather or other mitigating factors. More nuanced engineering models are time-consuming, and are often too complex for the average stakeholder to implement and understand. This paper establishes a simple weather-based model in JMP that can predict building energy consumption from easily obtained monthly billing data. The models are highly visual, easily understood and can be used to quickly calculate cost, energy and carbon savings. The University of North Carolina at Chapel Hill is now using JMP to monitor and verify its Energy Conservation Program for an 18 million square foot campus, with a projected savings of more than $3 million and 50,000 tons of greenhouse gases per year.
B U i L D i n g V A U D i T O r i U M 4 : 0 0 p . m .
A Comparison of the neural Platform Across JMP® 7, 8 and 9PATRICK BILTGEn, PhD, Senior Principal Systems Engineer – BAE SystemsThe JMP Neural platform has evolved significantly since its introduction in JMP 6 and is used heavily in the aerospace and defense simulation community to approximate high-fidelity complex systems simulations. This paper will review and compare neural network models across common data sets created in the last three versions of JMP and comment on the improvements and advancements of this tool set for complex systems designers. By comparing goodness-of-fit statistics, ease of creation and flexibility to address multiple complex models, the author will evaluate the utility and flexibility of the latest neural platform and demonstrate how JMP 9 can be used to analyze and visualize the results of complex simulations. Examples will include large agent-based simulations and models with mixed continuous and discrete variables. The presentation will also demonstrate the use of the Prediction Profiler with multiple neural equations and the use of the Simulator to rapidly flood a large design space with many points to enable “inverse design” for capability-based analysis.
B U i L D i n g V 3 r D f L O O r 4 : 0 0 p . m .
Pulmonary Embolism Classification Using CT Images (and JMP® Pro!)MARIE GAUDARD, PhD, Consultant – north Haven GroupThis talk explores some of the new advanced predictive features of JMP Pro Version 9 in the context of a medical data mining application. Bootstrap forests and neural nets, as well as other techniques and the use of JMP Scripting Language, are employed in an effort to identify pulmonary embolisms using three-dimensional computed tomography (CT) data. The data we use for our training and validation sets formed the basis for the 2006 KDD (Knowledge Discovery and Data Mining) Cup competition. These data present interesting challenges: sparse and noisy data, multiple regions associated with a single pulmonary embolism, a spatial structure within patients, and non-traditional measures of sensitivity. We develop predictive models using the training data, choose a final model and apply that model to the separate test set in order to assess its performance.
Wednesday, September 15
BREA
KOUT
SES
SOnS

21
B U i L D i n g f r O O M 1 0 1 4 : 0 0 p . m .
On Enhancing JMP’s Visual Analytics Using JMP® Scripting Language (JSL)THERESA UTLAUT, PhD; GEORGIA MORGAn, MS, Statisticians – Intel CorporationJohn Tukey said, “The greatest value of a picture is when it forces us to notice what we never expected to see.” Arguably, JMP’s preeminent feature is the ease with which its users can quickly and easily create informative graphics that allow us to see what we may or may not have expected. The ability to create informative and decision-worthy graphics is especially important currently, when data are increasing in complexity and volume at a rate that is difficult to comprehend. In an article in The Economist (February 2010), it was estimated that mankind will create 1,200 exabytes (1018 ) of digital data this year. The data deluge is in full swing! The visual tools provided by JMP facilitate our effort to extract information from data, but customization is often needed when faced with complexity and volumes of data. With the additional benefit of JMP Scripting Language (JSL), the visual analytics can be improved for the problem at hand and our work made more effective. This paper will present examples that demonstrate the use of JSL to enhance JMP’s visual analytics and streamline the analysis process.
B U i L D i n g V 1 S T f L O O r 4 : 0 0 p . m .
Application of JMP® to the Analysis and Interpretation of Sensory and Consumer Data
BREnT GInn, PhD, Senior Scientist – The JM Smucker CompanyOne of the most valuable features of JMP is the ability to visualize complex data and statistical analysis in a very efficient manner. This visualization not only is valuable for the researcher, but also for management because it helps the researcher communicate information as relevant business concepts. One such area for CPG (consumer packaged goods) companies where this is highly valuable is the analysis and interpretation of sensory and consumer data. This paper presents the application of JMP to the analysis, interpretation and visualization of such data.
Visual Tolerance Analysis for Engineering OptimizationZHOU WEI, MS, JMP Principal Consultant – SAS Institute (Beijing) Co. Ltd.Classic methodologies of design of experiments (DOE) are widely applied in design, manufacturing, quality management and so on. However, this is not the end of DOE. One of its shortcomings is a neglect of the propagation of errors, which means that the so-called “improved process” still produces some amount of defects continuously. Visual tolerance analysis is a good way to overcome the obstacle, and it effectively complements classic DOE, perfecting the final feasible solution. First, this paper briefly introduces the background and study value of tolerance analysis. Then, it highlights visual tolerance analysis, which features “Defect Profiler” and “Defect Parametric Profile,” two new visualization techniques. With the help of visual tolerance analysis, engineering and statistical analysts could work together to find out what is the key factor leading to propagation of errors and how to reduce it significantly and cheaply. Additionally, to improve analysis efficiency for statisticians and to ease understanding for non-statisticians, a related example with JMP software is illuminated to show the power of this booming engineering optimization approach in the DOE family.
Wednesday, September 15
22
Wednesday, September 15
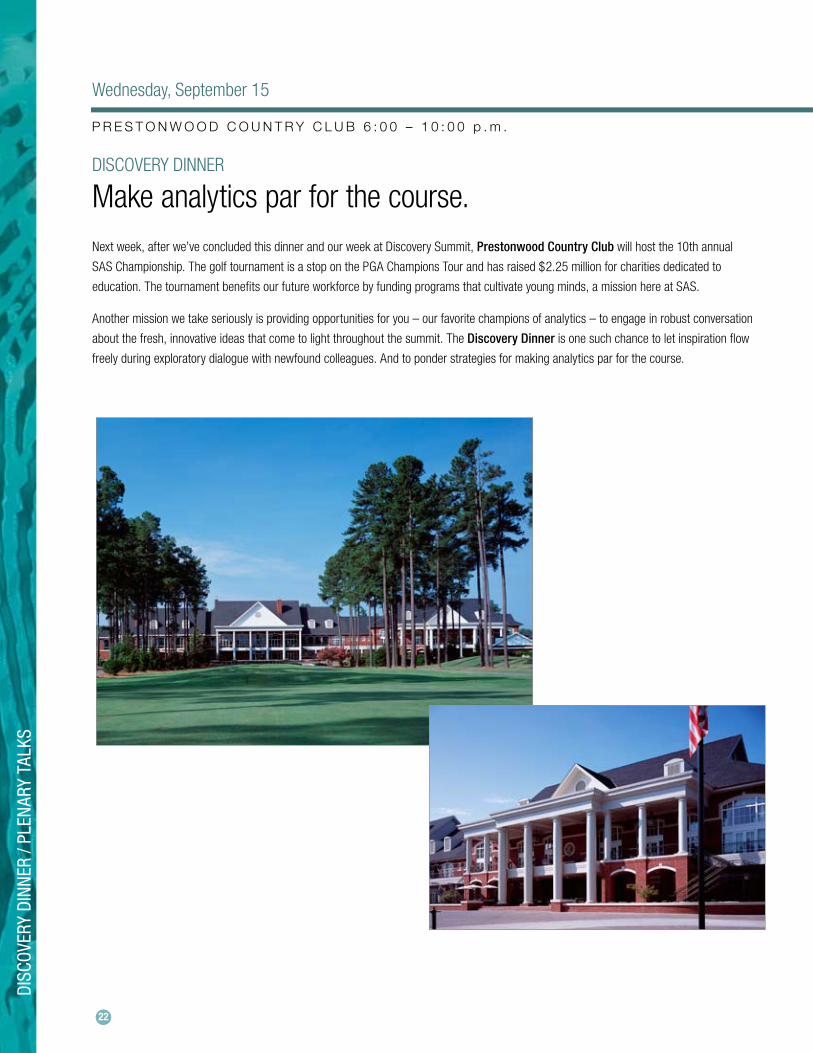
DISCOVERY DINNER
Make analytics par for the course. Next week, after we’ve concluded this dinner and our week at Discovery Summit, Prestonwood country club will host the 10th annual
SAS Championship. The golf tournament is a stop on the PGA Champions Tour and has raised $2.25 million for charities dedicated to
education. The tournament benefits our future workforce by funding programs that cultivate young minds, a mission here at SAS.
Another mission we take seriously is providing opportunities for you – our favorite champions of analytics – to engage in robust conversation
about the fresh, innovative ideas that come to light throughout the summit. The Discovery Dinner is one such chance to let inspiration flow
freely during exploratory dialogue with newfound colleagues. And to ponder strategies for making analytics par for the course.
P r E S T O n W O O D C O U n T r Y C L U B 6 : 0 0 – 1 0 : 0 0 p . m .
DISC
OVER
y DI
nnER
/ PL
EnAR
y TA
LKS

23
Thursday, September 16
B U i L D i n g V A U D i T O r i U M 8 : 4 5 a . m .
RICHARD D. DE VEAUX, PhD, Professor of Mathematics and Statistics, Williams College
Dick De Veaux is a Professor in the Department of Mathematics and Statistics at Williams College in Williamstown,
MA. An expert in applied statistics, his professional interests include data mining methodology and its application to
problems in science and industry, as well as model selection and other problems for large data sets. De Veaux holds
a doctorate in statistics and a master’s degree in education from Stanford University. A summa cum laude graduate
of Princeton University, he earned bachelor’s degrees in civil engineering and mathematics. De Veaux is a Fellow of
the American Statistical Association.
The Seven Deadly Sins of Data Mining – and How to Avoid Them
Every day, organizations accumulate data from a variety of sources. It’s the savvy organizations that fuel their strategic decision making
with insights from data mining. Through data mining, they are building predictive and descriptive models by uncovering trends and
patterns in vast amounts of data. But much can go wrong in the data mining process, even for trained professionals. De Veaux discusses
engaging case studies from a range of industries to illustrate the potential dangers and mistakes that can frustrate problem-solving and
discovery – and that can unnecessarily waste resources. Learn how to take advantage of data mining insights without committing the
“Seven Deadly Sins.”
B U i L D i n g V A U D i T O r i U M 9 : 4 5 a . m .
JEANNE G. HARRIS, Executive Research Fellow and Senior Executive, Accenture
Jeanne Harris is Executive Research Fellow and a Senior Executive at the Accenture Institute for High Performance in
Chicago. She leads the institute’s global research agenda in the areas of information, technology, analytics and talent.
In 2009, Harris received Consulting magazine’s Women Leaders in Consulting award for Lifetime Achievement. She
is the co-author of Competing on Analytics: The New Science of Winning (Harvard Business School Press, 2007),
which explains how high performance businesses are building competitive strategies around data-driven insights
that are generating impressive business results. Her new book, Analytics at Work: Smarter Decisions, Better Results
shows how organizations can create an analytical capability that enables them to routinely make better decisions in
every aspect of their business.
Analytics at Work: Secrets of Data-charged Organizations
The stakes have never been higher for managers to make better decisions. But despite massive amounts of data at their disposal, few
companies successfully leverage data to “out-think, out-smart, and out-execute” their rivals. A powerful new business tool – analytics –
is enabling many firms to aggressively leverage their data in key business decisions and processes, with impressive results. Drawing
upon insights developed for her new book, Analytics at Work: Smarter Decisions, Better Results, Harris will describe the elements
companies need to assess and build enterprise-wide analytical capabilities. Diverse examples from organizations including Best Buy,
Progressive Insurance, Harrah’s Entertainment, CEMEX, Netflix and the St. Louis Cardinals will illuminate how any organization can put
analytics to work.

24
B U i L D i n g V A U D i T O r i U M 1 1 : 0 0 a . m .
ANALYTIC EXCHANGE PANEL When individuals or departments use analytics effectively, the entire organization benefits. But how data-driven and innovative can
organizations be when analytic use becomes embedded throughout the enterprise? And how can analytic excellence spread throughout your
organization? Panelists will share stories of success you can repeat at your own workplace. You will gain insights that can help you influence
the adoption of analytics as well as technical advice about how to improve the economic value of analytic expertise by better partnering with
leaders inside your organization.
Moderator: MICHAEL SCHRAGE, Research Fellow, MIT Center for Digital Business
Panelists:RICHARD D. DE VEAUX, PhD, Professor of Mathematics and Statistics, Williams College
JEAnnE G. HARRIS, Executive Research Fellow and Senior Executive, Accenture
JULIA O’nEILL, Chemical Engineer and Statistician, Merck & Co. Inc.
Julia O’Neill is a chemical engineer, statistician and Master Black Belt who leads a response team in Vaccines
Product and Technology Operations for Merck. Her experience includes Adjunct Professor at Drexel University,
research manager, lab manager, quality consultant, research statistician and paper mill process engineer. She
is a Past Chair of the American Society for Quality Chemical and Process Industries Division and a member of the
Editorial Board of Quality Engineering.
TIM REy, Manager, Advanced Analytics Group, The Dow Chemical Company
Tim Rey graduated in 1979 with a Master of Science in forestry biometrics from Michigan State University. He
joined Dow in the summer of 1979 in the Math Applications group in Central Research as a research statistician.
While in the Math Applications Group, Rey conducted projects, consulted, taught and developed linear statistical
methods at most of Dow’s North American sites. He went on to supervise the Math Applications group in 1985,
and then to manage the Research and Technical Applications group in Central Research in 1987. In 1988, he took
the technical management role for the SimuSolv nonlinear simulation, optimization and estimation commercial
software development effort in Dow’s Central Research organization. Here he conducted joint research with
universities to develop nonlinear statistical methods for experimental design and maximum likelihood estimation. At that time he was
also responsible for Dow’s Quality program in Central Research. In 1996, Rey moved to Dow’s Marketing and Sales Expertise Center,
where he led the development of Dow’s Customer Loyalty program and was also the lead marketing research process owner. In 2005,
he became the manager of Dow’s Advanced Analytics group situated in Dow’s Six Sigma Expertise Center. Rey has written more than
100 internal papers and published 15 papers externally. He has delivered numerous talks at various quantitative methods forums.
Thursday, September 16
AnAL
yTIC
EXC
HAnG
E PA
nEL
/ POS
T-CO
nFER
EnCE
LUn
CH W
ITH
THE
DEVE
LOPE
RS
25
B U i L D i n g f C A f É 1 2 : 3 0 p . m .
POST-CONFERENCE LUNCH WITH THE DEVELOPERS
Software built with the customer in mind. Our talented team of developers is constantly enhancing JMP software, helping it evolve to meet new challenges in new arenas. We invite
you to take advantage of several opportunities throughout this summit to meet our developers. The Post-conference Lunch with the Developers
is a great way to wrap up the week and look to the future of JMP research and development. Is there a capability or feature that would enhance
your work? Let them know! Do you need to solve a problem that is eluding you? They’re ready for your toughest questions, so bring them on!
Thursday, September 16
Our Growing Product Family
Visual. Deep. Extendible. That describes JMP® statistical discovery software – a family of products that visually unveil the story
behind the numbers. Under the guidance of John Sall, the SAS co-founder who inspired the creation of JMP software and
remains its chief architect, our growing family tree has branched out in many directions. Yet each product remains connected
through interactive visualization capabilities that reveal context and insight impossible to see in tables of numbers. Discover:
• JMP®9, the newest version of JMP and the analytic hub for building and sharing custom applications that leverage your other favorite tools.
• JMP®Pro Version 9, providing powerful new capabilities designed for high-end analytics users who have large volumes of data and want to engage in exploratory data mining or need to do predictive modeling – as well as all the features in our standard version.
• JMP®Clinical, streamlining safety reviews of clinical trials data in ways that can shorten the costly drug development process– using JMP and SAS together.
• JMP®Genomics, the desktop solution for analysis and visualization of genomics data, combining the power of the JMP statistical discovery application with industry-leading SAS Analytics and customized applications tailored for vast genomic data sets.
• JMP®Student Edition, an easy-to-use, student-friendly version of JMP that provides all the statistics and graphics covered in introductory stats courses.

26
B U i L D i n g V M A i n S T r E E T
Discover Posters Featuring Forward-Looking ApplicationsJust as we hope you’ll spend time challenging our technical staff and planting seeds for future JMP features, we also hope you will spend time
with our poster presenters, learning about their forward-looking applications of JMP.
POSTER 1: Be customer Wise or Otherwise: combining Data Mining and Interactive visual Analytics to Analyze Large and complex customer Resource Management (cRM) Data Aditya Misra, Student – Singapore Management University
POSTER 2: Using JMP® Statistical Discovery Software to Answer a clinical Question Edward Dinovo, IT Consultant – Sepulveda Research Corp.
POSTER 3: Product Design Using JMP®: Solving a User complaint Chad Naegeli, Senior Design Engineer – Incisive Surgical Inc.
POSTER 4: Product Shelf-Life Extension Based on Statistical Analysis of the collected Stability Data Inna Ben-Anat, Process Engineer – Teva Pharmaceuticals USA
POSTER 5: Use of JMP® for High Explosive Formulation, Testing and Data Analysis Paul Anderson, Chemist – US Army ARDEC Picatinny Arsenal
POSTER 6: Multiple comparisons with JMP® Karen Copeland, Statistician – Boulder Statistics
POSTER 7: Using JMP® graphics to Explore Business Solutions Wenyu Su, Applied Statistician – The Dow Chemical Co.
POSTER 8: The Use of JMP® control charts for corporate customer Satisfaction Monitoring Sarah Travaglio, Net Promoter Score Manager – Asurion
POSTER 9: Risk and Return of Investments in Online Peer-to-Peer Lending Ram Gopal, Professor and Department Head – University of Connecticut
POSTER 10: Using Analytics to Reduce carbon Emissions and Save Trees Steve Fowler, Director of Continuous Improvement – First Solar Inc.
POSTER 11: Fun with Dialog Boxes and the JMP® Scripting Language Peter Mroz, Safety Data Programmer – Johnson & Johnson
POSTER 12: Salesforce Effectiveness at Sears: An Analytic Approach to goal-Setting Jason Chavarry, Senior Analyst, Operations and Analytics – Sears Holdings Corp.
POSTER 13: Measurement’s Effect on Manufacturability, Morale, customer Service, Progress Spiro Atieh, Quality Engineer – Specialty Silicone Fabricators
POSTER 14: The Role of Software in ‘International Statistical Standards’ Michele Boulanger, Senior Consultant – Johnson International Statistical Consulting Inc. and Laura Lancaster, JMP Software Developer – SAS
POSTER 15: JMP® Analytics Applied in Diagnostic Radiology and Neurosurgery Trauma Research Melvin Alexander, Operations Research Analyst – Social Security Administration
POSTER 16: Energy Reduction in glass Furnaces Using JMP® Rui Abreu, World Class Manufacturing Coordinator – Saint-Gobain Glass Portugal
POSTER 17: A comparison of Oil Well Disasters in the gulf of Mexico and Kuwait Alissa Anderson and Kristen Immen, Students – NC State University
POSTER 18: Acid Rain Emissions controls and Nc Water Quality Alissa Anderson and Kristen Immen, Students – NC State University
POSTER 19: Emissions Uncertainty: Focusing on NOx Emissions from combustion Sources Emily Wisner, Alissa Anderson, Colin Geisenhoffer, Brody Heffner and Michael Shaw, Students – NC State University
POSTER 20: Secondary Ozone Standard Christine Wu, James Kniffen, Elena Beckman and Steven Crenshaw, Students – NC State University
September 13 – 16
POST
ER P
RESE
nTAT
IOnS

Stop by the SAS Publishing and Education booths in Building V to learn about our winning combination of trusted analytics and resources
that will help you empower your organization.
What if you could � nd the sweet spot in your data by performing richer, more powerful and versatile analysis than ever before?
SAS and all other SAS Institute Inc. product or service names are registered trademarks or trademarks of SAS Institute Inc. in the USA and other countries. ® indicates USA registration. Other brand and product names are trademarks of their respective companies. © 2010 SAS Institute Inc. All rights reserved. 59150US.0710
You can with software, books, training, support servicesand online resources from SAS and JMP.
JMP® Statistical Discovery. From SAS.
Exploratory Data Analysis | Design of Experiments | Business Visualization | Interactive Data Mining
Visual Six Sigma | Modeling | Quality Improvement | Statistics | Analytical Application Development

Event Pick-Up Time From To
Monday, September 13
Floating Tea for First-Timers 3:45 p.m. Embassy Suites The Umstead
Floating Tea for First-Timers 5:45 p.m. The Umstead Embassy Suites
Reception and Supper at the Home of John and Ginger Sall 5:45 p.m. & 6:15 p.m. The Umstead Sall Residence
Reception and Supper at the Home of John and Ginger Sall 5:45 p.m. & 6:15 p.m. Embassy Suites Sall Residence
Reception and Supper at the Home of John and Ginger Sall 8:30 p.m. & 9 p.m. Sall Residence The Umstead & Embassy Suites
Tuesday, September 14
Breakfast/Registration Every 15 minutes from 6:45 a.m. – 8:15 a.m. The Umstead & Embassy Suites Bldg. V
Bldg. F Breakout 1:10 p.m. Bldg. V Bldg. F
Bldg. F Breakout 2:30 p.m. Bldg. V Bldg. F
Bldg. F Breakout 3:50 p.m. Bldg. V Bldg. F
Campus to Hotel 5:00 p.m. Bldg. F & Bldg. V The Umstead & Embassy Suites
Summit Soirée 6:15 p.m. The Umstead & Embassy Suites NC Museum of Art
Summit Soirée 9 p.m. & 9:30 p.m. NC Museum of Art The Umstead & Embassy Suites
Wednesday, September 15
Breakfast/Registration Every 15 minutes from 6:45 a.m. – 8:15 a.m. The Umstead & Embassy Suites Bldg. V
Bldg. F Breakout 1:10 p.m. Bldg. V Bldg. F
Bldg. F Breakout 2:30 p.m. Bldg. V Bldg. F
Bldg. F Breakout 3:50 p.m. Bldg. V Bldg. F
Campus to Hotel 5:00 p.m. Bldg. F & Bldg. V The Umstead & Embassy Suites
Discovery Dinner 5:45pm The Umstead & Embassy Suites Prestonwood Country Club
Discovery Dinner 9 p.m., 9:30 p.m. & 10 p.m. Prestonwood Country Club The Umstead & Embassy Suites
Thursday, September 16
Breakfast/Registration Every 15 minutes from 6:45 a.m. – 8:15 a.m. The Umstead & Embassy Suites Bldg. V
Conference Adjourns 12:30 p.m. Bldg. V The Umstead & Embassy Suites
Campus to Airport Every 30 minutesfrom 12:30 p.m. – 2:30 p.m. Bldg. V Raleigh-Durham
International Airport
Lunch with the Developers 12:30 p.m. Bldg. V Bldg. F
Lunch with the Developers 2:00 p.m. Bldg. F The Umstead & Embassy Suites
BUS SCHEDULE
Buses will return to Building v at the conclusion of each Building F breakout session.

SAS and all other SAS Institute Inc. product or service names are registered trademarks or trademarks of SAS Institute Inc. in the USA and other countries. ® indicates USA registration. Other brand and product names are trademarks of their respective companies. © 2010 SAS Institute Inc.All rights reserved. 59150US.0710
SAS® Business Analytics Software
Data Management | Analytics | Reporting | Targeted Business and Industry Solutions
You can. SAS gives you The Power to Know.®
SAS Business Analytics software helps organizations across every industry discover innovative ways to increase pro� ts, reduce risk, predict trends
and turn information assets into true competitive advantage.
www.sas.com/ROIfor a free special report
What if you could see up to a 400% ROI by using business analytics to achieve your goals?
Event Pick-Up Time From To
Monday, September 13
Floating Tea for First-Timers 3:45 p.m. Embassy Suites The Umstead
Floating Tea for First-Timers 5:45 p.m. The Umstead Embassy Suites
Reception and Supper at the Home of John and Ginger Sall 5:45 p.m. & 6:15 p.m. The Umstead Sall Residence
Reception and Supper at the Home of John and Ginger Sall 5:45 p.m. & 6:15 p.m. Embassy Suites Sall Residence
Reception and Supper at the Home of John and Ginger Sall 8:30 p.m. & 9 p.m. Sall Residence The Umstead & Embassy Suites
Tuesday, September 14
Breakfast/Registration Every 15 minutes from 6:45 a.m. – 8:15 a.m. The Umstead & Embassy Suites Bldg. V
Bldg. F Breakout 1:10 p.m. Bldg. V Bldg. F
Bldg. F Breakout 2:30 p.m. Bldg. V Bldg. F
Bldg. F Breakout 3:50 p.m. Bldg. V Bldg. F
Campus to Hotel 5:00 p.m. Bldg. F & Bldg. V The Umstead & Embassy Suites
Summit Soirée 6:15 p.m. The Umstead & Embassy Suites NC Museum of Art
Summit Soirée 9 p.m. & 9:30 p.m. NC Museum of Art The Umstead & Embassy Suites
Wednesday, September 15
Breakfast/Registration Every 15 minutes from 6:45 a.m. – 8:15 a.m. The Umstead & Embassy Suites Bldg. V
Bldg. F Breakout 1:10 p.m. Bldg. V Bldg. F
Bldg. F Breakout 2:30 p.m. Bldg. V Bldg. F
Bldg. F Breakout 3:50 p.m. Bldg. V Bldg. F
Campus to Hotel 5:00 p.m. Bldg. F & Bldg. V The Umstead & Embassy Suites
Discovery Dinner 5:45pm The Umstead & Embassy Suites Prestonwood Country Club
Discovery Dinner 9 p.m., 9:30 p.m. & 10 p.m. Prestonwood Country Club The Umstead & Embassy Suites
Thursday, September 16
Breakfast/Registration Every 15 minutes from 6:45 a.m. – 8:15 a.m. The Umstead & Embassy Suites Bldg. V
Conference Adjourns 12:30 p.m. Bldg. V The Umstead & Embassy Suites
Campus to Airport Every 30 minutesfrom 12:30 p.m. – 2:30 p.m. Bldg. V Raleigh-Durham
International Airport
Lunch with the Developers 12:30 p.m. Bldg. V Bldg. F
Lunch with the Developers 2:00 p.m. Bldg. F The Umstead & Embassy Suites

SAS and all other SAS Institute Inc. product or service names are registered trademarks or trademarks of SAS Institute Inc. in the USA and other countries. ® indicates USA registration. Other brand and product names are trademarks of their respective companies. © 2010 SAS Institute Inc. All rights reserved. 59150US.0710
What if you could achieve a gross revenue increase of 15% by putting your data into focus?
You can. JMP makes statistical discovery clear.
For 20 years, JMP software has been helping people visualize and analyze business data.
www.jmp.com/focus to see how one organization keeps costs down and services up with JMP
JMP® Statistical Discovery. From SAS.
Exploratory Data Analysis | Design of Experiments | Business Visualization | Interactive Data Mining
Visual Six Sigma | Modeling | Quality Improvement | Statistics | Analytical Application Development