exploratory analysis on heterogeneous tag-point patterns
TRANSCRIPT
Exploratory Analysis on Heterogeneous Tag-Point Patternsfor Ranking and Extracting Hot-Spot Related Tags
Massimiliano RuoccoNorwegian University of Science and Technology
Dept. of Computer and Information ScienceTrondheim, Norway
Heri RamampiaroNorwegian University of Science and Technology
Dept. of Computer and Information ScienceTrondheim, [email protected]
ABSTRACTThe availability of a huge amount of geotagged resources onthe web can be exploited to extract new useful information.We propose a set of estimators that are able to evaluate thedegree of clustering of the spatial distribution of terms usedto tag such geotagged resources. We introduce the conceptof tag point pattern to derive indexes from the exploratoryanalysis by taking advantage of the second order Ripley’s K-function, previously used in epidemiology, geo-statistics andecology. The derived model estimates the degree of aggre-gation of the geotagged resources, taking into account theheterogeneity of the spatial distribution of the underlyingpopulation. Further, thanks to subsampling techniques, ourapproach is able to handle large datasets. Without losingof generality, we perform our experiments on a dataset de-rived Flickr pictures, as a use case. This dataset consists oftags that were extracted from a set of 1.2 million of pictures.We evaluate our proposed indexes with respect to their abil-ity to extract tags related to geographical landmarks andhotspots. Our experiments show that we get good resultsusing our estimators.
Categories and Subject DescriptorsH.3.3 [Information Systems]: Information Storage andRetrieval—Information Search and Retrieval ; H.2.8 [DatabaseManagement]: Database applications—Data Mining,Spatialdatabases and GIS
General TermsAlgorithms, Experimentation
KeywordsSocial Media Mining, Geographic Information Extraction
1. INTRODUCTIONIn the recent years, the web has increasingly been popu-
lated with applications where a user or a photographer can
Permission to make digital or hard copies of all or part of this work forpersonal or classroom use is granted without fee provided that copies arenot made or distributed for profit or commercial advantage and that copiesbear this notice and the full citation on the first page. To copy otherwise, torepublish, to post on servers or to redistribute to lists, requires prior specificpermission and/or a fee.ACM SIGSPATIAL LBSN ’12, Nov. 6, 2012. Redondo Beach, CA, USACopyright 2012 ACM ISBN 978-1-4503-1698-9/12/11 ...$15.00.
upload and annotate different kinds of resources, includingpictures. These annotations are also called Tag, which areintended to describe and categorize, by collective user ef-forts, the uploaded resources. In many of these applica-tions, such as Flickr1 and Panoramio2, the user can add ageotag – i.e, the GPS position, to the resources. Often, thesetools also offer the photographers the possibility to includethe date of creation, and other metadata to their photos.And, in almost all cameras, this metadata are stored di-rectly in the EXIF file. As a result, we can associate tagswith related spatial distributions/positions from a collectivecontribution.
The exploration of the spatial structure of these tag dis-tributions, such as the clustering tendency can reveal someinteresting properties in the semantic of the tags – e.g., tagsbeing related to a landmark or a Point of Interest. How-ever, there are two most important challenges that we haveto tackle when exploring these spatial structures. First, wehave to deal with a large amount of data, thus resulting ina high requirement on scalability. Second, the underlyinggeographic distribution of the data in the dataset may notbe uniform. For example, for tagged pictures from Flickr,some areas may have a high number of pictures, while othershave a low number of pictures. Hence, the density of pic-tures over a specific region may not be homogeneous. Thismay, in itself, be a challenge, since it may cause difficultiesin capturing the clustering tendency.
To tackle these challenges we propose a method to de-rive optimal estimators from the second order Ripley’s K-function [22] (K-function for short). This is a function usedfor global test of clustering and quantifying the intensity ofspatial patterns at different scales. Using in a case studyanalysis, K-function allows us to analyse the spatial struc-ture and clustering tendency with respect to an underlyingpopulation with non-homogeneous intensity. Further, ourestimators measure the degree of aggregation of the spatialdistribution of picture tags on a geographical map. Thesekinds of indicators may, for example, be used as features ina query expansion framework, by including the spatial char-acteristics of a term. As shown later, in our experimentswe employ the estimators to extract tags that are related togeographical hotspots from a large set of geotagged picturesin Flickr.
In view of this, the main goal of this work is to propose amethod that is able to (1) define a set of estimators that canbe used to indicate the clustering tendency based on a given
1http://www.flickr.com/2http://www.panoramio.com/
spatial distribution, and (2) capture the spatial characteris-tics of the spatial distribution. Having a set of estimatorsthat are able to output a real value based on the cluster-ing degree of the tag point pattern may be useful not onlyfor extraction of landmark-related tags, but also for rankingand comparison of different tags.
To our best knowledge, exploratory analysis of tags as thishas not been done in depth as we do before. Previous worksuch as the one by Rattenbury et al. [21] has focused ondirectly extracting tags related to places, without consider-ing the information about the underlying spatial structure.Earlier, exploratory analysis was adopted in epidemiology[16] to test the existence of clusters of disease and in ecol-ogy [19] to understand the ecological process by studyingand characterizing the spatial structure of ecological data.Existing methods for evaluating significant clustering fromcases has been classified in two different families[25]: clusterdetection test and global test. The former, such as the ScanStatistic [15], are a family of clustering test able to localizesignificant clusters. The latter, such the diagnostics basedon the Ripley’s K-function [23], are generally used to evalu-ate if the spatial case tends to be located close to each other.Essentially, these methods assess the clustering tendency ofthe point pattern over the entire considered area.
In summary, the main contributions of this paper are asfollows. First, we propose a set of estimators to measure thedegree of aggregation of a spatial tag point pattern. Theseestimators are based on a stochastic model, considering theinhomogeneity of the underlying spatial distribution of thepopulation. Second, we derive our estimators from the ex-ploratory analysis to explore the spatial structures of a tagpoint pattern, previously used only in geo-statistics and epi-demiology. Third, we employ the proposed estimators toextract tag representing a landmark from a large datasetof more than 1 million of pictures. For each tag, we alsoassociate a value indicating the distance of maximum signif-icant clustering. Fourth, we perform extensive comparativeanalysis between the estimators and evaluate their efficiencywith respect to spatial tag pattern analysis.
The rest of the paper is organised as follows. In Section 2,we give an overview of the background theory underlyingour work and formulate our problem. In Section 3, we de-scribe our approach in more detail. In Section 4, we evaluateour approach and discuss the results from our experiments.To put our work in a perspective, in Section 5, we brieflysummarise existing work related to ours. Finally, in Sec-tion 6, we conclude the paper and discuss the directions forour future research.
2. PRELIMINARIES
2.1 Exploratory Analysis for Spatial DataOriginating from statistics and probability theory, Spatial
Point Processes are stochastic models for irregular point pat-terns [22]. A point pattern is here an unordered collection ofpoints in a specific area or a set. Formally, point processescan be defined as follows [22]:
Definition 2.1 (Point Processes). Let N be a ran-dom variable representing a counting measure and a subsetB ⊂ Rd, such that N(B) denotes the random number ofpoints in the sub-area B. Then, point processes can be de-
scribed by the number distribution given by:
P (N(B) = n), n = 0, 1, 2, ... (1)
Here, P (N(B) = n) is the probability that there are exactlyn points in the set B. It can be seen as an univariate dis-tribution, specifying that there can be infinitely many setsB, and that the probabilities can differ among these sets.Hence, there are infinitely many number distributions thatdescribe a point process.
Spatial point processes can be summarized by two dif-ferent families of characteristics: numerical and functional.The most important numerical characteristic for stationarypoint processes is the intensity λ, indicating the mean num-ber of points per a unit area. Important point-dependentfunctional summary characteristics include the nearest neigh-bour function such as the Ripley’s K -function K(h).
2.1.1 Distributions for CSR modellingA given spatial point pattern may exhibit different kinds
of interaction among its points. The point may, for instance,occur in clusters, exhibit regularity or be completely spa-tially random. The last property is called Complete SpatialRandomness (CSR). A theoretical model with this propertyforms an important basis for comparison, as a null modeland as a reference for summarizing characteristics of thepoint pattern.
Assuming stationary patterns and lack of interaction, com-pletely random processes can be characterised as PoissonPoint Processes. As a result, it is possible to decide whethera given pattern exhibits spatial clustering or regularity.
2.1.2 Poisson Point ProcessA suitable model for CSR hypothesis is given by a Poisson
Process. It models the completely randomness of a pointpattern with the following distribution of a random variableN :
P (N(A) = n) =λna(A)n
n!e−λa(A) (2)
We distinguish between two kinds of Poisson Point Pro-cesses, homogeneous and inhomogeneous. Homogeneous Pois-son point processes are processes where the intensity λ isconstant and determines the mean number of points foundin a unit area for any bounded set A. The Poisson distri-bution for a homogeneous Poisson Point Process N(A) withintensity λ and mean λa(A) is defined by Equation 2. Withinhomogeneous Poisson point processes, on the other hand,the constant intensity λ is replaced by an intensity functionλ(x) whose values varies with location x. This means thatan inhomogeneous Poisson point process is a specific case ofa homogeneous point process.
2.2 CSR TestCSR test, being a statistical hypothesis test, was origi-
nally used in epidemiology and in biostatistic to verify theexistence of spatial dependence of natural phenomena, mod-elled as point patterns. In general, the null hypothesis ofa CSR indicates that conditional on the N(A) number ofpoints in A ⊂ Rd, the points are independent and uniformlydistributed on the observed region A. In such a case, theCSR test is accepted and the point process may be modelledas a Poisson Point Process. In other words, a CSR test canbe seen as a central hypothesis separating events that do not

interact to each other either ”repulsively” – i.e., regularity ofpoints, or ”acctractively” – i.e., clustering of points.
2.2.1 The Null HypothesisTo test the CSR of a spatial point pattern N(A), A ∈ R,
the standard approach is to compare it with a complete spa-tial random process like the Poisson Point Process. The CSRhyphothesis for a spatial point pattern is the following [17]:”The number of points m in any planar region A follows ahomogeneous Poisson distribution with mean λa(A) wherethe expected constant intensity is λ”.
Here, the number of points m is an independent randomsample on A. This means that assuming we sample thepoints using a sampling window W , then any event has thesame probability to occur at any position in W .
Existing methods for testing the CSR hypothesis may bedivided in quadrat method, nearest-neighbour method suchas method of K-functions [6]. The quadrat method dividesthe sampling windows W in n square regions of equals area,named quadrats. Then, the randomness can be tested usingan index of dispersion test. The drawback of this procedureis that it strictly relies on the size of the selected square.Nevertheless, different types of index of dispersion trying toovercome this problem can be found in the literature [6, 10].Further, for each point of the pattern, the nearest neighbourmethods are based on the analysis of the similarity betweenthe considered point and the nearest neighbour in a win-dow W . Different statistics exist to test CSR Hypothesisbased on nearest neighbours. The most common are thoseproposed by Clark-Evans [5], Hopkins [11] and Byth-Ripley[3].
The drawback of these methods is that, since they arebased only on the the closest neighbour’s points, they areonly able to capture the smallest scale of the pattern, andthus the only smallest-scale clustering tendency.
In the family of nearest neighbour method, the K-functionovercomes these problems. We base our approach on thisfunction. The main advantages in using such a point pat-tern analysis based on K − function is that it takes intoaccount the scale effect and permit the exhibition of differ-ent structures at different scales.
2.2.2 K-function methodThe K-function method, also called reduced second mo-
ment order, was originally proposed in [22] for homogeneousand isotropic spatial point process over the whole space. Itconsiders randomly sampled cells of different size to analyseand summarize the characteristics of a point pattern. A K-function is specified as follows [22]. Let λ be the intensityas before, and assume λ is constant throughout R. Then,
λK(h) = E(#(points within distance h
from an arbitrary point)). (3)
In K-function analysis, the scales h is a fundamental vari-able. Equation 3 contains information about clustering anddispersion of the point patterns as function of different scalevalues of h. So, λK(h) represents the expected number of ex-tra points within distance h of an arbitrary point. Assumingan homogeneous and isotropic Poisson process, and a circu-lar area of radius h centred in the target event, λK(h) =λπh2 [22].
The most used estimation of the function K(h) has been
proposed in [22] as follows:
K(h) =1
λn
n∑i=1
∑i6=j
Ih(dij), (4)
where dij is the distance between i-th and j -th observedevents, Ih(dij) is an indicator which value is 1 if dij ≤ h and
0 otherwise, and λ = n/a(R).If we consider K(h) function of the Poisson point process
as benchmark, then we can use this estimation to test theCSR hypothesis. Further, if we assume independently dis-tributed points, Poisson distribution, and that the numberof events within distance h is λπh2, then K(h) = πh2. Con-sequently, the CSR test may be performed by comparingthe empirical K(h) with K(h). More specifically, K(h) >πh2 indicates some degree of clustering at scale h, whereasK(h) < πh2 indicates some degree of dispersion at scale h.
One of the main challenge with using the K-function esti-mator is that it must be compared with the curve obtainedfrom the null hypothesis of the Poisson pattern. Such acurve is normally a parabolic curve, making it less straight-forward to interpret. For this reason, Besag [2] proposed athe following L-function, which is easier to interpret:
L(h) =
√K(h)
π− h. (5)
As with the K-function, L(h) > 0 indicates clustering atscale h, while L(h) < 0 indicates dispersion at scale h.
2.3 Problem DefinitionOur target dataset is composed by geotagged resources,
annotated with tags. Without losing of generality, we con-sider a set D = {P1, ..., PN} of N pictures gathered fromFlickr. Further we assume that each picture Pi = {g, t, T}is associated with some metadata. This includes locationalinformation represented by a pair of real numbers of latitudeand longitude, g = (lat, lon), temporal information t repre-sented by the picture timestamp, and the set of tags, con-sisting of a collection of term T . Hence, it is safe to presumethat the pictures can be placed in a spatio-temporal domain,or bounded in a spatial area and a particular time slice. Wealso define a vocabulary of M tags V = {w1, ..., wM}, com-posed of all the social tags used to annotate the pictures inthe dataset D.
Considering the above pictures as our geotagged web re-sources that we analyse, we can model the spatial distri-bution of pictures taken in a certain geographical area as:
Definition 2.2 (Picture Point Processes). A Pic-ture Point Process is a Point Process, modelling the spatialdistribution of pictures taken in a 2-dimensional study re-gion R2. Any realization of the random variable modellingthe Picture Point Process is called Picture Point Pattern.
Therefore, for each term wi of the vocabulary V, we canconsider to have a set of Mwi points {s1w, ..., sMw} repre-senting the spatial distribution of the tag in the study region.Thus, we now get what we call Tag Point Pattern, formallydefined as follows:
Definition 2.3 (Tag Point Pattern). A Tag PointPattern Dwi is a subset of a Picture Point Pattern D. It iscomposed by the geographical position of the pictures anno-tated with the tag wi.

Figure 1: Spatial distribution of thepictures collected
Figure 2: A spatial zoom of the picturesdataset pattern
Figure 3: Spatial distribution of thepoint pattern related to the tag night
In view of this, the problem addressed in this paper isfinding a way to use the exploratory analysis of spatial datato derive estimators that are able to indicate clustering ten-dency of a tag point pattern with respect to a Picture PointProcess. In addition, we want to employ the proposed esti-mators to rank and extract social tags from the vocabularyV that are related to geographical hot-spots, landmarks orPoint-of-Interests.
3. RANKING AND EXTRACTING SPATIALHOT-SPOT TERMS
In this section we show how we can use our concept of tag-point pattern in spatial analysis to rank and extract termsrelated to geographical hot-spots.
Figure 1 and Figure 2 illustrate the spatial distributionsof the Flickr pictures in our dataset D, displayed on a map.As can be observed, the distribution over the geographicalspace is not homogeneous. Thus, the density λ for thesepictures is not constant but varies depending on a locationx. Recalling from our discussion in Section 2, this meanswe have λ(x) to denote the location-dependent density. Thereason is that the distribution follows the characteristics ofthe Flickr dataset, which is not homogeneous. Some regionsare highly populated in terms of number of taken pictures,while other regions are sparsely populated or not populatedat all. Knowledge about such population characteristics ishighly useful when analysing the pattern structures and clus-tering tendency.
In the following, we show how our tag pattern point analy-sis and our proposed approach can tackle the inhomogeneityof the picture population.
3.1 Case-Control AnalysisAs can be inferred from Section 1 our method has been
inspired by the case-control analysis from epidemiology [16],where the main ideas is to analyse and detect the concentra-tion of diseases based an underlying population. To be ableto a case control analysis, we need a diagnostic function.Thus, here we consider the diagnostic function Dwi(h) withrespect to the overall spatial distribution of pictures for aspecific tag wi. Since the overall distribution of the picturesis not homogeneous, some tag-point patterns may show ag-gregation properties, that only depend on the distributionof the population.
So, as defined in [8, 9], our diagnostic function Dwi(h)can be computed based on the difference between the K-function Kwi for the tag point pattern and the K-function
Kall for the pictures point pattern – i.e.,
Dwi(h) = Kwi(h)− Kall(h), (6)
where both Kwi and Kall are given by Equation 4. Thisalso means that a plot of Dw would depict the interactionbetween the tag-point pattern and the overall distribution ofthe pictures. And, for some values of h, Dw(h) > 0 indicatesaggregation in a circle within a radius h.
Normally, the significance of a case control analysis is eval-uated by calculating an envelope for the function. To dothis one can perform Monte Carlo test for null hypothesiswith N=99 realizations and α=0.05 confidence interval –i.e., 95% confidence envelope obtained by Monte Carlo sim-ulations. A p-value the test is obtained by estimation. Thistest calculates a maximum and minimum confidence basedvalues of the envelope for K(h), which can, in turn, be usedto test the clustering (the upper bound) or the separation(the lower bound) tendency of a point pattern. Note thatthe cost of this test step, especially the calculation of theenvelope, is quadratic, and is generally not suitable for largedatasets.
As an example, Figure 4 shows the use of the K-functionfor homogeneous point pattern as discussed in Section 2.2.2.Here, we calculated the K-function for the point pattern re-lated to the tag night (see Figure 3). As can be observedfrom this figure, the values of K(h) are greater than theupper envelope of the function related to the Poisson Pro-cess that we use as benchmark. This means that we havea clustering tendency of the point pattern for all the val-ues h. Note that since the tag night is a general tag, itstag point pattern follows the underlying distribution of thepopulation, thus showing aggregation itself, as depicted inFigure 3.
Figure 4: K-function for the tag point pattern related to thetag night
3.2 Proposed EstimatorsWe propose a method that is able to (1) tackle large set
of pictures – i.e., being scalable, (2) produce a real valueindicating the degree of aggregation, and (3) determine theradius with highest significant clustering tendency of the tagpoint pattern. As already mentioned, the main goal of ourmethod to produce a ranked list of terms based on theiraggregation capabilities.
Inspired by the sub-sample similarity hypothesis in [14,18], to estimate the envelope related to the confidence band
of Kall(h), we perform the following steps:
1. Obtain {D∗i }i=1...C , sub-sampling the control datasetD C-times.
2. Calculate the K-functions {KALL,i(h)}i=1...C for eachsub-sampled set D∗i .
3. Estimate the upper envelope as
KMAX(h) = max{Kall,i(h)}i=1...C (7)
4. Calculate the diagnostic function
Dwi(h) = Kwi(h)− KMAX,all(h) (8)
As can be inferred from this, we are only interested intag point patterns that show aggregation. This is why ourtest only considers the upper envelope K∗MAX(h), and not
K∗MIN (h) which gives a lower limit for testing the signifi-cance of the dispersion of a spatial point pattern.
So, once K∗MAX(h) is estimated, we propose the followingtwo estimators, to measure the aggregation capabilities ofthe tag point pattern:
ISUM (wi) =∑mk=1
[Dwi
(hk)√V ar(Dwi
(hk))
], and (9)
IMAX(wi) = maxk=1...L
[Dwi
(hk)√V ar(Dwi
(hk))
], (10)
where the extent of clustering is estimated by the maximumdistance and the sum of the distances from the upper enve-lope of the K-function for the population data.
More specifically, the estimator ISUM (wi) sums the dif-ferences between the two K-functions. A high value ofISUM (wi) indicates a point pattern showing strongly aggre-gation of the tag point pattern in relation to the underlyingpictures point pattern. This is because it covers a higherpositive area under the function Dwi(h). Further, the value
of the estimator IMAX determines the highest positive differ-ence between theK-function of the tag point pattern and thepictures point pattern over different scale values hkk=1...L.Thus, its objective is to give more importance on the maxi-mum distance between the two pattern points, over differentscales. In Section 4, we study the effects of using the twoproposed estimators in ranking of a list of tags.
In addition to these, we need to estimate the most sig-nificant scale value of the clustering tendency. This can bedone as follows:
hMAX = arg maxhk
D(hk)√V ar(D(hk))
(11)
It worth to note that the cost of estimating both estima-tors is suitable for large datasets, since for both ISUM and
ISUM , we can avoid using Monte Carlo estimation. In addi-tion, we can start from a sub-sample similarity hypothesisand thus considering only a sub-sample of the control data.
In summary, since one of the main purposes of this work isto extract tag representing geographical hot-spots or land-marks, we further consider the number of occurrences of thepictures tagged with the extracted terms. The use of thisparameter to order or rank the output list of terms is elab-orated on in Section 4.
4. EXPERIMENTS
4.1 The DatasetBefore presenting our experiments and the results, we give
an overview of the dataset that we base our experiments on.As mentioned before, we mainly used Flickr pictures to do
our experiments. More specifically, these consist of 1.073.364images that were taken around London between January1st, 2007 and January 1st, 2011, in a square area between51.395778 and 51.649555 in latitude, and between -0.341263and 0.151062 in longitude. Recall from Figures 1 and Fig-ure 2 that the pictures in our dataset are not uniformlydistributed in space over the area we have selected.
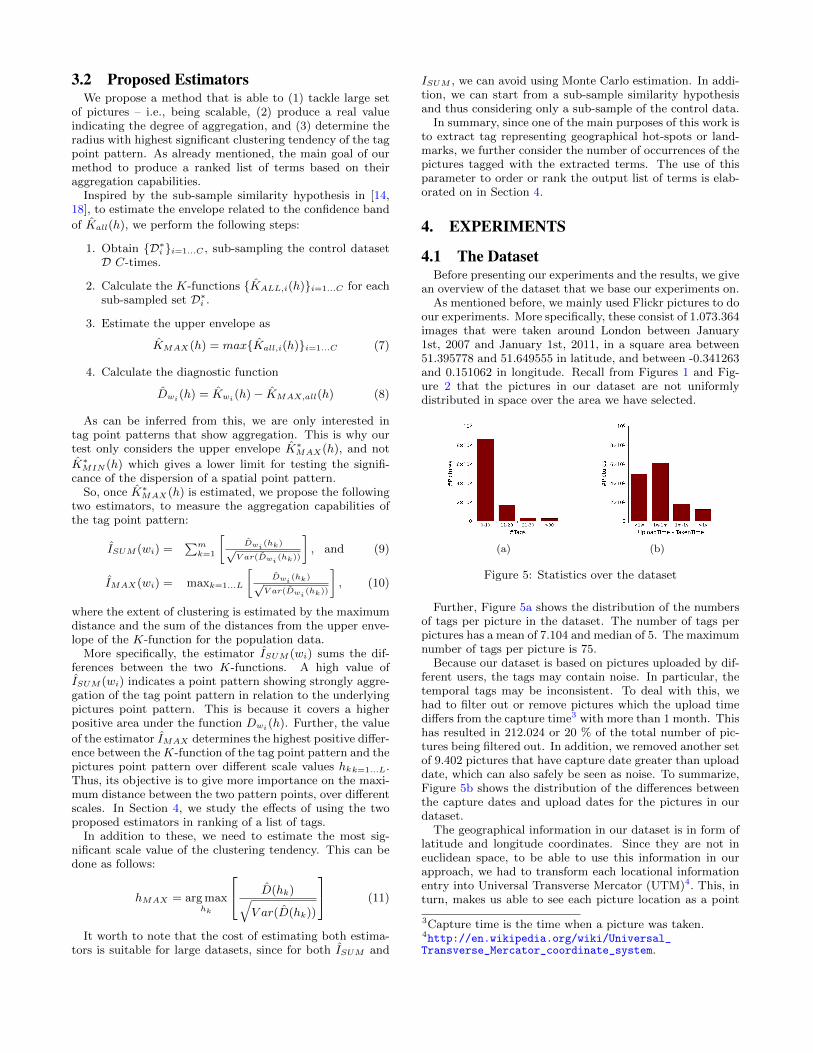
(a) (b)
Figure 5: Statistics over the dataset
Further, Figure 5a shows the distribution of the numbersof tags per picture in the dataset. The number of tags perpictures has a mean of 7.104 and median of 5. The maximumnumber of tags per picture is 75.
Because our dataset is based on pictures uploaded by dif-ferent users, the tags may contain noise. In particular, thetemporal tags may be inconsistent. To deal with this, wehad to filter out or remove pictures which the upload timediffers from the capture time3 with more than 1 month. Thishas resulted in 212.024 or 20 % of the total number of pic-tures being filtered out. In addition, we removed another setof 9.402 pictures that have capture date greater than uploaddate, which can also safely be seen as noise. To summarize,Figure 5b shows the distribution of the differences betweenthe capture dates and upload dates for the pictures in ourdataset.
The geographical information in our dataset is in form oflatitude and longitude coordinates. Since they are not ineuclidean space, to be able to use this information in ourapproach, we had to transform each locational informationentry into Universal Transverse Mercator (UTM)4. This, inturn, makes us able to see each picture location as a point
3Capture time is the time when a picture was taken.4http://en.wikipedia.org/wiki/Universal_Transverse_Mercator_coordinate_system.
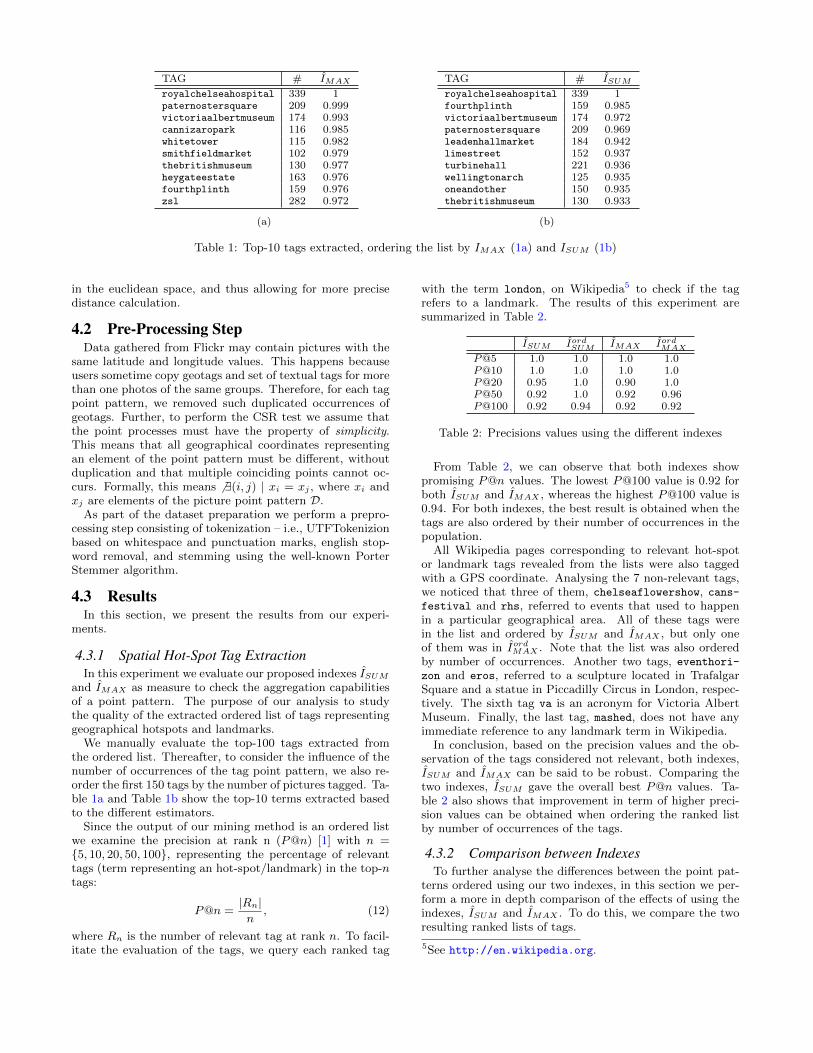
TAG # IMAX
royalchelseahospital 339 1paternostersquare 209 0.999victoriaalbertmuseum 174 0.993cannizaropark 116 0.985whitetower 115 0.982smithfieldmarket 102 0.979thebritishmuseum 130 0.977heygateestate 163 0.976fourthplinth 159 0.976zsl 282 0.972
(a)
TAG # ISUMroyalchelseahospital 339 1fourthplinth 159 0.985victoriaalbertmuseum 174 0.972paternostersquare 209 0.969leadenhallmarket 184 0.942limestreet 152 0.937turbinehall 221 0.936wellingtonarch 125 0.935oneandother 150 0.935thebritishmuseum 130 0.933
(b)
Table 1: Top-10 tags extracted, ordering the list by IMAX (1a) and ISUM (1b)
in the euclidean space, and thus allowing for more precisedistance calculation.
4.2 Pre-Processing StepData gathered from Flickr may contain pictures with the
same latitude and longitude values. This happens becauseusers sometime copy geotags and set of textual tags for morethan one photos of the same groups. Therefore, for each tagpoint pattern, we removed such duplicated occurrences ofgeotags. Further, to perform the CSR test we assume thatthe point processes must have the property of simplicity.This means that all geographical coordinates representingan element of the point pattern must be different, withoutduplication and that multiple coinciding points cannot oc-curs. Formally, this means 6 ∃(i, j) | xi = xj , where xi andxj are elements of the picture point pattern D.
As part of the dataset preparation we perform a prepro-cessing step consisting of tokenization – i.e., UTFTokenizionbased on whitespace and punctuation marks, english stop-word removal, and stemming using the well-known PorterStemmer algorithm.
4.3 ResultsIn this section, we present the results from our experi-
ments.
4.3.1 Spatial Hot-Spot Tag ExtractionIn this experiment we evaluate our proposed indexes ISUM
and IMAX as measure to check the aggregation capabilitiesof a point pattern. The purpose of our analysis to studythe quality of the extracted ordered list of tags representinggeographical hotspots and landmarks.
We manually evaluate the top-100 tags extracted fromthe ordered list. Thereafter, to consider the influence of thenumber of occurrences of the tag point pattern, we also re-order the first 150 tags by the number of pictures tagged. Ta-ble 1a and Table 1b show the top-10 terms extracted basedto the different estimators.
Since the output of our mining method is an ordered listwe examine the precision at rank n (P@n) [1] with n ={5, 10, 20, 50, 100}, representing the percentage of relevanttags (term representing an hot-spot/landmark) in the top-ntags:
P@n =|Rn|n
, (12)
where Rn is the number of relevant tag at rank n. To facil-itate the evaluation of the tags, we query each ranked tag
with the term london, on Wikipedia5 to check if the tagrefers to a landmark. The results of this experiment aresummarized in Table 2.
ISUM IordSUM IMAX IordMAX
P@5 1.0 1.0 1.0 1.0P@10 1.0 1.0 1.0 1.0P@20 0.95 1.0 0.90 1.0P@50 0.92 1.0 0.92 0.96P@100 0.92 0.94 0.92 0.92
Table 2: Precisions values using the different indexes
From Table 2, we can observe that both indexes showpromising P@n values. The lowest P@100 value is 0.92 forboth ISUM and IMAX , whereas the highest P@100 value is0.94. For both indexes, the best result is obtained when thetags are also ordered by their number of occurrences in thepopulation.
All Wikipedia pages corresponding to relevant hot-spotor landmark tags revealed from the lists were also taggedwith a GPS coordinate. Analysing the 7 non-relevant tags,we noticed that three of them, chelseaflowershow, cans-festival and rhs, referred to events that used to happenin a particular geographical area. All of these tags werein the list and ordered by ISUM and IMAX , but only oneof them was in IordMAX . Note that the list was also orderedby number of occurrences. Another two tags, eventhori-
zon and eros, referred to a sculpture located in TrafalgarSquare and a statue in Piccadilly Circus in London, respec-tively. The sixth tag va is an acronym for Victoria AlbertMuseum. Finally, the last tag, mashed, does not have anyimmediate reference to any landmark term in Wikipedia.
In conclusion, based on the precision values and the ob-servation of the tags considered not relevant, both indexes,ISUM and IMAX can be said to be robust. Comparing thetwo indexes, ISUM gave the overall best P@n values. Ta-ble 2 also shows that improvement in term of higher preci-sion values can be obtained when ordering the ranked listby number of occurrences of the tags.
4.3.2 Comparison between IndexesTo further analyse the differences between the point pat-
terns ordered using our two indexes, in this section we per-form a more in depth comparison of the effects of using theindexes, ISUM and IMAX . To do this, we compare the tworesulting ranked lists of tags.
5See http://en.wikipedia.org.
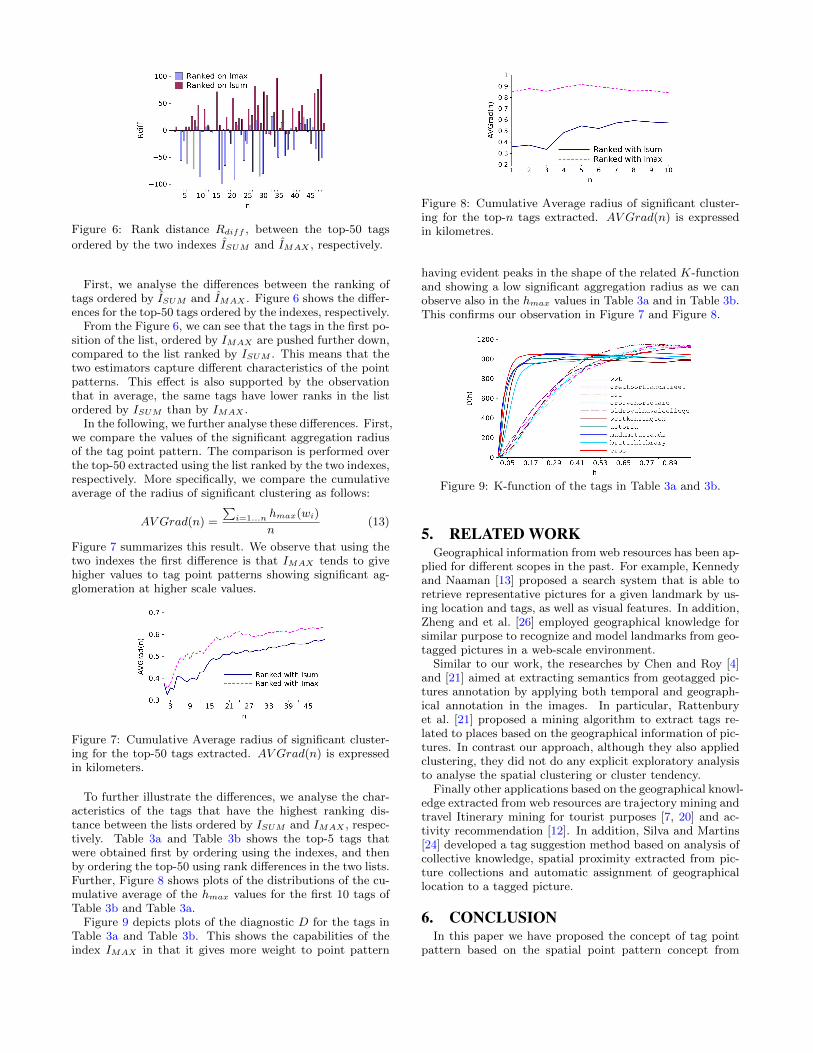
Figure 6: Rank distance Rdiff , between the top-50 tags
ordered by the two indexes ISUM and IMAX , respectively.
First, we analyse the differences between the ranking oftags ordered by ISUM and IMAX . Figure 6 shows the differ-ences for the top-50 tags ordered by the indexes, respectively.
From the Figure 6, we can see that the tags in the first po-sition of the list, ordered by IMAX are pushed further down,compared to the list ranked by ISUM . This means that thetwo estimators capture different characteristics of the pointpatterns. This effect is also supported by the observationthat in average, the same tags have lower ranks in the listordered by ISUM than by IMAX .
In the following, we further analyse these differences. First,we compare the values of the significant aggregation radiusof the tag point pattern. The comparison is performed overthe top-50 extracted using the list ranked by the two indexes,respectively. More specifically, we compare the cumulativeaverage of the radius of significant clustering as follows:
AV Grad(n) =
∑i=1...n hmax(wi)
n(13)
Figure 7 summarizes this result. We observe that using thetwo indexes the first difference is that IMAX tends to givehigher values to tag point patterns showing significant ag-glomeration at higher scale values.
Figure 7: Cumulative Average radius of significant cluster-ing for the top-50 tags extracted. AV Grad(n) is expressedin kilometers.
To further illustrate the differences, we analyse the char-acteristics of the tags that have the highest ranking dis-tance between the lists ordered by ISUM and IMAX , respec-tively. Table 3a and Table 3b shows the top-5 tags thatwere obtained first by ordering using the indexes, and thenby ordering the top-50 using rank differences in the two lists.Further, Figure 8 shows plots of the distributions of the cu-mulative average of the hmax values for the first 10 tags ofTable 3b and Table 3a.
Figure 9 depicts plots of the diagnostic D for the tags inTable 3a and Table 3b. This shows the capabilities of theindex IMAX in that it gives more weight to point pattern
Figure 8: Cumulative Average radius of significant cluster-ing for the top-n tags extracted. AV Grad(n) is expressedin kilometres.
having evident peaks in the shape of the related K-functionand showing a low significant aggregation radius as we canobserve also in the hmax values in Table 3a and in Table 3b.This confirms our observation in Figure 7 and Figure 8.
Figure 9: K-function of the tags in Table 3a and 3b.
5. RELATED WORKGeographical information from web resources has been ap-
plied for different scopes in the past. For example, Kennedyand Naaman [13] proposed a search system that is able toretrieve representative pictures for a given landmark by us-ing location and tags, as well as visual features. In addition,Zheng and et al. [26] employed geographical knowledge forsimilar purpose to recognize and model landmarks from geo-tagged pictures in a web-scale environment.
Similar to our work, the researches by Chen and Roy [4]and [21] aimed at extracting semantics from geotagged pic-tures annotation by applying both temporal and geograph-ical annotation in the images. In particular, Rattenburyet al. [21] proposed a mining algorithm to extract tags re-lated to places based on the geographical information of pic-tures. In contrast our approach, although they also appliedclustering, they did not do any explicit exploratory analysisto analyse the spatial clustering or cluster tendency.
Finally other applications based on the geographical knowl-edge extracted from web resources are trajectory mining andtravel Itinerary mining for tourist purposes [7, 20] and ac-tivity recommendation [12]. In addition, Silva and Martins[24] developed a tag suggestion method based on analysis ofcollective knowledge, spatial proximity extracted from pic-ture collections and automatic assignment of geographicallocation to a tagged picture.
6. CONCLUSIONIn this paper we have proposed the concept of tag point
pattern based on the spatial point pattern concept from
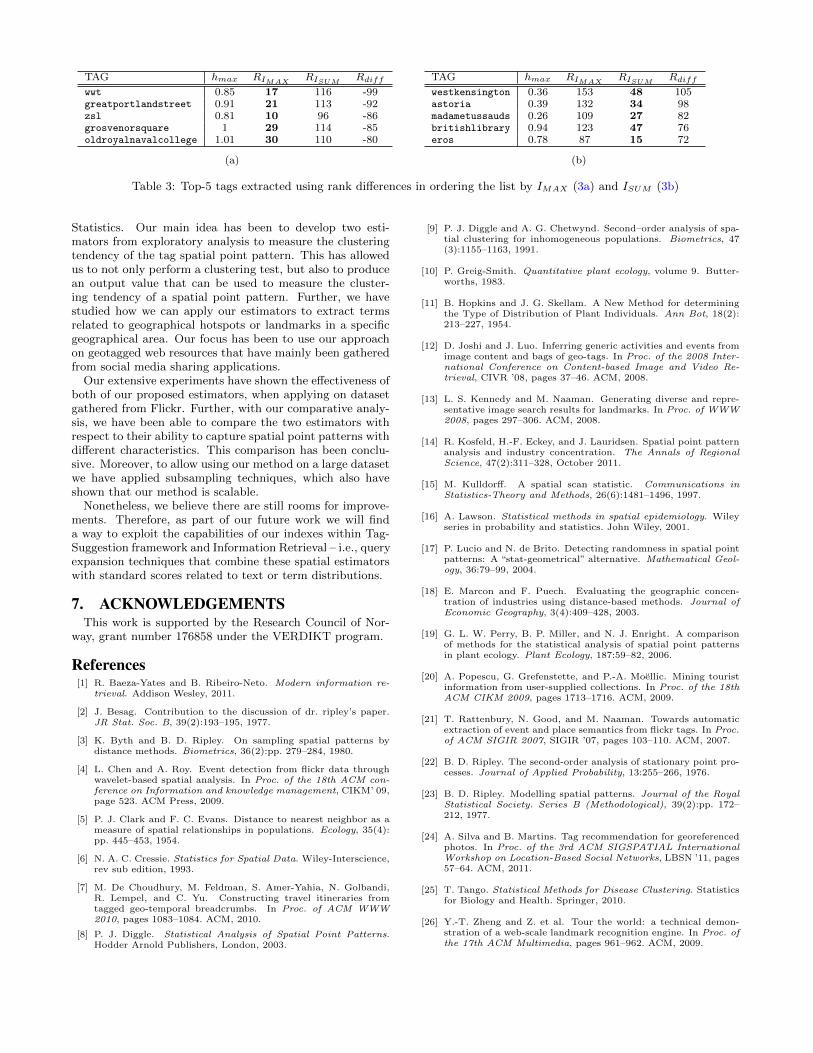
TAG hmax RIMAXRISUM
Rdiffwwt 0.85 17 116 -99greatportlandstreet 0.91 21 113 -92zsl 0.81 10 96 -86grosvenorsquare 1 29 114 -85oldroyalnavalcollege 1.01 30 110 -80
(a)
TAG hmax RIMAXRISUM
Rdiffwestkensington 0.36 153 48 105astoria 0.39 132 34 98madametussauds 0.26 109 27 82britishlibrary 0.94 123 47 76eros 0.78 87 15 72
(b)
Table 3: Top-5 tags extracted using rank differences in ordering the list by IMAX (3a) and ISUM (3b)
Statistics. Our main idea has been to develop two esti-mators from exploratory analysis to measure the clusteringtendency of the tag spatial point pattern. This has allowedus to not only perform a clustering test, but also to producean output value that can be used to measure the cluster-ing tendency of a spatial point pattern. Further, we havestudied how we can apply our estimators to extract termsrelated to geographical hotspots or landmarks in a specificgeographical area. Our focus has been to use our approachon geotagged web resources that have mainly been gatheredfrom social media sharing applications.
Our extensive experiments have shown the effectiveness ofboth of our proposed estimators, when applying on datasetgathered from Flickr. Further, with our comparative analy-sis, we have been able to compare the two estimators withrespect to their ability to capture spatial point patterns withdifferent characteristics. This comparison has been conclu-sive. Moreover, to allow using our method on a large datasetwe have applied subsampling techniques, which also haveshown that our method is scalable.
Nonetheless, we believe there are still rooms for improve-ments. Therefore, as part of our future work we will finda way to exploit the capabilities of our indexes within Tag-Suggestion framework and Information Retrieval – i.e., queryexpansion techniques that combine these spatial estimatorswith standard scores related to text or term distributions.
7. ACKNOWLEDGEMENTSThis work is supported by the Research Council of Nor-
way, grant number 176858 under the VERDIKT program.
References[1] R. Baeza-Yates and B. Ribeiro-Neto. Modern information re-
trieval. Addison Wesley, 2011.
[2] J. Besag. Contribution to the discussion of dr. ripley’s paper.JR Stat. Soc. B, 39(2):193–195, 1977.
[3] K. Byth and B. D. Ripley. On sampling spatial patterns bydistance methods. Biometrics, 36(2):pp. 279–284, 1980.
[4] L. Chen and A. Roy. Event detection from flickr data throughwavelet-based spatial analysis. In Proc. of the 18th ACM con-ference on Information and knowledge management, CIKM’ 09,page 523. ACM Press, 2009.
[5] P. J. Clark and F. C. Evans. Distance to nearest neighbor as ameasure of spatial relationships in populations. Ecology, 35(4):pp. 445–453, 1954.
[6] N. A. C. Cressie. Statistics for Spatial Data. Wiley-Interscience,rev sub edition, 1993.
[7] M. De Choudhury, M. Feldman, S. Amer-Yahia, N. Golbandi,R. Lempel, and C. Yu. Constructing travel itineraries fromtagged geo-temporal breadcrumbs. In Proc. of ACM WWW2010, pages 1083–1084. ACM, 2010.
[8] P. J. Diggle. Statistical Analysis of Spatial Point Patterns.Hodder Arnold Publishers, London, 2003.
[9] P. J. Diggle and A. G. Chetwynd. Second–order analysis of spa-tial clustering for inhomogeneous populations. Biometrics, 47(3):1155–1163, 1991.
[10] P. Greig-Smith. Quantitative plant ecology, volume 9. Butter-worths, 1983.
[11] B. Hopkins and J. G. Skellam. A New Method for determiningthe Type of Distribution of Plant Individuals. Ann Bot, 18(2):213–227, 1954.
[12] D. Joshi and J. Luo. Inferring generic activities and events fromimage content and bags of geo-tags. In Proc. of the 2008 Inter-national Conference on Content-based Image and Video Re-trieval, CIVR ’08, pages 37–46. ACM, 2008.
[13] L. S. Kennedy and M. Naaman. Generating diverse and repre-sentative image search results for landmarks. In Proc. of WWW2008, pages 297–306. ACM, 2008.
[14] R. Kosfeld, H.-F. Eckey, and J. Lauridsen. Spatial point patternanalysis and industry concentration. The Annals of RegionalScience, 47(2):311–328, October 2011.
[15] M. Kulldorff. A spatial scan statistic. Communications inStatistics-Theory and Methods, 26(6):1481–1496, 1997.
[16] A. Lawson. Statistical methods in spatial epidemiology. Wileyseries in probability and statistics. John Wiley, 2001.
[17] P. Lucio and N. de Brito. Detecting randomness in spatial pointpatterns: A “stat-geometrical” alternative. Mathematical Geol-ogy, 36:79–99, 2004.
[18] E. Marcon and F. Puech. Evaluating the geographic concen-tration of industries using distance-based methods. Journal ofEconomic Geography, 3(4):409–428, 2003.
[19] G. L. W. Perry, B. P. Miller, and N. J. Enright. A comparisonof methods for the statistical analysis of spatial point patternsin plant ecology. Plant Ecology, 187:59–82, 2006.
[20] A. Popescu, G. Grefenstette, and P.-A. Moellic. Mining touristinformation from user-supplied collections. In Proc. of the 18thACM CIKM 2009, pages 1713–1716. ACM, 2009.
[21] T. Rattenbury, N. Good, and M. Naaman. Towards automaticextraction of event and place semantics from flickr tags. In Proc.of ACM SIGIR 2007, SIGIR ’07, pages 103–110. ACM, 2007.
[22] B. D. Ripley. The second-order analysis of stationary point pro-cesses. Journal of Applied Probability, 13:255–266, 1976.
[23] B. D. Ripley. Modelling spatial patterns. Journal of the RoyalStatistical Society. Series B (Methodological), 39(2):pp. 172–212, 1977.
[24] A. Silva and B. Martins. Tag recommendation for georeferencedphotos. In Proc. of the 3rd ACM SIGSPATIAL InternationalWorkshop on Location-Based Social Networks, LBSN ’11, pages57–64. ACM, 2011.
[25] T. Tango. Statistical Methods for Disease Clustering. Statisticsfor Biology and Health. Springer, 2010.
[26] Y.-T. Zheng and Z. et al. Tour the world: a technical demon-stration of a web-scale landmark recognition engine. In Proc. ofthe 17th ACM Multimedia, pages 961–962. ACM, 2009.