exploration geologic risk assessment and prospect...
TRANSCRIPT

Exploration
Geologic Risk Assessment
And Prospect Evaluation
Nahum Schneidermann (Chevron retired)
Bob Otis (Rose & Associates)
Ro
se
Asso
c.c
om

In – san – i - ty
Webster:
“Extreme folly or unreasonableness”
Albert Einstein:
“Insanity is doing the same thing over and over again and expecting a different result."

Risk Analysis: An integrated project assessment (resources,
chance, economics) under conditions of
uncertainty.
Utilized for subsequent Decision Analysis.
Risk Management: The art and science of identifying, analyzing
and responding to risk factors throughout
the life of a project.
Risk Analysis: An integrated project assessment (resources,
chance, economics) under conditions of
uncertainty.
Utilized for subsequent Decision Analysis.
Risk Management: The art and science of identifying, analyzing
and responding to risk factors throughout
the life of a project.
Uncertainty: Range of possible
outcomes
Chance: Likelihood of occurrence
Risk: Threat of loss
Uncertainty: Range of possible
outcomes
Chance: Likelihood of occurrence
Risk: Threat of loss
Definitions

Expected Value
The basic equation for project evaluation
EV = Pc (PVc) + Pf (PVf)
Expected Value is the
sum of the
probability-weighted outcomes
c = commercial success outcomes
f = geologic and commercial
failure outcomes
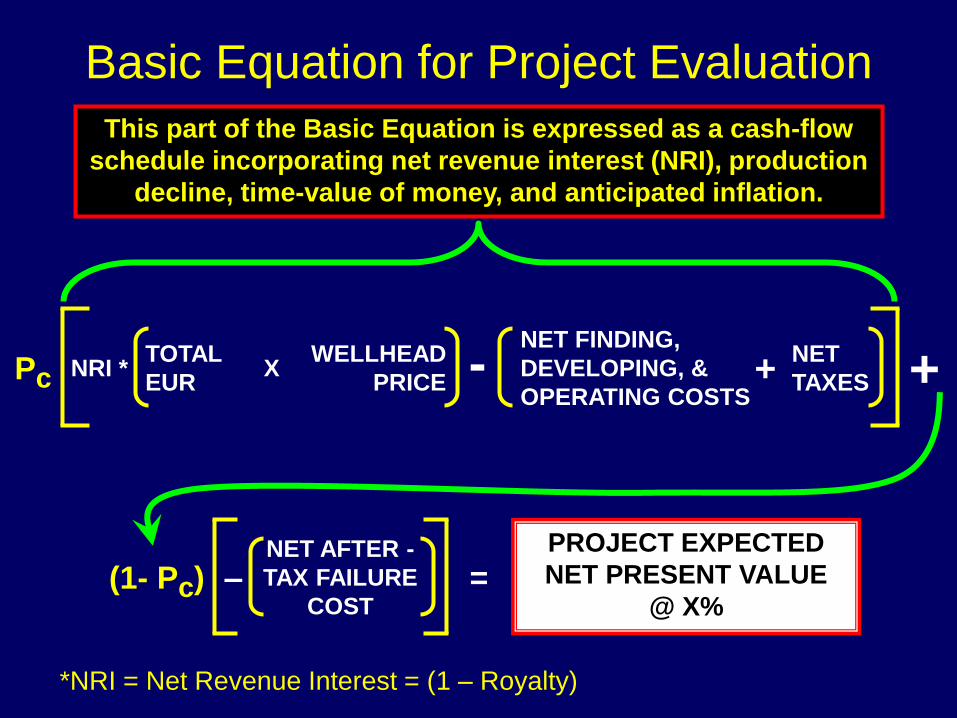
This part of the Basic Equation is expressed as a cash-flow
schedule incorporating net revenue interest (NRI), production
decline, time-value of money, and anticipated inflation.
Pc TOTAL
EUR
WELLHEAD
PRICE
NET FINDING,
DEVELOPING, &
OPERATING COSTS
NET
TAXES X + + NRI * -
(1- Pc) NET AFTER -
TAX FAILURE
COST =
PROJECT EXPECTED
NET PRESENT VALUE
@ X% –
Basic Equation for Project Evaluation
*NRI = Net Revenue Interest = (1 – Royalty)

Exploration Evaluation Process
Geologic
Chance
Assessment
Probabilistic
EUR
Estimation
Prospect or
Play
Evaluation
Engineering,
Economics,
Com./Econ.
Truncation
Drill?
Post Drill
Assessments,
Performance
Tracking
Recommended
Technology
Spending
Recommend Process Improvements
Recommend Process Improvements
Recommend Process
Improvements
After Otis & Schneidermann, 1997
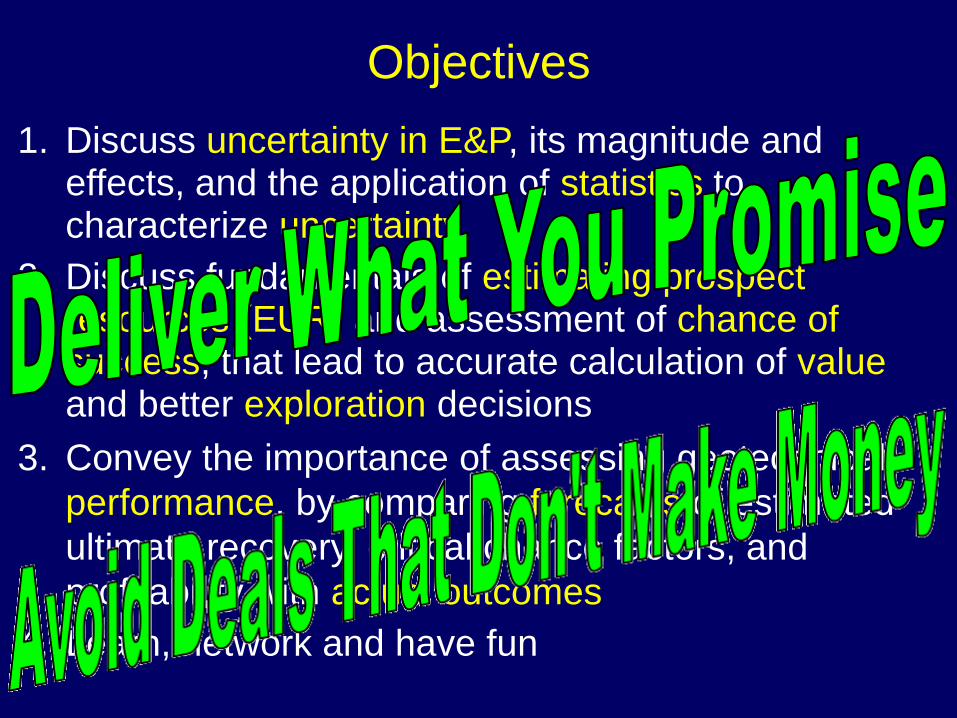
1. Discuss uncertainty in E&P, its magnitude and effects, and the application of statistics to characterize uncertainty
2. Discuss fundamentals of estimating prospect resources (EUR) and assessment of chance of success, that lead to accurate calculation of value and better exploration decisions
3. Convey the importance of assessing geotechnical
performance, by comparing forecasts of estimated
ultimate recovery, critical chance factors, and
profitability with actual outcomes
4. Learn, network and have fun
Objectives
Statistics and Uncertainty

One of two or more things
which can occur, aka,
possible outcomes
What does occur
Subjective confidence about the
likelihood of an uncertain future
event, given repeated trials
An orderly portrayal of related data samples
selected from a population
Event:
Outcome:
Probability:
Distribution:
Definitions

Sample and Population Descriptive
Terms
• Measures of central tendency – Mode – the most frequent event
– Median – half events are above; half are below
– Mean – average of all values in the distribution
• Measures of uncertainty – Variance – the average of squares about the mean
– Standard deviation – square root of variance
– P10/P90 – ratio of the P10 to the P90

• Definitions: % >= (‘GE’) or % <= (‘LE’)
• Industry standard: % >= (‘GE’)
– Explorers think in terms of large discoveries
– Consistent with SEC / SPE / WPC / AAPG guidelines
– Commercial threshold truncations easier to apply
– Less confusing for decision makers
In a Greater Than convention:
• P10 is the larger number
• P90 is the smaller number
Plotting Conventions

What Are P10 and P90?
• In the GE convention
– P10 is the value on the distribution for which there is a 10%
probability that a random selection from that distribution will be
greater than or equal to that value – this is a large number
– P90 is the value on the distribution for which there is a 90%
probability that a random selection from that distribution will be
greater than or equal to that value – this is a small number
• In the LE convention
– P10 is the value on the distribution for which there is a 10%
probability that a random selection from that distribution will be
less than or equal to that value – this is a small number
– P90 is the value on the distribution for which there is a 90%
probability that a random selection from that distribution will be
less than or equal to that value – this is a large number
• These definitions apply to any Pvalue

Distributions
14
Sums tend to have
distributions that are
normal-like
Products tend to have
distributions that are
lognormal-like
Estimates of EUR (Resources) are products:
Area x Avg Net Pay x Recovery Yield

Data from Abbotts, 1991
Resource Field Size Distribution
North Sea Brent Play
Estimates of EUR are
products: (Area x Net Pay
x Recovery Yield)

Derived from Cossey & Associates, Inc. Deepwater Database
Productive Area Distribution
GOM DW
Estimates of Area are
products: (Length x
Width)

Derived from Cossey & Associates, Inc. Deepwater Database
Avg Net Pay Distribution
Brazil DW
Estimates of Net Pay
are products:
(Thickness x N/G)

After Capen, 1984
April Rainfall (Inches)
Dallas, 1931-1969
Most natural processes
are products: Why
rainfall?
Rainfall (inches)

1. Discuss uncertainty in E&P, its magnitude and effects, and the application of statistics to characterize uncertainty
2. Discuss fundamentals of estimating prospect resources (EUR) and assessment of chance of success, that lead to accurate calculation of value and better exploration decisions
3. Convey the importance of assessing geotechnical
performance, by comparing forecasts of estimated
ultimate recovery, critical chance factors, and
profitability with actual outcomes
4. Learn, network and have fun
Objectives
Estimation of Resource and Chance

Critical Success Factors
• Develop and maintain a rigorous, probabilistic
process that delivers predictable resources -
Deliver what you promise
• Focus on high quality technical evaluations of
prospects and plays - Strong focus on
fundamentals
• Improve assessment of prospect chance,
volumes and risk through calibration with
actual results to allow better portfolio decisions
– Active performance tracking

Prospect or Play Evaluation
• Do we have a Source of hydrocarbons? What
kind – oil or gas?
• Can we Migrate the hydrocarbons from the
source to the trap with the right Timing? When
and how much?
• Do we have a Reservoir to store the
hydrocarbons? What are its characteristics?
• Is the a Closure to trap the hydrocarbons in the
reservoir? How big is it?
• Is there a seal that will Contain the hydrocarbons
to the present day? How efficient is it?

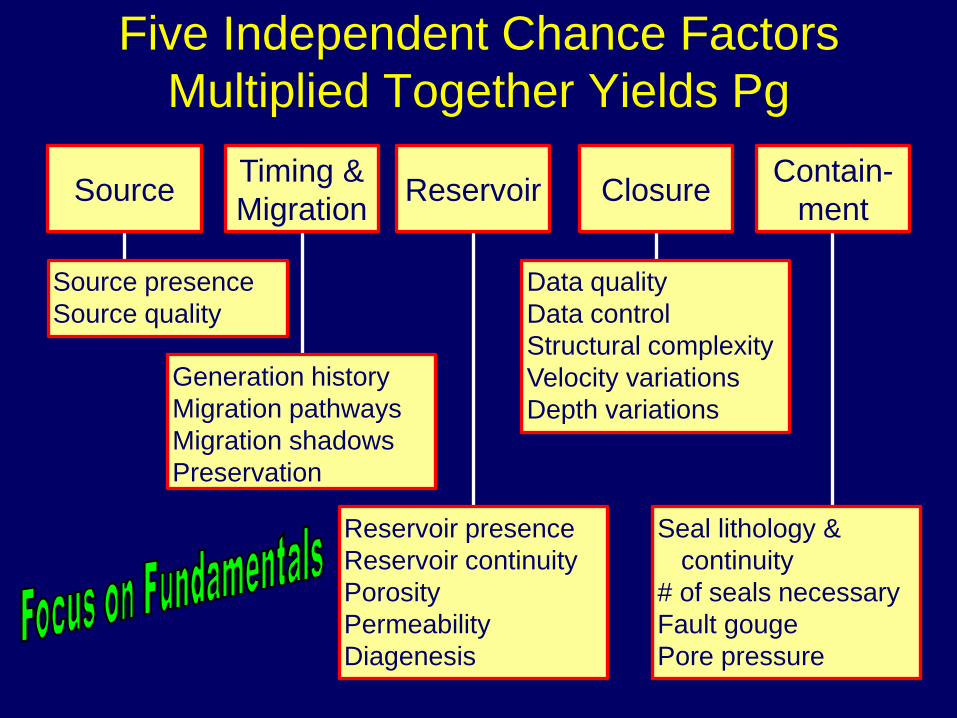
Five Independent Chance Factors
Multiplied Together Yields Pg
• Do we have a Source of hydrocarbons? What
kind – oil or gas?
• Can we Migrate the hydrocarbons from the
source to the trap with the right Timing? When
and how much?
• Do we have a Reservoir to store the
hydrocarbons? What are its characteristics?
• Is the a Closure to trap the hydrocarbons in the
reservoir? How big is it?
• Is there a seal that will Contain the hydrocarbons
to the present day? How efficient is it?
Five Independent Chance Factors
Multiplied Together Yields Pg
Source Timing &
Migration Reservoir Closure
Contain-
ment
Source presence
Source quality
Generation history
Migration pathways
Migration shadows
Preservation
Reservoir presence
Reservoir continuity
Porosity
Permeability
Diagenesis
Data quality
Data control
Structural complexity
Velocity variations
Depth variations
Seal lithology &
continuity
# of seals necessary
Fault gouge
Pore pressure
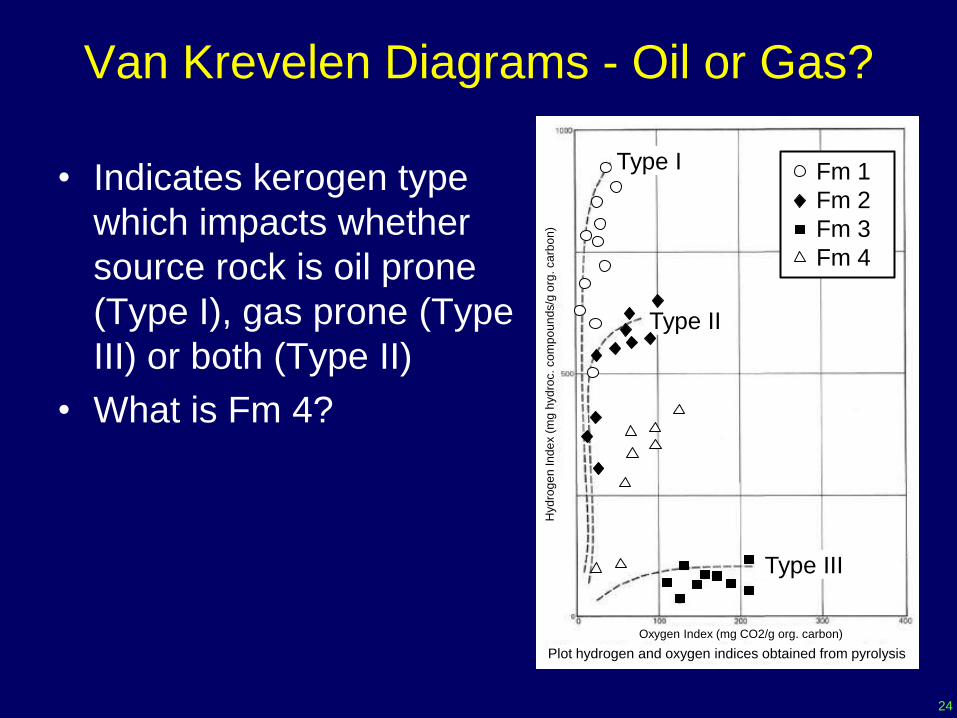
Van Krevelen Diagrams - Oil or Gas?
• Indicates kerogen type
which impacts whether
source rock is oil prone
(Type I), gas prone (Type
III) or both (Type II)
• What is Fm 4?
24
Type II
Fm 1
Fm 2
Fm 3
Fm 4
Plot hydrogen and oxygen indices obtained from pyrolysis
Oxygen Index (mg CO2/g org. carbon)
Hyd
rog
en
In
de
x (
mg
hyd
roc. co
mp
ou
nd
s/g
org
. ca
rbo
n)
Type I
Type III

From Roberts, et al, 2005
Petroleum-System Events Charts
Source
Reservoir
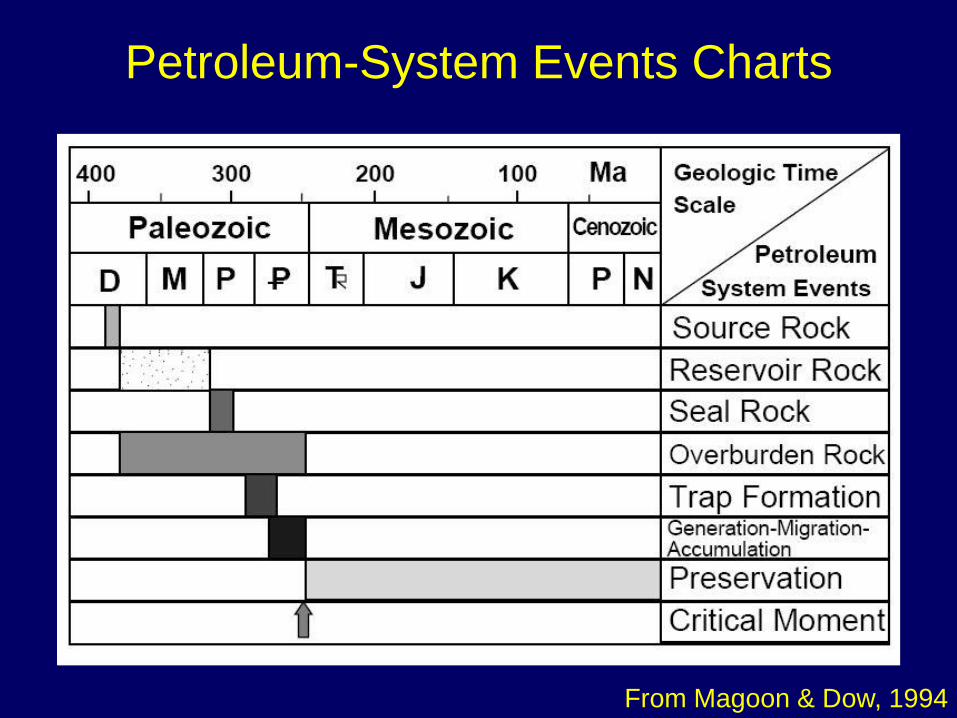
From Magoon & Dow, 1994
Petroleum-System Events Charts

Data from Abbotts, 1991
Maps, Cross Sections, Well Logs
Armada Field, North Sea
Summary
Log =>
<= Structure
Map
Cross
Section =>

From Geomage advertisement, The Leading Edge, 2013
Seismic Data Quality
What is the chance of structural closure, faulting, good
velocity control?

0.0 – 0.2 (1/10)
0.8 – 1.0 (9/10)
0.2 – 0.4 (1/3)
0.4 – 0.6 (1/2)
0.6 – 0.8 (2/3)
0.3 – 0.45 (2/5)
0.45 – 0.55 (1/2)
0.55 – 0.7 (3/5)
Bad News Good News
“Coin Toss”
Qualit
y
Quan
tity
Confidence level
Con
trol
Poor Limited
Good Lots
Low
High Chance Factor Adequacy Matrix
DATA
Geological Probability of
Success Pg
Rose & Associates,
Training Manual
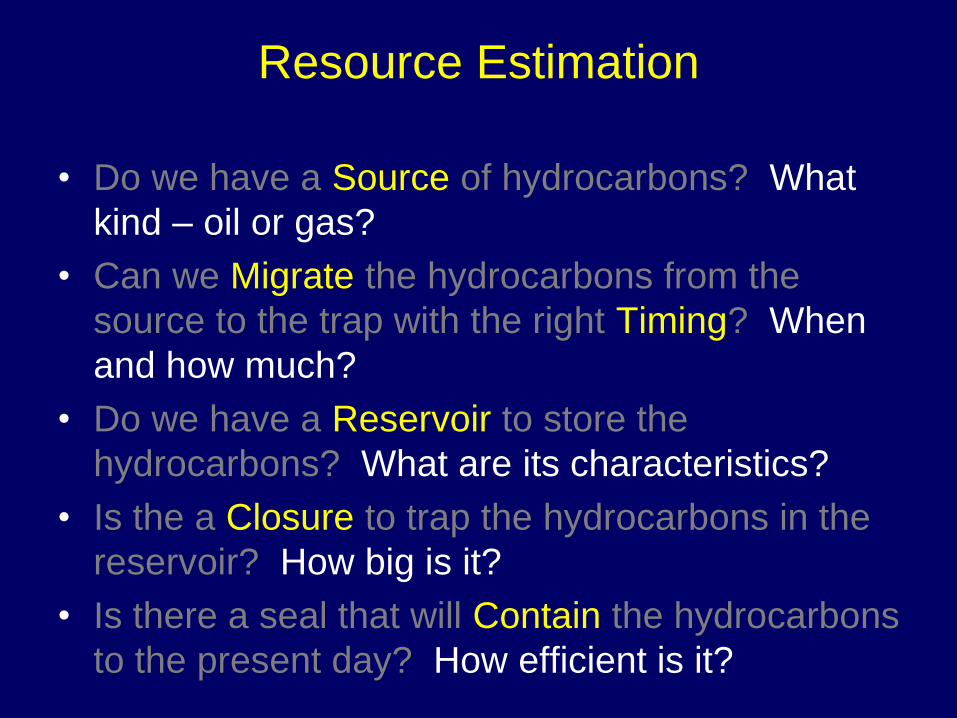
Resource Estimation
• Do we have a Source of hydrocarbons? What
kind – oil or gas?
• Can we Migrate the hydrocarbons from the
source to the trap with the right Timing? When
and how much?
• Do we have a Reservoir to store the
hydrocarbons? What are its characteristics?
• Is the a Closure to trap the hydrocarbons in the
reservoir? How big is it?
• Is there a seal that will Contain the hydrocarbons
to the present day? How efficient is it?

Estimation of Resource
Source Timing &
Migration Reservoir Closure
Contain-
ment
Hydrocarbon type
Oil or gas or both?
Fluid properties
GOR
Wet or dry gas?
Depositional Environ.
Reservoir thickness,
continuity & temp.
Porosity
Permeability
Water saturation
Structural or
stratigraphic trap?
Productive area
Spill point
HC column height
Depth of burial
Hydrocarbon column
Shale or Evaporite?
Cataclasis?
Capillary pressure
Overpressure?
Temperature
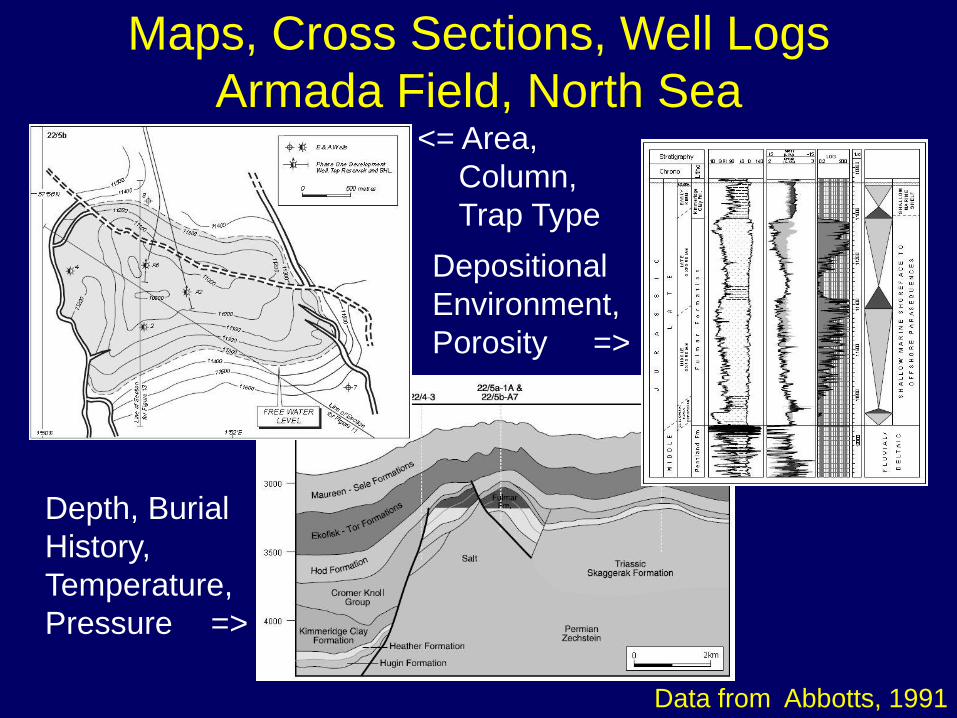
Data from Abbotts, 1991
Maps, Cross Sections, Well Logs
Armada Field, North Sea
Depositional
Environment,
Porosity =>
<= Area,
Column,
Trap Type
Depth, Burial
History,
Temperature,
Pressure =>

From Taylor, et al, 2010
Porosity Depth Plots
• Porosity normally
decreases as
depth increases
• Porosity-depth
plots illustrate the
uncertainty
associated with
specific depth
intervals
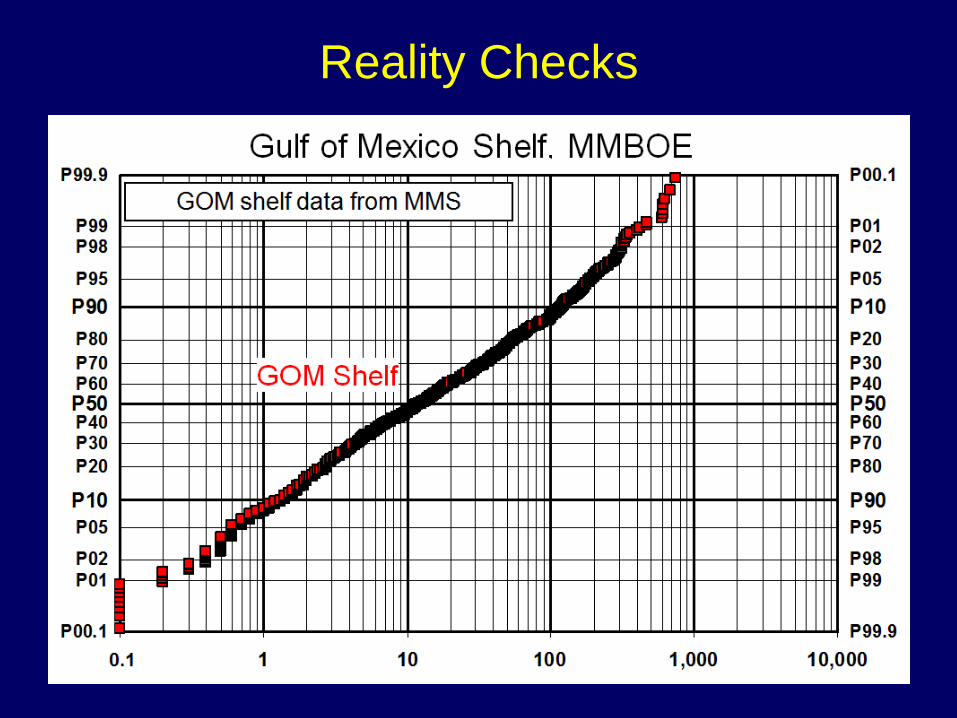
Reality Checks
The P99 is typically
driven by economics
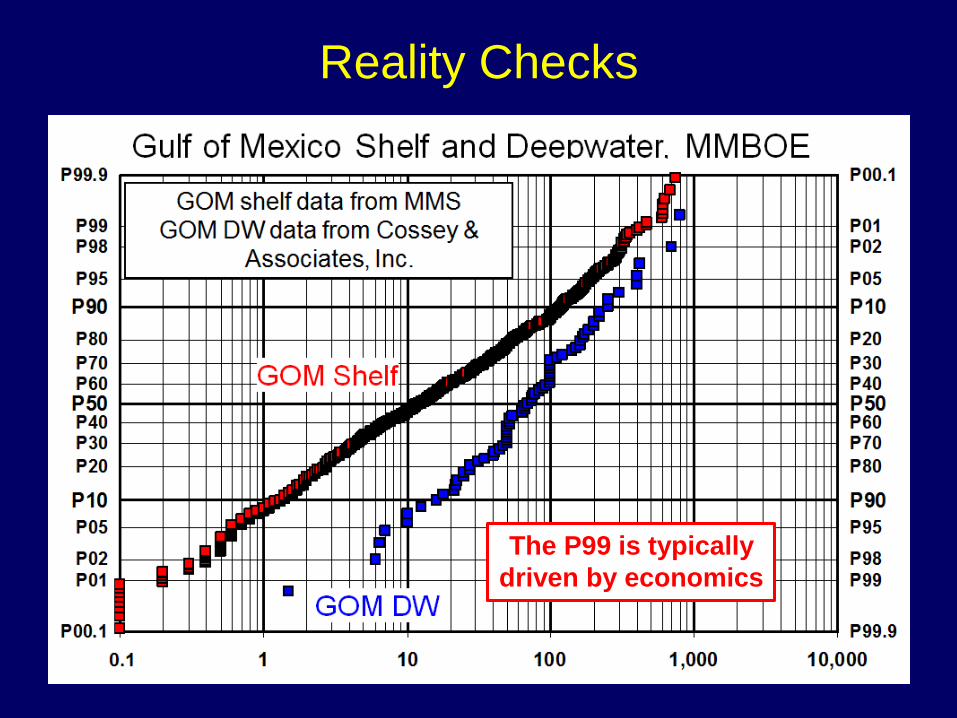
Reality Checks
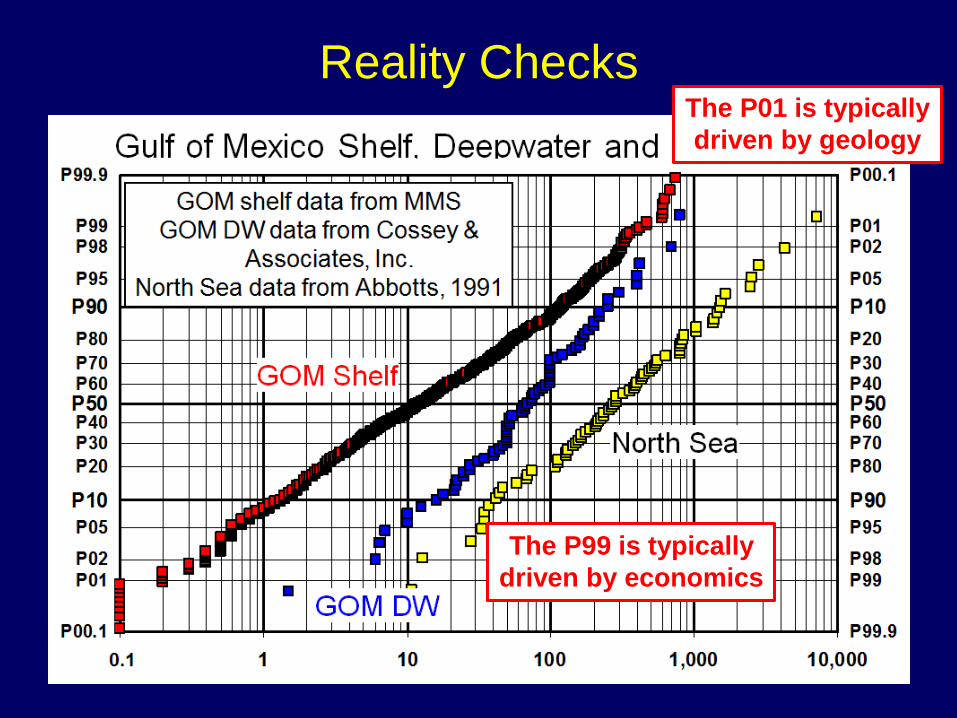
The P01 is typically
driven by geology
The P99 is typically
driven by economics
Reality Checks
Derived from Cossey & Associates, Inc. Deepwater Database
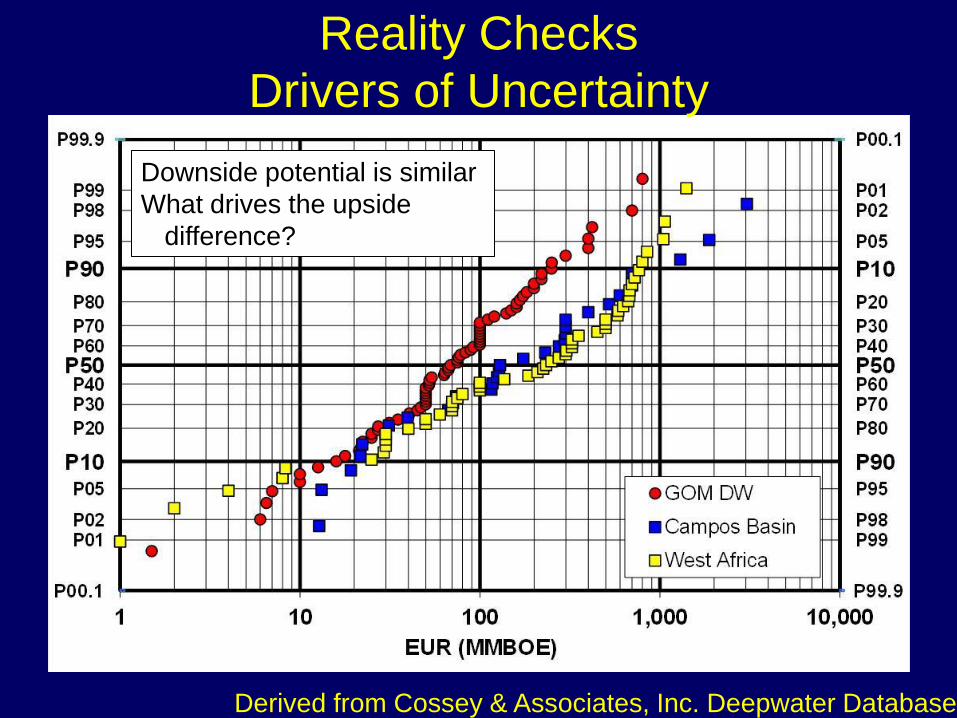
Reality Checks
Drivers of Uncertainty
Downside potential is similar
What drives the upside
difference?

Derived from Cossey & Associates, Inc. Deepwater Database
Reality Checks
Drivers of Uncertainty
Avg Net Pay is similar in all
three plays

Derived from Cossey & Associates, Inc. Deepwater Database
Prod. area is a key driver
Why the separation in
the Campos Basin?
Reality Checks
Drivers of Uncertainty

Focus On Fundamentals
1. Obtain a thorough understanding of the
geologic, geophysical and engineering aspects
of the opportunity
2. Using well founded statistical methods, develop
as estimate of the distribution of resource
volumes – focus on reality checks
3. Once the resource distribution is documented,
assess the chance that an active hydrocarbon
system can provide the range of volumes

1. Discuss uncertainty in E&P, its magnitude and effects, and the application of statistics to characterize uncertainty
2. Discuss fundamentals of estimating prospect resources (EUR) and assessment of chance of success, that lead to accurate calculation of value and better exploration decisions
3. Convey the importance of assessing geotechnical
performance, by comparing forecasts of estimated
ultimate recovery, critical chance factors, and
profitability with actual outcomes
4. Learn, network and have fun
Objectives
Estimation of Resource and Chance
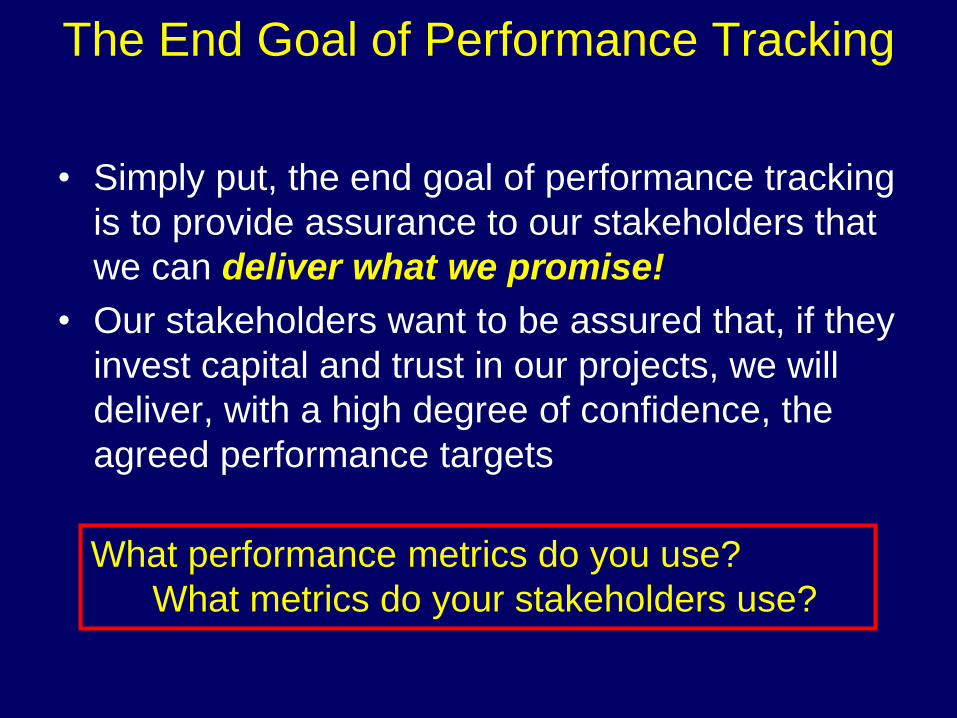
• Simply put, the end goal of performance tracking
is to provide assurance to our stakeholders that
we can deliver what we promise!
• Our stakeholders want to be assured that, if they
invest capital and trust in our projects, we will
deliver, with a high degree of confidence, the
agreed performance targets
What performance metrics do you use?
What metrics do your stakeholders use?
The End Goal of Performance Tracking

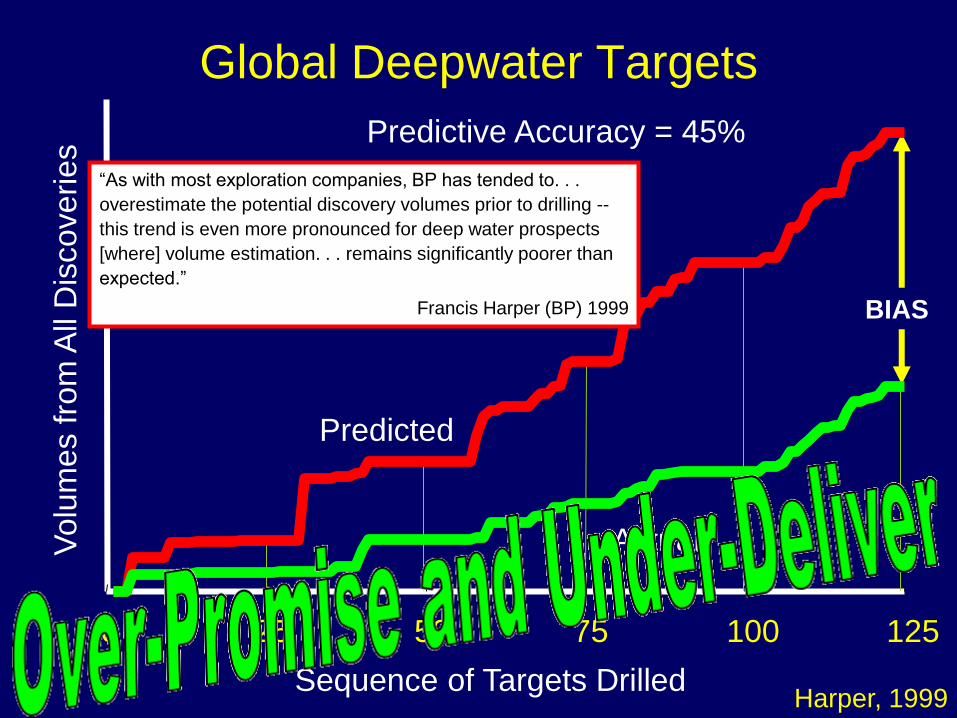
Sequence of Targets Drilled Harper, 1999
0 25 50 75 100 125
Predicted
Actual Volu
mes f
rom
All
Dis
coveries Predictive Accuracy = 45%
What is this gap of
cumulative under-
delivery called?
Global Deepwater Targets
“As with most exploration companies, BP has tended to. . .
overestimate the potential discovery volumes prior to drilling --
this trend is even more pronounced for deep water prospects
[where] volume estimation. . . remains significantly poorer than
expected.”
Francis Harper (BP) 1999
Sequence of Targets Drilled Harper, 1999
0 25 50 75 100 125
Predicted
Actual Volu
mes f
rom
All
Dis
coveries Predictive Accuracy = 45%
Global Deepwater Targets
BIAS
“As with most exploration companies, BP has tended to. . .
overestimate the potential discovery volumes prior to drilling --
this trend is even more pronounced for deep water prospects
[where] volume estimation. . . remains significantly poorer than
expected.”
Francis Harper (BP) 1999

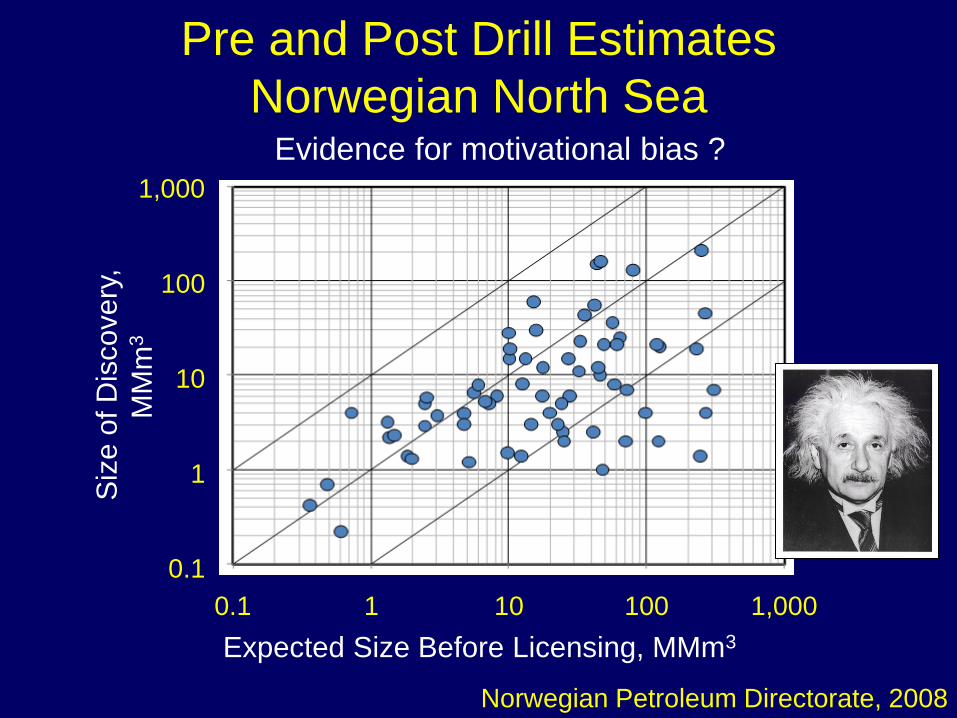
Pre and Post Drill Estimates
Norwegian North Sea
Norwegian Petroleum Directorate, 1997
1
10
100
1,000
10,000
Siz
e o
f D
iscovery
,
MM
BO
E
1 10 100 1,000 10,000
Expected Size Before Licensing, MMBOE
Evidence for motivational bias ?
Pre and Post Drill Estimates
Norwegian North Sea
Norwegian Petroleum Directorate, 2008
0.1
1
10
100
1,000
0.1 1 10 100 1,000
Expected Size Before Licensing, MMm3
Siz
e o
f D
iscovery
,
MM
m3
Evidence for motivational bias ?
10x
0.1x
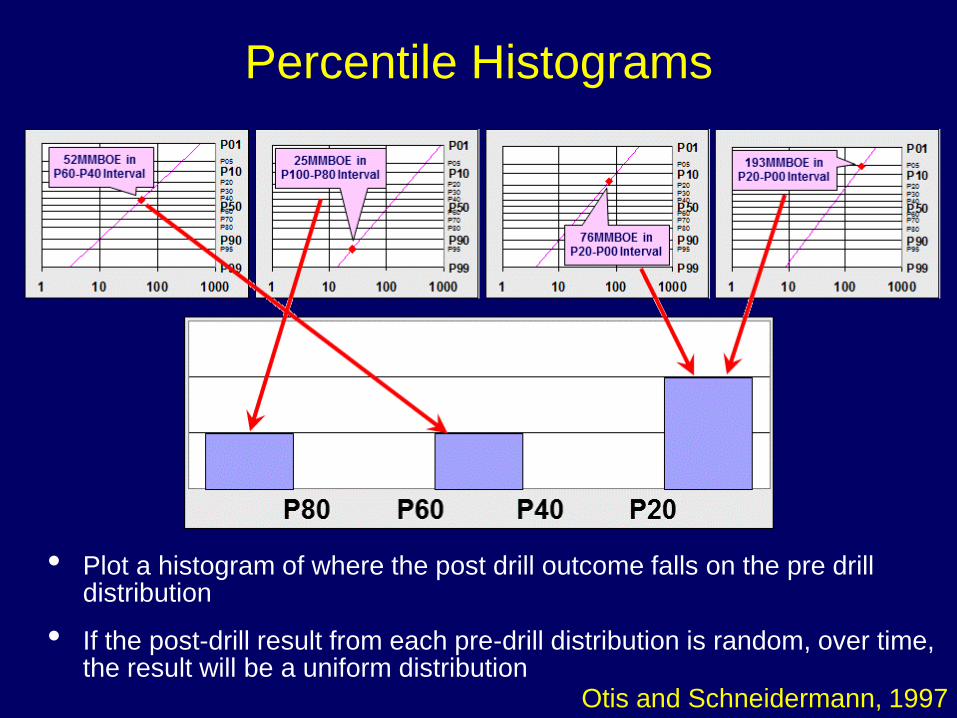
Percentile Histograms
• Plot a histogram of where the post drill outcome falls on the pre drill distribution
• If the post-drill result from each pre-drill distribution is random, over time, the result will be a uniform distribution
Otis and Schneidermann, 1997
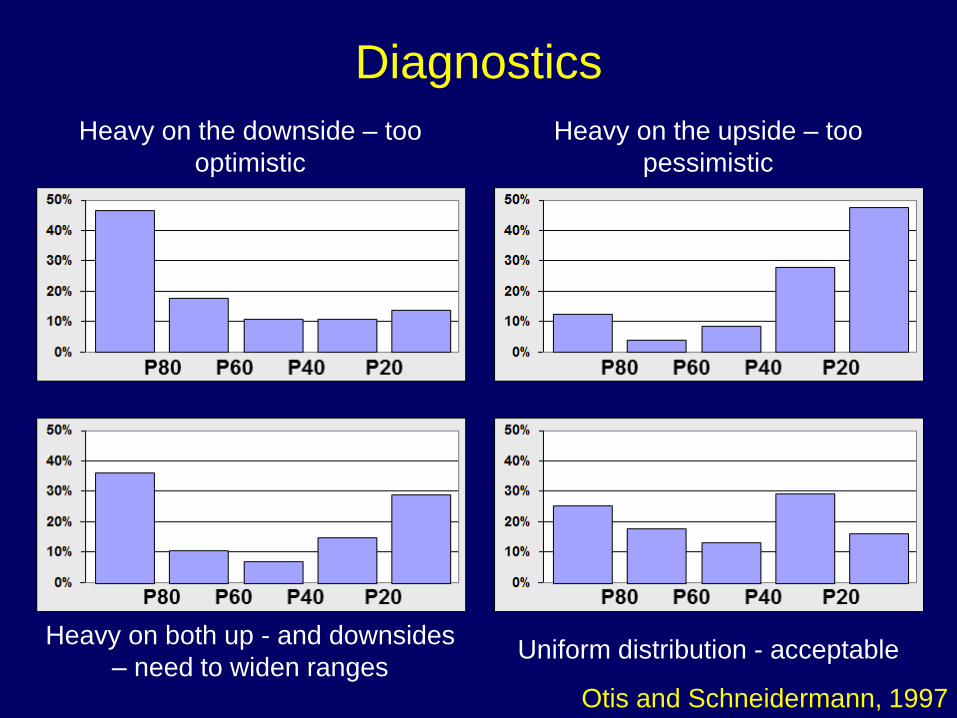
Diagnostics
Heavy on the downside – too
optimistic
Heavy on the upside – too
pessimistic
Heavy on both up - and downsides
– need to widen ranges Uniform distribution - acceptable
Otis and Schneidermann, 1997

Percentage of Discoveries at Forecast
Percentile
Otis and Schneidermann, 1997
1989 - 90
n = 22
Chevron International
50%
40%
30%
20%
10%
0%
P80 P60 P40 P20
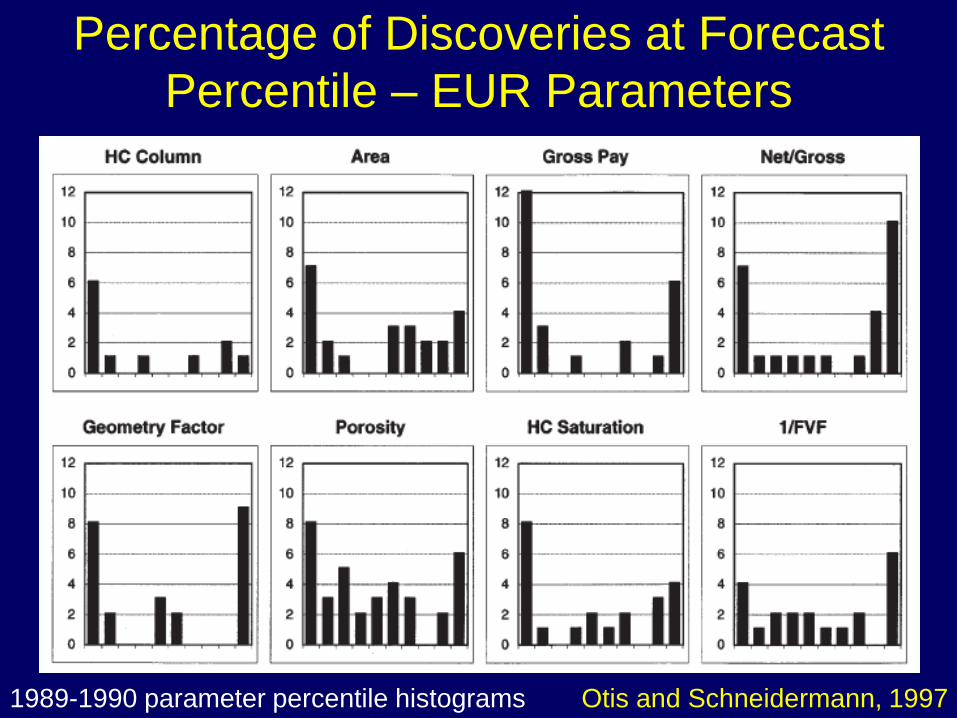
Percentage of Discoveries at Forecast
Percentile – EUR Parameters
Otis and Schneidermann, 1997 1989-1990 parameter percentile histograms

0
10
20
30
40
50
Percentage of Discoveries at Forecast
Percentile
1993 - 94
n = 34
Otis and Schneidermann, 1997
Chevron International 50%
40%
30%
20%
10%
0%
50%
40%
30%
20%
10%
0%
P80 P60 P40 P20

Most common cause of
poor estimation of EUR:
Low-side (P99) estimates
EUR Estimating Pitfalls
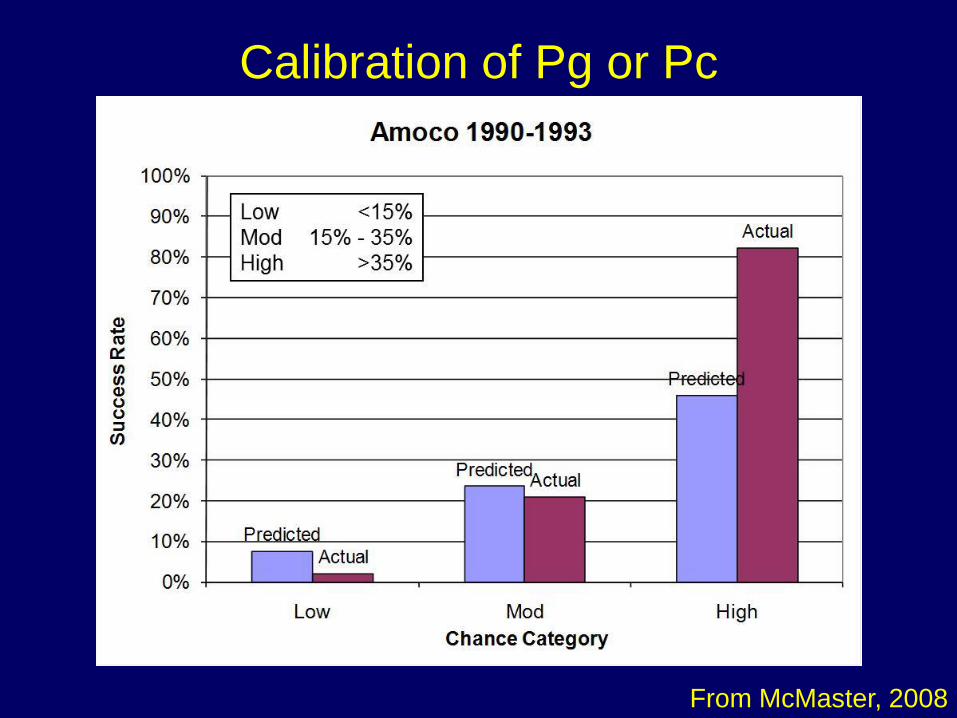
Calibration of Pg or Pc
From McMaster, 2008

Calibration of Pg or Pc
From McMaster, 2008
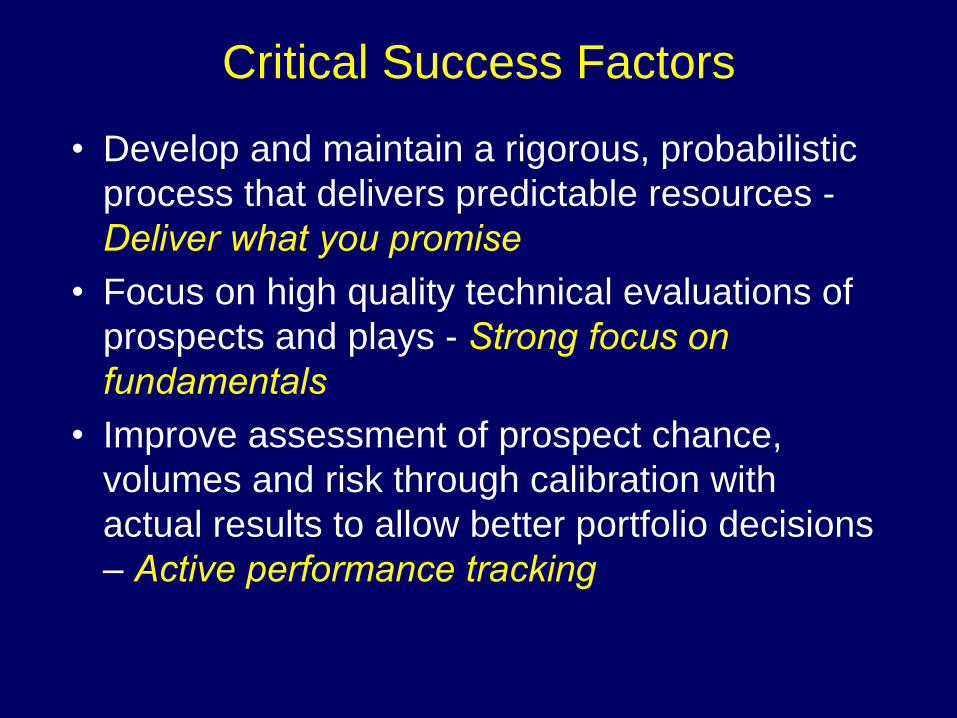
Critical Success Factors
• Develop and maintain a rigorous, probabilistic
process that delivers predictable resources -
Deliver what you promise
• Focus on high quality technical evaluations of
prospects and plays - Strong focus on
fundamentals
• Improve assessment of prospect chance,
volumes and risk through calibration with
actual results to allow better portfolio decisions
– Active performance tracking

Experience is
Inevitable,
Learning is
Not!