exploiting the installed base using cross … · 2 exploiting the installed base using...
TRANSCRIPT

Exploiting the Installed Base UsingCross-Merchandising and Category Destination Programs
Xavier Drèze*
Stephen J. Hoch**
AbstractWe investigate two ways to increase sales and customer loyalty by taking advantage of a store’sinstalled base of current customers. We propose a classification of products into two types. Products of Type 1 are products for which consumers have a loyalty to a specific retailer and asfar as possible always shop that retailer for these products. The other products (Type 2) are notassociated with any retailer and are bought at whichever retailer consumers happen to shop whenthey plan or remember to buy the product. With this in mind, we test the potential of twomarketing tools to help retailers increase their share of sales of the Type 2 segment. Using acategory destination program we show that one can successfully transform Type 2 into Type 1products. Using cross-merchandising promotions, we show that one can increase the sales ofType 2 products thereby getting a larger share of discretionary purchases than what one wouldreceive from a straight random allocation. Both series of tests yielded significant increases insales and profits and were deemed successful by the retailers who implemented them.
Xavier Drèze is Assistant Professor of Marketing at the Marshall School of Business, *
University of Southern California. Stephen J. Hoch is John J. Pomerantz Professor of Marketing at the Wharton School,**
University of Pennsylvania.

2
Exploiting the Installed Base Using
Cross-Merchandising and Category Destination Programs
Food retailers in the U.S. and Europe face a hostile environment characterized by slow
population growth and excess retail capacity. And as alternative store formats such as mass
merchant discounters (Wal-Mart), warehouse club operations (Price Club/Costco), and category
killer specialists (PetSmart, Toys ’R Us) continue to carve off lines of business traditionally
dominated by grocery stores, the competitive climate intensifies. The question then becomes
whether and how food retailers can profitably grow their sales. The solution, if there is one, must
come from better exploiting the only two strategic resources available to any retailer: (a) timely
and detailed sales data; and (b) unique geographic locations.
Most retailers attempt to profitably grow sales by pursuing some combination of two
generic merchandising tactics: (a) build traffic; and (b) exploit the existing installed customer
base. With traffic building, the retailer attempts to grow store sales at a rapid rate while pursing
cost containment. Aggressive loss leader pricing is often employed to bring consumers into the
store and fuel a favorable price/value image that can be leveraged when opening new stores that
steal shares from existing competition. In the U.S. the Home Depot home improvement chain
currently is successfully using this formula to open new stores at a fast enough to compensate for
the diminishing sales rate increases generated by their portfolio of older (> 5 years) store
locations. The chain is projected to grow their sales at a 25%/annum rate through the end of the
century. In recent years food retailers have begun offering costly non-grocery services such as
branch banking, video rental, pharmacy, and even daycare to bring more customers into their
establishments. The major rationale for Wal-Mart’s supercenter concept (grocery and general
3
merchandise under the same roof) is to exploit of the higher frequency of food shopping as a
means for generating additional weekly traffic for the higher margin, non-grocery side of the
business.
Retailers who pursue the second tactic attempt to sell more merchandise to existing
customers who are already shopping their stores through a variety of merchandising ploys
designed to grab more of the consumers’ weekly discretionary spending. For example, many
retailers have recently installed frequent shopper programs that give consumers incentives for
increasing their loyalty (share of purchases) to that particular chain. In addition most Hi-Lo
retailers offer a massive number (>1500 items/week) of shallow temporary price discounts that
are unadvertised and therefore can only be bought by customers who have already come into the
store. A comprehensive store brand program also allows retailers to exploit the installed base by
inexpensively positioning their own higher margin brands next to heavily advertised traffic
building national brands (Dhar and Hoch 1996a).
Although many retailing principles work in all format types, food retailing is unique in
that it involves the purchase of hundreds of mundane, everyday items that must constantly be
replenished. Therefore, for most consumers the frequency of food shopping is high each and
every week. Given the large number of weekly shopping trips, a key to a successful retail format
is repeated store visits. Every grocery purchase starts with a store visit. A retailer cannot sell
products to consumers who do not visit their stores. A store visit, however, is a necessary but not
sufficient condition for purchase. While visiting a store, consumers might fail to purchase a
needed product for a variety of reasons. They might have habituated to purchasing the product at

4
a competitor’s store, find the price in the current store too high, or they might simply not
remember the need to buy the product and leave the store without it.
Recent research on store choice (Coca-Cola Retailing Research Council 1994) shows that
customer loyalty is low. Although typical shoppers visit supermarkets 2.2 times a week, they
will visit their regular supermarkets only 0.6 times a week. This means that an average consumer
shops at three to four different supermarket chains on a regular basis, a finding consistent with
the work of Ehrenberg and colleagues (Kau and Ehrenberg 1984, Uncles and Ehrenberg 1990).
They have documented the very high levels of penetration (>1 visits) achieved by competitive
retailers over the period of a year. Frisbie (1980) showed that households make an average of
two filler trips per week (defined as any trip where spending amounted to less than 20% of the
weekly average) to food stores above and beyond their major shopping trips. Kahn and
Schmittlein (1989) distinguished quick from regular trips and uncovered two shopper segments:
quicks, the 34% of shoppers who on average make two quick and one regular trips per week; and
regulars, the 66% of shoppers that make one regular trip per week and one quick trip every other
week.
This evidence suggests that not only do households make quite a few shopping trips to
food stores each week, they also frequent a large portfolio of different stores. It is a well-
accepted fact that most grocery related buying decisions are made once the consumer is already
in the store. Surveys of supermarket shopping behavior (Dagnoli 1987; POPAI 1994) have
found that only one third of the purchases are specifically planned before entering the store.
Park, Iyer, and Smith (1989) studied buying behavior when consumers shopped at an unfamiliar
store location (though the same chain) than they normally shopped. They found that the level of
Store A
Store B
Store C
Store D
Random allocationbased on shoppingtrips:
P(A) = # of trip to A # of trips
} } Type 1 Type 2
Meat
Wine, Beer
Produce
Specialty food
Cereals, Laundry Detergent,Bathroom Tissue
5
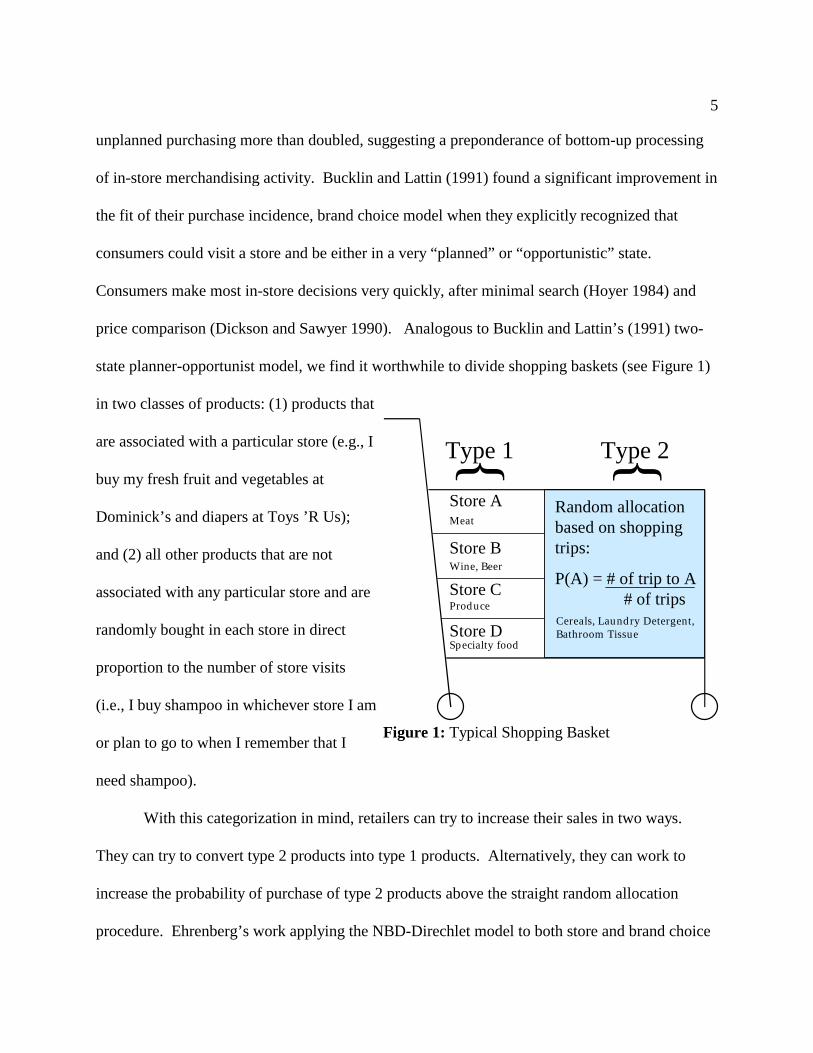
Figure 1: Typical Shopping Basket
unplanned purchasing more than doubled, suggesting a preponderance of bottom-up processing
of in-store merchandising activity. Bucklin and Lattin (1991) found a significant improvement in
the fit of their purchase incidence, brand choice model when they explicitly recognized that
consumers could visit a store and be either in a very “planned” or “opportunistic” state.
Consumers make most in-store decisions very quickly, after minimal search (Hoyer 1984) and
price comparison (Dickson and Sawyer 1990). Analogous to Bucklin and Lattin’s (1991) two-
state planner-opportunist model, we find it worthwhile to divide shopping baskets (see Figure 1)
in two classes of products: (1) products that
are associated with a particular store (e.g., I
buy my fresh fruit and vegetables at
Dominick’s and diapers at Toys ’R Us);
and (2) all other products that are not
associated with any particular store and are
randomly bought in each store in direct
proportion to the number of store visits
(i.e., I buy shampoo in whichever store I am
or plan to go to when I remember that I
need shampoo).
With this categorization in mind, retailers can try to increase their sales in two ways.
They can try to convert type 2 products into type 1 products. Alternatively, they can work to
increase the probability of purchase of type 2 products above the straight random allocation
procedure. Ehrenberg’s work applying the NBD-Direchlet model to both store and brand choice
6
data suggest that in steady-state all products are of type 2 and that neither of the above tactics
will work, at least in the long-run. In equilibrium, Ehrenberg may well be right, but we think of
marketing as responsible for helping firms adapt to a continually evolving set of disequilibria.
With this in mind we believe that the above objectives can be reached using a variety of
marketing tools including advertising, price promotion, special displays, etc. In this paper, we
investigate the potential of two marketing techniques to achieve these goals. First we test the
effectiveness of category destination programs as a way to convert type 2 products into type 1.
Second, we test the ability of cross-merchandising techniques to alter consumers’ in-store
behavior and thus increase the probability that a product is bought given that the consumer is
already in the store (i.e., increase a retailer’s share of type 2 products).
The tests we implemented focused on general merchandise and health and beauty care
products (GM/HBC). We selected these categories because they are an underdeveloped area of
today’s supermarkets. While supermarkets represent more than 70% of all food and dry grocery
sales, they have only 20% of the GM sales. According to Nielsen, supermarkets’ share of HBC
went from 37% in 1986 to 34% in 1993, while mass merchandisers enjoyed a steady growth from
18% to 26%. From preliminary analysis conducted on the customer files from a U.S. east coast
grocery chain, we found that about 75% of shopping trips were made without a purchase in the
GM/HBC categories. Yet when consumers did actually purchase GM/HBC products, they spent
an additional $5 to $6, increasing their check-out bill by almost 25%. Hence, GM/HBC is an
area of the store with much potential for increased discretionary purchases if more of the
consumers who walk in the front door can be encouraged to visit this low traffic area. The
7
situation is analogous to the problem faced by a small store tucked in a remote corner of a
sprawling suburban mall or the top floor of a multistoried department store.
The next two sections of this paper will describe the two studies, starting with the
category destination program, then going on to the cross-merchandising experiments. The last
section of this paper pulls together managerial implications of the two studies.
Category Destination Programs
Category destination programs are one of many different types of continuity programs.
Continuity programs such as an airline’s Frequent Flyer club or Subway’s “Buy 10 subs and get
the 11 free” are designed to increase loyalty by rewarding repeat purchases. They createth
artificial switching costs through the rewarding of cumulative purchases rather than current
purchases (Banerjee and Summers 1987). The consumers who want to benefit from these
programs are locking themselves into purchasing from a single source since switching to another
source would imply losing the benefits accumulated through past actions.
Category destination programs and continuity programs are similar in that they both try to
motivate customers to return to the same chain multiple times during a specified time period.
They are different however in two aspects. First, category destination programs only reward
purchases made in a specific group of related categories (e.g., a hosiery card at an upscale
department store or a photo finishing rebate program). Most of the frequent shopper programs
offered by food retailers provide incentives on all categories sold in the store, whereas the
category destination program has a more focused identity borrowed from the categories
themselves. Second, they typically have either a real or apparent membership element. These

8
two characteristics are aimed at creating in the mind of the consumers a direct link between the
program category and the retailer, thereby transforming the destination category from a type 2
into a type 1 category for that retailer.
Program Design
Category destination programs encourage customers to shop a given retailer for a specific
group of products. These programs are particularly aimed at customers who are already shopping
the store, but are only casual shoppers of the target categories. The best destination categories
will be ones that exhibit higher consumer involvement, dollar expenditure, and purchase
frequency because identity creation will be easier. One group of categories which meets these
requirements is baby products.
Baby related products are an ideal vehicle for a category destination program for a
number of reasons. First, households with newborns have annual expenditures on baby related
groceries (disposable diapers, formula, baby food, wipes, and baby accessories) ranging from
$1,500 to $2,500 (Parents Magazine, Mar. 1994). Second, a newborn increases the frequency of
shopping trips in most families. Third, when asked what is most important to them in their
shopping experience, new parents are unanimous: combining grocery and baby needs into a one-
stop shopping trip. Moreover, families with infants are less likely to have well-established
shopping patterns, both because of their age and the fact that they are less likely to have resided
at their address for long periods of time. Fourth, the customers who purchase the most baby care
products are more affluent and educated than the general population (Supermarket Business, Dec.
1994). And fifth, the beginning of this decade has seen the highest number of births since the
CHECKOUT COUPON CHECKOUT COUPON CHECKOUT COUP
CHECKOUT COUPON CHECKOUT COUPON CHECKOUT COUP
COLLECT AND SAVE
*********************************YOU HAVE EARNED
$ 53.38 IN “BABY BUCKS”*********************************
A $10 ABCO FOODSGIFT CERTIFICATE
WILL BE ISSUED FOREACH $100 OF “BABY BUCKS”YOU REDEEM AT YOUR LOCAL
ABCO FOODS.
NOT REDEEMABLE FOR CASH
EARN “BABY BUCKS”FOR EVERY BABY ITEM PURCHASED
AT ABCO FOODSBETWEEN NOW AND FEB. 1, 1995
COLLECT AND SAVE $100 IN“BABY BUCKS”
AND RECEIVE A $10 ABCO FOODSGIFT CERTIFICATE
SALES TAX NOT APPLICABLE.
��
�������������
9
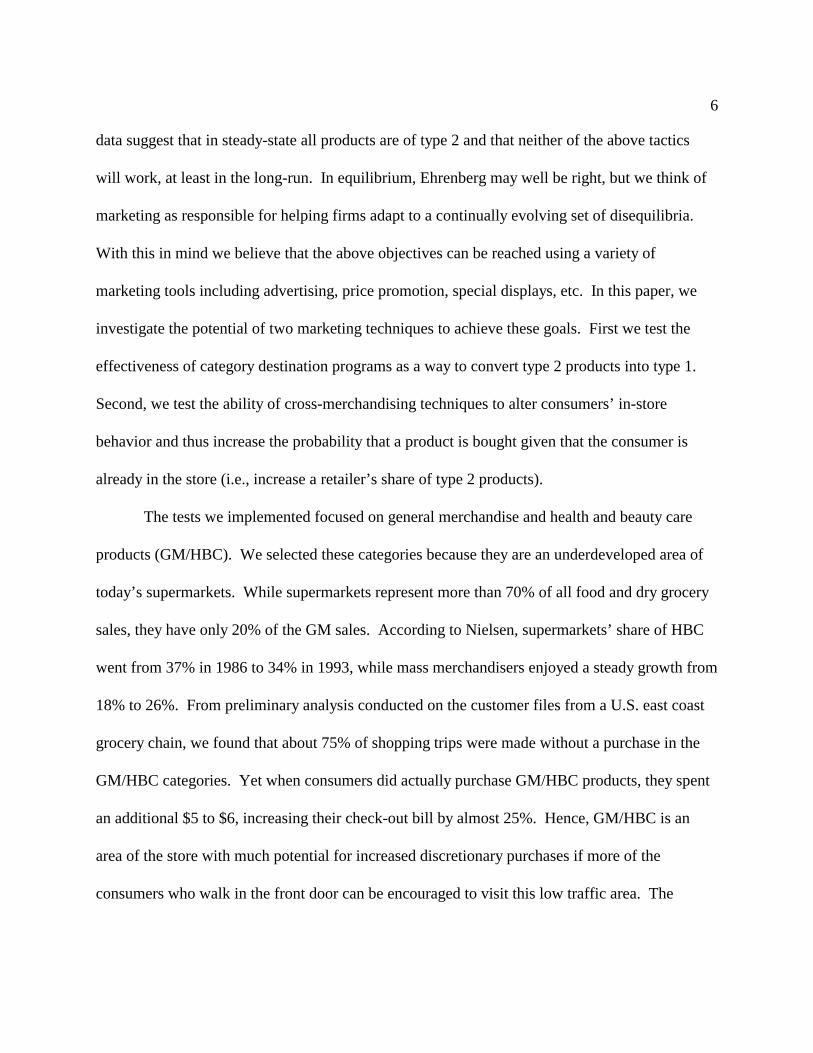
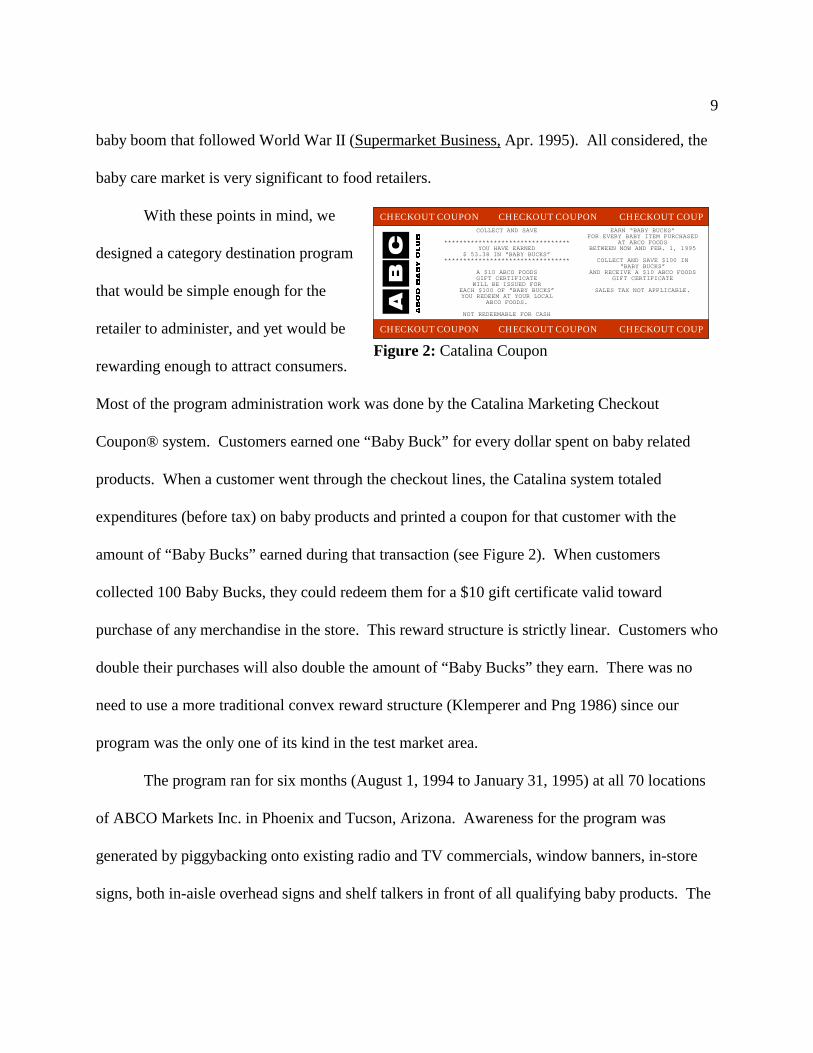
Figure 2: Catalina Coupon
baby boom that followed World War II (Supermarket Business, Apr. 1995). All considered, the
baby care market is very significant to food retailers.
With these points in mind, we
designed a category destination program
that would be simple enough for the
retailer to administer, and yet would be
rewarding enough to attract consumers.
Most of the program administration work was done by the Catalina Marketing Checkout
Coupon® system. Customers earned one “Baby Buck” for every dollar spent on baby related
products. When a customer went through the checkout lines, the Catalina system totaled
expenditures (before tax) on baby products and printed a coupon for that customer with the
amount of “Baby Bucks” earned during that transaction (see Figure 2). When customers
collected 100 Baby Bucks, they could redeem them for a $10 gift certificate valid toward
purchase of any merchandise in the store. This reward structure is strictly linear. Customers who
double their purchases will also double the amount of “Baby Bucks” they earn. There was no
need to use a more traditional convex reward structure (Klemperer and Png 1986) since our
program was the only one of its kind in the test market area.
The program ran for six months (August 1, 1994 to January 31, 1995) at all 70 locations
of ABCO Markets Inc. in Phoenix and Tucson, Arizona. Awareness for the program was
generated by piggybacking onto existing radio and TV commercials, window banners, in-store
signs, both in-aisle overhead signs and shelf talkers in front of all qualifying baby products. The
10
program was also featured in ABCO weekly circulars with the message: “Get a free $10 gift
certificate. Join the ABCO Baby Club. See store manager for details.”
Hypotheses
If a category destination program is to be successful, it must have a significant impact on
the shopping pattern of customers at the retailer offering the program. The most significant
impact will be at the category level with some possible spillover to the rest of the store. First and
foremost, the program should increase the sales of the target categories. We will thus formulate
hypothesis 1 as:
H : Total sales in the destination categories will increase during the test program.1
The underlying motivation of the destination program is to increase store loyalty by
transforming a type 2 category into a type 1 category. This should induce consumers to shop for
the destination category almost exclusively at the retailer offering the program, resulting in more
of their shopping trips including purchases of the target categories.
Although food retailers have a dominant share of the business in formula and baby food
(>85%), mass merchandisers have captured a significant share of the sales in the Diapers (40%)
and baby accessories (55%) categories (Supermarket Business, Apr. 1995). Moreover, these
categories represent high ticketed items. Therefore, we expect that not only will customers shop
the target categories more often, they also will spend more on these categories during each
shopping trip. We will then formulate hypotheses 2 and 3 as:
H : The number of transactions involving the destination categories will increase2
during the test as consumers gradually shift their baby purchases to the target
retailer and newly created parents enter the market for the first time.
11
H : The total amount of money spent on baby products on each shopping trip3
(conditional on purchase) will increase during the test as consumers become more
familiar with the program.
Lastly, we can look at the impact of the program on store patronage and possible spillover
to other categories. Since the program targeted only a very specific group of products that are of
interest to only a fraction of the population, households with infants who were already shopping
at ABCO Foods, we did not expect to see an increase in traffic due to the program. The lack of
an increase in traffic means that categories which are not in the program should not see a
significant spillover effect due to the program. Hence, we will formulate hypotheses 4 and 5:
H : Store traffic will be unaffected by the category destination program.4
H : The category destination program will not affect the sales of unrelated categories.5
Test Results
Sales and traffic data were collected at ABCO during the 6-month test of the Baby Club
program. These data were then compared with data collected during the same time period a year
previous to account for seasonality and any trends over the time series. The use of mass media
promotion precluded us from setting up a group of control stores where the program was not
implemented. Therefore, we have a simple pre-post quasi-experimental design. To reduce
potential interpretation problems, we obtained market level information on baby categories sales
from Information Resources, Inc. and used these data to control for any population growth or
exogenous shocks such as a sudden craze for baby related items that could account for an
increase in sales.
12
In terms of baby category sales, the program yielded an overall increase of 25%, with the
largest increase experienced in the baby formula category with 35%, followed by baby food
(18%) and diapers (17%), with the smallest increase in baby accessories and wipes (7%). The
sales data are displayed in Figure 3 where we have plotted ABCO dollar sales versus the rest of
the market in both the pre-period and during the test. The 25% increase obviously is statistically
significant, t=-7.46, p<.0001, and validates H , but more importantly it is economically1
significant as will become readily apparent when we examine the profit implications later. In
Figure 3, sales were scaled to a common index of 100 for the pre-experimental period. This
graph provides convincing evidence of the value of the program. Both ABCO and the rest of the
market have the same intercept at the start of the test, but immediately thereafter continue to
diverge throughout the period of the test. We assume that the sales effect would asymptote at
some point, but there is no evidence of peaking out by the end of six months. The two slopes are
quite different, 0.5 for the rest of the market compared to 1.96 for ABCO.
Given the weaknesses that accompany quasi-experiments, we ran a series of tests on the
market and chain level time series to ensure that the sales increase could not be attributed to
external factors. We fitted a series of models to measure market growth, seasonality and
differences in growth rates between market and chain level sales. The analysis revealed no
significant market growth between the pre-experimental and test periods (t=0.88, p=0.38) for the
total market (ABCO plus the rest of the market). However, it revealed growth within each time
period attributable to a significant amount of seasonality. We fitted this seasonality using
straight line OLS; it turned out to be statistically significant (t=3.46, p<0.001). The seasonality
adjustments are not significantly different for ABCO and for the total market area (t=0.83,
13
p=0.41). Furthermore, the seasonality adjustments at the market levels are not significantly
different for the two periods (t=-0.72, p=0.48).
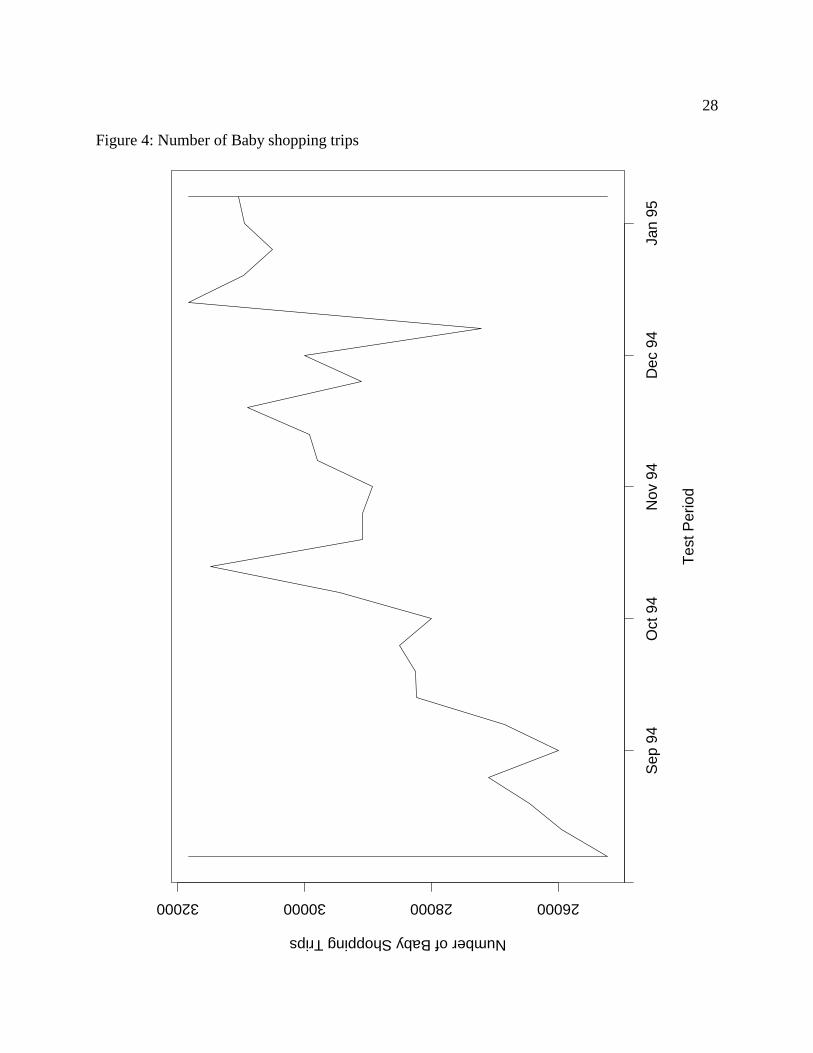
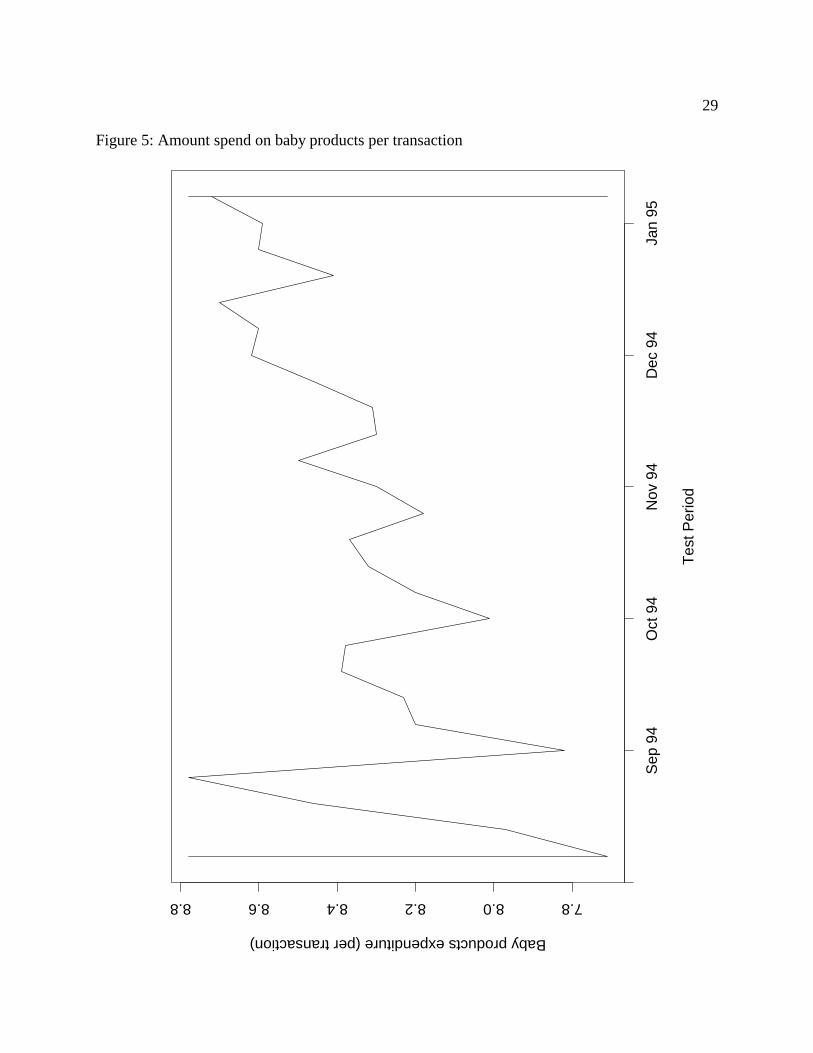
To validate hypotheses 2 (number of transactions) and 3 (size of transactions), we
analyzed the data collected by the Catalina system. From the beginning of the test period to the
end, the number of customers buying baby products each week steadily rose by 25% (see Figure
4). At the same time, store traffic rose by only 5%. The per capita dollar value of each baby
transaction also rose, by 7.5% over the 6-month test period (see Figure 5). Unfortunately, we do
not have transaction data from the pre-period. But taken as a whole, the data tend to support both
hypotheses 2 and 3.
Hypothesis 4 and 5 however were disconfirmed. Store traffic during the test rose by 5%
and total grocery sales increased by 4%. These numbers are much smaller than those associated
with the baby club; however, they are statistically different from zero, p’s<.05.
Cost of the Baby Club Program
We have just shown that the category destination program had a positive impact on sales.
However, to be an effective marketing tool, it must be that the rewards from the program far
outstrip the costs of running it. The main cost of this program came from the redemption value
of the gift certificates. (Advertising expenditures essentially are a weekly fixed cost of doing
business; the in-store display materials cost less than $2500.) Baby product sales during the
promotion totaled more than $6 million. With each Baby Buck having a 10¢ face value ($10 gift
certificate for each $100 of purchases), the full promotional liability of the program could have
run as much as $637,250 if all consumers had redeemed 100% of their Baby Bucks. Assuming a
normal category gross profit margin of 25%, breakeven margin arithmetic (Hoch, Drèze, and
14
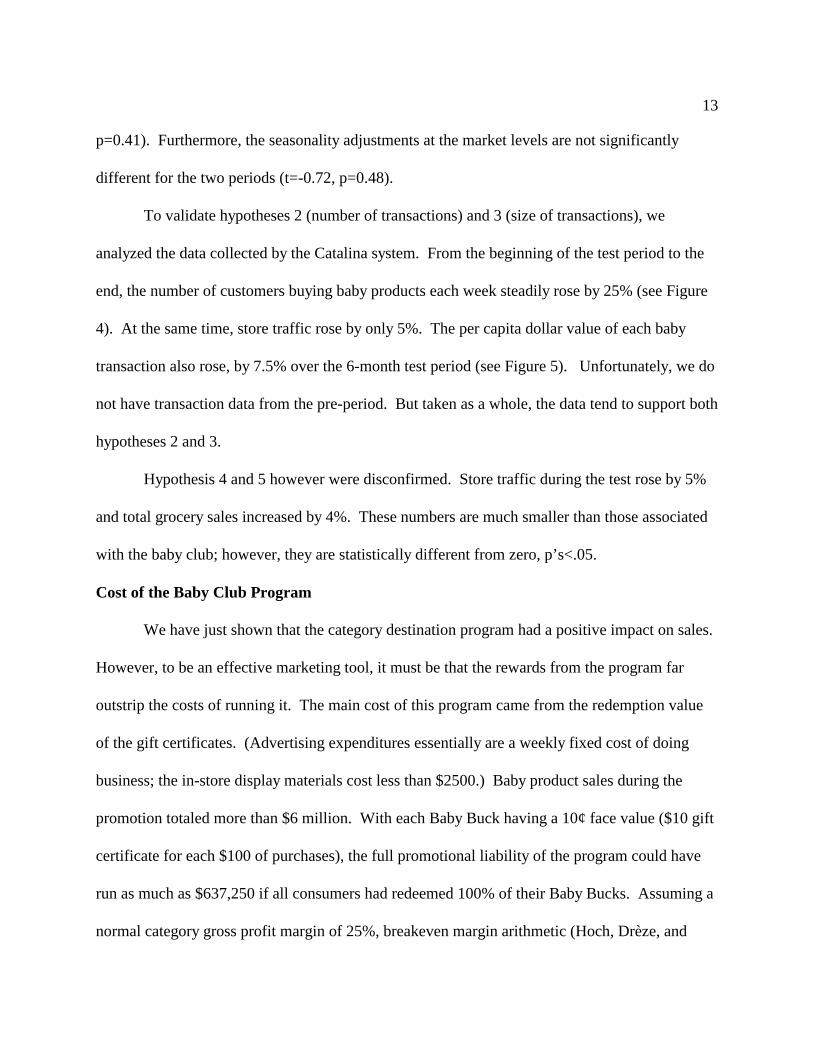
Total Baby Category Sales $6,372,501
Actual Baby Bucks Redeemed $182,650 for $10 Gift Certificate (29% redemption of BB coupons)
Gift Certificates Redeemed $146,120 (80% redemption)
Cost of Goods Sold on Certificate $109,590 (25% Gross Margin)
Table 1: Cost of Baby Club Program
Purk 1994) shows that sales would have
had to increase 67% to cover the full
10% promotion liability associated with
100% redemption. Therefore, with full
redemption the retailer would have lost
money since the 25% sales gain was way
below the 67% breakeven point.
In our case, however, as shown in Table 1 only 29% of the Baby Buck coupons actually
were turned in, resulting in the issuing of $182,650 worth of gift certificates. This low
redemption rate is probably due to multiple factors, including some consumers who did not reach
the $100 threshold and other consumers who “spaced-out” and lost or forgot about the coupon
after the fact (Hoch 1996). This low redemption rate is reminiscent of Dhar and Hoch (1996b)
and further demonstrates the price discrimination advantages of coupons compared to
automatically received off-the-shelf price discounts. Further reducing the promotional liability
was the fact that only 80% of the gift certificates were eventually redeemed, lowering the liability
from $182,650 to $146,120. Finally, if we take into account that the incremental cost of goods
sold is 75% of the full retail price (100% - the 25% gross margin), the net liability ends up to be
only $109,590 (see Table 1).
As a percent of sales, the cost of the promotion was 1.72%. On the reward side, we have
a 25% increase in Baby categories sales of $1,274,500 (see Table 2), which leads to an
incremental gross profit of $318,625. Hence, we can compute the return on investment (Net
Gain / Cost) for this promotion: 190% increase in profit. A return on investment of this

15
Increase in Baby Sales $1,274,500 Due to the Program
Gross Profits on Incremental Sales $318,625 (25% Gross Margin)
Cost of Promotion $109,590
Net Gain on Baby Categories $209,035
Table 2: Rewards from the Baby Club Program
magnitude over such a short period is quite impressive. In fact, the program was judged to be
such a success by ABCO that it was reinstated shortly after the results were made available.
One of the reasons why the
program was successful is that it managed
to keep the costs down. In the mind of
many consumers, the program was
equivalent to 10% off all baby purchases.
In reality the program cost ABCO less
than 2% of sales. The reasons behind this are simple. First, consumers were rewarded only
when their expenditures on baby products reach a multiple of $100. This means that casual and
transient shoppers were not rewarded. Second, in order to benefit from the promotion,
consumers needed not only to collect the baby bucks, but also redeem the gift certificates. Third,
the gift certificates were good only for the purchase of new merchandise at ABCO, hence their
cost to the retailer was only 75 cents on the dollar.
Taking Advantage of Existing Traffic
With the Baby Club, we worked on increasing the sales of a category that represented a
high involvement, high volume, frequent purchase for consumers in the target group. The same
technique would probably not work for low involvement, long purchase cycle, or small priced
items. Who would join the Shoe Polish Club? For these “smaller” categories we tried another
approach: cross-merchandising. The basic idea behind cross-merchandising was to take
advantage of the fact that customers are already visiting the store, and induce them to shop a part

16
of the store they might not normally think about shopping. We attempted to do so by re-routing
traffic from a Draw category to a Target category. A draw category is defined as a category that
enjoys more foot traffic than the target category. Re-routing was accomplished by running a
promotion on the target item and cross-referencing that promotion with the purchase of the draw
item. For instance, we might promote bar soap (target) and tie-in the promotion with the
purchase of bath tissue (draw). Next to the bath tissue product, we display a sign mentioning that
there is a special deal on soap when one buys the bath tissue. The sign also would appear next to
the soap products.
Program Design
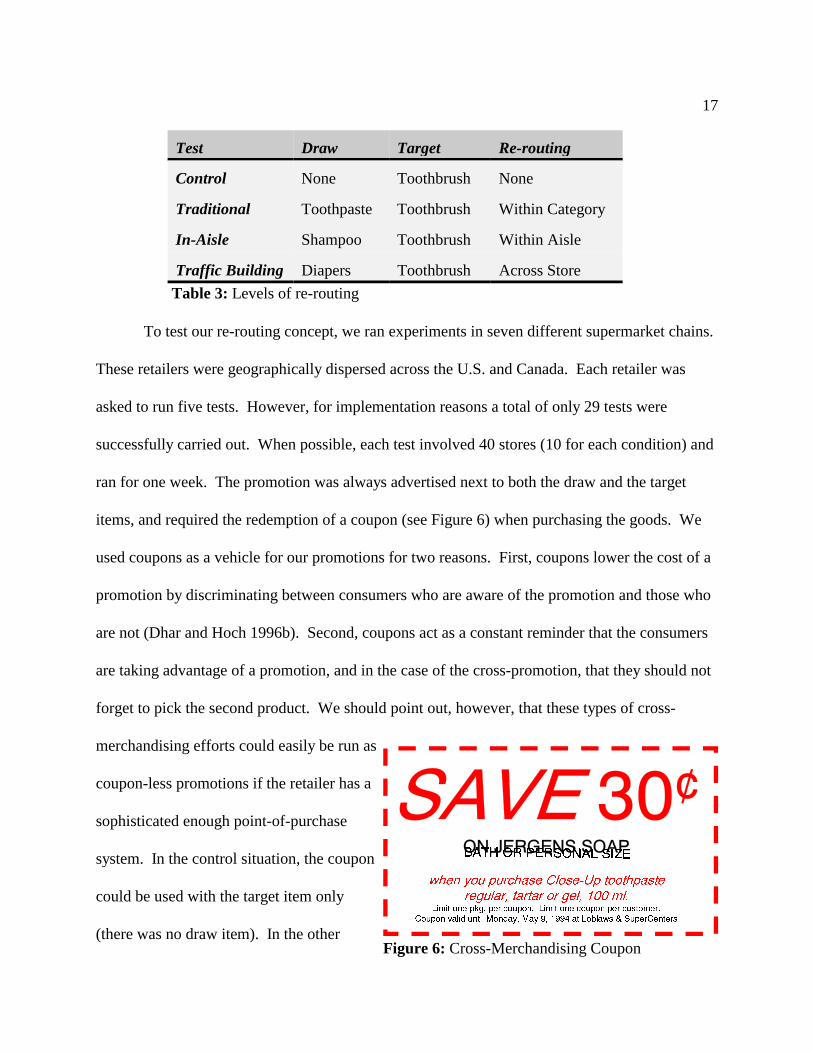
We tested four levels of re-routing: Control, Traditional, In-Aisle, and Traffic Building
(see Table 3). The control situation is used as a base line for the other conditions, and is a case
where no re-routing takes place. The promotion on the target item is not linked to any other
products. In the traditional case, the draw and the target items belong to complementary
categories. This is a simple case where we are saying to the consumers: “Why don’t you buy a
toothbrush along with that toothpaste?” The in-aisle setup requires a bit more effort on the part
of the consumers. In this case, we link two items that reside in the same aisle, but belong to
different non-complementary categories. We might for instance cross-promote toothbrushes with
shampoo. The last level of re-routing, traffic building, links two categories which are not only
unrelated, but also are located far from each other in the store. Here, the draw item might be
disposable diapers, and its associated target item toothbrushes or laundry baskets.
��������
������������ �������� ���� ������������ ��
���� ��� ���� � ��� ��� ������ ��
������ ���� � ���� ��� �������� ��� �� � ������ ����� ��� ����� � ������� �
����� ����� ����� ������� ��� �� ���� �� ������� � ��� ����� �
17
Figure 6: Cross-Merchandising Coupon
Test Draw Target Re-routing
Control None Toothbrush None
Traditional Toothpaste Toothbrush Within Category
In-Aisle Shampoo Toothbrush Within Aisle
Traffic Building Diapers Toothbrush Across Store
Table 3: Levels of re-routing
To test our re-routing concept, we ran experiments in seven different supermarket chains.
These retailers were geographically dispersed across the U.S. and Canada. Each retailer was
asked to run five tests. However, for implementation reasons a total of only 29 tests were
successfully carried out. When possible, each test involved 40 stores (10 for each condition) and
ran for one week. The promotion was always advertised next to both the draw and the target
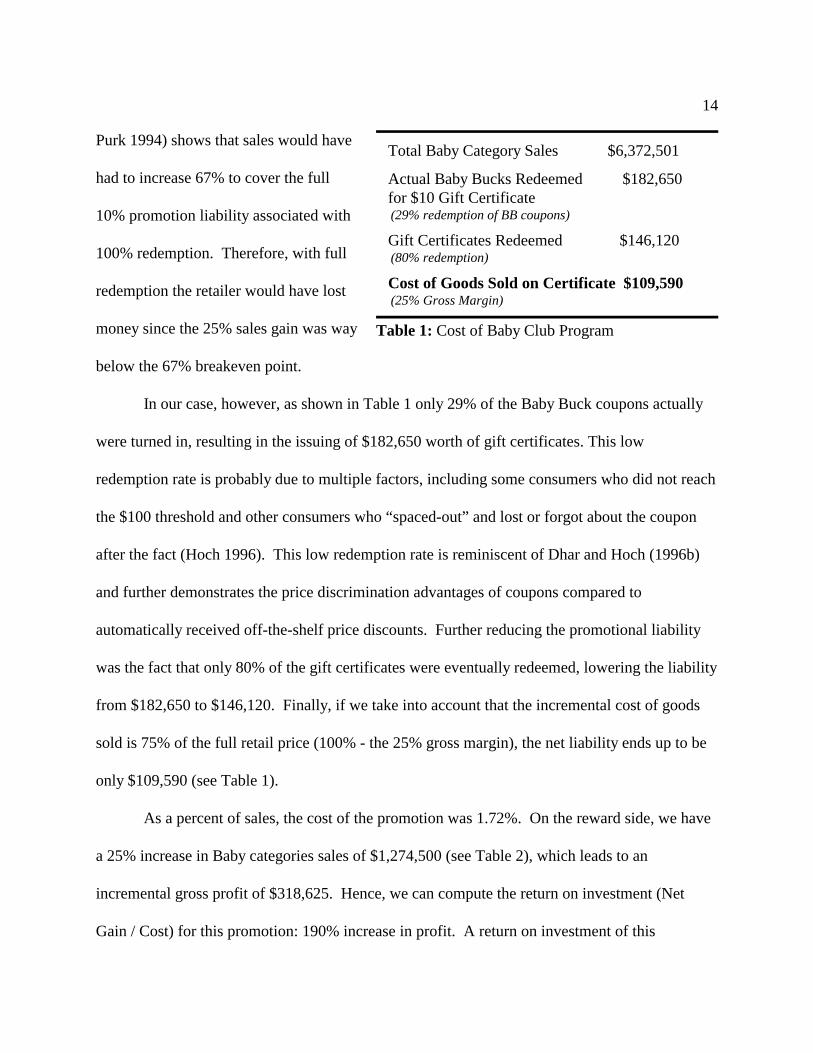
items, and required the redemption of a coupon (see Figure 6) when purchasing the goods. We
used coupons as a vehicle for our promotions for two reasons. First, coupons lower the cost of a
promotion by discriminating between consumers who are aware of the promotion and those who
are not (Dhar and Hoch 1996b). Second, coupons act as a constant reminder that the consumers
are taking advantage of a promotion, and in the case of the cross-promotion, that they should not
forget to pick the second product. We should point out, however, that these types of cross-
merchandising efforts could easily be run as
coupon-less promotions if the retailer has a
sophisticated enough point-of-purchase
system. In the control situation, the coupon
could be used with the target item only
(there was no draw item). In the other
18
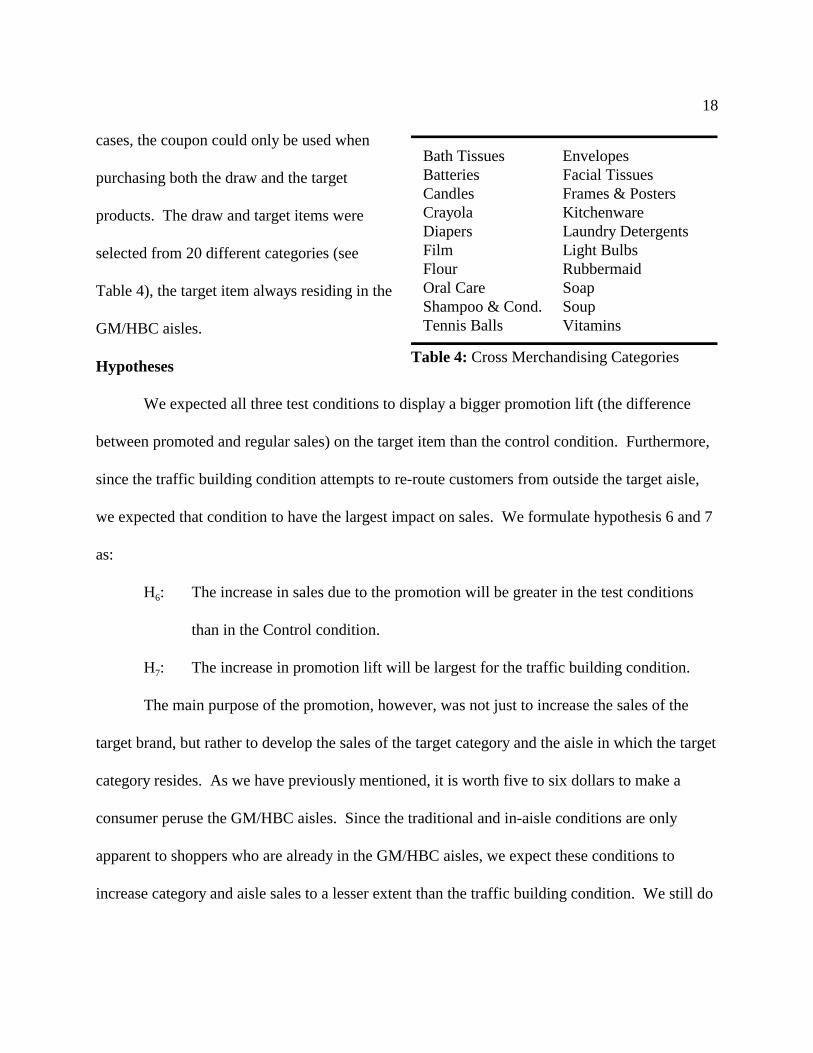
Bath Tissues Envelopes Batteries Facial Tissues Candles Frames & Posters Crayola Kitchenware Diapers Laundry Detergents Film Light Bulbs Flour Rubbermaid Oral Care Soap Shampoo & Cond. Soup Tennis Balls Vitamins
Table 4: Cross Merchandising Categories
cases, the coupon could only be used when
purchasing both the draw and the target
products. The draw and target items were
selected from 20 different categories (see
Table 4), the target item always residing in the
GM/HBC aisles.
Hypotheses
We expected all three test conditions to display a bigger promotion lift (the difference
between promoted and regular sales) on the target item than the control condition. Furthermore,
since the traffic building condition attempts to re-route customers from outside the target aisle,
we expected that condition to have the largest impact on sales. We formulate hypothesis 6 and 7
as:
H : The increase in sales due to the promotion will be greater in the test conditions6
than in the Control condition.
H : The increase in promotion lift will be largest for the traffic building condition.7
The main purpose of the promotion, however, was not just to increase the sales of the
target brand, but rather to develop the sales of the target category and the aisle in which the target
category resides. As we have previously mentioned, it is worth five to six dollars to make a
consumer peruse the GM/HBC aisles. Since the traditional and in-aisle conditions are only
apparent to shoppers who are already in the GM/HBC aisles, we expect these conditions to
increase category and aisle sales to a lesser extent than the traffic building condition. We still do
19
expect them to increase sales because they are slowing down the shopping process and cause
consumers to spend more time in the GM/HBC aisles, and actually search for products.
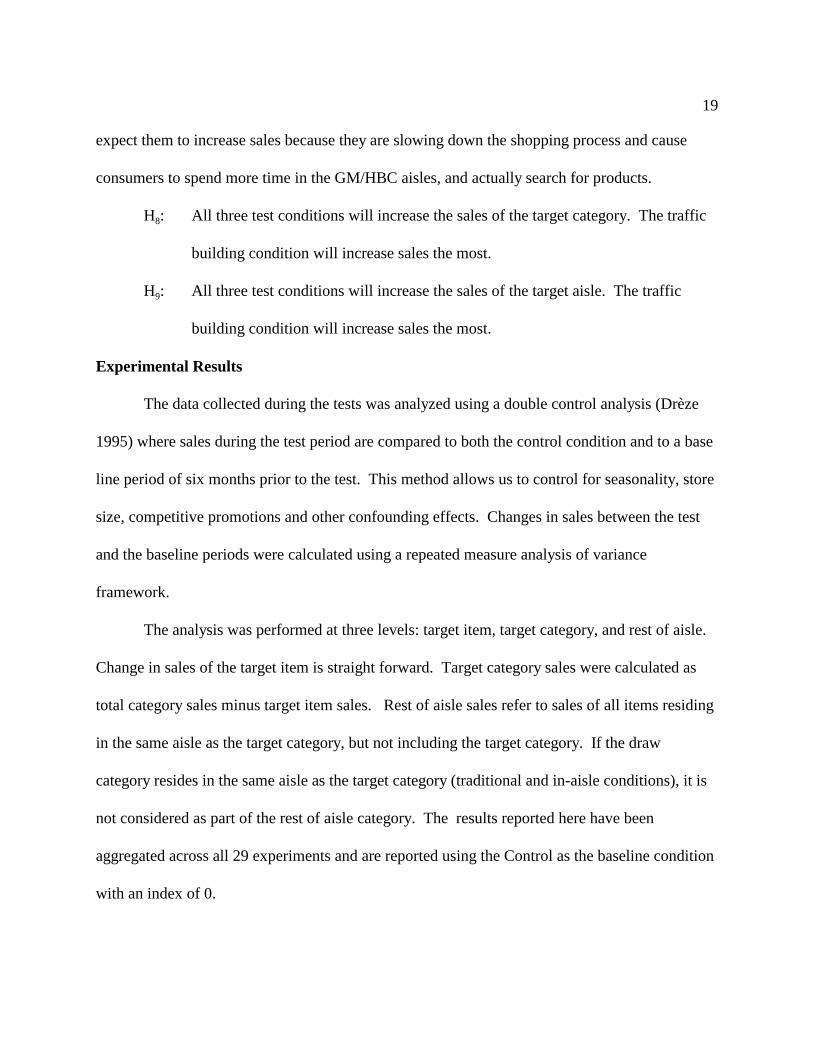
H : All three test conditions will increase the sales of the target category. The traffic8
building condition will increase sales the most.
H : All three test conditions will increase the sales of the target aisle. The traffic9
building condition will increase sales the most.
Experimental Results
The data collected during the tests was analyzed using a double control analysis (Drèze
1995) where sales during the test period are compared to both the control condition and to a base
line period of six months prior to the test. This method allows us to control for seasonality, store
size, competitive promotions and other confounding effects. Changes in sales between the test
and the baseline periods were calculated using a repeated measure analysis of variance
framework.
The analysis was performed at three levels: target item, target category, and rest of aisle.
Change in sales of the target item is straight forward. Target category sales were calculated as
total category sales minus target item sales. Rest of aisle sales refer to sales of all items residing
in the same aisle as the target category, but not including the target category. If the draw
category resides in the same aisle as the target category (traditional and in-aisle conditions), it is
not considered as part of the rest of aisle category. The results reported here have been
aggregated across all 29 experiments and are reported using the Control as the baseline condition
with an index of 0.
�
��
��
��
��
��
��
��
�� � � �������� �������� ����
��������
20
Figure 7: Coupon Redemption
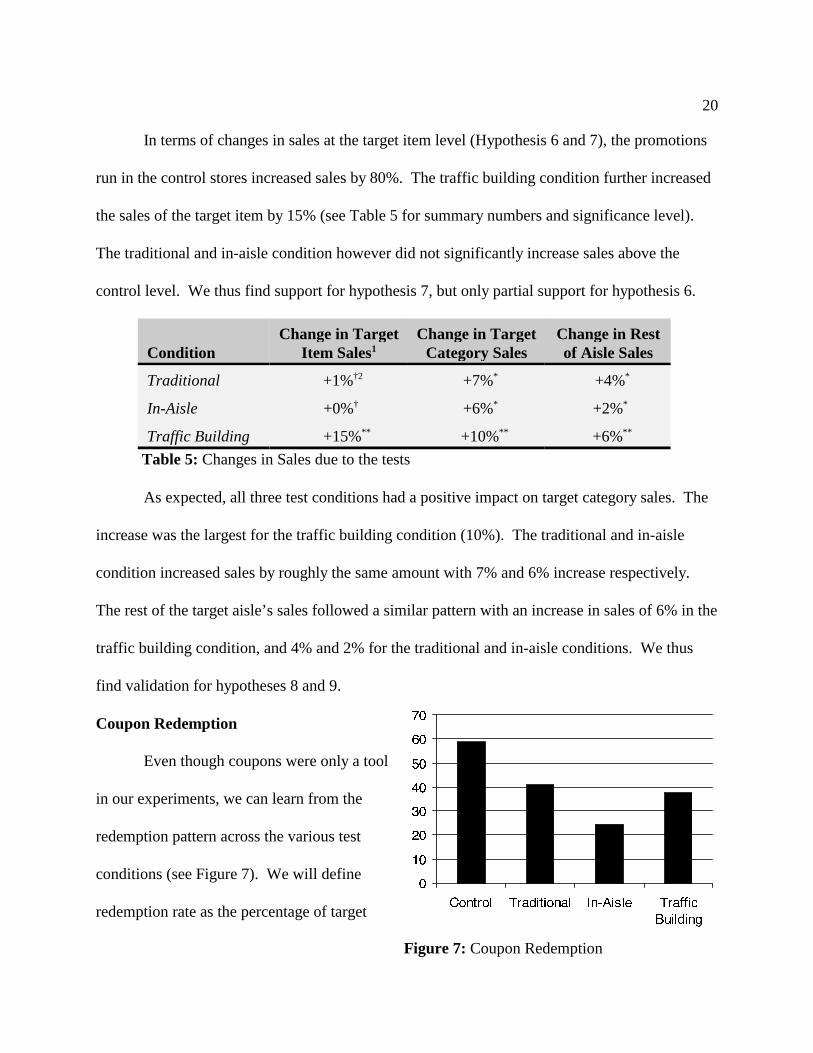
In terms of changes in sales at the target item level (Hypothesis 6 and 7), the promotions
run in the control stores increased sales by 80%. The traffic building condition further increased
the sales of the target item by 15% (see Table 5 for summary numbers and significance level).
The traditional and in-aisle condition however did not significantly increase sales above the
control level. We thus find support for hypothesis 7, but only partial support for hypothesis 6.
Condition Item Sales Category Sales of Aisle SalesChange in Target Change in Target Change in Rest
1
Traditional +1% +7% +4%†2 * *
In-Aisle +0% +6% +2%† * *
Traffic Building +15% +10% +6%** ** **
Table 5: Changes in Sales due to the tests
As expected, all three test conditions had a positive impact on target category sales. The
increase was the largest for the traffic building condition (10%). The traditional and in-aisle
condition increased sales by roughly the same amount with 7% and 6% increase respectively.
The rest of the target aisle’s sales followed a similar pattern with an increase in sales of 6% in the
traffic building condition, and 4% and 2% for the traditional and in-aisle conditions. We thus
find validation for hypotheses 8 and 9.
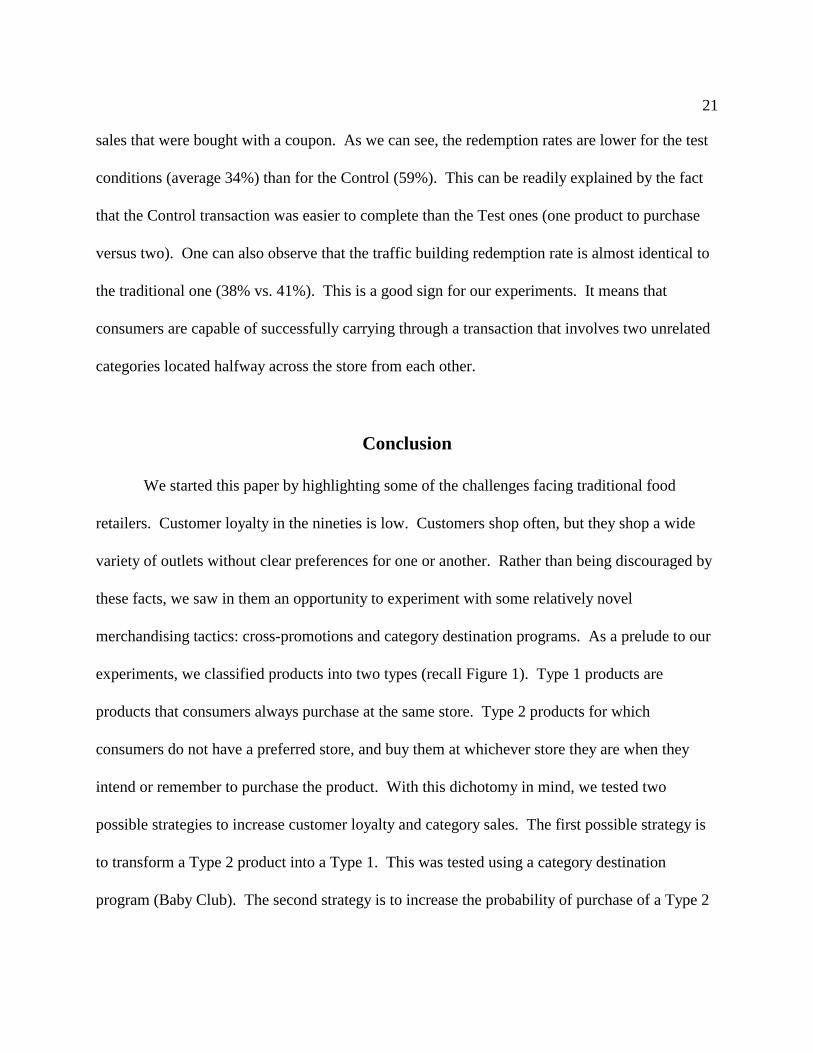
Coupon Redemption
Even though coupons were only a tool
in our experiments, we can learn from the
redemption pattern across the various test
conditions (see Figure 7). We will define
redemption rate as the percentage of target
21
sales that were bought with a coupon. As we can see, the redemption rates are lower for the test
conditions (average 34%) than for the Control (59%). This can be readily explained by the fact
that the Control transaction was easier to complete than the Test ones (one product to purchase
versus two). One can also observe that the traffic building redemption rate is almost identical to
the traditional one (38% vs. 41%). This is a good sign for our experiments. It means that
consumers are capable of successfully carrying through a transaction that involves two unrelated
categories located halfway across the store from each other.
Conclusion
We started this paper by highlighting some of the challenges facing traditional food
retailers. Customer loyalty in the nineties is low. Customers shop often, but they shop a wide
variety of outlets without clear preferences for one or another. Rather than being discouraged by
these facts, we saw in them an opportunity to experiment with some relatively novel
merchandising tactics: cross-promotions and category destination programs. As a prelude to our
experiments, we classified products into two types (recall Figure 1). Type 1 products are
products that consumers always purchase at the same store. Type 2 products for which
consumers do not have a preferred store, and buy them at whichever store they are when they
intend or remember to purchase the product. With this dichotomy in mind, we tested two
possible strategies to increase customer loyalty and category sales. The first possible strategy is
to transform a Type 2 product into a Type 1. This was tested using a category destination
program (Baby Club). The second strategy is to increase the probability of purchase of a Type 2

Random allocationbased on shoppingtrips:
P(A) = # of trip to A # of trips
}
}
Type 1
BabyProducts
Cross-Promotions
Type
2
Store A
Store B
Store C
Store D
Meat
Wine, Beer
Produce
Specialty food
22
Figure 8: New Shopping Basket
product above a simple random allocation. This second strategy was tested using cross-
merchandising promotions.
Both tests proved to be very successful. The Baby Club increased sales in the baby
related categories by 25%. It also benefitted other parts of the store by increasing foot traffic by
5% and grocery sales by 4%. The program was so popular that it was reinstated shortly after the
test was concluded. The cross-merchandising tests showed that it is possible to take advantage of
foot traffic and increase sales in under-visited areas of a store. This was done by re-routing
customers from high traffic categories to low traffic ones through the linking of the two
categories in a joint promotion. Our tests showed that the two categories need not be
complementary or even related. In fact the best results were obtained when the two categories
were unrelated because in this case the unrelated draw category generated the most traffic due to
its high frequency and volume of purchase.
With these two techniques, we were able to transform the shopping basket of Figure 1
into the one of Figure 8. In this new shopping basket, the baby related products are bought from
a single retailer (A, the one offering the
Baby Club program). At the same time,
using cross promotions, the retailer is also
capable of increasing the probability that
customers make their discretionary
purchases in the GM/HBC aisles in his
stores. One can look at these two
techniques as being to different forms of
23
product bundling. The cross promotions we have used are a clear example of mixed-leader
bundling (Guiltinan 1987) where one receives a special bonus on the target item when one buys
the draw item too. The baby Club can be viewed as a special case of mixed-joint bundle where
one receives the incentives after buying a bundle of baby related products that amount to $100.
This is a special case of bundling in two respects. First, the content of the bundle is determined
by the consumer and not the retailer. Second, the bundling can take place over multiple store
visits.
Of course we might wonder what would happen if everybody had a Baby Club and
everybody used cross-merchandising? One could argue that if everybody were to have the same
category destination program and used the same cross-promotions, we would be back to square
one, with no increase in sales, but sharp increases in costs. The evidence provided by the
literature on switching costs (see Klemperer, 1995, for a comprehensive review) suggests,
however, that the situation would not be this dramatic. Indeed, in a market where competitors
are capable of inducing switching costs (e.g., with the “Baby Club”), they are able to raise their
prices due to a decrease in competition between firms, and a decrease in price sensitivity on the
consumer side. This increase in prices compensates for the decrease in revenue generated by the
coupons.
We see the retailing world as a dynamic environment where retailers have to continuously
re-evaluate their strategies, testing new ideas, eliminating worn out strategies, and revising those
that work in the face of competitive reaction. Indeed, to build customer loyalty and maintain a
sufficient customer base, retailers constantly have to re-invent themselves and devise better ways
to fulfill consumers’ needs as a means of extracting consumer surplus. They have to differentiate

24
themselves from their competition in order to give their customers a reason to come back at their
stores.
Acknowledgments
The authors would like to thank the American Greetings Corporation for funding this
research. They would also like to thank the retail members of the American Greeting Research
Council II for allowing them to run experiments in their stores, IRI for providing additional
market level data, and Mary Purk for valuable insights and project management.
References
Bucklin, Randolph E., and James M. Lattin (1991), “ A Two-state Model of Purchase Incidence
and Brand Choice,” Marketing Science, 10 (Winter), pp. 24-39.
Coca-Cola Retailing Research Council (1994), “Measured Marketing: A Tool to Shape Food
Store Strategy.”
Banerjee, A., and L. H. Summers (1987), “On Frequent Flyer Programs and other Loyalty-
Inducing Economic Arrangements,” Harvard University working paper.
Dagnoli, J. (1987), “Impulse Governs Shoppers,” Advertising Age, October 5.
Dhar, Sanjay, and Stephen J. Hoch (1996a), “How Store Brand Penetration Varies by Retailer,”
Working Paper, Wharton School, University of Pennsylvania.
_____________, and ____________ (1996b), “Price Discrimination Using In-Store
Merchandising,” Journal of Marketing, 60 (January), pp. 17-30.
Dickson, Peter R., and Alan G. Sawyer (1990), “The Price Knowledge and Search of

25
Supermarket Shoppers,” Journal of Marketing, 54 (July), pp. 42-53.
Drèze, Xavier (1995), “Scanners: Utilisation de Bases de Données a des Fins Stratégiques,”
Revue Française de Gestion, September-October, pp. 76-83.
Frisbie, Gil A. Jr. (1980), “Ehrenberg's Negative Binomial Model Applied to Grocery Store
Trips,” Journal of Marketing Research, 17(3), pp. 385-390.
Guiltinan, Joseph P. (1987), “The Price Bundling of Services: A Normative Framework,” Journal
of Marketing, 51 (April), pp. 75-85.
Hoch, Stephen J. (1996), “Segmentation When Consumers Space Out,” Talk Presented at a
Meeting of the Association for Consumer Research, Tucson, AZ.
_____________, Xavier Drèze, and Mary E. Purk, “EDLP, Hi-Lo, and Margin Arithmetic,”
Journal of Marketing, 58 (October), pp. 16-27
Hoyer, Wayne D. (1984), “An Examination of Consumer Decision Making for a Common
Repeat Purchase Product,” Journal of Consumer Research, 11 (3), pp. 822-831.
Kahn, Barbara E., and David C. Schmittlein (1989), “Shopping Trip Behavior: An Empirical
Investigation,” Marketing Letters, 1 (1), pp. 55-69.
Kau, Ah Keng, and A. S. C. Ehrenberg (1984), “Patterns of Store Choice,” Journal of Marketing
Research, 21, pp. 399-409.
Klemperer, P. D. (1995), “Competition when Consumers have Switching Costs: An Overview
with Applications to Industrial Organization, Macroeconomics, and International Trade,”
Review of Economic Studies, 62, pp. 515-539.
_____________, and I. P. L. Png (1986), “Frequent-Flyer Miles: Marketing Device with
Insidious Effects,” Los Angeles Times, Section IV.3 and 8, June 8, 1986.

26
Parents Magazine (1994), “What a Baby Really Costs,” March.
Park, C. Whan, Easwar S. Iyer, and Daniel C. Smith (1989), “The Effects of Situational Factors
on In-Store Grocery Shopping Behavior: The Role of Store Environment and Time
Available for Shopping,” Journal of Consumer Research, 15 (March), pp. 422-433.
Point-of-Purchase Advertising Institute (1994), "POPAI Consumer Buying Habits Study: Special
Report," New York: POPAI.
Uncles, M. D., and A. S. C. Ehrenberg (1990), “The Buying of Packaged Goods at US Retail
Chains,” Journal of Retailing, 66 (Fall), pp. 278-296.

Sale Index
His
toric
al P
erio
dT
est P
erio
d
80100120140
Aug
Sep
Oct
Nov
Dec
Jan
Aug
Sep
Oct
Nov
Dec
Jan
AB
CO
Sal
esR
est o
f Mar
ket S
ales
His
toric
al A
vera
ge In
dexe
d at
100
Tes
t Ave
rage
27
Figure 3: Baby Category Sales
Tes
t Per
iod
Number of Baby Shopping Trips
Sep
94
Oct
94
Nov
94
Dec
94
Jan
95
26000280003000032000
28
Figure 4: Number of Baby shopping trips
Tes
t Per
iod
Baby products expenditure (per transaction)
Sep
94
Oct
94
Nov
94
Dec
94
Jan
95
7.88.08.28.48.68.8
29
Figure 5: Amount spend on baby products per transaction

30
1. Indexed to Control condition
2. † Not statistically significant * Significant at p=0.05 level ** Significant at p=0.01 level
___________________