exploiting oracle tools and utilities for monitoring and testing oracle rac otn … ·...
TRANSCRIPT

Exploiting Oracle Tools and Utilities for Exploiting Oracle Tools and Utilities for Monitoring and Testing Oracle RACMonitoring and Testing Oracle RAC
OTN Tour OTN Tour -- 20112011(Costa Rica, Ecuador, Columbia, Peru)(Costa Rica, Ecuador, Columbia, Peru)
Murali [email protected]

About me…Independent Oracle Consultant - Summersky Enterprisese-mail: [email protected]

Test! Test! Test!
• Independent load testing using tools
• Test in house application on single instance
• Test across the cluster
• Simulate current production
• Run burn out tests. 48, 68… 72 hour tests

Methodology
• Problem Statement– What, When, Where
• Information Gathering (Significance)• Area Identification• Area Drill-down• Problem Resolution• Test Against Baseline• Repeat the process

Load Testing Tools
• Third party tools
• Open source load generation tools– Hammerora
• http://hammerora.sourceforge.net/
• Swingbench– http://www.dominicgiles.com/swingbenchfaq.html– http://www.oracleracsig.org/pls/apex/f?p=105:206:706
267422512372::NO

Start with one Instance
• Application Tuning
• Instance Tuning
• Database Tuning
• O/S Tuning
© Summersky Enterprises LLC | 2011 | Murali Vallath | Slide: 6

Tools & Utilities• Enterprise Manager (EM)
– AWR (Automatic Workload Repository)– ADDM (Automatic Database Diagnostics Monitoring)– Advisors
• Oracle’s Wait Interface
• Oracle’s Event Interface
• Utilities from Metalink
Oracle Real Application Cluster | Murali Vallath | Slide: 7
Utilities from Metalink and OTN
• LTOM
• OSWATCHER
• RAC-DDT
• BLOATMASTER
• HANGFG
© Summersky Enterprises LLC | 2011 | Murali Vallath | Slide: 8
Lite Onboard Monitor (LTOM)
• Real-time diagnostic platform• Proactive rather than reactive• Real-time automatic problem detection and
data collection• Reduces time to solve problems and reduces
potential downtime
© Summersky Enterprises LLC | 2011 | Murali Vallath | Slide: 9

LTOM
• Automatic Hang Detection
• System Profiler
• Automatic Session Tracing
© Summersky Enterprises LLC | 2011 | Murali Vallath | Slide: 10
Metalink Note # 352363.1

Skip slide
© Summersky Enterprises LLC | 2011 | Murali Vallath | Slide: 11

LTOM – Directory Structure
© Summersky Enterprises LLC | 2011 | Murali Vallath | Slide: 12
Source: Metalink

Automatic Session Tracing (LTOM)
• Collects trace using 10046 at level 12• Only when the identified problem occurs• Collects all SQL associated with the
session• Helps to track back the users and SQL
associated with the problem• Enable trace for sessions owned by specific
users

Automatic Session Tracing (LTOM)
• Configure the recorder
• Turn on session tracing through LTOM
• Monitor/Control Session tracing
• Stop recorder
• Review

Automatic Session Tracing (LTOM)
• Configure the recorder– Edit the following file – $TOM_HOME/init/sessionRecorder.proper
ties
– Add the rule/threshold values to monitor– Enter a low value and a high value in centiseconds
Eg: EVENT=< wait event > <low value> <high value>

OSWATCHER (OSW)
• Collection of UNIX Shell scripts• Aids support diagnose performance issues• Operates as background process• OSW is invoked by other utilities
– LTOM– RAC-DDT
• Supports the following O/S– AIX– Tru64– Solaris– HP-UX– Linux
Metalink Note # 301137.1
© Summersky Enterprises LLC | 2911 | Murali Vallath | Slide: 16

OSWATCHER (OSW)
• oswiostat• oswmpstat• oswnetstat• oswprvtnet• oswps• oswtop• oswvmstat

OSW• Operating System CPU Queues
– Large run queue– Disk problems
• Operating system CPU Utilization– CPU utilization– Insufficient CPU capacity– High values for device interrupts– High number of context switches
• Operating system Memory– Memory leaks if any– Memory bottlenecks– Sufficient swap memory
• Operating system I/O– Average service times Metalink Note # 461054.1
© Summersky Enterprises LLC | 2011 | Murali Vallath | Slide: 18
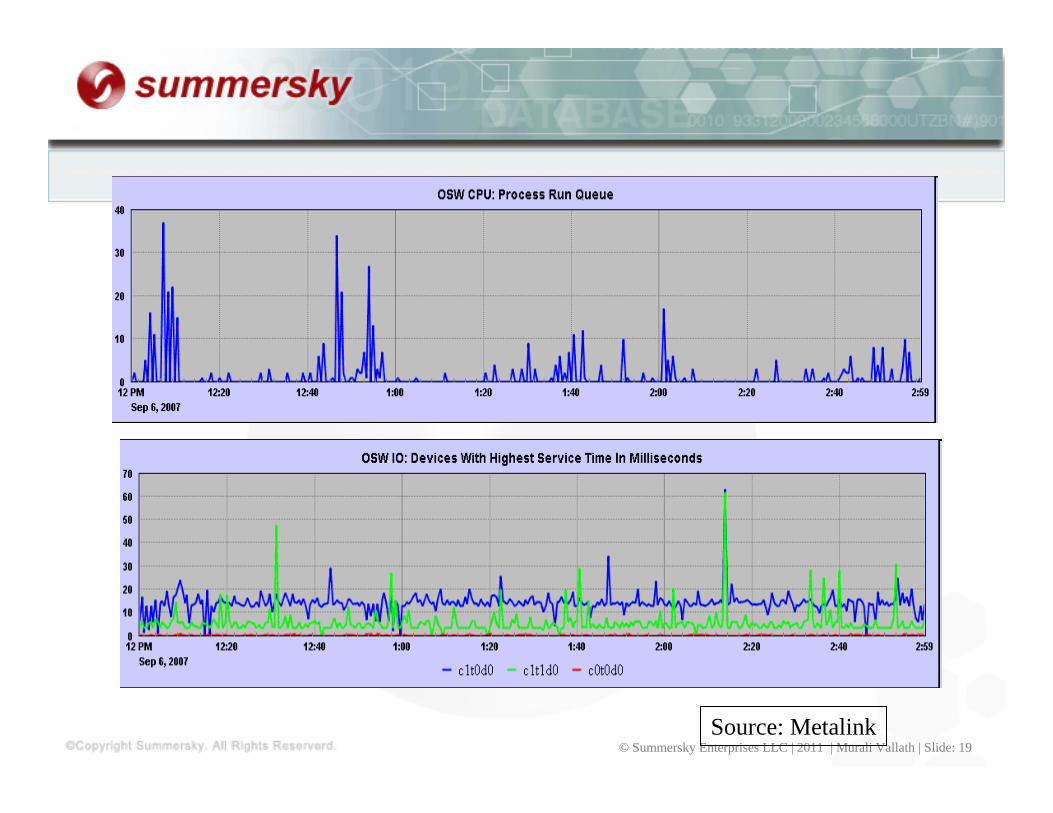
© Summersky Enterprises LLC | 2011 | Murali Vallath | Slide: 19Source: Metalink

RAC -DDT
• Collection of UNIX Shell scripts• Aids support diagnose performance issues in a
RAC environment• RAC-DTT optionally uses OSW to collect
certain O/S statistics• Supports the following O/S
– AIX– Tru64– Solaris– HP-UX– Linux Metalink Note # 301138.1
© Summersky Enterprises LLC | 2011 | Murali Vallath | Slide: 20

Other utilities..
• Used to analyze /proc/slabinfo on Linux systems from note # 435352.1
© Summersky Enterprises LLC | 2011 | Murali Vallath | Slide: 21
• oswslabinfo Analyze script from Note # 431069.1
• Linux kernal Slab accelerator from Note # 434351.1
• Hang file generator (HANGFG) from Note # 362094.1
• ORION to test the disk performance available on OTN

Other Utils
$ORACLE_HOME/rdbms/adminAwrgrpt.sql
Helps in analyzing performance of your PL/SQL code
PL/SQL Profiler
Reads raw trace or event 10046 generated trace files and output html output analyzing the trace info
TRCNLZR
Provides a detailed explain plan including CBO stats. Outputs html report
SQLTXPLAN
Q U E S T I O N SQ U E S T I O N SA N S W E R SA N S W E R S
