explanatory materials forexplanatory materials for
TRANSCRIPT
Explanatory Materials forExplanatory Materials for
Consolidated Financial Results
May 2015* Note on forecasts:
• This document (including business plans) is based on information available at the time of its preparation Nevertheless actual results may differ substantially from
TADANO Ltd.time of its preparation. Nevertheless, actual results may differ substantially from projections due to various risks and uncertainties.
Corporate ProfileCorporate Profile
[Corporate name] TADANO Ltd. (established August 24, 1948); founder: Masuo TadanoDeveloped Japan’s first hydraulic Truck Crane in 1955
[Representative] Koichi Tadano, President and C.E.O., Representative Director[Head office] Ko 34 Shinden cho Takamatsu Kagawa Japan[Head office] Ko-34 Shinden-cho, Takamatsu, Kagawa, Japan
[Major lines of business] Production and distribution of Mobile Cranes, Truck Loader Cranes, and Aerial Work Platforms[Sites] Tokyo Office [Sumida-ku], Takamatsu Plant [Takamatsu], Shido Plant [Sanuki],
Tadotsu Plant [Tadotsu] Chiba Plant [Chiba]Tadotsu Plant [Tadotsu], Chiba Plant [Chiba][Other facilities] Japan: 10 branch offices, 23 sales offices;
Outside Japan: Beijing Office [China], Middle East Office [UAE]
[Paid in capital] ¥13 021 million [Stock shares] Shares issued: 129 million[Paid-in capital] ¥13,021 million [Stock shares] Shares issued: 129 millionNumber of shareholders: 8,210 (as of March 31, 2015)
[Net sales] ¥204,059 million (FY 2014)[Number of employees] Consolidated: 3,491; non-consolidated: 1,469 (as of March 31, 2015)
[Major subsidiaries]
10 subsidiaries and one affiliate in Japan:TADANO IMES Ltd.
17 subsidiaries and two affiliates outside Japan:TADANO FAUN GmbH, TADANO FAUN Stahlbau GmbH [Germany]TADANO UK Ltd. [U.K.]
TADANO ILEC Ltd.TADANO S-TEC Ltd.TADANO ENGINEERING K.K.TADANO TECHNO EAST Co., Ltd. TADANO TECHNO WEST Co., Ltd.TADANO KYOSHU CENTER K K
TADANO America Holdings, Inc., TADANO America Corp., TADANO MANTIS Corp., [U.S.A.]TADANO Panama S.A. [Panama]TADANO Brasil Equipamentos de Elevacao Ltda. [Brazil]JC-TADANO (Beijing) Hydraulic Co., Ltd., JTL-TADANO (Hebei) Ironparts Co., Ltd. [China]TADANO (Beijing) Ltd. [China]TADANO Korea Co Ltd [South Korea]TADANO KYOSHU CENTER K.K.
TADANO BUTSURYU K.K.TADANO SYSTEMS Inc.TADANO BUSINESS SUPPORT K.K.
NITTSU JUKI SERVICE K.K.
TADANO Korea Co., Ltd. [South Korea]TADANO (Thailand) Co., Ltd., TADANO Thai Parts and Service Co., Ltd. [Thailand]TADANO Asia Pte. Ltd. [Singapore]TADANO India Pvt. Ltd. [India]TADANO Oceania Pty Ltd. [Australia]
1
BQ-TADANO (Beijing) Crane Co., Ltd. [China]Taiwan TADANO Ltd. [Taiwan]
Key Points of FY 2014 FKey Points of FY 2014 Financial Resultsinancial Results
[FY 2014 management policies](i) Pursuing the core values of safety, quality, and
efficiency(ii) Fi t d l t f th Mid T M t
(Unit: millions of yen)
FY 2013 FY 2014 Percenth (ii) First-year deployment of the Mid-Term Management
Plan (14 – 16) Enhance volume & quality in Core Market, expand
volume in Strategic Market Improve profitability
Amount Percentage Amount Percentage
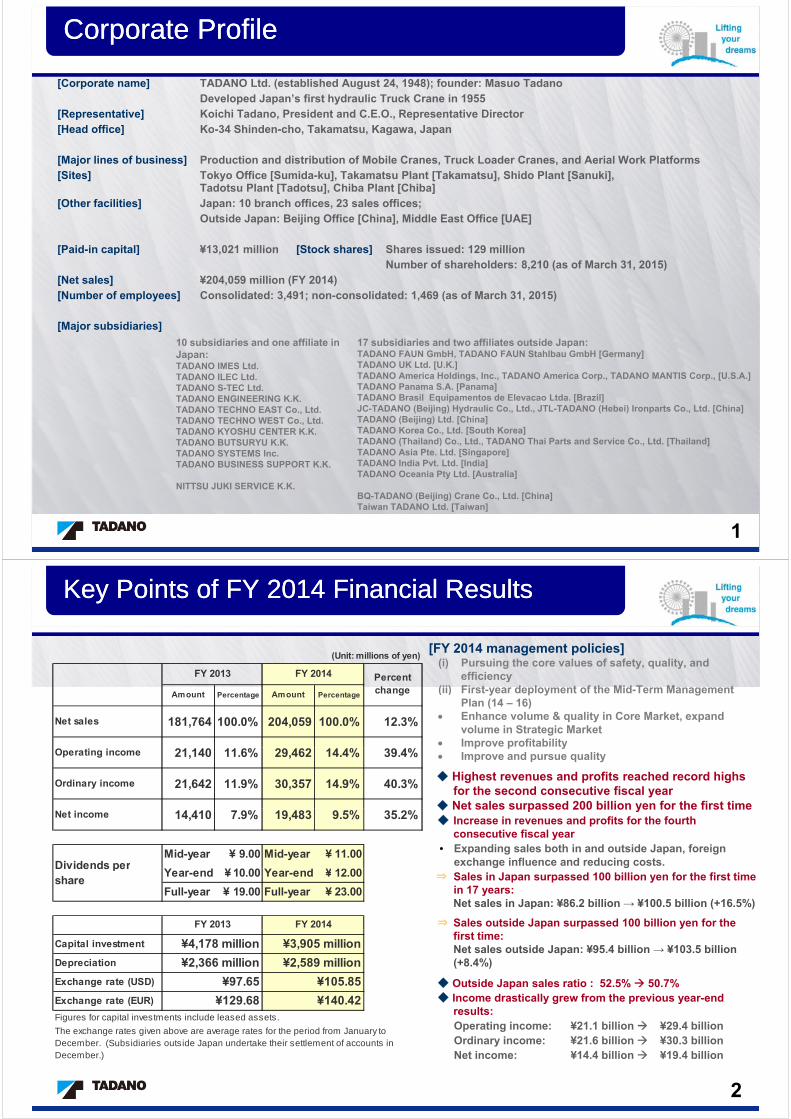
Net sales 181,764 100.0% 204,059 100.0% 12.3%
change
p p y Improve and pursue quality
◆ Highest revenues and profits reached record highs for the second consecutive fiscal year
◆ Net sales surpassed 200 billion yen for the first time
Operating income 21,140 11.6% 29,462 14.4% 39.4%
Ordinary income 21,642 11.9% 30,357 14.9% 40.3%
◆ Net sales surpassed 200 billion yen for the first time◆ Increase in revenues and profits for the fourth
consecutive fiscal year• Expanding sales both in and outside Japan, foreign
exchange influence and reducing costs.
Net income 14,410 7.9% 19,483 9.5% 35.2%
Dividends perMid-year ¥ 9.00 Mid-year ¥ 11.00
Y d ¥ 10 00 Y d ¥ 12 00 ⇒ Sales in Japan surpassed 100 billion yen for the first time in 17 years:Net sales in Japan: ¥86.2 billion → ¥100.5 billion (+16.5%)
⇒ Sales outside Japan surpassed 100 billion yen for the
Dividends pershare
Year-end ¥ 10.00 Year-end ¥ 12.00
Full-year ¥ 19.00 Full-year ¥ 23.00
FY 2014FY 2013first time:Net sales outside Japan: ¥95.4 billion → ¥103.5 billion (+8.4%)
◆ Outside Japan sales ratio : 52.5% 50.7%
Capital investment
Depreciation
Exchange rate (USD)
¥2,366 million ¥2,589 million
¥4,178 million ¥3,905 million
¥97.65 ¥105.85◆ Income drastically grew from the previous year-end
results:Operating income: ¥21.1 billion ¥29.4 billionOrdinary income: ¥21.6 billion ¥30.3 billion
Exchange rate (EUR)
Figures for capital investments include leased assets.
The exchange rates given above are average rates for the period from January toDecember. (Subsidiaries outside Japan undertake their settlement of accounts in
¥129.68 ¥140.42
2
Net income: ¥14.4 billion ¥19.4 billionDecember.)
Income Statement Income Statement (vs. Previous Year)(vs. Previous Year)
(Unit: millions of yen)
FY 2013 FY 2014 Increase/decrease
[Key changes]
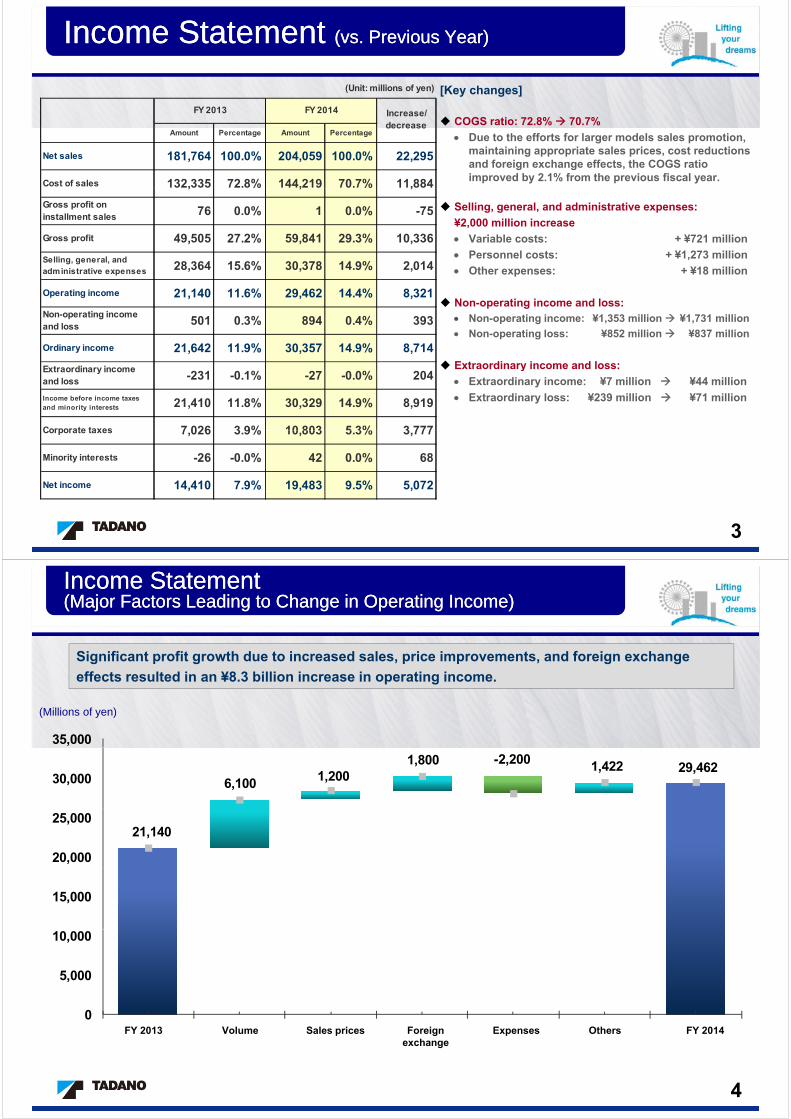
COGS ratio: 72.8% 70.7%Amount Percentage Amount Percentage
Net sales 181,764 100.0% 204,059 100.0% 22,295
Cost of sales 132,335 72.8% 144,219 70.7% 11,884
decrease Due to the efforts for larger models sales promotion,
maintaining appropriate sales prices, cost reductions and foreign exchange effects, the COGS ratio improved by 2.1% from the previous fiscal year., , ,
Gross profit oninstallment sales 76 0.0% 1 0.0% -75
Gross profit 49,505 27.2% 59,841 29.3% 10,336
Selling, general, and administrative expenses:
¥2,000 million increase
Variable costs: + ¥721 million
Selling, general, andadministrative expenses 28,364 15.6% 30,378 14.9% 2,014
Operating income 21,140 11.6% 29,462 14.4% 8,321
Personnel costs: + ¥1,273 million
Other expenses: + ¥18 million
Non-operating income and loss:Non-operating incomeand loss 501 0.3% 894 0.4% 393
Ordinary income 21,642 11.9% 30,357 14.9% 8,714
Extraordinary income
Non-operating income: ¥1,353 million ¥1,731 million
Non-operating loss: ¥852 million ¥837 million
Extraordinary income and loss:Extraordinary incomeand loss -231 -0.1% -27 -0.0% 204
Income before income taxesand minority interests 21,410 11.8% 30,329 14.9% 8,919
Corporate taxes 7 026 3 9% 10 803 5 3% 3 777
y
Extraordinary income: ¥7 million ¥44 million
Extraordinary loss: ¥239 million ¥71 million
Corporate taxes 7,026 3.9% 10,803 5.3% 3,777
Minority interests -26 -0.0% 42 0.0% 68
Net income 14,410 7.9% 19,483 9.5% 5,072
3
Income StatementIncome Statement((Major Factors Leading to Change in Operating Income)Major Factors Leading to Change in Operating Income)
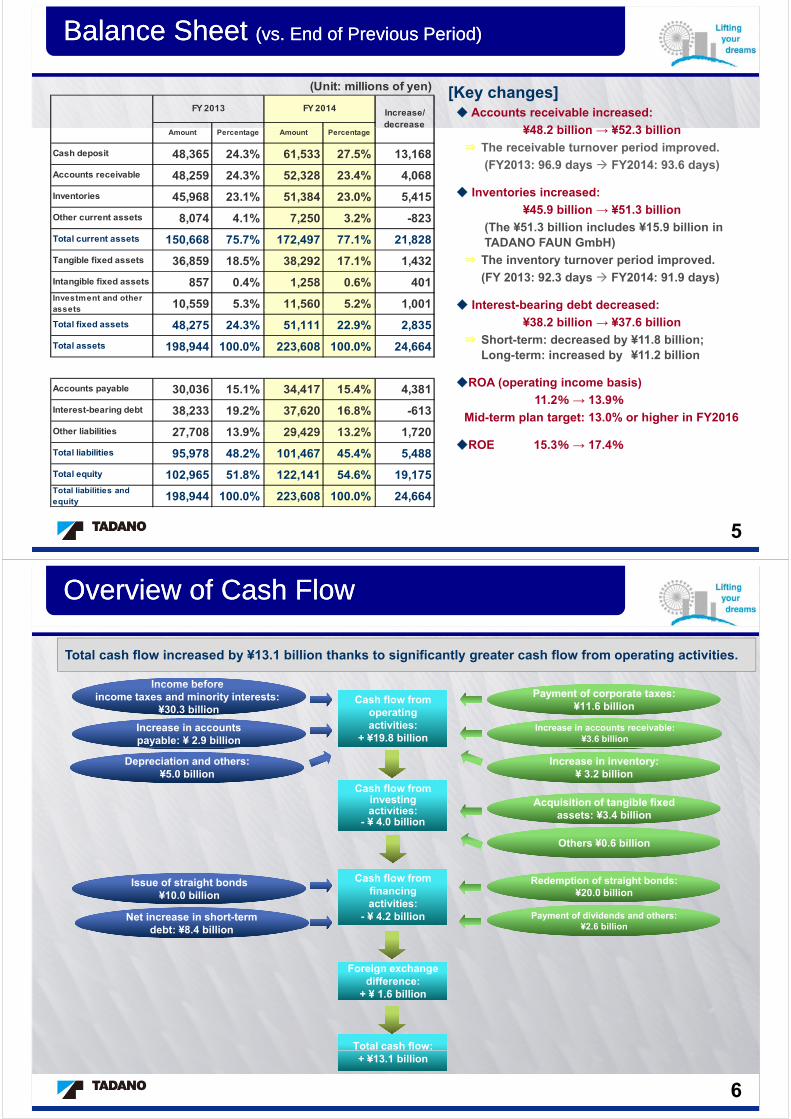
Significant profit growth due to increased sales, price improvements, and foreign exchange
effects resulted in an ¥8.3 billion increase in operating income.
35,000
(Millions of yen)
6,100 1,2001,800 -2,200 1,422 29,462
30,000
21,140
20,000
25,000
15,000
5,000
10,000
0FY 2013 Volume Sales prices Foreign
exchangeExpenses Others FY 2014
4
Balance Sheet Balance Sheet (vs. End of Previous Period)(vs. End of Previous Period)
(Unit: millions of yen)
Increase/decrease
FY 2013 FY 2014
[Key changes]◆ Accounts receivable increased:
¥48 2 billion ¥52 3 billionAmount Percentage Amount Percentage
Cash deposit 48,365 24.3% 61,533 27.5% 13,168
Accounts receivable 48,259 24.3% 52,328 23.4% 4,068
¥48.2 billion → ¥52.3 billion
⇒ The receivable turnover period improved.
(FY2013: 96.9 days FY2014: 93.6 days)
◆ I t i i dInventories 45,968 23.1% 51,384 23.0% 5,415
Other current assets 8,074 4.1% 7,250 3.2% -823
Total current assets 150,668 75.7% 172,497 77.1% 21,828
◆ Inventories increased:
¥45.9 billion → ¥51.3 billion
(The ¥51.3 billion includes ¥15.9 billion in TADANO FAUN GmbH)
Tangible fixed assets 36,859 18.5% 38,292 17.1% 1,432
Intangible fixed assets 857 0.4% 1,258 0.6% 401Investment and otherassets 10,559 5.3% 11,560 5.2% 1,001
)
⇒ The inventory turnover period improved.
(FY 2013: 92.3 days FY2014: 91.9 days)
◆ Interest-bearing debt decreased:assets , , ,
Total fixed assets 48,275 24.3% 51,111 22.9% 2,835
Total assets 198,944 100.0% 223,608 100.0% 24,664
◆ g
¥38.2 billion → ¥37.6 billion
⇒ Short-term: decreased by ¥11.8 billion; Long-term: increased by ¥11.2 billion
Accounts payable 30,036 15.1% 34,417 15.4% 4,381
Interest-bearing debt 38,233 19.2% 37,620 16.8% -613
Other liabilities 27 708 13 9% 29 429 13 2% 1 720
◆ROA (operating income basis)
11.2% → 13.9%
Mid-term plan target: 13.0% or higher in FY2016Other liabilities 27,708 13.9% 29,429 13.2% 1,720
Total liabilities 95,978 48.2% 101,467 45.4% 5,488
Total equity 102,965 51.8% 122,141 54.6% 19,175Total liabilities and
◆ROE 15.3% → 17.4%
Total liabilities andequity 198,944 100.0% 223,608 100.0% 24,664
5
Overview of Cash FlowOverview of Cash Flow
Total cash flow increased by ¥13.1 billion thanks to significantly greater cash flow from operating activities.
Income before
Cash flow from operating activities:
+ ¥19.8 billion
Income before income taxes and minority interests:
¥30.3 billion
Increase in accounts receivable:¥3.6 billion
Increase in accounts payable: ¥ 2.9 billion
Payment of corporate taxes:¥11.6 billion
Acquisition of tangible fixed Cash flow from
investing ti iti
Depreciation and others: ¥5.0 billion
Increase in inventory: ¥ 3.2 billion
assets: ¥3.4 billionactivities:- ¥ 4.0 billion
Others ¥0.6 billion
Cash flow from financing activities:
- ¥ 4.2 billion
Issue of straight bonds¥10.0 billion
Net increase in short-term debt: ¥8 4 billion
Redemption of straight bonds:¥20.0 billion
Payment of dividends and others: ¥2.6 billion
Foreign exchange difference:¥ 1 6 billi
debt: ¥8.4 billion ¥2.6 billion
+ ¥ 1.6 billion
Total cash flow:
6
+ ¥13.1 billion
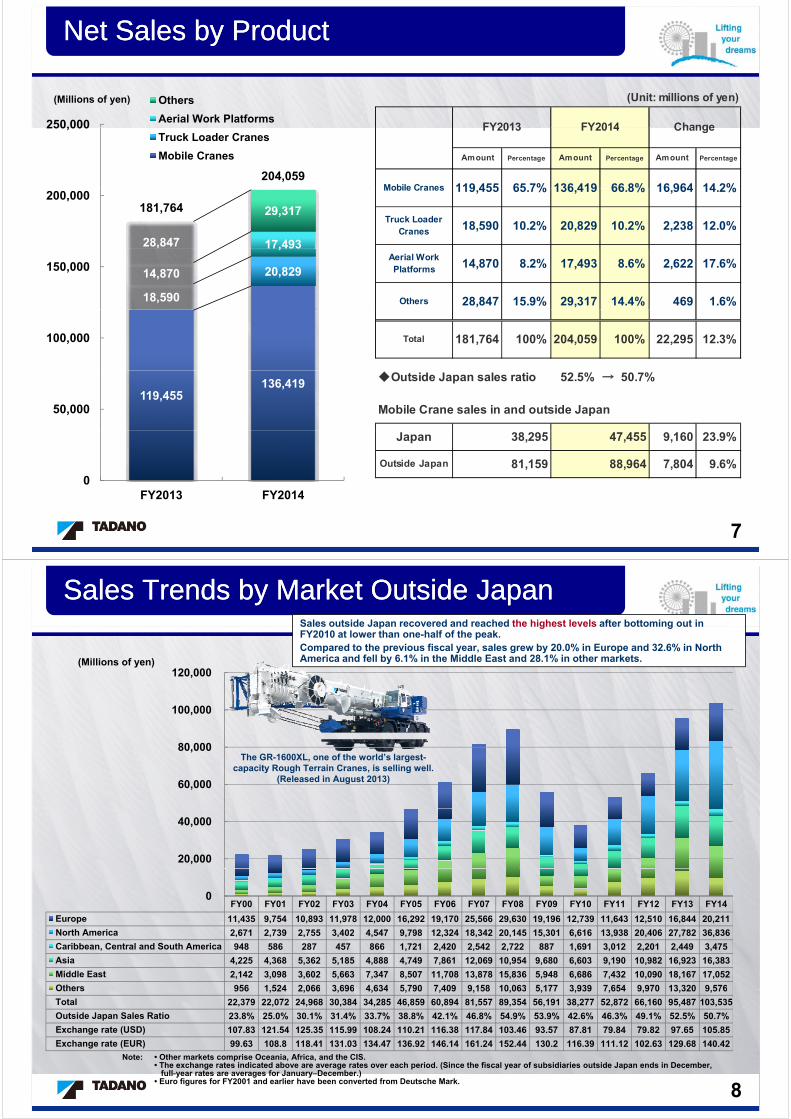
Net Sales by ProductNet Sales by Product
(Unit: millions of yen)
ChangeFY2013 FY2014250,000
Others
Aerial Work Platforms
(Millions of yen)
Amount Percentage Amount Percentage Amount Percentage
Mobile Cranes 119 455 65 7% 136 419 66 8% 16 964 14 2%
ChangeFY2013 FY2014
204,059
250,000Truck Loader Cranes
Mobile Cranes
Mobile Cranes 119,455 65.7% 136,419 66.8% 16,964 14.2%
Truck LoaderCranes 18,590 10.2% 20,829 10.2% 2,238 12.0%
17,49328,847
29,317181,764200,000
Aerial WorkPlatforms 14,870 8.2% 17,493 8.6% 2,622 17.6%
Others 28,847 15.9% 29,317 14.4% 469 1.6%18,590
20,82914,870
,
150,000
Total 181,764 100% 204,059 100% 22,295 12.3%100,000
Mobile Crane sales in and outside Japan
◆Outside Japan sales ratio 52.5% → 50.7%
119,455136,419
50,000
Japan 9,160 23.9%
Outside Japan 7,804 9.6%88,96481,159
38,295 47,455
0FY2013 FY2014
77
FY2013 FY2014
Sales outside Japan recovered and reached the highest levels after bottoming out in
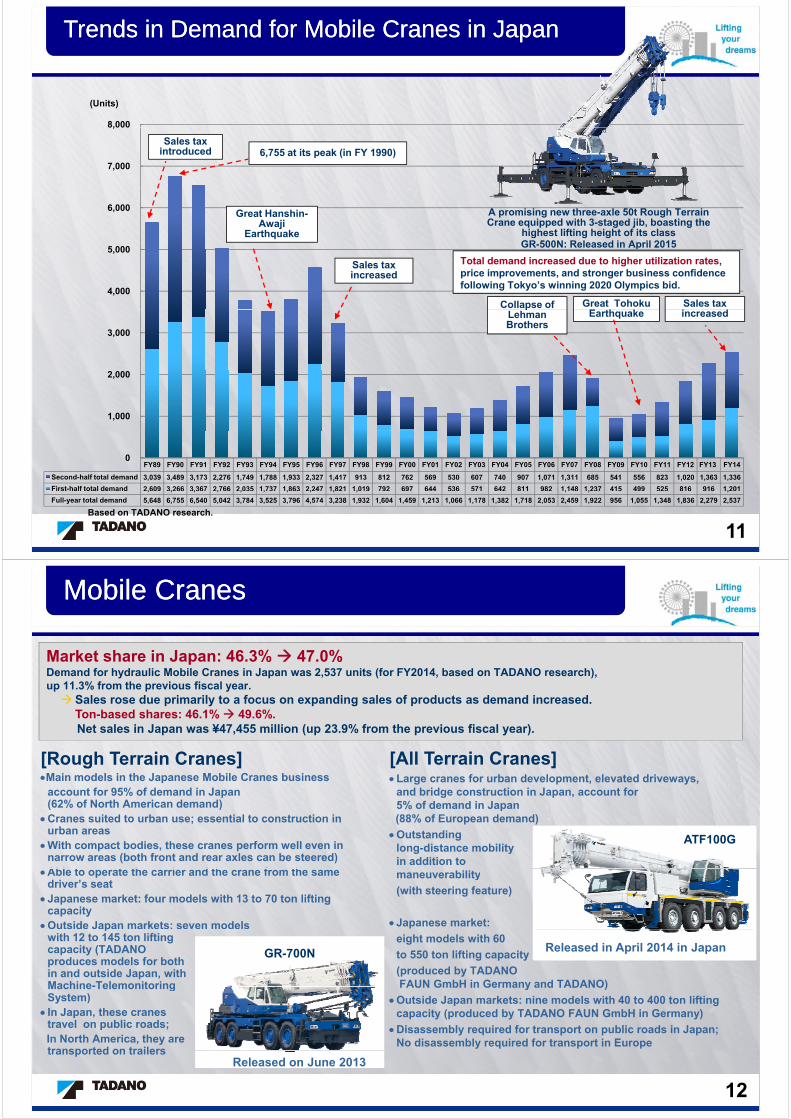
Sales Trends by Market Outside JapanSales Trends by Market Outside Japan
120,000 (Millions of yen)
Sales outside Japan recovered and reached the highest levels after bottoming out in FY2010 at lower than one-half of the peak.Compared to the previous fiscal year, sales grew by 20.0% in Europe and 32.6% in North America and fell by 6.1% in the Middle East and 28.1% in other markets.
80 000
100,000
60,000
80,000 The GR-1600XL, one of the world’s largest-
capacity Rough Terrain Cranes, is selling well.(Released in August 2013)
20,000
40,000
FY00 FY01 FY02 FY03 FY04 FY05 FY06 FY07 FY08 FY09 FY10 FY11 FY12 FY13 FY14
Europe 11,435 9,754 10,893 11,978 12,000 16,292 19,170 25,566 29,630 19,196 12,739 11,643 12,510 16,844 20,211
N th A i 2 6 1 2 39 2 3 402 4 4 9 98 12 324 18 342 20 14 1 301 6 616 13 938 20 406 2 82 36 836
0
North America 2,671 2,739 2,755 3,402 4,547 9,798 12,324 18,342 20,145 15,301 6,616 13,938 20,406 27,782 36,836
Caribbean, Central and South America 948 586 287 457 866 1,721 2,420 2,542 2,722 887 1,691 3,012 2,201 2,449 3,475
Asia 4,225 4,368 5,362 5,185 4,888 4,749 7,861 12,069 10,954 9,680 6,603 9,190 10,982 16,923 16,383
Middle East 2,142 3,098 3,602 5,663 7,347 8,507 11,708 13,878 15,836 5,948 6,686 7,432 10,090 18,167 17,052
Others 956 1 524 2 066 3 696 4 634 5 790 7 409 9 158 10 063 5 177 3 939 7 654 9 970 13 320 9 576Others 956 1,524 2,066 3,696 4,634 5,790 7,409 9,158 10,063 5,177 3,939 7,654 9,970 13,320 9,576
Total 22,379 22,072 24,968 30,384 34,285 46,859 60,894 81,557 89,354 56,191 38,277 52,872 66,160 95,487 103,535
Outside Japan Sales Ratio 23.8% 25.0% 30.1% 31.4% 33.7% 38.8% 42.1% 46.8% 54.9% 53.9% 42.6% 46.3% 49.1% 52.5% 50.7%
Exchange rate (USD) 107.83 121.54 125.35 115.99 108.24 110.21 116.38 117.84 103.46 93.57 87.81 79.84 79.82 97.65 105.85
Exchange rate (EUR) 99.63 108.8 118.41 131.03 134.47 136.92 146.14 161.24 152.44 130.2 116.39 111.12 102.63 129.68 140.42
8
Note: • Other markets comprise Oceania, Africa, and the CIS.• The exchange rates indicated above are average rates over each period. (Since the fiscal year of subsidiaries outside Japan ends in December,
full-year rates are averages for January–December.)• Euro figures for FY2001 and earlier have been converted from Deutsche Mark.

Mobile CranesMobile Cranes
Net sales of Mobile Cranes (Japan)
100,000
(Millions of yen)
Second half First half
8 449 8 813 11 603 14 696 21,04311,416 15,333 15,03623,598
26,412 19,866 24,146 26,64038,295
47,455 50,000
200 000
(Millions of yen) Net sales of Mobile Cranes8,449 8,813 11,603 14,696 21,043
51.5% 46.2% 44.7% 46.3% 47.0%
0 FY2010 FY2011 FY2012 FY2013 FY2014
Share ofunit salesin Japan(FY basis)
136,419 150,000
200,000 Second halfFirst half
81,15988,964100,000
(Millions of yen)
Net sales of Mobile Cranes (Outside Japan)
Second half First half 61,93070,780
66 43980,547
119,455
100,000
42 827 44 59414 61023,428
29,100
38,331 44,369
27,574 42,293
53,907
50,000
36 40957,524 65,638 26,027
38,761 44,13747,440
66,439
50,000
12,963 18,865 24,806 42,827 44,594 14,610
,
14.4% 16.3% 15.4% 20.2% 24.3%
0 FY2010 FY2011 FY2012 FY2013 FY2014
Share of unit sales outside Japan (calendar-year basis)
21,413 27,678 36,409
22.7% 22.3% 21.8% 26.9% 31.4%
0 FY2010 FY2011 FY2012 FY2013 FY2014
Share of worldwide unit sales (calendar-year basis)
99
Trends and Forecast of Construction Investment in JapanTrends and Forecast of Construction Investment in Japan
90.0
(Trillions of yen)Government: Government construction investmentPrivate sector: Private construction investment
70.0
80.0
Although government investment is expected to fall in FY2015, private investment increases in the
50 0
60.0
residential sector, while gentle recovery continues in the non-residential sector.
40.0
50.0
20.0
30.0
FY12 FY13 FY14 FY150.0
10.0
FY89 FY90 FY91 FY92 FY93 FY94 FY95 FY96 FY97 FY98 FY99 FY00 FY01 FY02 FY03 FY04 FY05 FY06 FY07 FY08 FY09 FY10 FY11FY12 est.
FY13 est.
FY14 for.
FY15 for.
Government 24.2 25.7 28.6 32.3 34.2 33.2 35.1 34.5 32.9 33.9 31.9 29.9 28.1 25.9 23.4 20.8 18.9 17.7 16.9 16.7 17.9 17.9 18.6 18.6 20.6 20.0 18.4
Private sector 48.8 55.6 53.7 51.6 47.4 45.4 43.8 48.2 42.2 37.3 38.4 36.2 33.0 30.9 30.2 31.9 32.5 33.5 30.7 31.4 25.0 23.9 24.6 25.5 28.1 27.0 27.7
Total 73.1 81.4 82.4 83.9 81.6 78.7 79.0 82.8 75.1 71.3 70.4 66.1 61.2 56.8 53.7 52.8 51.5 51.3 47.6 48.1 42.9 41.9 43.2 44.2 48.7 47.1 46.2
Note: All figures shown are nominal construction investment figures
10
Note: All figures shown are nominal construction investment figures. Forecasts are from the Research Institute of Construction and Economy’s “Forecast of Construction Investment” (released on April 22, 2015).
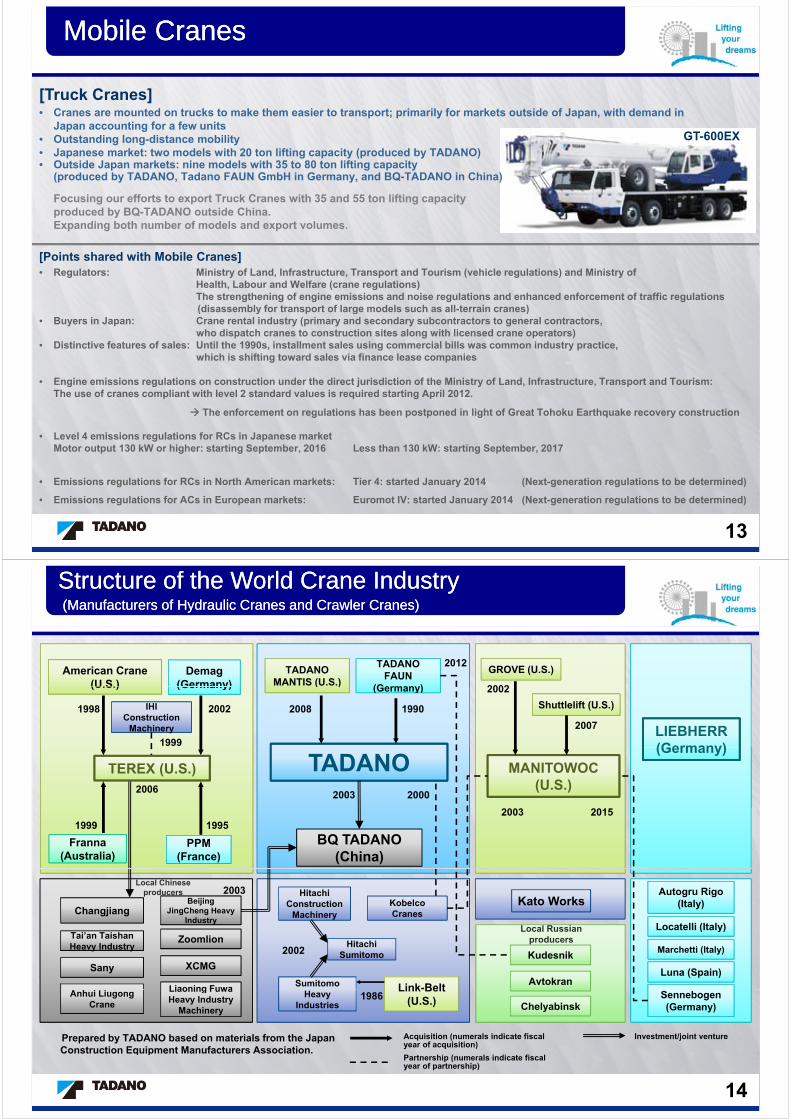
Trends in Demand for Mobile Cranes in JapanTrends in Demand for Mobile Cranes in Japan
8,000
(Units)
7,000
,
6,755 at its peak (in FY 1990)Sales tax
introduced
5 000
6,000 Great Hanshin-
Awaji Earthquake
A promising new three-axle 50t Rough Terrain Crane equipped with 3-staged jib, boasting the
highest lifting height of its classGR-500N: Released in April 2015
4,000
5,000 Total demand increased due to higher utilization rates, price improvements, and stronger business confidence following Tokyo’s winning 2020 Olympics bid.
Sales tax increased
Great Tohoku E h k
p
Sales tax i d
Collapse of
3,000
Earthquake increasedp
Lehman Brothers
1,000
2,000
FY89 FY90 FY91 FY92 FY93 FY94 FY95 FY96 FY97 FY98 FY99 FY00 FY01 FY02 FY03 FY04 FY05 FY06 FY07 FY08 FY09 FY10 FY11 FY12 FY13 FY14
Second-half total demand 3,039 3,489 3,173 2,276 1,749 1,788 1,933 2,327 1,417 913 812 762 569 530 607 740 907 1,071 1,311 685 541 556 823 1,020 1,363 1,336
First-half total demand 2,609 3,266 3,367 2,766 2,035 1,737 1,863 2,247 1,821 1,019 792 697 644 536 571 642 811 982 1,148 1,237 415 499 525 816 916 1,201
0
11
, , , , , , , , , , , , ,
Full-year total demand 5,648 6,755 6,540 5,042 3,784 3,525 3,796 4,574 3,238 1,932 1,604 1,459 1,213 1,066 1,178 1,382 1,718 2,053 2,459 1,922 956 1,055 1,348 1,836 2,279 2,537
Based on TADANO research.
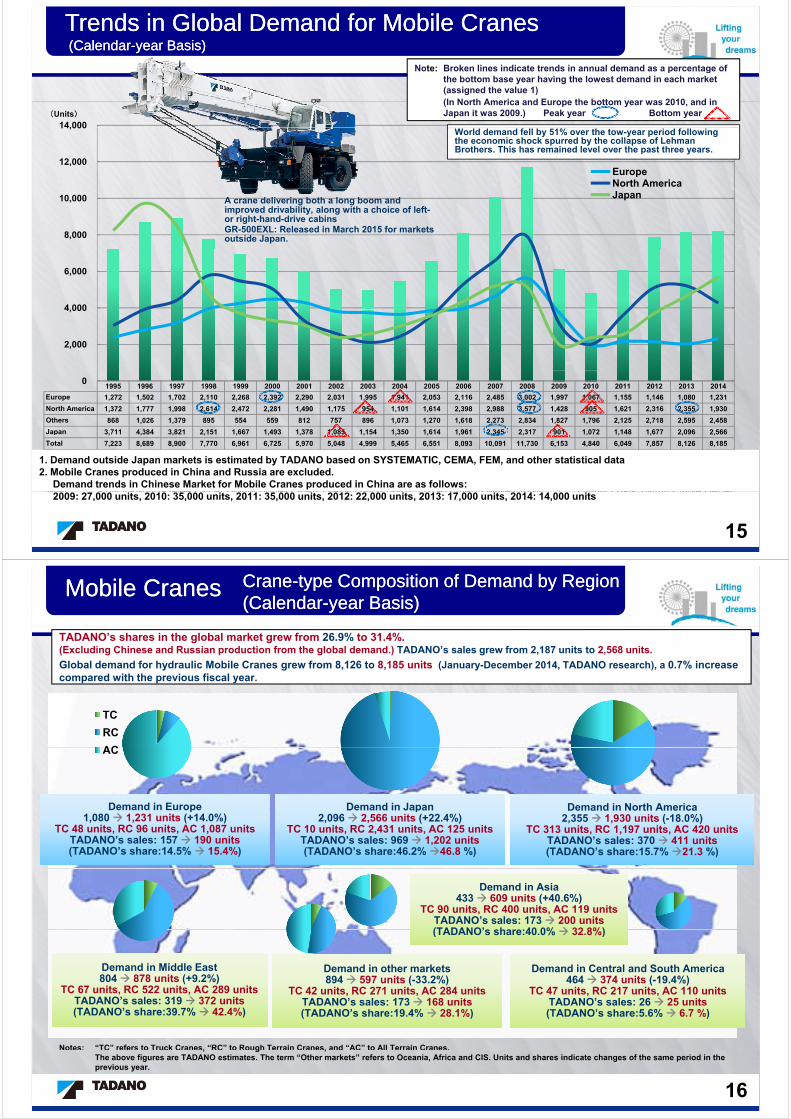
Mobile CranesMobile Cranes
Market share in Japan: 46.3% 47.0%Demand for hydraulic Mobile Cranes in Japan was 2,537 units (for FY2014, based on TADANO research),up 11 3% from the previous fiscal yearup 11.3% from the previous fiscal year. Sales rose due primarily to a focus on expanding sales of products as demand increased.
Ton-based shares: 46.1% 49.6%.Net sales in Japan was ¥47,455 million (up 23.9% from the previous fiscal year).
[Rough Terrain Cranes]Main models in the Japanese Mobile Cranes business
account for 95% of demand in Japan (62% of North American demand)
[All Terrain Cranes]Large cranes for urban development, elevated driveways,
and bridge construction in Japan, account for5% of demand in Japan
ATF100G
( )Cranes suited to urban use; essential to construction in
urban areasWith compact bodies, these cranes perform well even in
narrow areas (both front and rear axles can be steered)Abl t t th i d th f th
5% of demand in Japan (88% of European demand)
Outstanding long-distance mobility in addition to
Able to operate the carrier and the crane from the same driver’s seat
Japanese market: four models with 13 to 70 ton lifting capacity
Outside Japan markets: seven models
maneuverability
(with steering feature)
Japanese market:
GR-700N
pwith 12 to 145 ton lifting capacity (TADANO produces models for both in and outside Japan, with Machine-Telemonitoring
eight models with 60
to 550 ton lifting capacity
(produced by TADANOFAUN GmbH in Germany and TADANO)
Released in April 2014 in Japan
gSystem)
In Japan, these cranes travel on public roads;In North America, they are transported on trailers
y )
Outside Japan markets: nine models with 40 to 400 ton lifting capacity (produced by TADANO FAUN GmbH in Germany)
Disassembly required for transport on public roads in Japan; No disassembly required for transport in Europe
12
transported on trailersReleased on June 2013
Mobile CranesMobile Cranes
[Truck Cranes]• Cranes are mounted on trucks to make them easier to transport; primarily for markets outside of Japan, with demand in
Japan accounting for a few unitsGT-600EX
Japan accounting for a few units• Outstanding long-distance mobility• Japanese market: two models with 20 ton lifting capacity (produced by TADANO)• Outside Japan markets: nine models with 35 to 80 ton lifting capacity
(produced by TADANO, Tadano FAUN GmbH in Germany, and BQ-TADANO in China)
Focusing our efforts to export Truck Cranes with 35 and 55 ton lifting capacity produced by BQ-TADANO outside China.Expanding both number of models and export volumes.
[Points shared with Mobile Cranes]• Regulators: Ministry of Land, Infrastructure, Transport and Tourism (vehicle regulations) and Ministry of
Health, Labour and Welfare (crane regulations)The strengthening of engine emissions and noise regulations and enhanced enforcement of traffic regulations (disassembly for transport of large models such as all-terrain cranes)(disassembly for transport of large models such as all-terrain cranes)
• Buyers in Japan: Crane rental industry (primary and secondary subcontractors to general contractors,who dispatch cranes to construction sites along with licensed crane operators)
• Distinctive features of sales: Until the 1990s, installment sales using commercial bills was common industry practice,which is shifting toward sales via finance lease companies
• Engine emissions regulations on construction under the direct jurisdiction of the Ministry of Land, Infrastructure, Transport and Tourism: The use of cranes compliant with level 2 standard values is required starting April 2012.
The enforcement on regulations has been postponed in light of Great Tohoku Earthquake recovery construction
• Level 4 emissions regulations for RCs in Japanese marketMotor output 130 kW or higher: starting September, 2016 Less than 130 kW: starting September, 2017
• Emissions regulations for RCs in North American markets: Tier 4: started January 2014 (Next-generation regulations to be determined)
13
• Emissions regulations for ACs in European markets: Euromot IV: started January 2014 (Next-generation regulations to be determined)
Structure of the World Crane Industry Structure of the World Crane Industry (Manufacturers of Hydraulic Cranes and Crawler Cranes)(Manufacturers of Hydraulic Cranes and Crawler Cranes)
American Crane (U.S.)
Demag(Germany)
TADANO FAUN
(Germany)
GROVE (U.S.)
2002
TADANO MANTIS (U.S.)
2012
(U.S.)
y
IHI Construction
Machinery
(Germany) ( y)(Germany)
1998
1999
2002 1990
2002
Shuttlelift (U.S.)
2007
( )
2008
LIEBHERR (Germany)
TEREX (U.S.) TADANO MANITOWOC (U.S.)
200020032006
(Germany)
Franna(Australia)
PPM (France)
1999 19952003
BQ TADANO (China)
2015
Kato Works
Locatelli (Italy)
Autogru Rigo(Italy)
Hitachi Construction
MachineryKobelcoCranes
y
Beijing JingCheng Heavy
IndustryChangjiang
2003Local Chinese
producers
Local Russian
Luna (Spain)
Locatelli (Italy)
Marchetti (Italy)
Sumitomo
Hitachi Sumitomo
Link-Belt
Zoomlion
Liaoning Fuwa
XCMG
y yTai’an TaishanHeavy Industry
SanyAvtokran
Kudesnik2002
Local Russian producers
Heavy Industries
Link Belt (U.S.)1986
Liaoning FuwaHeavy Industry
Machinery
Anhui LiugongCrane
Sennebogen(Germany)Chelyabinsk
Prepared by TADANO based on materials from the Japan Construction Equipment Manufacturers Association
Investment/joint ventureAcquisition (numerals indicate fiscal year of acquisition)
14
Construction Equipment Manufacturers Association.Partnership (numerals indicate fiscal year of partnership)
Note: Broken lines indicate trends in annual demand as a percentage of
Trends in Global Demand for Mobile Cranes Trends in Global Demand for Mobile Cranes (Calendar(Calendar--year Basis)year Basis)
14,000(Units)
Note: Broken lines indicate trends in annual demand as a percentage of the bottom base year having the lowest demand in each market (assigned the value 1) (In North America and Europe the bottom year was 2010, and in Japan it was 2009.) Peak year Bottom year
12,000
14,000
EuropeNorth America
World demand fell by 51% over the tow-year period following the economic shock spurred by the collapse of Lehman Brothers. This has remained level over the past three years.
8,000
10,000 JapanA crane delivering both a long boom and improved drivability, along with a choice of left-or right-hand-drive cabinsGR-500EXL: Released in March 2015 for markets outside Japan.
4 000
6,000
2,000
4,000
1995 1996 1997 1998 1999 2000 2001 2002 2003 2004 2005 2006 2007 2008 2009 2010 2011 2012 2013 2014
Europe 1,272 1,502 1,702 2,110 2,268 2,392 2,290 2,031 1,995 1,941 2,053 2,116 2,485 3,002 1,997 1,067 1,155 1,146 1,080 1,231
North America 1,372 1,777 1,998 2,614 2,472 2,281 1,490 1,175 954 1,101 1,614 2,398 2,988 3,577 1,428 905 1,621 2,316 2,355 1,930
Others 868 1,026 1,379 895 554 559 812 757 896 1,073 1,270 1,618 2,273 2,834 1,827 1,796 2,125 2,718 2,595 2,458
Japan 3 711 4 384 3 821 2 151 1 667 1 493 1 378 1 085 1 154 1 350 1 614 1 961 2 345 2 317 901 1 072 1 148 1 677 2 096 2 566
0
Japan 3,711 4,384 3,821 2,151 1,667 1,493 1,378 1,085 1,154 1,350 1,614 1,961 2,345 2,317 901 1,072 1,148 1,677 2,096 2,566
Total 7,223 8,689 8,900 7,770 6,961 6,725 5,970 5,048 4,999 5,465 6,551 8,093 10,091 11,730 6,153 4,840 6,049 7,857 8,126 8,185
日本シェア 0.51 0.50 0.43 0.28 0.24 0.22 0.23 0.21 0.23 0.25 0.25 0.24 0.23 0.20 0.15 0.22 0.19 0.21 0.26 0.31
Europe 1.192127 1.407685 1.595127 1.977507 2.125586 2.241799 2.146204 1.903468 1.869728 1.819119 1.924086 1.98313 2.32896 2.813496 1.871603 1 1.082474 1.074039 1.012184 1.153702
North America 1.516022 1.963536 2.207735 2.888398 2.731492 2.520442 1.646409 1.298343 1.054144 1.216575 1.783425 2.649724 3.301657 3.952486 1.577901 1 1.79116 2.559116 2.60221 2.132597
Japan 4 118757 4 865705 4 240844 2 387347 1 850166 1 657048 1 529412 1 204218 1 280799 1 498335 1 791343 2 176471 2 602664 2 571587 1 1 189789 1 27414 1 861265 2 326304 2 847947
1. Demand outside Japan markets is estimated by TADANO based on SYSTEMATIC, CEMA, FEM, and other statistical data2. Mobile Cranes produced in China and Russia are excluded.
Demand trends in Chinese Market for Mobile Cranes produced in China are as follows:Japan 4.118757 4.865705 4.240844 2.387347 1.850166 1.657048 1.529412 1.204218 1.280799 1.498335 1.791343 2.176471 2.602664 2.571587 1 1.189789 1.27414 1.861265 2.326304 2.847947
日本 3.42 4.04 3.52 1.98 1.54 1.38 1.27 1 1.06 1.24 1.49 1.81 2.16 2.14 0.83 0.99 1.06 1.54 1.93
15
2009: 27,000 units, 2010: 35,000 units, 2011: 35,000 units, 2012: 22,000 units, 2013: 17,000 units, 2014: 14,000 units
Mobile CranesMobile Cranes CraneCrane--type Composition of Demand by Regiontype Composition of Demand by Region(Calendar(Calendar--year Basis) year Basis)
TADANO’s shares in the global market grew from 26.9% to 31.4%.(Excluding Chinese and Russian production from the global demand.) TADANO’s sales grew from 2,187 units to 2,568 units.
Global demand for hydraulic Mobile Cranes grew from 8,126 to 8,185 units (January-December 2014, TADANO research), a 0.7% increase compared with the previous fiscal year.
TC
RC
AC
Demand in EuropeDemand in Europe Demand in JapanDemand in Japan Demand in North AmericaDemand in North America
AC
Demand in Europe1,080 1,231 units (+14.0%)
TC 48 units, RC 96 units, AC 1,087 unitsTADANO’s sales: 157 190 units(TADANO’s share:14.5% 15.4%)
Demand in Europe1,080 1,231 units (+14.0%)
TC 48 units, RC 96 units, AC 1,087 unitsTADANO’s sales: 157 190 units(TADANO’s share:14.5% 15.4%)
Demand in Japan2,096 2,566 units (+22.4%)
TC 10 units, RC 2,431 units, AC 125 unitsTADANO’s sales: 969 1,202 units(TADANO’s share:46.2% 46.8 %)
Demand in Japan2,096 2,566 units (+22.4%)
TC 10 units, RC 2,431 units, AC 125 unitsTADANO’s sales: 969 1,202 units(TADANO’s share:46.2% 46.8 %)
Demand in North America2,355 1,930 units (-18.0%)
TC 313 units, RC 1,197 units, AC 420 unitsTADANO’s sales: 370 411 units(TADANO’s share:15.7% 21.3 %)
Demand in North America2,355 1,930 units (-18.0%)
TC 313 units, RC 1,197 units, AC 420 unitsTADANO’s sales: 370 411 units(TADANO’s share:15.7% 21.3 %)
Demand in Asia433 609 units (+40.6%)
TC 90 units, RC 400 units, AC 119 unitsTADANO’s sales: 173 200 units(TADANO’s share 40 0% 32 8%)
Demand in Asia433 609 units (+40.6%)
TC 90 units, RC 400 units, AC 119 unitsTADANO’s sales: 173 200 units(TADANO’s share 40 0% 32 8%)
Demand in Middle East804 878 units (+9.2%)
TC 67 units RC 522 units AC 289 units
Demand in Middle East804 878 units (+9.2%)
TC 67 units RC 522 units AC 289 units
(TADANO’s share:40.0% 32.8%)(TADANO’s share:40.0% 32.8%)
Demand in Central and South America464 374 units (-19.4%)
TC 47 units RC 217 units AC 110 units
Demand in Central and South America464 374 units (-19.4%)
TC 47 units RC 217 units AC 110 units
Demand in other markets894 597 units (-33.2%)
TC 42 units RC 271 units AC 284 units
Demand in other markets894 597 units (-33.2%)
TC 42 units RC 271 units AC 284 unitsTC 67 units, RC 522 units, AC 289 unitsTADANO’s sales: 319 372 units(TADANO’s share:39.7% 42.4%)
TC 67 units, RC 522 units, AC 289 unitsTADANO’s sales: 319 372 units(TADANO’s share:39.7% 42.4%)
TC 47 units, RC 217 units, AC 110 unitsTADANO’s sales: 26 25 units(TADANO’s share:5.6% 6.7 %)
TC 47 units, RC 217 units, AC 110 unitsTADANO’s sales: 26 25 units(TADANO’s share:5.6% 6.7 %)
TC 42 units, RC 271 units, AC 284 unitsTADANO’s sales: 173 168 units(TADANO’s share:19.4% 28.1%)
TC 42 units, RC 271 units, AC 284 unitsTADANO’s sales: 173 168 units(TADANO’s share:19.4% 28.1%)
Notes: “TC” refers to Truck Cranes, “RC” to Rough Terrain Cranes, and “AC” to All Terrain Cranes.
16
, g ,The above figures are TADANO estimates. The term “Other markets” refers to Oceania, Africa and CIS. Units and shares indicate changes of the same period in the previous year.
European BusinessEuropean Business
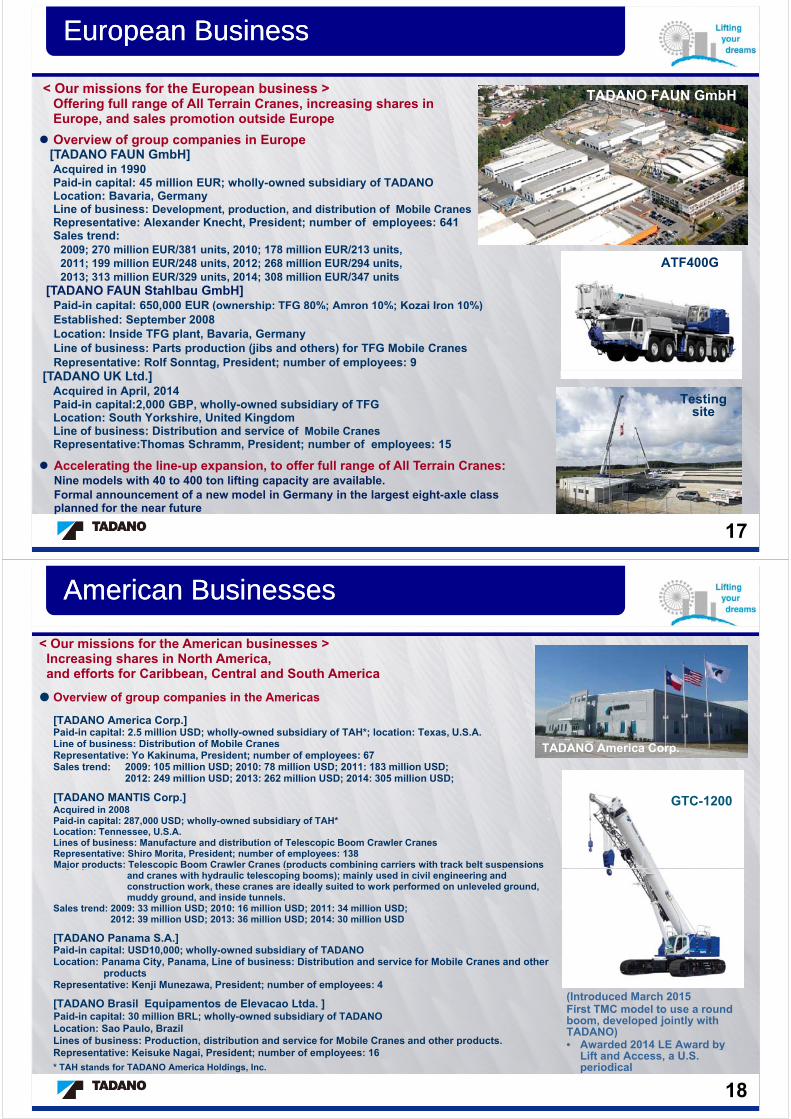
TADANO FAUN GmbH< Our missions for the European business >Offering full range of All Terrain Cranes, increasing shares in Europe, and sales promotion outside Europe
Overview of group companies in Europe[TADANO FAUN GmbH]Acquired in 1990Paid-in capital: 45 million EUR; wholly-owned subsidiary of TADANOp ; y yLocation: Bavaria, GermanyLine of business: Development, production, and distribution of Mobile CranesRepresentative: Alexander Knecht, President; number of employees: 641Sales trend:
2009; 270 million EUR/381 units 2010; 178 million EUR/213 unitsATF400G
2009; 270 million EUR/381 units, 2010; 178 million EUR/213 units, 2011; 199 million EUR/248 units, 2012; 268 million EUR/294 units,2013; 313 million EUR/329 units, 2014; 308 million EUR/347 units
[TADANO FAUN Stahlbau GmbH]Paid-in capital: 650,000 EUR (ownership: TFG 80%; Amron 10%; Kozai Iron 10%)p , ( p ; ; )Established: September 2008Location: Inside TFG plant, Bavaria, GermanyLine of business: Parts production (jibs and others) for TFG Mobile CranesRepresentative: Rolf Sonntag, President; number of employees: 9
Testing site
[TADANO UK Ltd.]Acquired in April, 2014Paid-in capital:2,000 GBP, wholly-owned subsidiary of TFG Location: South Yorkshire, United KingdomLine of business: Distribution and service of Mobile CranesLine of business: Distribution and service of Mobile CranesRepresentative:Thomas Schramm, President; number of employees: 15
Accelerating the line-up expansion, to offer full range of All Terrain Cranes:Nine models with 40 to 400 ton lifting capacity are available.F l t f d l i G i th l t i ht l l
17
Formal announcement of a new model in Germany in the largest eight-axle class planned for the near future
American BusinessesAmerican Businesses
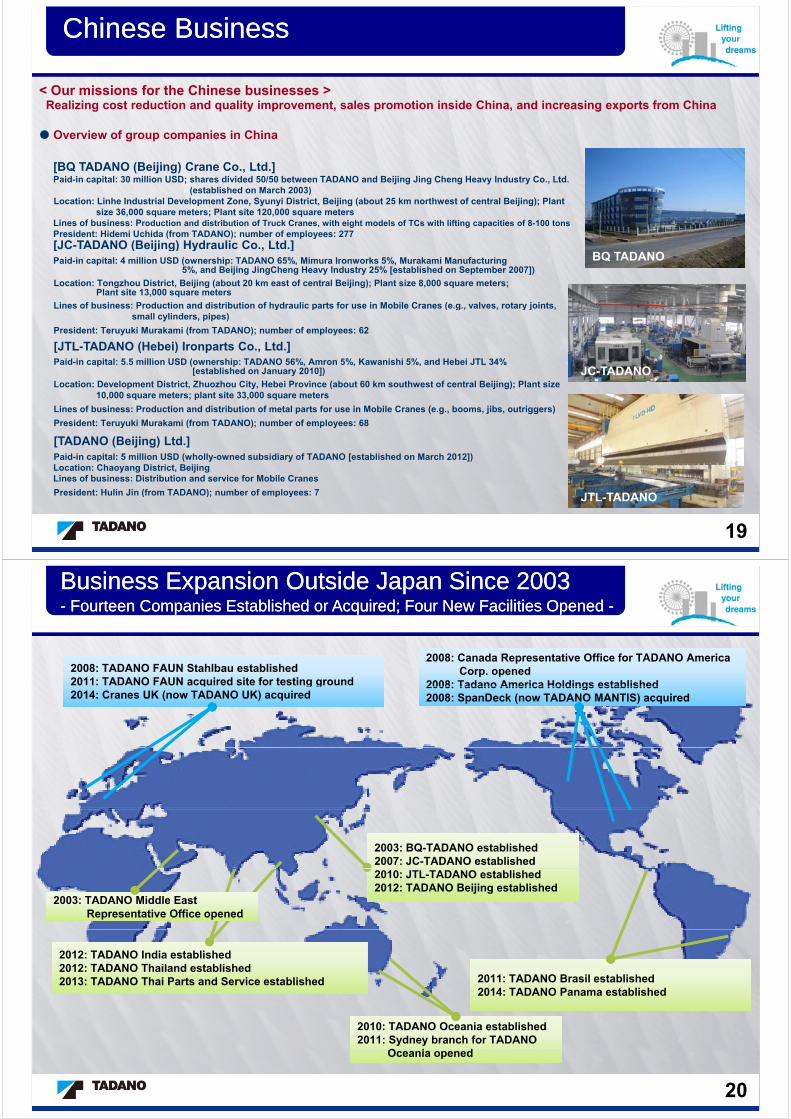
< Our missions for the American businesses >Increasing shares in North America,and efforts for Caribbean, Central and South America
TADANO America Corp
Overview of group companies in the Americas
[TADANO America Corp.]Paid-in capital: 2.5 million USD; wholly-owned subsidiary of TAH*; location: Texas, U.S.A.Line of business: Distribution of Mobile Cranes TADANO America Corp.
GTC-1200
Representative: Yo Kakinuma, President; number of employees: 67Sales trend: 2009: 105 million USD; 2010: 78 million USD; 2011: 183 million USD;
2012: 249 million USD; 2013: 262 million USD; 2014: 305 million USD;
[TADANO MANTIS Corp.]Acquired in 2008Acquired in 2008Paid-in capital: 287,000 USD; wholly-owned subsidiary of TAH*Location: Tennessee, U.S.A.Lines of business: Manufacture and distribution of Telescopic Boom Crawler CranesRepresentative: Shiro Morita, President; number of employees: 138Major products: Telescopic Boom Crawler Cranes (products combining carriers with track belt suspensions j p p (p g p
and cranes with hydraulic telescoping booms); mainly used in civil engineering and construction work, these cranes are ideally suited to work performed on unleveled ground, muddy ground, and inside tunnels.
Sales trend: 2009: 33 million USD; 2010: 16 million USD; 2011: 34 million USD; 2012: 39 million USD; 2013: 36 million USD; 2014: 30 million USD
[TADANO Panama S.A.]Paid-in capital: USD10,000; wholly-owned subsidiary of TADANOLocation: Panama City, Panama, Line of business: Distribution and service for Mobile Cranes and other
productsRepresentative: Kenji Munezawa, President; number of employees: 4
(Introduced March 2015First TMC model to use a round boom, developed jointly with TADANO)• Awarded 2014 LE Award by
p j p y
[TADANO Brasil Equipamentos de Elevacao Ltda. ]Paid-in capital: 30 million BRL; wholly-owned subsidiary of TADANOLocation: Sao Paulo, BrazilLines of business: Production, distribution and service for Mobile Cranes and other products.R t ti K i k N i P id t b f l 16
18
Lift and Access, a U.S. periodical
Representative: Keisuke Nagai, President; number of employees: 16
* TAH stands for TADANO America Holdings, Inc.
Chinese Business Chinese Business
< Our missions for the Chinese businesses >Realizing cost reduction and quality improvement, sales promotion inside China, and increasing exports from China
Overview of group companies in China
[BQ TADANO (Beijing) Crane Co., Ltd.]Paid-in capital: 30 million USD; shares divided 50/50 between TADANO and Beijing Jing Cheng Heavy Industry Co., Ltd.
( t bli h d M h 2003)(established on March 2003)Location: Linhe Industrial Development Zone, Syunyi District, Beijing (about 25 km northwest of central Beijing); Plant
size 36,000 square meters; Plant site 120,000 square metersLines of business: Production and distribution of Truck Cranes, with eight models of TCs with lifting capacities of 8-100 tonsPresident: Hidemi Uchida (from TADANO); number of employees: 277[JC-TADANO (Beijing) Hydraulic Co., Ltd.]
BQ TADANO[JC TADANO (Beijing) Hydraulic Co., Ltd.]Paid-in capital: 4 million USD (ownership: TADANO 65%, Mimura Ironworks 5%, Murakami Manufacturing
5%, and Beijing JingCheng Heavy Industry 25% [established on September 2007])
Location: Tongzhou District, Beijing (about 20 km east of central Beijing); Plant size 8,000 square meters; Plant site 13,000 square meters
Lines of business: Production and distribution of hydraulic parts for use in Mobile Cranes (e.g., valves, rotary joints,
JC TADANO
y p ( g , , y j ,small cylinders, pipes)
President: Teruyuki Murakami (from TADANO); number of employees: 62
[JTL-TADANO (Hebei) Ironparts Co., Ltd.]Paid-in capital: 5.5 million USD (ownership: TADANO 56%, Amron 5%, Kawanishi 5%, and Hebei JTL 34%
[established on January 2010]) JC-TADANO[established on January 2010])
Location: Development District, Zhuozhou City, Hebei Province (about 60 km southwest of central Beijing); Plant size 10,000 square meters; plant site 33,000 square meters
Lines of business: Production and distribution of metal parts for use in Mobile Cranes (e.g., booms, jibs, outriggers)
President: Teruyuki Murakami (from TADANO); number of employees: 68
[TADANO (Beijing) Ltd.]Paid-in capital: 5 million USD (wholly-owned subsidiary of TADANO [established on March 2012])Location: Chaoyang District, BeijingLines of business: Distribution and service for Mobile Cranes
President: Hulin Jin (from TADANO); number of employees: 7 JTL-TADANO
19
President: Hulin Jin (from TADANO); number of employees: 7
Business Expansion Outside Japan Since 2003Business Expansion Outside Japan Since 2003-- FourFourteen Companies Established or Acquired; Four New Facilities Opened teen Companies Established or Acquired; Four New Facilities Opened --
2008: TADANO FAUN Stahlbau established2011: TADANO FAUN acquired site for testing ground2008: TADANO FAUN Stahlbau established2011: TADANO FAUN acquired site for testing ground
2008: Canada Representative Office for TADANO America Corp. opened
2008: Tadano America Holdings established
2008: Canada Representative Office for TADANO America Corp. opened
2008: Tadano America Holdings establishedq g g2014: Cranes UK (now TADANO UK) acquired
q g g2014: Cranes UK (now TADANO UK) acquired
2008: Tadano America Holdings established2008: SpanDeck (now TADANO MANTIS) acquired2008: Tadano America Holdings established2008: SpanDeck (now TADANO MANTIS) acquired
2003: BQ-TADANO established2007: JC-TADANO established2003: BQ-TADANO established2007: JC-TADANO established2010: JTL-TADANO established2012: TADANO Beijing established2010: JTL-TADANO established2012: TADANO Beijing established
2003: TADANO Middle EastRepresentative Office opened
2003: TADANO Middle EastRepresentative Office opened
2012: TADANO India established2012: TADANO Thailand established2013: TADANO Thai Parts and Service established
2012: TADANO India established2012: TADANO Thailand established2013: TADANO Thai Parts and Service established 2011: TADANO Brasil established
2014: TADANO Panama established2011: TADANO Brasil established2014: TADANO Panama established2014: TADANO Panama established2014: TADANO Panama established
2010: TADANO Oceania established2011: Sydney branch for TADANO
O i d
2010: TADANO Oceania established2011: Sydney branch for TADANO
O i d
20
Oceania openedOceania opened

Truck Loader CranesTruck Loader Cranes
[Loader Cranes] Market share in Japan: 48.2% 49.4%Demand in Japan was 17,540 units (for FY2014, based on TADANO research), up 8.6% from the previous fiscal year.
Net sales grew to ¥20 829 million (up 12 0% from the previous fiscal year) backed by rising truck demand and continued highNet sales grew to ¥20,829 million (up 12.0% from the previous fiscal year), backed by rising truck demand and continued high installation rates.
Mounted trucks, these small cranes allow operators to load, transport, and install cargo
ZE600with a single unit.
They are sold indirectly by truck dealers for use in logistics, gardening, and construction industries.
Numerous models are available for mounting on compact, mid-sized, and large trucks,g gwith lifting capacities ranging from 0.49 to 4.9 tons.
-Regulator-
-Major buyers and distinctive features-
• Primarily the Ministry of Health, Labour and Welfare (crane regulations)
• Truck dealersSales tend to parallel truck demand
(The first of its kind to have an optional No Idle feature.)
• Sales tend to parallel truck demand.
[Business outside of Japan] TADANO has focused its efforts on exports of Loader Cranes to strategic
ZR560
SS-38F TADANO has focused its efforts on exports of Loader Cranes to strategic
markets, exporting crane components for mounting on local trucks.Sales in FY2013: ¥1,410 million; in FY2014: ¥1,140 million
Accelerating expansion outside Japan, includingthe opening of a manufacturing subsidiary ZR560p g g yin Thailand on April 2012.
(Slid b d V hi l C i [t t hi l ]
21
(ZR560 Loader Crane for export)(Slide bed Vehicle Carrier [transport vehicle] released on December 2013)
Truck Loader CranesTruck Loader Cranes
25 000
(Millions of yen) Truck Loader Crane sales100 00030 000
(Units)(Units) Demand for Loader Cranes in Japan (based on TADANO research)
20,829
25,000 Second half
First half
79,920
87,630
80 000
100,000 30,000 Second half
First half
Annual demand for ordinary trucks
First-half demand for ordinary trucks
10 56515,213
18,590 20,000
59,310
68,530
17,540
80,000
20,000
First-half demand for ordinary trucks
7,703
9,784
10,565
11,372
15,000 51,420
,
39 300
13,390
16,150 ,
60,000
4 221
6,1818,137
10,000
6,640 8,800 8,780
26 140
23,760
31,920 33,600
39,300
7,230
10,330 40,000
10,000
3,915 5,190
7,509 8,805
10,263 4,221
5,000
3,560 4,750 6,750 7,350
8,760 3,670 5,580
26,140 20,000
47.2% 46.3% 47.4% 48.2% 49.4%
0 FY2010 FY2011 FY2012 FY2013 FY2014Share of unit
sales in Japan(FY basis)
3,560
+11.2% +42.8% +29.6% +20.6% +8.6%
0 0 FY2010 FY2011 FY2012 FY2013 FY2014YOY
change (FY basis)
22

Truck Loader Cranes Truck Loader Cranes -- Steps for globalization Steps for globalization --
ZT500[TADANO (Thailand) Co., Ltd.]Paid in capital : 310 million THB; wholly-owned subsidiary of TADANOEstablishment : April 2012 (Operation launch: June 2013)Establishment : April 2012 (Operation launch: June 2013)Location: Hemaraj Eastern Seaboard Industrial Estate, Rayong Province,
ThailandLine of business : Production and distribution of Loader CranesProductive capacity: 1,000 units/ year (Sales: 38 units in 2013, 258 units in 2014)Representative: Kozo Yoshida, President; number of employees: 42
TADANO has established the first outside Japan production base for products other than Mobile Cranes. While accelerating the expansion of our business outside Japan we aim to increase profitability byour business outside Japan, we aim to increase profitability by establishing the manufacturing subsidiary.
(Loader Crane ZT500 manufactured in the plant in Thailand)
TADANO(Th il d)I id f th l t
23
TADANO(Thailand)Inside of the plant
Aerial Work PlatformsAerial Work Platforms
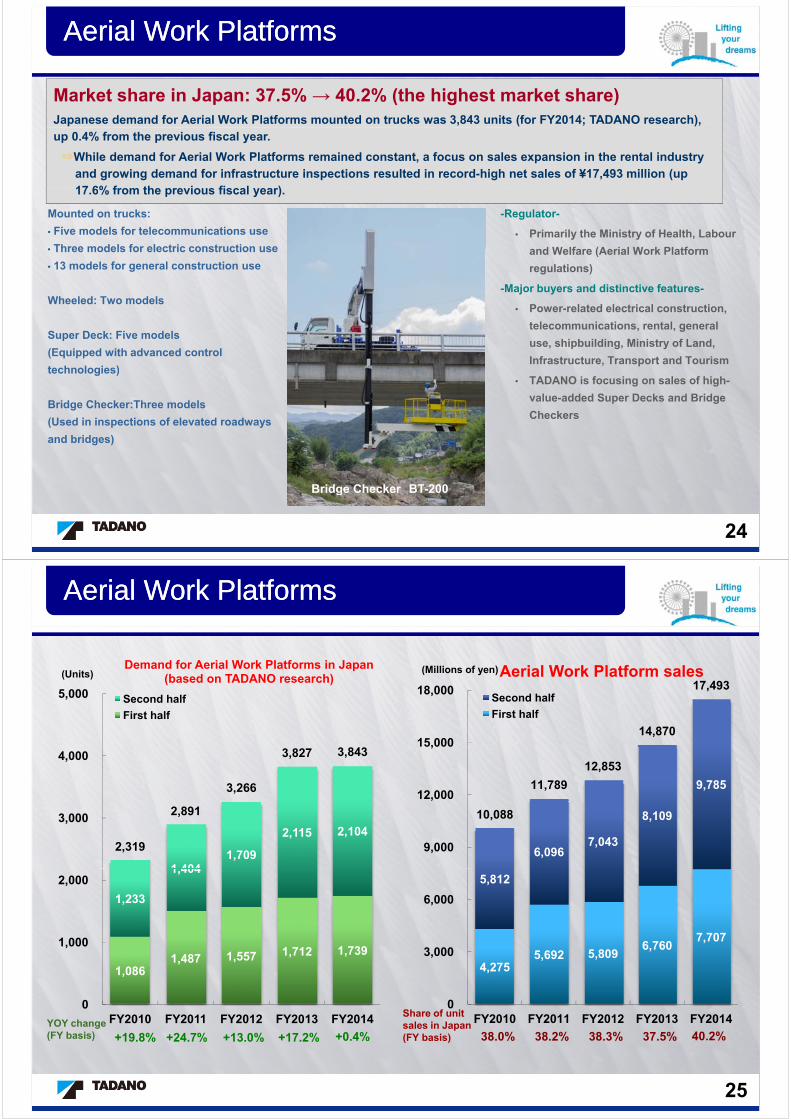
Market share in Japan: 37.5% → 40.2% (the highest market share)Japanese demand for Aerial Work Platforms mounted on trucks was 3,843 units (for FY2014; TADANO research), up 0.4% from the previous fiscal year.
⇒While demand for Aerial Work Platforms remained constant, a focus on sales expansion in the rental industry and growing demand for infrastructure inspections resulted in record-high net sales of ¥17,493 million (up 17 6% from the previous fiscal year)17.6% from the previous fiscal year).
Mounted on trucks:
• Five models for telecommunications use
• Three models for electric construction use
-Regulator-
Primarily the Ministry of Health, Labour
and Welfare (Aerial Work Platform• Three models for electric construction use
• 13 models for general construction use
Wheeled: Two models
and Welfare (Aerial Work Platform
regulations)
-Major buyers and distinctive features-
Power-related electrical construction
Super Deck: Five models
(Equipped with advanced control
technologies)
Power-related electrical construction,
telecommunications, rental, general
use, shipbuilding, Ministry of Land,
Infrastructure, Transport and Tourismtechnologies)
Bridge Checker:Three models
(Used in inspections of elevated roadways
TADANO is focusing on sales of high-
value-added Super Decks and Bridge
Checkers
and bridges)
Bridge Checker BT-200
24
Bridge Checker BT 200
Aerial Work PlatformsAerial Work Platforms
17 49318 000
(Millions of yen)Aerial Work Platform sales(Units)Demand for Aerial Work Platforms in Japan
(based on TADANO research)
14,870
17,493
15,000
18,000 Second half
First half
3 843
5,000 Second half
First half
9,785 11,789
12,853
12,000
,
2 891
3,266
3,827 3,843 4,000
6,0967,043
8,109 10,088
9,000
1 4041,709
2,115 2,104 2,319
2,8913,000
5,812
6,000 1,233
1,4042,000
4,275 5,692 5,809
6,760 7,707
3,000
1,086 1,487 1,557 1,712 1,739
1,000
38.0% 38.2% 38.3% 37.5% 40.2%
0 FY2010 FY2011 FY2012 FY2013 FY2014Share of unit
sales in Japan(FY basis)+19.8% +24.7% +13.0% +17.2% +0.4%
0 FY2010 FY2011 FY2012 FY2013 FY2014YOY change
(FY basis)
25
Other BusinessesOther Businesses
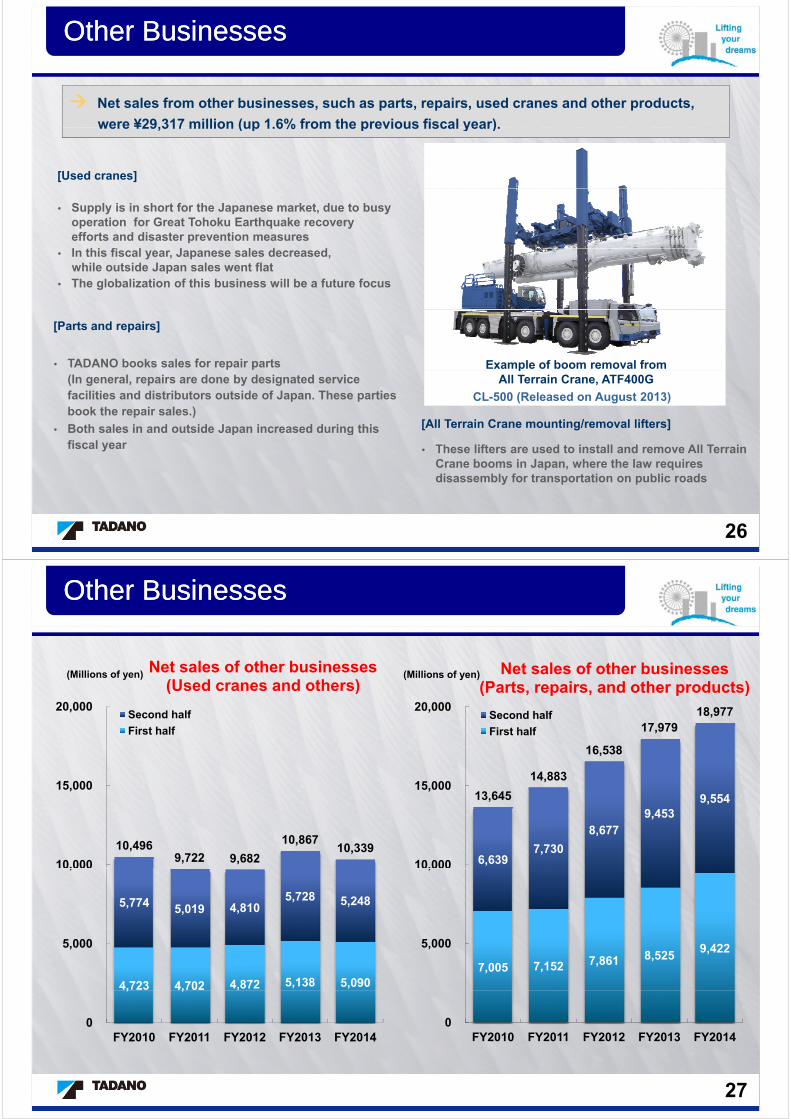
Net sales from other businesses, such as parts, repairs, used cranes and other products,
were ¥29,317 million (up 1.6% from the previous fiscal year).were ¥29,317 million (up 1.6% from the previous fiscal year).
[Used cranes]
Supply is in short for the Japanese market, due to busy operation for Great Tohoku Earthquake recovery efforts and disaster prevention measuresI thi fi l J l d d In this fiscal year, Japanese sales decreased,while outside Japan sales went flat
The globalization of this business will be a future focus
Example of boom removal from
[Parts and repairs]
TADANO books sales for repair parts pAll Terrain Crane, ATF400G
CL-500 (Released on August 2013)
(In general, repairs are done by designated service facilities and distributors outside of Japan. These parties book the repair sales.)
Both sales in and outside Japan increased during this [All Terrain Crane mounting/removal lifters] Both sales in and outside Japan increased during this fiscal year These lifters are used to install and remove All Terrain
Crane booms in Japan, where the law requires disassembly for transportation on public roads
26
Other BusinessesOther Businesses
(Millions of yen) Net sales of other businesses(Parts repairs and other products)
(Millions of yen) Net sales of other businesses(Used cranes and others)
16 538
17,979 18,977 20,000
(Parts, repairs, and other products)
Second half
First half
20,000
(Used cranes and others)
Second half
First half
9,554 13,645
14,883
16,538
15,000 15,000
6,639 7,730
8,677 9,453
10,000
10,496 9,722 9,682
10,867 10,339
10,000 ,
5,774 5,019 4,810 5,728 5,248
,
7,005 7,152 7,861 8,525 9,422 5,000
4,723 4,702 4,872 5,138 5,090
5,000
0 FY2010 FY2011 FY2012 FY2013 FY2014
, , ,
0 FY2010 FY2011 FY2012 FY2013 FY2014
27
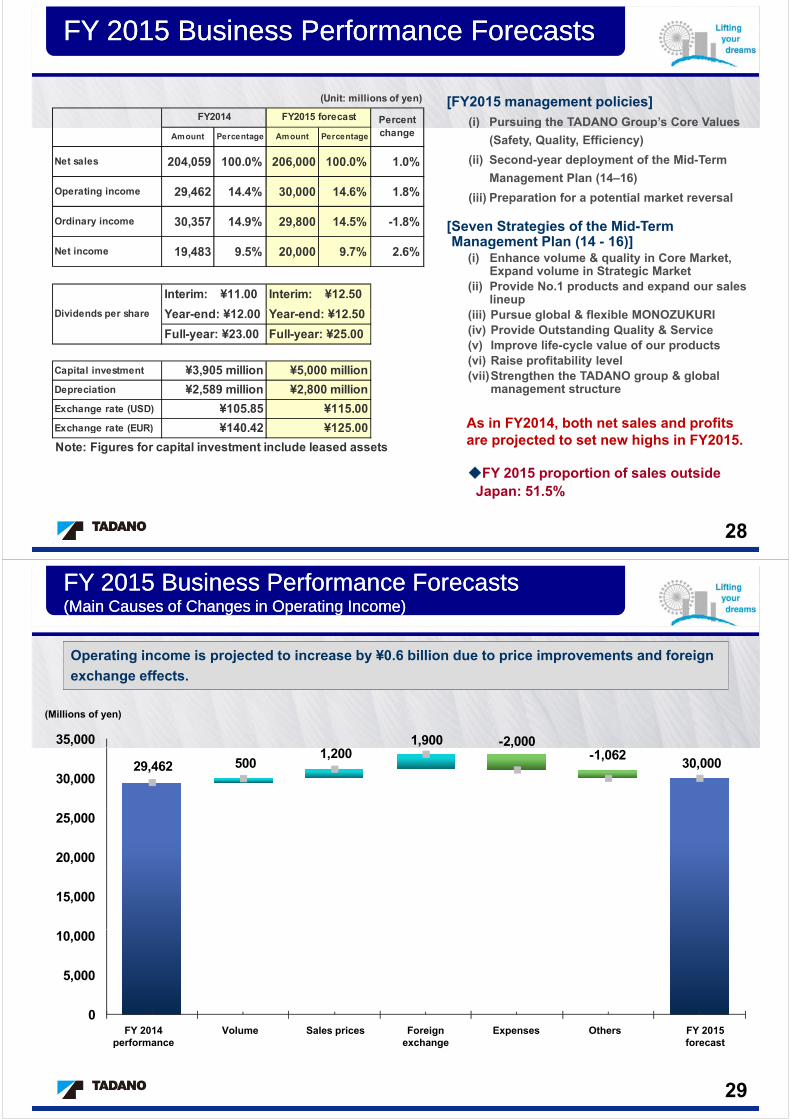
FY 2015 Business Performance ForecastsFY 2015 Business Performance Forecasts
(Unit: millions of yen)
FY2014 FY2015 forecast Percent
[FY2015 management policies](i) Pursuing the TADANO Group’s Core Values
Amount Percentage Amount Percentage
Net sales 204,059 100.0% 206,000 100.0% 1.0%
O ti i 29 462 14 4% 30 000 14 6% 1 8%
change( ) g p
(Safety, Quality, Efficiency)
(ii) Second-year deployment of the Mid-Term
Management Plan (14–16)Operating income 29,462 14.4% 30,000 14.6% 1.8%
Ordinary income 30,357 14.9% 29,800 14.5% -1.8%
N t i 19 483 9 5% 20 000 9 7% 2 6%
(iii) Preparation for a potential market reversal
[Seven Strategies of the Mid-Term Management Plan (14 - 16)]
Net income 19,483 9.5% 20,000 9.7% 2.6%
Y d ¥12 50Y d ¥12 00
Interim: ¥11.00 Interim: ¥12.50
g ( )](i) Enhance volume & quality in Core Market,
Expand volume in Strategic Market(ii) Provide No.1 products and expand our sales
lineup
Capital investment ¥3 905 million
Full-year: ¥25.00Full-year: ¥23.00
Dividends per share Year-end: ¥12.50
¥5 000 million
Year-end: ¥12.00 (iii) Pursue global & flexible MONOZUKURI(iv) Provide Outstanding Quality & Service (v) Improve life-cycle value of our products(vi) Raise profitability level
Capital investment
Depreciation
Exchange rate (USD)
Exchange rate (EUR)
¥3,905 million
¥105.85
¥5,000 million
¥140.42
¥115.00
¥125.00
¥2,589 million ¥2,800 million(vii)Strengthen the TADANO group & global
management structure
As in FY2014, both net sales and profits Exchange rate (EUR)
Note: Figures for capital investment include leased assets
¥140.42 ¥125.00are projected to set new highs in FY2015.
◆FY 2015 proportion of sales outside Japan: 51 5%Japan: 51.5%
28
FY FY 2015 2015 Business Performance ForecastsBusiness Performance Forecasts(Main Causes of Changes in Operating Income)(Main Causes of Changes in Operating Income)
Operating income is projected to increase by ¥0.6 billion due to price improvements and foreign
exchange effects.
1,900 -2,00035,000
(Millions of yen)
29,462 5001,200
,-1,062
30,00030,000
20,000
25,000
15,000
5,000
10,000
0FY 2014
performanceVolume Sales prices Foreign
exchangeExpenses Others FY 2015
forecast
29

FY 2015 Business Performance ForecastsFY 2015 Business Performance Forecasts(Net Sales by Product)(Net Sales by Product)
250,000
Others
Aerial Work Platforms
Truck Loader Cranes
(Millions of yen) (Unit: millions of yen)
ChangeFY2014 FY2015 forecast
204,059 206,000
250,000 Truck Loader Cranes
Mobile Cranes Amount Percentage Amount Percentage Amount Percentage
Mobile Cranes 136,419 66.8% 140,000 68.0% 3,580 2.6%
g
17,493 16,700
29,317 28,700 200,000
Mobile Cranes 136,419 66.8% 140,000 68.0% 3,580 2.6%
Truck LoaderCranes
20,829 10.2% 20,600 10.0% -229 -1.1%
20,829 20,600
,
150,000 Aerial WorkPlatforms
17,493 8.6% 16,700 8.1% -793 -4.5%
Others 29,317 14.4% 28,700 13.9% -617 -2.1%
100,000 Total 204,059 100% 206,000 100% 1,940 1.0%
◆O t id J l ti 50 7% 51 5%136,419 140,000
50,000 Mobile Crane sales in and outside Japan
J 1 144 2 4%47 455 48 600
◆Outside Japan sales ratio: 50.7% 51.5%
0 FY2014 FY2015 f t
Japan 1,144 2.4%
Outside Japan 2,435 2.7%91,40088,964
47,455 48,600
30
FY2014 FY2015 forecast
FY 2015 Business Performance ForecastsFY 2015 Business Performance Forecasts(Net Sales by Destination)(Net Sales by Destination)
(Unit: millions of yen)
ChangeFY2014 FY2015 forecast120,000
EuropeNorth AmericaCaribbean, Central and South AmericaAsia
(Millions of yen)
Amount Percentage Amount Percentage Amount Percentage
Europe 20,211 9.9% 20,000 9.7% -211 -1.0%
103,535 106,000
120,000 Middle EastOther
North America 36,836 18.1% 41,500 20.2% 4,663 12.7%
Caribbean, Central3 475 1 7% 2 500 1 2% -975 -28 1%
20,211 20,000
80,000 and South America 3,475 1.7% 2,500 1.2% 975 28.1%
Asia 16,383 8.0% 16,500 8.0% 116 0.7%
17 052 8 4% 16 000 7 8% 1 052 6 2%
36,836 41,500
,
Middle East 17,052 8.4% 16,000 7.8% -1,052 -6.2%
Other 9,576 4.6% 9,500 4.6% -76 -0.8%3,475 2,500 40,000
Subtotal (total outsideJapan sales) 103,535 50.7% 106,000 51.5% 2,464 2.4%
Japan 100,523 49.3% 100,000 48.5% -523 -0.5%17,052 16 000
16,383 16,500
Total 204,059 100% 206,000 100% 1,940 1.0%
The graph on the left excludes Japan.
9,576 9,500
17,052 16,000
0 FY 2014 FY2015 f t
Other markets comprise Oceania, Africa, and the CIS.FY 2014 FY2015 forecast
31

TOPICSTOPICS
◆TADANO Training Center, in operation since December 2014
The TADANO Training Center is used as a base for training global service staff—not just
TADANO Group employees, but service personnel involved in supporting TADANO products,
including staff at designated service facilities and staff from distributors outside Japan.
TADANO strives to be the global leader in customer satisfaction by providing outstandingTADANO strives to be the global leader in customer satisfaction by providing outstanding
quality and service, one of the Seven Strategies of the TADANO Group Mid-Term Management
Plan (14–16).
Simulator roomTraining room
32