explaining uncertainty in health risk assessment
TRANSCRIPT

f7
Explaining Uncertainty in Health Risk Assessment:Effects on Risk Perception and Trust
Branden B. Johnson
New Jersey Department ofEnvironmental Protection and Energy
Paul Slovic
Decision Research
1201 Oak Street
Eugene, Oregon 97401
Phase 1 Final Progress Report
Prepared for
U.S. Environmental Protection AgencyOffice of Policy, Planning, and Evaluation Risk Communication Projectas part of Cooperative Agreement No. CR-820522
Lynn Desautels, EPA Project Officer
May 19, 1994

Contents
SUMMARY 1
BACKGROUND 2Arguments for Communicating Uncertainty 3Reasons to be Concerned About Communicating Uncertainty 5
METHOD 7
INITIAL EXPLORATIONS . 8
STUDY 1 . 9
STUDY 2 14
STUDY 3: 21
STUDY 4 35
CONCLUSIONS 45
RECOMMENDATIONS FOR FUTURE RESEARCH 47
APPLICATIONS TO RISK-COMMUNICATION PRACTICE 54
BIBLIOGRAPHY 55
Appendices
A. Stories Used in Study 1, May 1993
B. Questionnaire Used in Study 1
C...Stories Used in Study 2, August 1993
D. Questionnaire Used in Study 2
E. Discussion Guide for Focus Groups in Study 3, October 1993
F. Stories Used in Study 4, December 1993
G. Questionnaire Used in Study 4
Explaining Uncertainty
Explaining Uncertainty in Health Risk Assessment:Effects on Risk Perception and Trust
Branden B. Johnson and Paul Slovic
May 19, 1994
SUMMARY
Describing uncertainties in health risk assessments has been touted as a means to educate
citizens, perhaps with the result of reducing their perceptions of risk and increasing their
respect for agency performance. No research had been done to test this assumption.
This first year of research on public response to uncertainty in risk assessments followed
an experimental approach. Simulated news stories were used to manipulate simple versions
of uncertainty (e.g., a range of risk estimates, with and without graphic representations) and
a few other variables. Citizens were recruited from the Eugene, Oregon area to read one
story each, and then answer a questionnaire. Three studies tested between 180 and 272
subjects each. Two focus groups were also conducted to obtain more detailed responses to
simulated news stories.
Tentative conclusions of this first year of research on public response to uncertainty in
risk assessments are that:
• Citizens are unfamiliar with uncertainty in risk assessments and in science generally.
• Citizens may recognize uncertainty (i.e., a range of risk estimates) when it is presented
in a simple, graphic way.
• Citizens' views on the environmental situations presented in the stories appeared to be
influenced far less by uncertainty than by other factors.
• Agency discussion of uncertainty in risk estimates seems to be a signal of agency
honesty.
• Agency discussion of uncertainty in risk estimates seems to be a signal of
incompetence.
Future research building upon these initial results could examine, among others, the role
of trust (e.g., the effect of conflicting assessments of risk uncertainties by other policy
actors; comments by local actors on agency trastworthiness), the effect of different forms of
uncertainty (e.g., methodological uncertainty vs. population variability), or uncertainty in
relation to standards or action levels. It might also be fruitful to examine public response to
legislated descriptions of risk characterization, as found in the proposed Risk Communication
Act of 1993.
BACKGROUND
A continuing issue in risk communication is how best to communicate technical risk
information from scientists and officials to citizens. The purpose of this research project was
to determine whether-uncertainty in risk estimates affects public risk perceptions and trust in
government managers of environmental problems.
Explaining Uncertainty
Arguments for Communicating Uncertainty
Several scientific and government documents have stated or implied that full discussion of
uncertainties in risk estimates would improve public confidence in the quality of risk
estimates. The immediate motivation for USEPA funding of this research was promulgation
in 1992 of "Guidance on Risk Characterization for Risk Managers and Risk Assessors" by
then-Deputy Administrator F. Henry Habicht II (Habicht, 1992). The aim of this document
was to advise on description of risk assessments so as to address "a problem that affects
public perception regarding the reliability of EPA's scientific assessments and related
regulatory decisions" (p. 1):
public confidence in the quality of our scientific output will be enhanced byour...thorough presentation of risk assessments and underlying scientific data. (p. 1,emphasis added).
As part of "thorough presentation" a full characterization of risk "must identify any
important uncertainties in the [risk] assessment...." (p. 8).
Others also have felt that communication of uncertainties is important, and not solely for
decisions by "managers" or "decision-makers": being open about uncertainty is presumed to
enhance credibility and trustworthiness. The most direct statement of this hypothesis came in
a 1988 manual on risk communication that argued that "people are already alert to
uncertainty. Failing to disclose uncertainty is likely to undermine trust in the agency"
(Hance, Chess, &-Sandman, 1988, p. 83; also 69-73). A report on a 1991 workshop on
"Improving Risk Characterization" (American Industrial Health Council, 1992) said full
discussion of uncertainties was an important part of a risk assessment. Although aimed
Explaining Uncertainty

primarily at "risk managers," the report also noted that possible users of the risk information
should be taken into account early in the risk assessment process:
This should include key users beyond the sponsoring organization; e.g., stakeholders andgroups at risk. The risk characterization should be tailored in its level of detail to the typeof potential user and their level of interest, [p. 2; emphasis added]
The report also noted the lack of "systematic study of risk characterizations in terms of their
comprehensibility and usefulness to various types of users" (p. 14). The Carnegie
Commission on Science, Technology, and Government said in 1993 that "communicating a
range of doses provides citizens with a more realistic description of a hazard and hence
results in more informed choices when the range of risks to which one is exposed is
considered" (Risk and the Environment, 1993, p. 87). Although not mentioning effects on
public confidence in risk assessment or government, this statement implies that discussion of
uncertainties will improve citizen decisions.
The assumption that full discussion of uncertainties would heighten public confidence in
risk assessments and in those producing and communicating them is almost entirely untested.
One study found that a written caution about uncertainty of risk estimates did not
significantly affect levels of public concern for a hypothetical hazardous waste case (Bord &
O'Connor, 1992). The "Improving Risk Characterization" report also noted the lack of
research. Yet other hypotheses are plausible: discussion of risk uncertainties may raise
public doubts about the agency's honesty or competence instead of reducing them.
If the assumption that discussion ofuncertainties will "improve" (however defined) public
response to risk or to producers of risk assessments is not correct, USEPA and other
agencies need to know that and examine its implications. If this assumption is true, then
Explaining Uncertainty

USEPA should be able to identify what kinds of information about uncertainty, explained in
what ways, are most helpful to citizens. The USEPA guidance document mentioned above
did not provide that level of detail for managers and risk assessors. The research discussed
here was intended to test the assumption that explaining uncertainties has a major impact on
perceived risk and trust in government among citizens.
Reasons to be Concerned About Communicating Uncertainty
Edmund Muskie's famous plea for "one-armed scientists" as opposed to those who say
"on the one hand, this, and on the other hand that" clearly indicated his annoyance and
frustration with scientific uncertainties. Although, as noted above, only one study has
included even a minor examination of public response to uncertainty in risk estimates, several
lines of research have suggested the following:
• people will be unfamiliar with scientific uncertainty
• people will be uncomfortable with uncertainty and may even deny it
• uncertainty about risk will affect risk perceptions and opinions about agency
performance far less than other factors
Some studies of "scientific literacy" suggest lay people attribute far more definitiveness to
scientific findings than they deserve, particularly when these findings suggest that risk is high
(Miller, 1993; Slovic, 1993). This suggests that uncertainty is not a salient concept in then-
views of science. In addition, many studies show that probability, a concept underlying the
technical risk uncertainties of concern here, is difficult to understand for both experts and lay
people (Kahneman, Slovic, & Tversky, 1982). The notion that uncertainty will make people
uncomfortable and deny uncertainty was explored indirectly by Weinstein (1987). He found
Explaining Uncertainty

that New Jersey residents preferred being told that a situation was safe or unsafe rather than
receiving risk assessment information. Numerous studies have shown that people want to be
certain of their safety (Sandman, Miller, Johnson, & Weinstein, 1993; Slovic, Fischhoff, &
Lichtenstein, 1982). If people want to be sure that they're safe, uncertainty in estimates of
the risk will undercut that guarantee.
There is also research that suggests that technical information on risks, including
uncertainty information, is less important to public response to risk and government than
other factors. For example, government actions to address public concerns and share
information early strongly affected perceived risk and judgments of agency performance for a
hypothetical chemical spill. By contrast, detailed technical information on health effects and
exposure pathways had no observable effect (Johnson, Sandman, & Miller, 1992). In another
study, trust in industry and government, perception of health threats to oneself and family,
and the sense that hazardous waste risks could be controlled were among significant factors
in concern about a hypothetical hazardous waste site. A warning about the uncertainty of risk
estimates in general and knowledge about chemical risks were not significantly related to
concern (Bord & O'Connor, 1992). A study of public response to global warming found no
effect from large variations in the timing and magnitude of scientific predictions of warming
outcomes (Bord, O'Connor, & Epp, 1992).
In short, despite the arguments in favor of communicating uncertainty in risk assessments
to the public, there are several reasons to be concerned that such communication may create
rather than resolve conflicts between officials and citizens. Nevertheless, uncertainty is
inherent in risk assessment and needs to be part of accurate communication about risk.
Explaining Uncertainty

Research is needed to help agencies determine how best to communicate these uncertainties
to the public.
METHOD
The primary research method used in this first year of research on uncertainty was
presentation to subjects of scenarios in the form of simulated newspaper stories. This
approach allows for experimental variation of stimuli presented to subjects and for statistical
analysis of the independent contribution each variation makes to risk perceptions. In contrast,
use of an official or simulated EPA fact sheet might restrict experimental variation, through
its existing content, current limits on what the agency can say about risks, or because
scientific uncertainty is too great to get agency consensus on what to say. Another reason for
using a simulated newspaper story as the channel for conveying uncertainty information is
that this is a major channel by which citizens receive risk information.
After reading a single story, subjects were asked to answer several questions. These
included questions about (1) perceived risk; (2) perceived uncertainty of the risk; and (3)
perceived trust, including agency honesty and technical competence. Other questions
measured: (1) risk aversion, societal and personal; (2) general attitudes toward government
and authority; and (3) socio-demographic items (e.g., age, gender).
The use of scenarios and questionnaires in a structured format has been used extensively
-by both of us in earlier research to reveal citizens' cognitive understandings of environmental
and technological risks, and is appropriate for this exploratory research. Alternatives, such as
large-scale surveys, are not suitable until more is known about the impact of risk
uncertainties on public risk perceptions.
Explaining Uncertainty

INITIAL EXPLORATIONS
Our original proposal for the first year of research was to develop scenarios in which
USEPA reported a range of risk estimates focusing on the maximally exposed individual, for
a hazard related to pollution prevention. This might have been ozone depletion and its effects
on skin cancer incidence, to meet then-current interests of USEPA officials. Stories would
either say nothing about uncertainties; mention 2-3 key sources of uncertainty (e.g., in future
emissions levels or human exposures) without providing any details; or discuss the same 2-3
key sources of uncertainty in detail. Scenarios would also vary in their degree of uncertainty,
signalled by such items as "weight of scientific evidence." Different contributors to ozone
depletion (e.g., automobile air conditioners versus high-altitude jet contrails) might be means
to obtain plausible high- and low-uncertainty for this hazard. The agency would deliver the
risk estimates as if it was seeking subjects' support for federal action to reduce ozone
depletion.
Upon reflection, however, we concluded that this approach was premature. Uncertainties
in ozone depletion risks are much larger than for many hazard situations, and conveying
these meaningfully could be very difficult. Furthermore, given doubt about the relative
importance of risk uncertainties in shaping public risk perception and confidence in
government, this approach seemed too detailed. It is probably unimportant whether
uncertainties in use of animal data are viewed differently by citizens than uncertainties in
dose-response extrapolation, for example, if uncertainty in general has little or no effect on
perceived risk.
Explaining Uncertainty

Before testing simpler scenarios, however, we spent some time analyzing the kinds of
factors concerning both uncertainty and other topics that might affect perceptions of risk and
agency performance. These are summarized in Table 1. This list guided us in drafting the
simulated news stories used as alternative scenarios, since these would necessarily contain
information in addition to the experimental manipulations. For example, "source of danger"
(in the hazard category) could be an abandoned hazardous waste site, operating factory,
proposed chemical waste facility, proposed low-level radioactive waste facility, or natural
radiation in the home. These alternative sources of danger, if chosen as manipulations, would
allow variation among past, present, and future risks, chemicals and radiation, human and
natural causes, and community and household risks.
Because the 23 kinds of variables identified in Table 1 could be combined in a very large
number of ways, it was decided that the first test of uncertainty's effects would focus on just
a few critical variables. These variable types, and draft simulated news stories for Study 1,
were reviewed by Dr. Adam Finkel of the Center for Risk Management, Resources for the
Future, an authority on issues of uncertainty in risk assessment. He is not responsible,
however, for the stories actually used.
STUDY 1
A first test of the effects of uncertainty was conducted using simulated news stories (see
Appendix A for the full set of sixteen stories, and Appendix B for the two questionnaires
used: one for butydin and one for zydin). These included a headline, dateline, quotations
from officials and citizens, and a columnar format, as in real news stories. As shown in
Explaining Uncertainty

Table 1. Categories of Variables
Hazard Source of dangerExposure pathwaysHealth endpointRisk estimate
Timing of health consequencesVoluntariness
Equity
Uncertainty Degree of uncertaintyWeight of evidenceBasis for uncertainty
Involved Parties "Victims"
Generator of dangerIssuer of risk estimate
RegulatorsCritics
Management of Issue Interpretation of uncertainty by source of risk estimateAction messageVictims' behaviors
Other messages of managers
Presentation of Information Drama
Citizen reactions to uncertaintyCitizen reactions to managerial actions
Explaining Uncertainty 10

Table 2, the stories varied in the type of hazard they concerned (a chemical from an
abandoned hazardous waste site, or natural radiation in the form of a gas in homes), the risk
estimate used (one-in-a-thousand or one-in-a-million), and four levels of uncertainty (none
mentioned; the true risk could be as low as 10% of the estimate; as low as .1% of the
estimate; as low as zero). Imaginary names were used for the chemical ("butydin") and
radiation ("zydin"), to avoid potential established reactions to highly-publicized items like
dioxin or radon. These stories also included several items that could be varied in future
research:
(1) the issuer of the risk estimate (EPA)
(2) a risk comparison ("For comparison, the risk of getting cancer from exposure to all
possible causes of cancer is about one in four for an American")
(3) the weight of evidence (possible cause of cancer)
(4) the implication of estimate uncertainty (more study needed).
An advertisement was placed in the University of Oregon newspaper to recruit 272
subjects (17 people per story), each of whom was paid a nominal fee. Subjects took part
simultaneously, in the same room, in May 1993. Each read one story, assigned randomly,
and then answered the questionnaire. They could refer to the story while answering the
questions.
This first test did not seem to describe risk and variations in uncertainty that were
apparent to subjects. The initial question was, "Did the government say what the risk of this
problem was?" A good manipulation would have had nearly 100% positive response,
particularly since subjects could refer back to the story while answering questions. Only 84%
1 1Explaining Uncertainty ' '

Table 2. Study 1 Research Design (16 stories)
Hazards* and Risk Estimates
Butydin Zydin
Uncertainty Condition i:i.ooo i:1,000,000 l:1,000 i:1,000,000
None mentioned 12 3 4
"the true risk could be as low as
10% of the . . . estimate ..." 5 6 7 8
". . . as low as 0.1% ..." 9 10 11 12
". . . as low as zero." 13 14 15 16
* "Butydin" is an imaginary chemical from an abandoned hazardous waste site;"zydin" is an imaginary radioactive gas in homes, from a natural source.
Explaining Uncertainty 12

said the risk was stated; nearly a fifth of subjects did not notice this statement, or at least did
not connect the question with the risk statement in the story.
Those who answered "yes" to the first question were then asked whether the government
provided "a single number for the risk or...a range within which the risk might lie." There
was a statistically significant difference (p < .05) in answers: those who read a story in
which no uncertainty was indicated were more likely to cite a single number (41.5%) than
were readers of the three kinds of stories in which uncertainty was mentioned (17-29%).
However, 58.5% of readers of the no-uncertainty stories claimed that a range of risks was
mentioned. Clearly the manipulation failed to make clear to subjects the difference between a
single number and a range.1
Despite the lack of statistically significant uncertainty effects, other manipulations did
affect dependent variables. For example, stories about zydin (natural radiation) elicited
significant rankings of lower risk, less worry, more understandable and honest information,
and a more honest agency than did stories about butydin, the hypothetical chemical from an
abandoned hazardous waste site. This finding is consistent with many previous studies that
have found lower perceived risk from natural hazards than for technological hazards (e.g.,
Baum, Fleming, & Davidson, 1983).
1The citizen comment in the no-uncertainty stories that "Now they're telling us we could get.cancer" may have heightened perceived uncertainty for readers of these stories. However,this is unlikely to explain these results, since the confusion among readers of no-uncertaintystories in Study 1 about mention of a range of risks was no greater than in Studies 2 and 4,which lacked this citizen comment. In addition, the citizen comment concerns personalvulnerability ("could" get cancer), whose uncertainty is (at least technically) separate fromthe presence or absence of uncertainty in a population risk estimate.
Explaining Uncertainty 13

Risk estimates of "one-in-a-thousand" elicited significant ratings of more honest
information, and a more honest agency, than one-in-a-million estimates. This finding is
consistent with previous research that found people said they would believe a government
agency more if it said there was an environmental problem than if it said there was no
problem (Weinstein, 1987).
The lack of any apparent effect of the uncertainty manipulation in this study can be
interpreted in several different ways. This negative result may reflect reality: lay people are
unaffected by uncertainty in risk estimates. However, it may be an artifact of the research
design. For example, the attributes of uncertainty may not have been highlighted, or the
differences large enough to be noticed by subjects. Another possibility is that the wording of
some questions (e.g., mentioning uncertainty without defining it as "a range of risk
estimates" or some other salient phrase) did not convey to our subjects what it conveys to
experts.
STUDY 2
A second test of the effects of uncertainty was conducted using simulated news stories.
The stories concerned a chemical from an abandoned hazardous waste site, and varied in the
risk estimate used (one-in-a-thousand or one-in-a-million), whether a paragraph outlining a
range of plausible risk estimates (from zero to ten times the estimate) was included, and
whether a graphic emphasizing the nature (point or range) of the estimate was included.
Factorial combination of each of these factors created a total of eight stories (see Table 3 and
Appendix C). The questionnaire used appears in Appendix D.
Explaining Uncertainty 14

Table 3. Study 2 Research Design (8 stories)
Uncertainty Paragraph No Uncertainty Paragraph
Risk Estimate Graphic No Graphic Graphic No Graphic
1:1,000 12 3 4
1:1,000,000 5 6 7 8
Explaining Uncertainty 15

Only one hazard, butydin, was used in this test because this variable (hazard type) is not
directly related to uncertainty, and it seemed important to focus on evoking consistent and
significant responses to variations in uncertainty alone. The questionnaire and stories were
revised to try to make the risk estimate and uncertainty more noticeable to subjects, in
addition to the additional paragraph and the graphics mentioned above. For example,
comments by local officials and residents were removed, both to shorten stories and to focus
on actions (e.g., descriptions of uncertainty) that are directly under agency control. The risk
comparison (total risk of getting cancer) was retained.
An advertisement was placed in the University of Oregon newspaper to recruit 180
subjects (8 stories, averaging 22.5 people per story); each subject was paid a nominal fee.
Subjects took part simultaneously, in the same room, in August, 1993. Each read one story,
assigned randomly, and then answered the questionnaire. They were able to refer to the story
while answering the questions.
Analysis of the entire sample again found successful manipulation of probability (Table
4). Higher probability (1:1,000) in the story evoked higher perceived risk, more worry, and
(although not quite significant at p < .05) greater expressed intention of getting the site
cleaned up. Lower probability (i.e., 1:1,000,000) signaled preliminary rather than complete
information to people. Since probability did not affect judgments of the agency's honesty,
this latter result may indicate that people see low risk estimates as indicating scientific
ignorance, rather than either a government cover-up or an accurate assessment of risk.
However, there was a significant interaction between probability and uncertainty (P < .05),
affecting views on whether the risk was "known precisely to government" or was "unknown
Explaining Uncertainty 16

Table 4. Study 2 Probability Effects
Risk Estimate
1:1,000 1:1,000,000 P
Perceived Risk
(1 = very low; 7 = very high) 4.07 3.16 <.001
Worry(1 = not at all; 4 = very worried) 3.09 2.70 <.01
Preliminary Risk Information(1 = complete; 7 = preliminary) 4.87 5.44 <.005
Explaining Uncertainty 17

to government." People who read the 1:1,000,000 story without any uncertainty information
were more likely than others to see the government's knowledge as precise.
Study 1 had difficulties in eliciting "correct" answers to the first two questions. In Study
2, the initial question was, "Did the government agency say what the risk was of getting
cancer from drinking water contaminated with butydin?" This version of the question used
the exact language of the story where the risk estimate was mentioned, aimed at removing
any ambiguity that might affect some subjects' apparent inability to recognize the risk
estimate in the story. A good manipulation would have had nearly 100% positive response,
especially since subjects could refer back to the story while answering questions. However,
this approach did not improve response; only 78% (compared to 84% in the first test)
recognized that the government mentioned the risk level.
Those who answered "yes" to the first question were then asked whether the government
provided "a single number for the risk or...a range within which the risk might lie."
Answers indicated some subjects were still failing to recognize this variable. Some 48% of
those getting the point-estimate story reported a range given; 20% of those reading the story
with the extra paragraph on uncertainty said the story included only a single risk number.
Because of these residual "errors" in story-reading, the following report of results for
uncertainty manipulations includes two sets of data. One is the ANOVA analysis for the
entire sample; the other data set includes only the 92 (of 180) people who answered these
first two questions correctly.
Unlike Study 1, this study revealed differences linked to the uncertainty manipulations
(Table 5). Those who read stories with ranges of risk estimates were more likely than those
Explaining Uncertainty I8

Table 5. Study 2 Uncertainty Results
Point Story" Range Storyb(No Uncertainty) (Uncertainty) p < x
"Very Great"/"Moderate" range of risk 42% 86% .001
Risk information in story is uncertain 28% 54% .01
Risk from butydin is high 14% 34% .05
"Somewhat"/"Very Worried" 58% 73% .01
N = 92
a Response by readers of all stories that contained a point risk estimate whether 1:1,000 or1:1,000,000.bResponse by readers of all stories that contained a range of risk estimates, whether thatrange was 0-1:100 or 0-1:100,000.
Explaining Uncertainty 19

reading single-estimate stories (86% vs. 42%; P < .001) to say that a "very great" or
"moderate" range of risk was described in the story. The "range" group were also much
more likely-to rate the risk information in the story as uncertain (5-7 on a seven-point scale,
54% to 28%). They also saw the risk from butydin as greater; on a seven-point scale, 34%
vs. 14% rated the risk as 5-7 (P < .05). This may have occurred because they gave greater
weight to the upper end of the ranges. If one focuses only on the highest estimates, it is
reasonable to assess the risk in the range stories as higher than in the point stories.
The uncertain situation was also more worrisome: 73% of the "range" readers compared
to 58% of the "point" readers rated themselves "somewhat" or "very worried" (P < .01).
No obvious differences appeared between the "range" and "point" groups for ratings of the
trustworthiness, alarmingness, or honesty of story information. However, for the entire
sample the presence of a graphic significantly reduced perceived trustworthiness of story
information. For range and point stories combined, those with graphics received a mean
rating of 3.31 (on a seven-point scale from "not trustworthy" to "trustworthy"). Stories
without graphics were rated as 3.84; the difference was significant at P < .01.
Within the group that received a range of estimates and correctly recognized this range,
(N = 56), 66% agreed that the agency's discussion of how much the risk might vary made it
seem more honest (29% disagreed). Some 59% disagreed with a statement that this
discussion made the agency seem less competent (34% agreed with the statement). About
71% of the "range" group agreed that the discussion would have made them more concerned
about the risk had they lived in this imaginary town.
Explaining Uncertainty 20

The results of Study 2 were mixed. In contrast to Study 1, the uncertainty manipulations
(both the paragraph of text and the graphic) worked. Effects of uncertainty on subject
assessments of agency honesty, for example, were strong enough to appear in results from
the entire sample, despite findings that suggested some subjects were not fully aware of the
nature of the risk estimate. Both the paragraph on uncertainty (i.e., presenting a range of risk
estimates) and the graphic were apparently able to make uncertainty more visible and salient
to subjects than the phrasing used in Study 1.
However, the presence of risk estimates, and both graphic and verbal indicators of
uncertainty, in the stories were not noticed by many subjects (or the questions about these
items did not mean to them what they meant to us).
Before proceeding with another study, it seemed prudent to convene some focus groups to
understand in more detail how people interpret uncertainty in the environmental news stories
produced for Study 2. We hoped that this approach would reveal whether those stories
framed uncertainty in a way not salient or recognizable to subjects.
STUDY 3: FOCUS GROUPS
Two focus groups were conducted in October 1993 with residents of Eugene, Oregon and
a facilitator from the Decision Research staff. The first group included seven volunteers (four
women and three men) in a local social change and political action group, all with
undergraduate degrees and an average age in the late twenties. The second group included six
members and friends of a women's community volleyball team (four women and two men).
All had attended some college, four held undergraduate degrees, and two were in graduate
school. Their average age was in the mid-twenties. The groups read three 1:1,000 stories
Explaining Uncertainty 21
from Study 2: the point-estimate story ("the additional risk ... is one in a thousand"), the
same story with a graphic added (see Appendix C, page C2), and the range story ("the true
risk could be as low as zero, or as high as one in a hundred") with graphic (see Appendix C,
page C4). After reading each story, focus-group members answered a selected set of items
from the Study 2 questionnaire, and discussed these reactions and the reasons for them.
Except where noted below, focus group members read the same stories and discussed the
same issues following the discussion guide provided in Appendix E.
Salience of environmental problems. In general, people said they were concerned about
environmental problems only for threats that seemed close to them or received a lot of
publicity:
• If you're going to move to Lancaster Road or . . . close to the Winston Reservoir.
• ... if I was pregnant or if I had kids . . .
• ... if I was looking at this [story] in the newspaper, I probably would not read pastthe first paragraph . . . Which is another reason why the [graphic] box is nice ... So itis over on Winston Reservoir blah blah blah. And I was thinking, what does this meanfor me?
• [in the country] I wouldn't care . . . It's just cows! [while in a city like Eugene evenone more person with cancer is] one too many.
Certain risk. Overall, people seemed to notice and understand the 1:1,000 risk figure in
the stories. One confusion concerned the action to which the risk estimate applied: one
person suggested it was inaccurate because it didn't include the odds of butydin getting into
the drinking water. Two people noted their confusion over whether this number referred to
"1 in 1,000 people or whether your chance was 1 in 1,000, which are two different things."
Explaining Uncertainty 22
Reactions to the certain 1:1,000 risk varied. As noted above, most people seemed
concerned only if they thought themselves at risk (for example, if the story appeared as they
were moving to town, making the risk salient): One person thought it was higher than the
"safe" level of 1:1,000,000.
Uncertain risk. After reading the uncertainty story, which stated that "the true risk could
be as low as zero, or as high as one in a hundred," people reported the risk either as 1:1,000
(cited in the story as the "most likely risk estimate") or as zero to 1:100. Many stressed the
1:100 figure. Reasons given for stressing the higher figure were striking. For example, one
person said
I ignored the fact that there was zero risk because they wouldn't have reported it if therewas zero risk...for some reason this graph looked more government-like, and so Iimmediately went to worst case scenario...it was likely that further tests would prove thatit was...somewhere between 1 in 1,000 and maybe even higher, at 1 in 100.
Because the news story did not specify that the USEPA had announced both the best risk
estimate and the range (the connection could be inferred only from the propinquity of the two
statements), one person thought the reporter or someone else might be citing the range as a
criticism of the USEPA estimate.
Somewhat more than half of the two groups' members were more concerned about the
risks described by the range than with the single figure. There was some doubt expressed
that everyone in the population, or even a majority, would see greater reason for concern
with the range. Because the range included zero risk, "people who don't want to worry about
this are going to find plenty of support for not worrying about it."
Overall people felt that providing a range was more honest. For example,
Explaining Uncertainty 23

• I think it's a little more honest when there might not be any risk and there might be ahigh risk or a higher risk. And if they don't know, they at least know that there issomething they need to investigate and find out. But there's no sense in, like, alarmingpeople more than they need to...for some reason I think I feel more comfortable withsomething like this than I do with...a number like a risk 1 in 1,000, or whatever. Justlike a definitive number where it's like, I mean, I can't even imagine how they come upwith something like that.
• The reason I took the higher risk is usually I would expect governments to only giveone explanation, you know, thinking that they know it all, and I guess I appreciate thefact that they are more uncertain because that is the way I tend to feel about this kind ofenvironmental estimation that there is no way in hell that they really know what is goingon. So, I personally appreciate that they did this, but, like John said or other people said,they should probably be fired for being bad government bureaucrats for giving suchuncertain information.
• [The range approach] tends to see the public as competent, educated citizens, who aregoing to have more information, who are going to have to make up their own minds,which I think is a good first step for the government to do. It hasn't done it in the pastmost of the time.
• I assumed vast uncertainty even when it was presented as an absolute fact, so...I guessit is more encouraging to see it [in a range].
The existence of a range of risk estimates evoked very mixed reactions, apparently both
within and between focus group members. On the positive side, agency presentation of the
range (1) "made me think" even for someone who doubted the agency's tmstworthiness, (2)
could keep citizens from misinterpreting a later, smaller risk estimate that falls within the
range as an agency attempt to minimize the risk, and (3) seemed more honest, if citizens
already knew there was a range, than having the agency announce a single "middle" number.
On the negative side, one person felt agency officials were "covering their butt" in discussing
uncertainties, and several people said they would not be upset by agency silence about a
range if they did not know such a range existed. As shown elsewhere in this discussion of
Explaining Uncertainty 24
the focus group results, most people seemed unaware of scientific uncertainty in risk
estimates.
Competence and honesty. Several people felt that the statement of a range indicated
(even more than the no-uncertainty story's references to "further studies") that "the agency
doesn't have a clue." Among other comments:
• It bothers me when there are a lot of maybes and who knows.
• I didn't think much of their ability to be precise....
• Either they should, you know, we should sell the house and move, or...they should allbe fired because they are...being alarmists. What are they really doing in the EPA? Ithought that their preliminary results were too preliminary.
• don't even print it until you know for sure whether the site would qualify as aSuperfund site; "further studies" raised doubts about whether the agency knew "what'sgoing on."
• to tell me that the risk could be anywhere between zero and 1 in 100, I could haveprobably guessed that.
The general feeling was that honesty was more important than competence, although this was
by no means comforting:
• I kind of assume that the government doesn't know what they are doing most of thetime ... At least they are finally admitting that they don't know what is up.
• [Person 1:] . . . how would you feel if the government wrote an article like this andtold you that they have no idea whether this is going to pose a risk of cancer to you ornot. And they really just are having a hard time with studies determining it. [Person 2:]Yeah, thank you for being honest.
• [in reaction to the story's statement that "the true risk could be as low as zero":] howcome you can't even figure out if there is a risk or not? You say it causes cancer. Well,is there a risk or is there not a risk? I don't know, it just bothered me.
• The honest imbeciles: The EPA.
Explaining Uncertainty 25

For some people, in fact, the range seemed to evoke doubt about the agency's
trustworthiness:
• [in contrast to the single risk number, which seemed more definite and lower,] when itbecame 1 in 100 or zero, I thought then, it's the government bean counting thing, and it'sall going to be about trying to present the material the way that they want to present it, orthe way that they need to present it, or you know, if it's going to cost the Superfund,then are they really just trying to not, you know, use funds? It becomes a political issueto me at that point . . . what's the other research? Where does it come from? Why? Imean it immediately makes me question more when the research was not as solidstatistically.
• If they were competent enough to know that they had the money to clean it up, thenthey are going to report it more honestly than if they, I mean, they may give you the ideathat there is zero risk, if they don't have any way to clean it up, but it's a governmentwaste site. If...they got the money, and they are going to clean it up, and they want tolook good, and they want to do PR and stuff, they are going to tell you there was thishuge risk and we're going to take care of it. And I just think it's all so politicallymotivated that it doesn't really mean anything anyway.
Presenting risk ranges. Focus group members suggested that there be a transition format
if people were used to hearing just a single figure, to avoid confusion and distrust. Saying
that "the true risk could be as low as zero" not only raised trust issues (see above), but was
less helpful than saying "if there is a risk, and then what the interval is." Using a standard
format for uncertainty information, (like the nutritional information on cereal boxes), might
confuse people initially but could educate them over time if used consistently. It was also
noted that some "people...would definitely prefer to have just one straight answer and assume
that everything is OK.... So maybe we are a biased group...."
Some comments concerned the utility of a note about the imprecision of science. One
woman's greater skepticism over the range was a product of both cynicism about media
accuracy and the way the range was presented. She suggested that
Explaining Uncertainty 26

Sometimes a little disclaimer that reminds people that no matter how many tests you doyou can never be positively sure will remind people that....they are doing the best theycan. And I would think that that would help me assess that at least they are being honestabout the fact that they are really not sure what risk this poses. Whereas, without thatinformation, I just kind of decided incompetence. More like, well they haven't doneenough studies, or their studies keep giving them different information, you know, thingslike that.
Noting that ranges in science are "normal" could remind some people of this fact and suggest
to others that the agency was being honest, even if still others thought this comment "was a
cover-up."
Risk comparisons. Each story read by focus group members included the following
statement: "For comparison, the risk of getting cancer from exposure to all possible causes
of cancer is about one in four for an American." Both groups correctly interpreted the
general risk of getting cancer (one in four), despite its daunting nature:
• By the time we're all dead, every fourth one of us will have had cancer of some sort insome severity.
• That one or two out of this room [seven, including the facilitator] will end up withcancer at some point.
• [It] made me scared, you know, to leave the office.
Some had minor doubts about the comparison's credibility:
• [After another person said that one shouldn't drink the water] Yeah, I think that thecomparison with the 1 in 4 minimized this risk . . . made it seem like, well, everybodyhas a 1 in 4 risk anyway, this [1:1,000 risk] is just one more little contribution to that.
• [one person thought the reference to "all possible causes of cancer" made it sound asif] you are standing in front of a nuclear power plant drinking some PCBs and likeexposing yourself to all possible sources of cancer that you can get a hold of, smokingcigarettes ... if that were the chance of being 1 in 4, then, I mean, you probably have amuch larger chance.
Explaining Uncertainty 27

• . . . that was kind of a nice baseline, but, still, that is kind of way out there, too [i.e.,like 1:1,000 risk].
However, there was concern (despite the risk comparison—see below) that it would be hard
to put this risk in context:
• I would make it more human interest. If you wanted people to care [about] 1 in 1,000,I don't think people are going to think, Now that last toxic waste site that was 1 in 2,000,this one is worse.
• I would find someone whose dog had died or whose chipmunks had died and put it tothem that way, because that way people would talk about it.
Yet respondents also felt some people would be skeptical no matter how the risk is
presented, and a range "might confuse people just as much as help them understand what the
nature of the problem is."
Graphics. The reaction to graphics (see pages C2 and C4, Appendix C) varied, although
it was generally positive. The graphic attached to the certainty story made the story clearer
and more salient, although a minor wording change between the graphic ("1 additional
chance in 1,000") and the text seemed to mean something different for one reader.
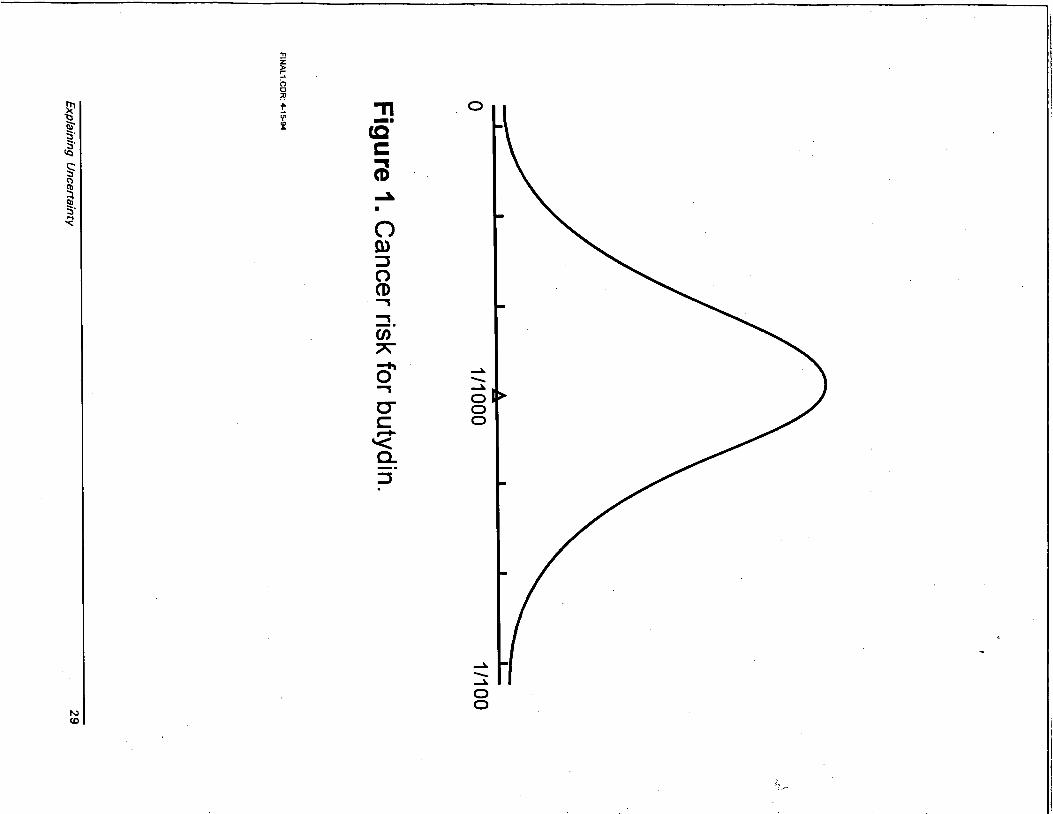
After reading the stories, one focus group was shown alternative uncertainty graphics that
had not been used in Study 2. The first one presented the same range on a bell-shaped
probability distribution curve (Figure 1). Most group members saw it as being more useful,
since it conveyed the relative probabilities of a given risk estimate. A few participants felt
confused by it, and suggested it would require more education of the reader. Because it looks
like something out of "science class," it conveys an impression of being more scientific and
thus, by implication, more credible. However, one person suggested that the range could be
Explaining Uncertainty 28
01
/10
00
1/1
00
Figure
1.Cancer
riskfor
butydin.
FIN
AL
1.C
DR
:4
-15
-94
Exp
lainin
gU
ncertain
ty2
9

as wide as in the graphic only for something designated as "preliminary"; a "final" graphic
with the same range would elicit skepticism. By contrast, the Study 2 graph implied to focus
group members that the chances of any estimate being true were even. One man suggested a
form like 100 _+ 5 was even easier to understand than the curve, to which a woman
responded "I hate plus or minus."
The group was then shown two bar graphs, one of which put the 1:1,000 figure close to
the 1:100 figure (see Figure 2) and one that put the 1:1,000 figure close to zero (see Figure
3), rather than halfway between the two, as in the Study 2 version. These graphics were
suggested by comments from members of the earlier focus group: one person thought
1:1,000 should be close to zero because it was "a lot less risk than 1 in 100"; another
thought the two probabilities should be "right next to" each other, since "they are both a long
way from zero." The group viewing the bar graphs suggested that putting 1:1,000 higher on
the graph made the risk seem higher, replicating an earlier study's findings (Weinstein,
Sandman, & Roberts, 1989). One man suggested not showing the zero at all, to "cut [the
graphic] off in the middle." Just saying "or we could be wrong" or (perhaps more accurately)
"or it could be a false alarm" would be the equivalent of zero ("if it is zero, they are just
really saying, We could be wrong"). Overall people thought the bell curve was "much more
accurate" than any of the bar graphs. The bell curve seemed more honest as well, although
one person suggested it could be the "least effective to communicate."
The bottom line was that more information, of whatever sort, was more useful and
more credible for this particular group; any hint of withholding information raised distrust.
Explaining Uncertainty 30

1 additional chance in 100 (EPA's highest estimate)
1 additional chance in 1, 000 (EPA's best estimate)
0 No risk (EPA's lowest estimate)
Figure 2. Graphic for the focus group.
final2.cdr 5-19-94
Explaining Uncertainty 31

1 additional chance in 100 (EPA's highest estimate)
1 additional chance in 1, 000 (EPA's best estimate)
0 No risk (EPA's lowest estimate)
Figure 3. Graphic for the focus group.
final3.cdr 5-19-94
Explaining Uncertainty 32

Trusting EPA and others. People had mixed feelings about EPA and communication
issues. On the one hand, there seemed to be a surprising amount of sympathy with the
difficulty of the agency's tasks:
• I wanted to write the EPA people, you know, and say, good job for putting up with allthese idiots who would rather breathe in toxins than lose their jobs.... I think that they[USEPA] do a good job.
• It's hard to be the EPA.
• Yeah, it would be a hard job.
• You guys are OK; don't take it so bad.
Yet there was also criticism of the agency's performance, the need for USEPA to "start
getting it together":
• I'm more sympathetic toward them than I am the Defense Department. Kind of rootingfor them, but nonetheless I would...always be questioning whether they are trying tocover up.
In fact, some people were dubious about the focus group research itself, as if EPA was
looking for ways to manipulate the truth to get the public reaction it wanted. Some people
also felt that their ignorance of what USEPA's role is in environmental issues made it
difficult for them to evaluate, in real life or in the focus group, the value of various
communication approaches. Despite distrust, there was some appreciation of the
communication challenge posed:
• It is a Catch-22 because people want you to be honest, yet some things they don't wantto know in a complicated fashion.... To be honest with them you have to deliver somecomplexities that they might or might not want to deal with at that time...they should trydifferent mediums and different ideas to get their messages across, build some familiarityand some trust in the public, and then, you know, give themselves to being trustworthy.
Explaining Uncertainty 33

Because if they breach the trust they are screwed. No matter how much money theydump into it. So, I guess, it is their choice.
• We just need to give...the benefit of the doubt to the public that they are educatedenough.to...recognize that the government is trying its best. You know, they are notgoing to believe it, but I don't know what else you can do.
The honesty of other actors was open to question as well. A butydin manufacturer's risk
estimate would be trusted only if it was higher than USEPA's. Trust in an environmental
organization's risk estimate would vary from no more than in the USEPA's estimate, to more
on "some things . . . probably," to more trust unequivocally. University scientists'
trustworthiness also varied, from equal to that of environmentalists, to depending upon
whether they were local or far distant (with the latter more trusted) or "how much business
they did with the corporation that put this in the ground in the first place." At least one
person also distrusted media reporting. In short,
• If an independent agent or organization had looked into it, I would want to know whattheir results were. But an independent organization supposedly can be politically ormonetarily motivated, too. [Second person] Even more so sometimes.
Missing information. If anything, despite concerns about "how much information do you
think people are going to read?," focus group members felt more information was better. The
news stories were inadequate because they didn't indicate how the chemical got to that site,
who was responsible for this, what the chemical was used for, how access to the site was
being limited, the potential for handling the problem, what the EPA is going to do about it,
and so forth. A major point for several people was what was going to be done about the site
rather than its risk level (one person said "it should be cleaned up anyway"):
Explaining Uncertainty 34
• It's the job of the EPA to tell us what the risk is, and then we decide if that amount ofrisk is worth spending money to do it....if...there is a one in a zillion risk, then we wouldprobably all agree that, well, it's not enough risk to spend $2.00 on. But if it's 1 in 100,we probably would agree to do it. So the challenge is, not so much deciding what to dofrom the EPA's point of view, but to communicate it most accurately so that you canmake a good judgment.
The focus groups also produced considerable substantive information about how people
responded to uncertainty in risk estimates. Such uncertainty is indeed unfamiliar, as
postulated earlier in this report, even for relatively well-educated people. People are not
irrevocably opposed to hearing about uncertainty or believing that such uncertainty is real in
science. They are willing to take discussions of uncertainty as possible indicators of
refreshingly unusual agency honesty, and to demand that uncertainty be discussed if this is
part of the information available to agencies. However, they seem reluctant to acknowledge
that uncertainty may be unavoidable even with further study, and they suspect that
discussions of uncertainty may be evidence of incompetence or a coverup.
STUDY 4
The focus group results suggested revisions to the stories that could enhance uncertainty
effects. Because Study 2 had revealed that uncertainty did indeed discriminate responses to
some degree, a further test of such stories seemed warranted.
Participants in the focus groups had suggested that they paid little attention to
environmental news stories unless they saw direct implications for themselves. Therefore, to
increase the topic's salience for subjects, stories were modified to make them apply to
Eugene, Oregon (where subjects were recruited). Application of the hypothetical case of
butydin at a particular site (with a known population of about 100,000) also allowed for
Explaining Uncertainty 35
stating the risk level in terms of cancer cases expected, as well as in probabilities. Both
theory and focus group comments suggested this might make the uncertainties more visible
and salient.
Stories were also revised to make them provide information that focus group members
had said would be helpful. This included information on why the uncertainty existed, what
was being done to reduce it, how this affected action on the hazardous waste site, why
USEPA was providing a "preliminary" risk estimate, and that uncertainty was inevitable in
science. The explanation of the uncertainty stressed that only animal toxicity data were
available, and that the extrapolation from animals to humans created irreducible uncertainty.
This issue of animal-to-human extrapolation is the most contentious issue in toxicology for
both citizens and experts (Kraus, Malmfors, & Slovic, 1992), and its effects might vary from
those of other explanations. The questionnaire was revised to add a few questions relevant to
the additional text, and to remove some ambiguities noted in the focus groups.
Study 4 used the same hazard (butydin) and two risk levels (1:1,000; 1:1,000,000) as
used in Study 2. Two levels of uncertainty were used, also as in Study 2: none, and a "true"
risk level that could range from zero to ten times the risk estimate. Each uncertainty variant
was accompanied by a graphic, adjusted to include the expected cancer cases as well as the
probability. This manipulation (two risk levels, two levels of uncertainty) created a total of
four stories outlined in Table 6 (the full stories are included in Appendix F; Appendix G has
the Study 4 questionnaire). Paid subjects were recruited (N = 217) and tested as in the first
two studies.
Explaining Uncertainty 36

Results of Study 4 suggest that the revisions made to Study 2 stories and questionnaires
did not eliminate problems with a minority of respondents failing to "correctly" recognize the
risk numbers in simulated news stories. The first question was, "Did the story report an EPA
calculation of the risk of getting cancer from drinking water contaminated with butydin?"
This question concerns whether a risk number appears in the story, not whether the agency
or reporter gave an accurate number." Despite this clarification of the question, 9.7% of the
subjects said there was no risk number in the story. When asked if the story contained a
single risk number or a range (the same wording as in Study 2), 16.7% (17 out of 102) of
those who read a story with a range of numbers in it said there was a single number. Over
half (53.5%, 53 of 99) of those reading stories with single numbers said the story contained
a range of risk estimates.
These results appear to be due to a combination of confusion and inattention. The single-
number stories also contain a risk comparison: "the risk of getting cancer from exposure to
all possible causes of cancer is about one in four for an American." Readers of these stories
may simply have extrapolated from remembering two numbers—1:1,000 and XA—to assuming
that these comprised a range.2 The error of classifying range-stories as containing a single
alarming, and elicit more (hypothetical) intentions to shift to bottled water from the city
water supply than 1:1,000,000 stories. Those who read the 1:1,000 range story (zero to
2 Inadvertently, the graphic for Study 4 single-number stories was mistitled as "Range ofRisk Estimates for Eugene." However, it is unlikely that this error significantly affectedrespondents' misclassification errors, since the proportion saying that the single-storycontained a range of risk estimates in Study 4 was not appreciably different from that inStudy 2.
Explaining Uncertainty 37
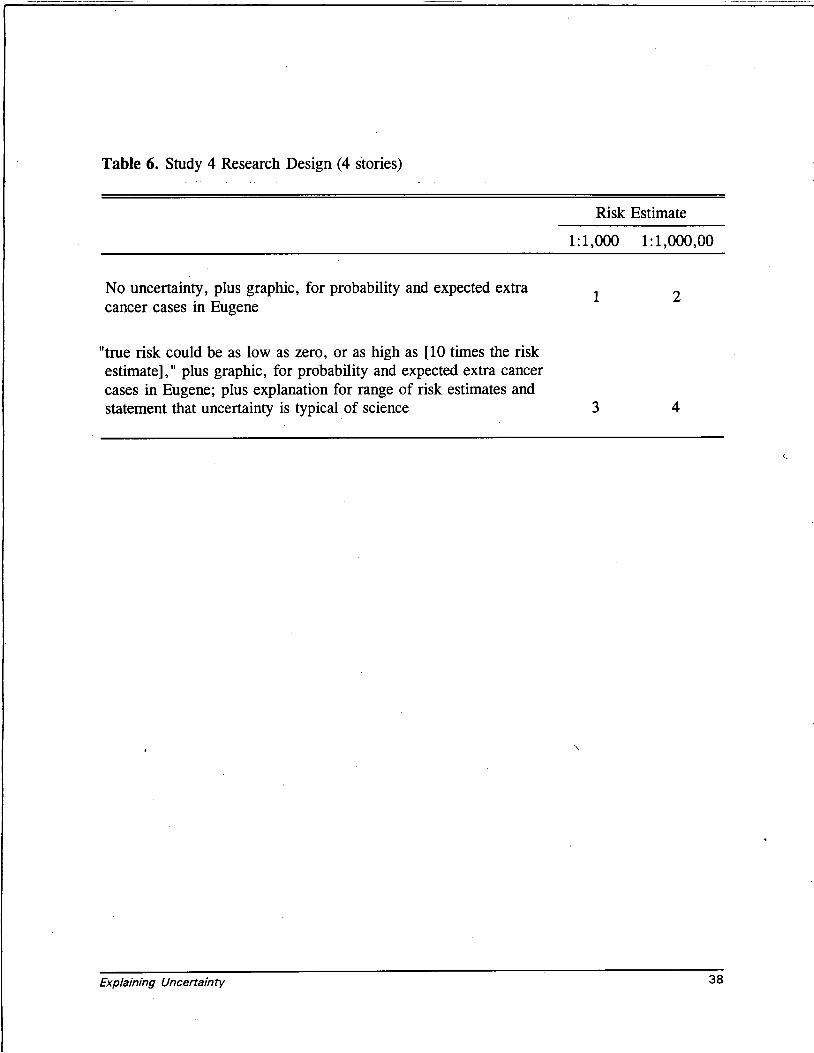
Table 6. Study 4 Research Design (4 stories)
Risk Estimate
1:1,000 1:1,000,00
No uncertainty, plus graphic, for probability and expected extracancer cases in Eugene
"true risk could be as low as zero, or as high as [10 times the riskestimate]," plus graphic, for probability and expected extra cancercases in Eugene; plus explanation for range of risk estimates andstatement that uncertainty is typical of science
Explaining Uncertainty 38

number is more likely to be due to simple inattention, since both the text and the graphic
portrayed a range. The consistency of these error rates across three studies (1, 2, 4) suggests
that, except for removal of the risk comparison, further revision of the stories and
questionnaire may not significantly reduce the error rate for well-educated respondents for
whom the issue is not immediately salient.
The uncertainty manipulation had no significant effect on responses to questions that did
not ask about certainty, such as those questions concerning the agency's honesty and
competence. Thus the changes in stories and questionnaires made as a result of Study 3
(focus groups) did not produce the hoped-for result of strengthening the uncertainty effects
seen in Study 2. Instead, the results were far closer to those of Study 1: no effects of
uncertainty.
The strongest effects in Study 4 were due to the risk magnitude manipulations. Subjects
found the 1:1,000 stories to exhibit higher risks, to be more worrying (P < .001) and
1:100) were significantly more likely than those reading the 1:1,000,000 range story (zero to
1:100,000) to say that the agency's discussion of uncertainty made them more concerned.
Interestingly, readers of the higher-risk range story rated the risks as more precisely known
to the government than did readers of the lower risk range story. These are similar to Study
2 results, suggesting that lower risk numbers are seen by citizens as either less accurate or
less honest (although there were no significant differences across risk magnitude conditions in
ratings of agency honesty or competence, for either risk estimation or overall).
The local newspaper, the Register-Guard, appeared to elicit more confidence than the
USEPA. The former received high ratings from 70.2% of subjects on its honesty in reporting
Explaining Uncertainty 39

the size of the risks from local environmental problems, and from 60.7% for competence in
reporting such risks. The agency received high ratings (3 - 4 on a 4-point scale) from almost
half of subjects on its competence in calculating risk magnitudes (48.9%), and its competence
"in dealing with environmental problems" (48.7%). A large majority (87.9%) agreed that
"Although experts are willing to make estimates of the risks from hazardous waste, no one
really knows how big the risks really are." On a seven-point scale (1 = scientifically
invalid, 7 = scientifically valid), the majority (82.9%) rated the risk information moderately
valid (ratings of 3 - 5). However, 36.4% rated the usefulness of the risk information highly
(1 or 2, 1 = useful, 7 = useless), while only 7.8% rated it useless (6 or 7). The information
in the range-stories, despite its in-depth discussion of uncertainties, extrapolation from animal
data, cancer comparisons, and so on, did not seem to strike subjects as unusual in a news
story. Thirty-nine percent rated the information as usual (1 or 2, 1 = usual, 7 = unusual),
and 10.2% as unusual (6 or 7). Equivalent numbers for the readers of single-number stories
(which, despite the graphic, were more typical in content) were 42.6% and 5.5%,
respectively.
Subjects were asked to indicate their agreement with the statement "It is typical of good
science that the most likely estimate of what is being measured has a range of uncertainty
around it." Analysis of item intercorrelations was conducted for those who read the range
stories and correctly reported the story as containing a range of agency risk numbers (Table
7). Those who agreed with this "typical science" statement were more likely to find the risk
information in the story understandable, certain, and scientifically valid. They were less
likely to think that the agency's discussion of uncertainty indicated incompetence, and less
Explaining Uncertainty 40
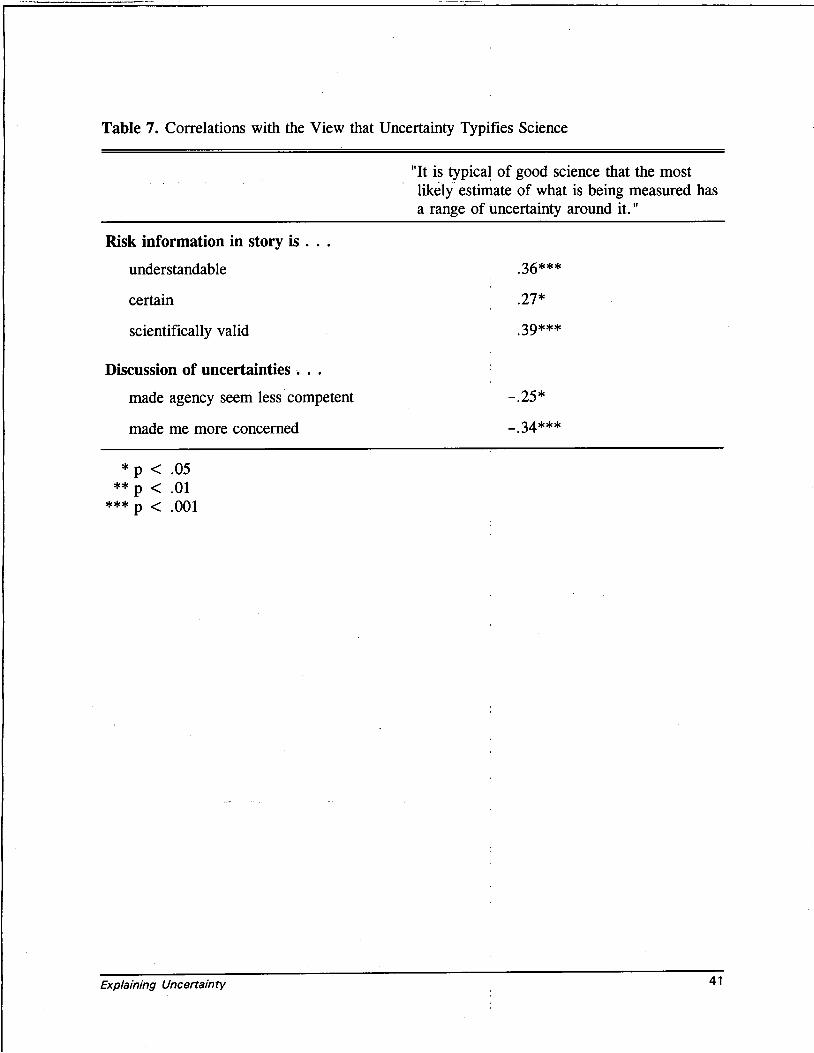
Table 7. Correlations with the View that Uncertainty Typifies Science
Risk information in story is . . .
understandable
certain
scientifically valid
Discussion of uncertainties . . .
made agency seem less competent
made me more concerned
* p < .05** p < .01
*** p < .001
Explaining Uncertainty
"It is typical of good science that the mostlikely estimate of what is being measured hasa range of uncertainty around it."
.36***
.27*
-.25*
_ 34***
41
likely to be concerned because of that discussion. They were less likely to think the risk was
high, to worry very much, to be inclined to work for the hazardous waste site's cleanup, or
to shift to bottled water.
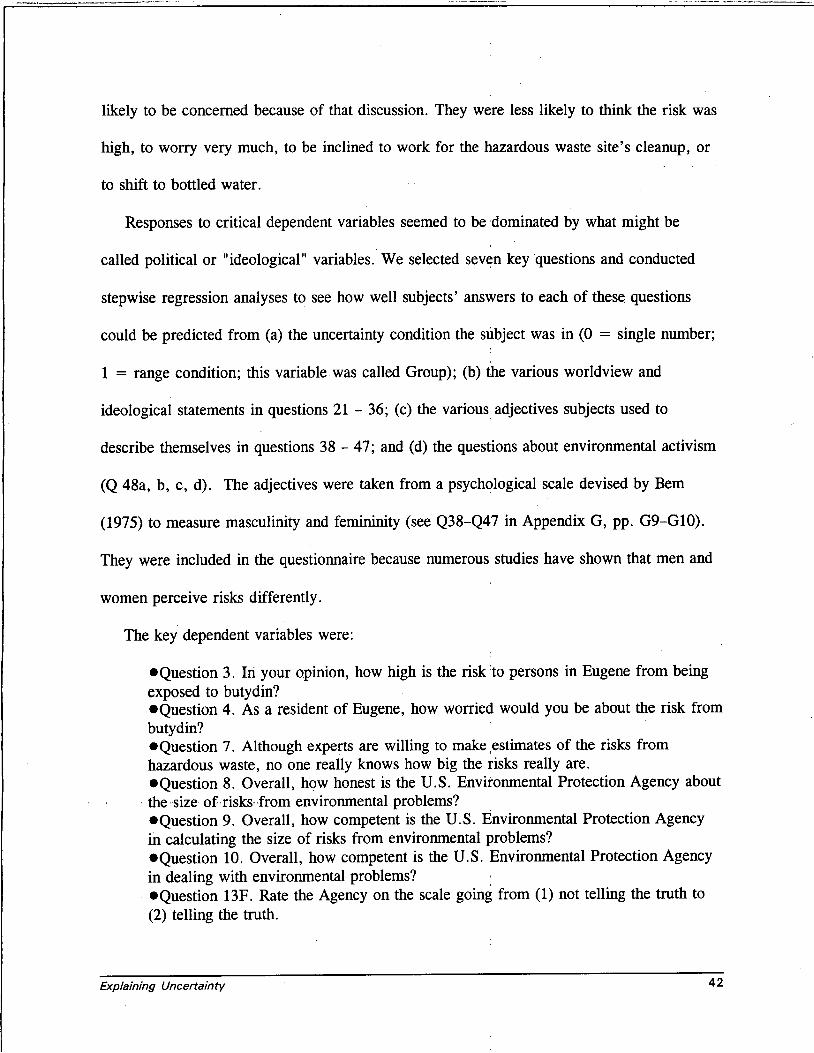
Responses to critical dependent variables seemed to be dominated by what might be
called political or "ideological" variables. We selected seven key questions and conducted
stepwise regression analyses to see how well subjects' answers to each of these questions
could be predicted from (a) the uncertainty condition the subject was in (0 = single number;
1 = range condition; this variable was called Group); (b) the various worldview and
ideological statements in questions 21 - 36; (c) the various adjectives subjects used to
describe themselves in questions 38-47; and (d) the questions about environmental activism
(Q 48a, b, c, d). The adjectives were taken from a psychological scale devised by Bern
(1975) to measure masculinity and femininity (see Q38-Q47 in Appendix G, pp. G9-G10).
They were included in the questionnaire because numerous studies have shown that men and
women perceive risks differently.
The key dependent variables were:
•Question 3. In your opinion, how high is the risk to persons in Eugene from beingexposed to butydin?•Question 4. As a resident of Eugene, how worried would you be about the risk frombutydin?•Question 7. Although experts are willing to make estimates of the risks fromhazardous waste, no one really knows how big the risks really are.•Question 8. Overall, how honest is the U.S. Environmental Protection Agency aboutthe size of risks from environmental problems?•Question 9. Overall, how competent is the U.S. Environmental Protection Agencyin calculating the size of risks from environmental problems?•Question 10. Overall, how competent is the U.S. Environmental Protection Agencyin dealing with environmental problems?•Question 13F. Rate the Agency on the scale going from (1) not telling the truth to(2) telling the truth.
Explaining Uncertainty 42

These analyses were conducted with the 135 subjects who correctly answered questions 1
and 2 about the risk estimate.
- The results are shown in Table 8: Group membership (indicating whether or not the
subject received uncertainty information) was a significant predictor of responses to only one
question (Question 3—the perceived risk to Eugene residents). For that question, those
receiving uncertainty information thought the risk was higher. Responses to the rest of these
questions were predictable from ideology, worldviews, and so on, but not from uncertainty
information. For example, Question 8, regarding the honesty of EPA in reporting the size of
environmental risks, was most predictable from Question 21, the subjects' view about the
seriousness of environmental risks where he or she lives. Other significant predictors were
Question 24 (Until the government alerts me, I don't worry), Question 32 (If there were
more equality, there would be fewer problems), and Question 41 (self-description as gentle).
Thus those most likely to judge EPA to be honest in reporting the size of environmental risks
were those who did not see risks as serious in their home community, those who trusted the
government, those who did not agree that more equality would solve social problems, and
those who described themselves as gentle. Note that group membership, representing the
uncertainty information, was not a significant predictor.
The story is similar for the other dependent variables. Group membership entered the
equations for Question 9, Question 10, and Question 13F only at relaxed levels of statistical
significance (P < .10 or P < .20). However, in these cases, the direction of the group
effect, though nonsignificant, is interesting. There was a tendency for those in the uncertainty
Explaining Uncertainty 43

Table 8. Predicting Reactions to Risk Information: Results from Stepwise Regression Analyses
Dependent Variable Significant Predictor Variables R2
Q3. Risk to Eugene Q21*** Group* .28
Q4. Worry Q21*** Q30*** Q34n*** .51
Q7. No one knows how big risks are Q26n** Q31n** .22
Q8. EPA honesty Q21n*** Q24* Q32n* Q41* .38
Q9. EPA competence in calculating risks Q21n*** Q31* Q38n** Q44** .38
Q10. EPA competence in dealing with Q21n*** Q34„ Q41** Q44* Q45n** Q48bn**problem
.63
Q13F. Agency not telling truth vs. -^ 025n+ Q27n+ q34***telling truth
.34
Group. Whether person read point or range story, coded 0 (point) or 1 (range).
Q21. Serious environmental health problems where I live
Q22. Exposure to carcinogen makes cancer more likely
Q24. Until government alerts me, I don't worry
Q25. Try hard to avoid food additives
Q26. Americans too concerned about small risks
Q27. Little control over risks to my health
Q30. Would remove slightest amount of asbestos
Q31. Close polluting industries
Q32. If people treated equally, fewer problems
Q34. Trust government to make management risks
Q38. Self-description: Independent
Q41. Self-description: Gentle
Q44. Self-description: A leader
Q45. Self-description: Strong personality
Q48b. Active in environmental group
* = p < .05** = p < .01
*** = p < .001
Note: Negative relationships are signified by the letter "n" after the predictor variable.
Explaining Uncertainty 44

condition to see EPA as less competent in Question 9 and Question 10 but more likely to be
telling the truth (Question 13F), compared to the group that did not receive uncertainty
information.- This fits with the "honest but stupid" theme that was prevalent in the focus
group discussions.
The conclusion from this analysis is strong. Judgments of risk, honesty, competence,
etc., were determined primarily by the person's ideological stance or self-described
personality traits and were very little influenced by the uncertainty information presented in
the news stories.
CONCLUSIONS
The results of the first year's study of public response to uncertainty in risk assessments
raise more questions than they answer. However, some tentative conclusions can be reached:
• Citizens are unfamiliar with uncertainty in risk assessments, and with uncertainty
in science generally. The lack of effect of the uncertainty manipulation in Study 1, and
the difficulty that about 20% of subjects in Studies 1, 2, and 4 had in recognizing
uncertainty (in the form of a range of risk estimates), support this statement. A few
comments by focus group members in Study 3, and the research literature noted earlier,
point to unfamiliarity with scientific uncertainty generally.
• Citizens may recognize uncertainty (i.e., a range of risk estimates) when it is
presented in a simple, graphic way. The move from Study l's four-category,
percentage-based presentation of uncertainty to Study 2's two-category, probability-based
presentation succeeded in producing some effects due to uncertainty. The graphics used in
Study 2 facilitated recognition of the range of estimates, although the response was
Explaining Uncertainty 45

stronger in comments by Study 3 focus group members than in statistical analyses of
Study 2 data. A caveat for this conclusion is that about 20% of subjects in Study 1 and
Study 2 were unable to categorize risk estimates correctly as either a single number or a
range. Moreover, Study 4, intended to build upon Study 2 to get even stronger
uncertainty effects, failed to show any statistically significant effects except on perceived
risk.
• Citizens' views on the environmental situations presented in the stories appeared
to be influenced far less by uncertainty than by other factors. As noted earlier, factors
like trust and ideology have been identified in the research literature as important, if not
dominant, influences on perceived risk. This view is supported by findings in Study 4
that political or "ideological" stances toward various aspects of risk were strongly
correlated with reactions to the agency's discussion of uncertainty. Comments by Study 3
focus group members about the need to clean up regardless of risk estimate magnitudes
or uncertainty reinforce this conclusion.
• Agency discussion of uncertainty in risk estimates seems to be a signal of agency
honesty. Responses in Studies 2 and 4 and comments in the focus groups confirm this
finding. This reaction appears to be due to a combination of surprise that any. unsolicited
information would be offered by a government agency, belief that all information is
desirable (and therefore data on uncertainty, however unexpected, are welcome), and
suspicion (among a few, anyway) that precise risk estimates cannot be believed.
However, the number of comments in Study 3 about potential cover-ups suggest that
many people may find announcements about uncertainty a signal of dishonesty. Past
Explaining Uncertainty 46

experience (direct or through the mass media) with agencies actually or apparently using
risk assessment to delay cleanup of polluted sites may fuel this suspicion.
• Agency discussion of uncertainty in risk estimates can be a signal of incompetence.
In Study 2, about one-third of range-story readers said the agency seemed less competent
when discussing uncertainties. This response may be related to unfamiliarity with
scientific uncertainty generally: if science is certain, uncertain risk estimates could arise
only from incompetent scientists (or an agency's ill intentions, as above). Study 3
comments about uncertainty being expected (and acceptable) only for "preliminary" risk
estimates also suggest that it is difficult for citizens to understand that competence and
uncertainty can co-exist.
RECOMMENDATIONS FOR FUTURE RESEARCH
The findings from the first year's research on communicating uncertainty in risk
assessment strongly suggest that further research is necessary before an agency can
communicate such information to the public with confidence that its effects are known and
desirable. Given the difficulty of conveying a "simple" range of numbers, and the perception
of honesty and incompetence in agency discussions of uncertainty, it would be beneficial to
both researchers and practitioners to obtain more detailed knowledge of how the public
would react to various kinds and forms of uncertainty information.
Future research should build upon the current story variations so as to determine the
incremental effect of alternative formats and variables. Choices among these myriad
possibilities depend upon what seems most critical. We suggest that an important area to
explore is that raised by the issue of trust. As noted in the earlier literature review, this
Explaining Uncertainty 47
appears to be a critical factor in lay risk perceptions, and could be implicated in the
apparently paradoxical view that agency discussion of uncertainty signals both honesty and
incompetence. One way to study this topic is to incorporate into future stories conflicting
assessments of risk uncertainties by other policy actors. How would this relationship between
honesty and competence hold up when industry or environmentalists, for example, comment
in the news stories on uncertainties? Would support from these commentators for the risk
ranges given by USEPA strengthen the links among uncertainty explanations, perceived
agency honesty, and perceived agency competence? Would conflicting uncertainty estimates
from other actors (e.g., too much or too little uncertainty in USEPA estimates) decrease
perceived USEPA honesty and competence? Would the effects be similar across different
actors? How would these comments affect perceptions of the commentators? And how
would all of these associations contrast with the same relationships for a news story that does
not mention uncertainty at all? Because such commentary by outsiders on institutional risk
assessments is very common in environmental matters, a test of these effects could be
valuable to agencies, corporations, and researchers, who urge risk communicators to take
into account the expected concerns of their audiences. Other ways to examine the relation of
uncertainty and trust could also be used, e.g., including local officials' or citizens' comments
on USEPA's trustworthiness although these would not be direct comments on the accuracy of
either risk estimates or their uncertainty.
It also should be kept in mind that the first year's research did not focus much on the
effects of different forms of uncertainty. Study 4, by discussing the role of extrapolation
from animal data in the production of a risk range, specified that the study concerned
Explaining Uncertainty 48

uncertainty about the scientific model, excluding the issue of variability. The previous studies
did not specify which type was involved. Yet distinctions between forms of uncertainty may
be an important one for public response to ranges of risk estimates.3 If people hear that the
range springs from scientific uncertainty, such as a poor model or limited data, they may see
this as a range that can be reduced with better information, but also one produced by
incompetent scientists and officials. If they are told that the range springs from variability in
the population, for example not everyone will have the same reaction to butydin, the range
may seem more intractable, but also as something that is "natural" rather than the fault of
humans. The choice to not specify the source of the uncertainties in the news stories was
valid given the exploratory nature of the research. However, future research might benefit
from comparing public response to the two sources of uncertainty.
Comparison of the risk estimate, both point and range,
instructive. For example, if the best estimate is below a standard or action level, but the
range straddles the standard, are people more concerned? What if the best estimate is just
above the standard, with the range straddling it? An earlier study found varied perceptions
of risk around an action level or standard for asbestos and radon. People saw a measurement
just above the standard as a disproportionately more serious risk than one just below iti
(Weinstein, Sandman, & Roberts, 1989). If this is generally true, adding uncertainty to the
case might either exacerbate or offset these discrepancies in public reaction. Since standards
to an action level might also be
or action levels are common in environmental management (e.g., soil cleanup levels;
3The importance of this distinction was suggested by Dr. Alan Stern, Division of Scienceand Research, New Jersey Department of Environmental Protection and Energy.
Explaining Uncertainty 49

emissions standards), agencies and risk communication researchers might benefit from
examining the interaction of such standards with uncertainty.
Obviously, there are many other elements of the stories that could be varied; for
example, all of the studies used a single hazard and endpoint—that of cancer from a chemical
in an abandoned hazardous waste (Superfund) site—and this endpoint could be used again in
future research, given the ubiquity of such environmental cases and concern about cancer.
However, using other hazards and health (or non-health) endpoints is certainly possible.
Study 4 included a paragraph explaining uncertainty as being due to extrapolating from
animal to human data. Without comparing these data to those from a test of other causes of
uncertainty (e.g., modeling dose-response relations with high-dose data only), we can say
only that the similarity of results in Study 1 and Study 4 suggests that the reactions in Study
4 seem to be due more to uncertainty in general than to this particular explanation of the
causes of uncertainty. Examining how alternative communication channels (e.g., verbal vs.
graphic vs. written; news story vs. USEPA fact sheet) affect receipt of uncertainty is also a
potentially valuable study.
The possible future research topics proposed or mentioned above are predicated on the
assumption that risk communication practitioners do not urgently need detailed advice on
how to communicate uncertainty in risk assessment. The slow and careful testing of one
variation's effects against those of other variations would be sufficient, even though a very
simple definition of uncertainty (i.e., a range of risk estimates) is used in such research.
However, agencies' policy environments may force them into situations where they need
immediate information on communicating complex versions of uncertainty. This would
Explaining Uncertainty 50

suggest future research include such options as a simulation of the risk assessment
(characterization) descriptions mandated in H.R. 2910, the proposed Risk Communication
Act of 1993. If enacted, this bill would require that USEPA characterize risks in great detail
(Table 9). Although also aimed at communicating more information to risk managers and
interested parties, the bill's specified purposes include "public education" and requiring
"explanation of significant choices in the risk assessment process which will allow for
better...public understanding...." It is arguable that these rules, if faithfully followed by
USEPA, would lead to less, rather than more, public understanding. If public policy
regarding risk assessment is going to be designed for purposes of public education, it
behooves policy-makers to be guided by research on whether such requirements actually
achieve their aims. USEPA might therefore benefit from funding an experimental test on lay
subjects, albeit one using a much simpler description of the items in Table 9 than a real
USEPA risk characterization would contain.
Whatever the substantive directions taken by future research, some methodological
changes should be considered as well. For example, several readers of stories with a single
risk estimate erroneously stated that these stories contained a range of estimates. As noted
earlier, people who were not reading the point-estimate stories carefully might havei
remembered that there were two numbers in the story (the estimate and the risk comparison
on chances of getting cancer overall), and inferred that these constituted a range. This
possibility could be assessed by comparing point-estimate story responses between stories
with and without such comparisons. Alternatively, a debriefing of people answering current
stories (e.g., Study 2) can allow those who "incorrectly" answer Questions 1 and 2 (about
Explaining Uncertainty 51

Table 9. H.R. 2910's Risk Characterization Requirements
• Negative and positive laboratory or epidemiological data, including possiblereconciliation of conflicting information
Where significant assumption, inference or model invo
- list plausible alternatives- explain basis for choice- identify policy or value judgments- indicate how empirical data validate or conflict with each model
ved,
Best estimate(s) for populations at risk, with reasonable range of scientific uncertainty
• Best estimate of risk; may also present plausible upper-may substitute for single best estimate multiple estimates
assumptions, inferences, or models
Explain range of exposure scenarios used
- where feasible, state size of corresponding population at risk and likelihood of suchscenarios
Appropriate comparisons with other risks, including risks familiar to general public
(For regulatory actions) known and significant substitution risks
(After public comment) summarize alternative risk assessments provided by commenters
Explaining Uncertainty
and lower-bound estimates
based on equally plausible
52

whether there was a risk number given in the story, and whether it was a point or range) to
explain why they answered as they did. In a non-judgmental debriefing, this and other
explanations for "wrong" answers may be offered by subjects, allowing for broader
correction of flaws in story design.
If the lack of salience of risk information is due to this
larger story, no matter how short that story might be, an a
information twice. After reading the story, the subject might be engaged by research staff in
an interactive process that "pulls" specific risk data from the article, highlights them
separately, and then asks for subject response. Although a imuch more artificial situation than
reading news stories (even simulated news stories) in an experimental context, this approach
could at least make subjects more aware of the data, and thus better able to produce
responses to it. Subsequent research could then test the generalizability of these responses.
Although this discussion of future research options has presented them as mutually
exclusive alternatives, we propose that USEPA support follow-up research on both the
incremental and complex (Risk Communication Act) risk characterization routes. The latter
test would take considerable time to construct, thereby restricting the number of incremental
variations that could be tested in a second year of research. However, one or two of the
latter (e.g., outside comments on the uncertainty range; tru^ uncertainty vs. variability) could
probably be done over that period, in addition to testing the effects of the Risk
Communication Act. At least one of the methodological issues might be tested as well. The
exact combination of second-year research topics would depend in part on USEPA's agenda
for communicating uncertainties in risk assessment.
Explaining Uncertainty
information being embedded in a
tentative is to present the
53

APPLICATIONS TO RISK-COMMUNICATION PRACTICE
Communicating about uncertainty needs to be done, because uncertainty is a reality of
risk assessment. However, in light of the results from the studies described above, USEPA
might consider downplaying public or internal comments (e.g., in staff training) espousing
the belief that explaining uncertainties bolsters public confidence or knowledge. Although this
may turn out to be true under certain conditions, the present results do not support such
conclusions about the effect of communicating uncertainty information.
Explaining Uncertainty 54

BIBLIOGRAPHY
American Industrial Health Council. (1992, September). Improving risk characterization.Washington, DC: Author.
Baum, A., Fleming, R., & Davidson, L. M. (1983). Natural hazards and technologicalcatastrophe. Environment and Behavior, 15, 333-354.
Bern, S. L. (1975). Sex role adaptability: One consequence of psychological androgyny.Journal of Personality and Social Psychology, 31, 634-643.
Bord, R. J., & O'Connor, R. E. (1992). Determinants of risk perceptions of a hazardouswaste site. Risk Analysis, 12, 411-416.
Bord, R. J., O'Connor, R. E., & Epp, D. J. (1992). Communicating cumulative long termrisks (Report to U.S. Environmental Protection Agency CR816305). University Park:Pennsylvania State University.
Habicht, F. H. (1992). Guidance on risk characterization for risk managers and riskassessors. Washington, DC: Office of the Administrator, U.S. Environmental ProtectionAgency.
Hance, B. J., Chess, C, & Sandman, P. M. (1988). Improving dialogue with communities:A risk communication manual for government. Trenton: New Jersey Department ofEnvironmental Protection.
Johnson, B. B., Sandman, P. M., & Miller, P. (1992). Testing the role of technicalinformation in public risk perception. RISK: Issues in Health & Safety, 3, 341-364.
Kahneman, D., Slovic, P., & Tversky, A. (Eds.). (1982). Judgment under uncertainty:Heuristics and biases. New York: Cambridge.
Kraus, N., Malmfors, T., & Slovic, P. (1992). Intuitive toxicology: Expert and layjudgments of chemical risks. Risk Analysis, 12, 215-232.
Miller, J. D. (1993). The public understanding of environmental science concepts in theUnited States .Boston: American Association for the Advancement of Science.
Risk and the Environment. (1993). New York: Carnegie Commission on Science,Technology, and Government.
Sandman, P. M., Miller, P., Johnson, B. B., & Weinstein, N. (1993). Agencycommunication, community outrage, and perception of risk. Risk Analysis, 13, 589-602.
Explaining Uncertainty 55

Slovic, P. (1993b). Perceived risk, trust, and democracy: A systems perspective. RiskAnalysis, 13, 675-682.
Slovic, P., Fischhoff, B., & Lichtenstein, S. (1982). Response mode, framing, andinformation-processing effects in risk assessment. In R. Hogarth (Ed.), New directions formethodology of social and behavioral science: Questionframing and responseconsistency (pp. 21-36). San Francisco: Jossey-Bass.
Weinstein, N. D. (1987). Public perception of environmental hazards: Statewidepoll ofenvironmental perceptions (Final Report to the New Jersey Department of EnvironmentalProtection). New Brunswick, NJ: Rutgers University.
Weinstein, N. D., Sandman, P. M., & Roberts, N. E. (1989). Communicating effectivelyabout risk magnitudes (Final Report to the U.S. Environmental Protection Agency, CR-814506-01-0). New Brunswick, NJ: Rutgers University.
Explaining Uncertainty 56