explaining the diffusion of web- based communication
TRANSCRIPT

Explaining the Diffusion of Web-Based Communication Technology
among Congressional Offices: A NaturalExperiment using State Delegations
The Harvard community has made thisarticle openly available. Please share howthis access benefits you. Your story matters
Citation Esterling, Kevin, David Lazer, and Michael Neblo. 2009. Explainingthe Diffusion of Web-Based Communication Technology AmongCongressional Offices: A Natural Experiment Using StateDelegations. HKS Faculty Research Working Paper SeriesRWP09-029, John F. Kennedy School of Government, HarvardUniversity.
Published Version http://web.hks.harvard.edu/publications/workingpapers/citation.aspx?PubId=6777
Citable link http://nrs.harvard.edu/urn-3:HUL.InstRepos:4481606
Terms of Use This article was downloaded from Harvard University’s DASHrepository, and is made available under the terms and conditionsapplicable to Other Posted Material, as set forth at http://nrs.harvard.edu/urn-3:HUL.InstRepos:dash.current.terms-of-use#LAA

Explaining the Diffusion of Web-Based Communication Technology among
Congressional Offices: A Natural Experiment using State Delegations
Kevin M. Esterling University of California, Riverside
David Lazer Northeastern University
John F. Kennedy School of Government – Harvard University
Michael A. Neblo Ohio State University
Faculty Research Working Papers Series
September 2009 RWP09-029
The views expressed in the HKS Faculty Research Working Paper Series are those of the author(s) and do not necessarily reflect those of the John F. Kennedy School of Government or of Harvard University. Faculty Research Working Papers have not undergone formal review and approval. Such papers are included in this series to elicit feedback and to encourage debate on important public policy challenges. Copyright belongs to the author(s). Papers may be downloaded for personal use only.

Explaining the Diffusion of Web-Based CommunicationTechnology among Congressional Offices: A Natural
Experiment using State Delegations1
Kevin M. Esterling(Corresponding Author)
Associate ProfessorDepartment of Political Science
David M.J. LazerAssociate Professor of Political Science
and Computer ScienceNortheastern University
Michael A. NebloAssistant Professor
Department of Political ScienceOhio State University
August 25, 2009
1Prepared for presentation at the Annual Meetings of the American Political Science Associa-tion, Toronto, Canada, September 2-5, 2009. This project is funded by a grant from the DigitalGovernment Program of the NSF (award number IIS-0429452). We gratefully acknowledge the in-tellectual contributions from our colleagues at the Congressional Management Foundation (CMF),especially Collin Burden, Nicole Folk-Cooper, Kathy Goldschmidt, and Tim Hysom. Any opinions,findings, and conclusions or recommendations expressed in this material are those of the authorsand do not necessarily reflect the views of the National Science Foundation or CMF.

Abstract
Do legislators learn to use new communication technologies from each other? Using datafrom the official homepages of members of the U.S. House of Representatives, we test whetherweb-based communication technology diffuses through congressional state delegations. Weuse a natural experimental design that exploits ignorable state boundaries to distinguishbetween causal diffusion processes and spatial heterogeneity. Using nonlinear conditionalautoregressive models for the statistical test, we find that web communication technologypractices are weakly driven by communication within state delegations, and with the effectslightly more pronounced among Democrats than among Republicans.

1 Introduction
The practice of representation is central to any legislator’s responsibilities, both normatively
(Pitkin, 1967) and empirically (Fenno, 1978). The relatively recent development of Internet-
based communication technologies has the potential to transform the way legislators engage
in these practices (Druckman, Hennessy, Kifer, and Parkin, 2009; Druckman, Kifer, and
Parkin, 2007). As with technological innovation in any occupational field, legislators must
learn how to adopt and implement these new communication technologies. In this paper,
we examine whether this learning occurs among members of the U.S. House of Representa-
tives, focusing on the extent of diffusion of web-based communication technologies among
representatives’ official homepages. It is well known within the literature on Congress that
members often discuss legislative issues and procedures with other members from their state
delegation (Truman, 1956). We therefore expect that a member will be more (less) likely to
adopt new website communication practices if other members of her state delegation have
(have not) adopted the practices.
A vast array of studies in other organizational settings highlights the critical role that
informal networks play in the adoption of innovations (Rogers, 1976). Further, there is a
substantial literature on the important role networks play within the Washington system
more generally (Carpenter, Esterling, and Lazer, 1998, 2003, 2004; Heinz, Laumann, Nelson,
and Salisbury, 1993; Laumann and Knoke, 1984) as well as some research on interconnec-
tions among state legislators. There has been little research on the informal mechanisms of
the diffusion of technical innovations in the congressional system, however – a system that
includes not just 435 members of the House of Representatives and 100 Senators, but many
thousands of staff members as well. More generally, there is very little research on the infor-
mal network of the members of the congressional system and the impact of that network on
the decisions of Congressional offices (for exceptions, see Baughman, 2006; Fowler, 2006).
We hypothesize that attention to website communication technology will diffuse through
informal communication networks defined by membership in state delegations, that is, among

Esterling, Lazer & Neblo, Website Diffusion in State Delegations 2
members that happen to share a geographic physical proximity. A major inferential issue
in testing the effects of spatial diffusion, or diffusion among physically proximate units, is
to distinguish a diffusion process from a process driven simply by unmeasured confounding
variables that are spatially correlated with the communication network (see Lazer, 2001). As
we describe below, we are able to take advantage of a quasi-experiment to identify the causal
effect of diffusion, exploiting the ignorable1 state boundaries that define the state delegation
communication network. Using data on the technology adoptions of neighboring congres-
sional districts, some of which are across state lines, we are able to control for unobserved
spatially-distributed heterogeneity, and so we can identify the causal effect of membership
in a state delegation on technology adoption. Our results suggest that the state delegation
informal networks play a perceptible, but not major, role in the diffusion of website commu-
nication technologies among congressional offices, and that this diffusion is somewhat greater
among Democrats than among Republicans.
This paper is divided into four sections. The first section reviews the literature on the
role social networks play in diffusion of innovations, focusing on what we know about the
informal networks within legislatures. The second section summarizes the research design
and data we will be examining, and the third presents our statistical analyses. The final
sections discuss our results and implications for future directions in this vein of research.
2 State Delegations and the Diffusion of Website Com-
munication Technology
The role of social networks is probably the single most studied driver of the diffusion of
innovations (Coleman, Katz, and et al, 1957; Hagerstrand, 1967; Ryan and Gross, 1943).
Learning through observing others’ experiences lowers the ambiguity and perceived risk as-
sociated with an innovation (Galaskiewicz and Burt, 1991; Haunschild and Milner, 1997;
Valente, 1995). Further, the behaviors of others creates a normative environment. A be-
1Ignorability in this context requires that the distribution of unobserved variables are not affected bywhere the state boundary line is drawn. We test for this ignorability below.

Esterling, Lazer & Neblo, Website Diffusion in State Delegations 3
havior is legitimate because others who are similarly situated are doing it, inducing mimetic
isomorphism (DiMaggio and Powell, 1983).
Social network research has found that strong or “high bandwidth” relationships – those
based on personal familiarity, trust, and high frequency – are especially important for the
exchange of complex, tacit, or confidential knowledge (Hansen, 1999). A number of stud-
ies in the social networks literature show, for example, that physical co-location increases
job related communication in work groups, because proximity tends to drive and facilitate
regularized communication (den Bulte and Moenaert, 1998). Co-location or spatial prox-
imity itself will not lead to an increased communication- they are just prerequisites for
higher exposure, more frequent informal occasions where people meet in the hallways or
other social areas within office buildings. These meetings in turn increase the probability
of informal communication regarding successful technology practices (Allen, 1978; Festinger,
1950; Kraut, Egido, and et al, 1990; Monge, Rothman, and et al, 1985; Rice and Aydin,
1991; Zahn, 1991). Walker’s (1969) classic study of the diffusion of innovations among the
American states shows that diffusion tends to occur more regularly among adjacent states,
which he took to proxy for more regular communication among state-level policy activists
(see also Mintrom, 1997).
In the present case, the adoption of Web-based communication technologies is largely
public; all Member web sites are public. The logic and experience underlying particular
decisions is private, however, and this private information is unevenly distributed. The
role of informal advice networks (who asks whom for advice regarding their web sites) and
attention networks (who pays attention to whom) are likely fairly powerful with respect to
Members of Congress. Thus, for example, it might require repeated interactions and high
levels of familiarity between two chiefs of staff from Members’ offices to effectively transfer the
knowledge about implementation challenges with respect to particular web-based practices.
The tendency of members from the same state to meet and discuss policy and process
legislative issues is well known in the literature on Congress (Truman, 1956). At the state

Esterling, Lazer & Neblo, Website Diffusion in State Delegations 4
level, Caldeira and Patterson (1987) find similar patterns of friendship among Iowa state leg-
islators with districts closer together. Arnold, Dean, and Al (2000) purport2 to demonstrate
that friendship ties among Ohio state legislators causes members to more often vote on the
same side of issues, holding other causes of members’ vote similarity constant. As we men-
tion above, there has been very little research on the potential influence of social networks
within the US Congress because of the practical challenges in collecting social network data
from congressional offices.3 In this paper, we test whether diffusion of website technologies
occurs through state delegations.
3 Distinguishing Spatial Heterogeneity from Diffusion
using a Natural Experiment
The major inferential issue in testing hypotheses about diffusion among geographically-
proximate units involves distinguishing a diffusion process from mere spatial heterogeneity,
where omitted confounding variables exist that are correlated with spatial network patterns
(Congdon 2003, 274; Lazer 2001). If the websites of the members of a state delegation are
all likely to have a given characteristic, and websites in another state are unlikely to, we
wish to be able to test whether this correlation is due to a causal diffusion process, or due
to a spurious dependence where many members of a state delegation may happen to share
an unobserved causal variable. If the latter is true, we would only observe heterogeneity
between state delegations, and this is only observationally equivalent to a diffusion process.
To address this, we make use of the ignorable state boundaries that define state delegations
in a quasi-experimental design intended to distinguish heterogeneity from causal diffusion.
Using conditional autoregressive (CAR) models (Congdon, 2003, 278-282), we are able to
control for spatial heterogeneity by exploiting data from other members whose congressional
2Unfortunately their results are questionable because their OLS analysis is vulnerable to the criticismsof spuriousness that we describe below. In short, the non-random assignment of nodes to network locationsraises inferential problems that are very common in studies of social network analysis.
3Notable exceptions include Baughman (2006), who shows how informal staff communication among mem-bers who have overlapping committee assignments reduces the transaction costs for writing and negotiatinglegislation, and Fowler (2006), who examines co-sponsorship networks.

Esterling, Lazer & Neblo, Website Diffusion in State Delegations 5
districts are adjacent to each other. If spatially confounding variables exist, they would
most likely be evident in these localized networks, since adjacent congressional districts share
more similarities than districts in opposite ends of the state. For example, the California
45th district (including the desert cities of Palm Springs and Indio) shares more similarities
with the Arizona 7th district (parts of Yuma, Maricopa and Pima desert counties) than
with the California 6th district (wine country, Marin and Sonoma counties). Assuming
relevant spatially distributed variables are not conditioned by state boundaries, evidence is
lent in support of spatial diffusion as opposed to mere heterogeneity if, controlling for spatial
heterogeneity among adjacent districts, members’ web communication practices are causally
dependent within networks defined by state delegation.
One can see the logic of this natural experimental design in figure 1. This figure takes
congressional district D = {6} as the “subject” district (the estimator of course repeats the
analysis for all 438 districts in the dataset). D is in state X, and is directly adjacent to
seven other districts: O = {3, 4, 5, 7} also in state X, and C = {11, 13, 14} that are in states
Y and Z; A = {O ∪ C} is the full set of adjacent districts. The state delegation for state
X is composed of districts S = {1, 2, . . . , 9}, and in this delegation, only T = {1, 2, 89} are
not adjacent to D. The experimental design assumes that the adjacent districts A have the
most similar values on unobserved variables to D. The set C ⊂ A serves as a true control
group, analogous to a “pretreatment” condition, since these districts are not in S. The set
T = S/O is the exposure to the treatment, analogous to a “post treatment” condition. The
set O = {A ∩ S} are only partial controls since in this region the treatment condition (being
in the set S) and the control condition (being in set A) overlap.
The statistical estimator uses the outcome data from the districts in A to create an
experimental “pretreatment” baseline, and holding this baseline constant, estimates the
post treatment effect of being in set S. So for example, consider the effect of being in
delegation S on whether or not a member chooses to have a blog on her official webpage.
The model dynamically estimates 1) p(A) equal to the average propensity of the districts

Esterling, Lazer & Neblo, Website Diffusion in State Delegations 6
1
2
3
4
5
6
7
8 9
10 11 12
13
14
15
The Logic of the Natural Experiment
District to be analyzed, {6}Treatment districts, {1,2,8,9}Control districts, {11,13,14}Treatment and Control Overlap, {3,4,5,7}Not Used
State X
State Y
Sta
te Z
Figure 1: The Logic of the Natural Experiment
in A to have a blog on their web pages, 2) p(S) equal to the average propensity of the
districts in S to have a blog on their web pages, and 3) holding p(A) constant, the model
estimates the effect of p(S) on the propensity for D to have a blog on her website.4 One
can think of this design as similar to a random effect model that identifies a pretreatment
condition, where the adjacent districts in C serve as “repeated observations” for district D
in the pretreatment control condition, and the districts in T represent the exposure in the
4As we describe below, p(A) and p(S) are the posterior distribution of these propensities, and so themodel accounts for the full distributions of each, not simply their point estimates.
Esterling, Lazer & Neblo, Website Diffusion in State Delegations 7
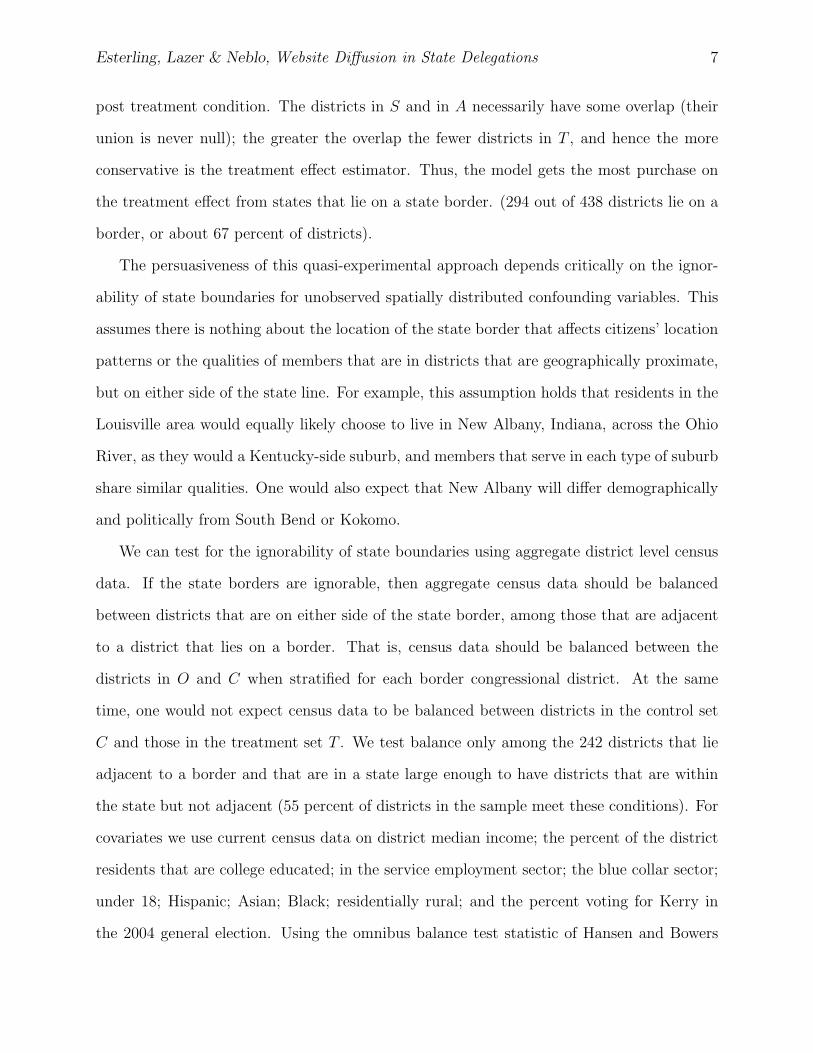
post treatment condition. The districts in S and in A necessarily have some overlap (their
union is never null); the greater the overlap the fewer districts in T , and hence the more
conservative is the treatment effect estimator. Thus, the model gets the most purchase on
the treatment effect from states that lie on a state border. (294 out of 438 districts lie on a
border, or about 67 percent of districts).
The persuasiveness of this quasi-experimental approach depends critically on the ignor-
ability of state boundaries for unobserved spatially distributed confounding variables. This
assumes there is nothing about the location of the state border that affects citizens’ location
patterns or the qualities of members that are in districts that are geographically proximate,
but on either side of the state line. For example, this assumption holds that residents in the
Louisville area would equally likely choose to live in New Albany, Indiana, across the Ohio
River, as they would a Kentucky-side suburb, and members that serve in each type of suburb
share similar qualities. One would also expect that New Albany will differ demographically
and politically from South Bend or Kokomo.
We can test for the ignorability of state boundaries using aggregate district level census
data. If the state borders are ignorable, then aggregate census data should be balanced
between districts that are on either side of the state border, among those that are adjacent
to a district that lies on a border. That is, census data should be balanced between the
districts in O and C when stratified for each border congressional district. At the same
time, one would not expect census data to be balanced between districts in the control set
C and those in the treatment set T . We test balance only among the 242 districts that lie
adjacent to a border and that are in a state large enough to have districts that are within
the state but not adjacent (55 percent of districts in the sample meet these conditions). For
covariates we use current census data on district median income; the percent of the district
residents that are college educated; in the service employment sector; the blue collar sector;
under 18; Hispanic; Asian; Black; residentially rural; and the percent voting for Kerry in
the 2004 general election. Using the omnibus balance test statistic of Hansen and Bowers

Esterling, Lazer & Neblo, Website Diffusion in State Delegations 8
(Hansen and Bowers, 2008), we cannot reject the hypothesis of balance between O and
C (p = 0.881), but we can reject the hypothesis of balance between C and T (p = 0.056).
While this exogeneity is true for these observed variables, the assumption still may be
violated in several ways. For example, it is possible that state level education, tax or other
social policies can affect citizens’ location decisions and these can affect relevant variables
not measured in the census. Or it is possible that the recruitment patterns of members differ
across states, for example if the parties have different organizational structures across states.
Note that a failure to rule out spatial heterogeneity does not disprove the diffusion hy-
pothesis; if correlations are evident within both the district-adjacencies network and the
state delegation network, this simply leaves the two processes, heterogeneity and diffusion,
as observationally equivalent. An observed correlation within the district adjacency network
but not within the state delegation network would lend evidence in favor of heterogeneity.
Finally, no observed correlations within either network would simply suggest that website
practices are independent within both networks (but not necessarily within conceivable,
unmeasured networks).
4 Data
Within the U.S. House of Representatives, congressional offices are 440 (including nonvot-
ing delegates) small, functionally identical, public organizations with a set of policy and
procedural outputs (Hedlund, 1984; Salisbury and Shepsle, 1981). This enables a large N
statistical study of innovation adoption. Below we discuss the innovations that we are study-
ing – website communication technologies – as well as control variables that we have shown
elsewhere (Esterling, Lazer, and Neblo, 2005) are important drivers of website quality, and
how we created the district adjacency and state delegation matrices.

Esterling, Lazer & Neblo, Website Diffusion in State Delegations 9
Table 1: Descriptive Statistics
Scale Mean SDBlog 0-1 0.05 0.22Podcast 0-1 0.04 0.20Text Only 0-1 0.07 0.25Audio 0-1 0.16 0.37Video 0-1 0.36 0.48RSS Feed 0-1 0.10 0.29Look & Feel 1-5 3.26 1.01Navigation 1-5 3.50 0.88Readability 1-5 3.20 0.83Organization 1-5 3.43 0.82Timeliness 1-5 3.14 0.91
N = 438
4.1 Outcome variables
The dependent variables we use for this analysis are drawn from the 2006 Congressional
Management Foundation (CMF) coding of the official web site for each member of Congress.5
The coding for these variables, and the instructions given to the coders, are listed in appendix
table 2. The descriptive statistics for the dependent variables are listed in table 1.
The first six items measure the presence or absence of a number of technological features
of websites that enhance communication. These are the presence of a Blog, Podcasting
capability, the ability to read the page in Text only, the presence of Audio and Video, and
support for RSS feed. Note that none of these items are especially prevalent on congressional
websites in 2006. For example, only five percent of members had a blog, and only 10 percent
had support for RSS feed. The final five items measure general technical properties of the
website design, and are all rated on a one to five scale. These include the Look & feel of
5In the summer of 2006, CMF coded each official website based on nearly 100 operational criteria. Theseitems tap into what makes for a good House website in the normative sense - i.e., whether the websiteboth communicates information constituents want to see on websites, and information the member wantsconstituents to know. The criteria were identified using a number of sources: asking focus groups of citizensto spend time on a sample of sites, interviews and surveys with office staff and citizens, as well as Webindustry research. For more detail on the coding dimensions, intercoder reliability, and other technical issues,see the 2006 “gold mouse” award report, http://www.cmfweb.org/index.php?option=com_content&task=view&id=198&Itemid=60.

Esterling, Lazer & Neblo, Website Diffusion in State Delegations 10
Tab
le2:
Item
Codin
gR
ule
s
Item
Sca
leC
odin
gR
ule
Blo
g0-
1T
he
site
incl
udes
ablo
g(c
ounts
even
ifit
’snot
are
alblo
gth
atac
cepts
com
men
ts)
Podca
st0-
1T
he
site
incl
udes
ap
odca
st(a
udio
up
dat
esau
tom
atic
ally
sent
tosu
bsc
rib
ers)
Tex
tO
nly
0-1
The
site
allo
ws
opti
onfo
ra
text-
only
scre
enfo
rfa
ster
dow
nlo
adin
g
Audio
0-1
The
site
pro
vid
esau
dio
clip
s(w
elco
me
mes
sage
sdo
not
count
–th
ink
subst
ance
(floor
spee
ches
,co
mm
itte
ehea
rings
,et
c.)
Vid
eo0-
1T
he
site
pro
vid
esvid
eocl
ips
(wel
com
em
essa
ges
do
not
count
–th
ink
subst
ance
(floor
spee
ches
,co
mm
itte
ehea
rings
,et
c.)
RSS
Fee
d0-
1T
he
site
incl
udes
anR
SS
feed
(som
etim
eshar
dto
tell
–w
hen
indou
bt,
don
’tin
clude
it)
Look
&F
eel
1-5
What
impre
ssio
ndoes
the
look
and
feel
/des
ign
leav
e?1=
The
look
and
feel
look
slike
circ
a19
96w
ith
lots
ofsc
rollin
g,ugl
yco
lors
,an
dcl
unky
nav
igat
ion;
2=T
he
look
and
feel
isto
ocl
utt
ered
,to
osp
arse
,an
dge
ner
ally
unin
vit
ing;
3=T
he
look
and
feel
isO
K,
not
too
unin
vit
-in
g,but
not
exac
tly
invit
ing,
eith
er;
4=T
he
look
and
feel
isin
vit
ing
and
pro
fess
ional
;5=
The
look
and
feel
isin
keep
ing
wit
hw
hat
you
exp
ect
from
the
bet
ter
com
mer
cial
Web
site
s
Con
tinued
onnex
tpag
e

Esterling, Lazer & Neblo, Website Diffusion in State Delegations 11
Table
2–
conti
nued
from
pre
vio
us
page
Item
Sca
leC
odin
gR
ule
Nav
igat
ion
1-5
How
easy
isit
tom
ove
abou
tth
esi
te?
Nav
igat
ion
isab
out
mov
emen
tth
rough
the
site
,an
dit
incl
udes
link
text
but
not
info
rmat
ion
loca
tion
.T
his
isab
out
the
men
us
and
links.
Org
aniz
atio
nis
abou
tw
het
her
ornot
info
rmat
ion
isw
her
eyo
uw
ould
exp
ect
itto
be.
1=nav
-ig
atio
nis
dep
enden
ton
bac
kbutt
onan
dhom
epag
e(n
onav
igat
ion
bar
);2=
nav
igat
ion
links
are
confu
sing
(lan
guag
edoes
n’t
mak
eit
clea
rw
hat
you’ll
find),
nav
igat
ion
opti
ons
are
soab
undan
tth
atit
’shar
dto
find
what
you’r
elo
okin
gfo
r,nav
igat
ion
chan
ges
onev
ery
pag
ean
d/o
rso
me
ofth
em
ain
nav
igat
ion
links
gooff
site
orto
file
s;3=
nav
igat
ion
may
be
clutt
ered
,but
it’s
clea
rw
hat
you’ll
be
gett
ing
atth
eot
her
end;
4=it
isea
syto
nav
igat
eth
rough
site
and
easy
tounder
stan
dw
hat
you’ll
get
when
you
clic
kon
alink;
5=nav
igat
ion
iscl
ear
and
easy
,an
dth
esi
tepro
vid
esad
dit
ional
nav
igat
ion
feat
ure
son
mos
tpag
es(s
uch
aslinks
wit
hin
text
(e.g
.links
tobillte
xt
are
incl
uded
onis
sue
pag
es)
orse
ctio
nor
pag
e-sp
ecifi
cnav
igat
ion
tool
sth
atm
ake
nav
igat
ion
easi
er(e
.g.
bre
adcr
um
bs
orlinks
toad
dit
ional
rela
ted
info
rmat
ion))
.
Rea
dab
ilit
y1-
5H
owea
syis
itto
read
the
conte
nt
ofth
esi
te?
This
isnot
abou
tco
nte
nt,
but
abou
tw
het
her
it’s
easy
tosc
anpag
es,
whet
her
ther
ear
ebullet
s,hea
der
s,an
dcl
ear
links;
whet
her
the
contr
ast
bet
wee
nth
efo
regr
ound
and
bac
kgr
ound
mak
esth
ete
xt
legi
ble
;an
dw
het
her
ther
ear
esh
ort
pag
esan
dpar
agra
phs.
Asi
tew
her
eyo
uhav
eto
read
orsc
roll
dow
nte
nsc
reen
son
mos
tpag
esis
not
that
read
able
.1=
onm
ost
pag
es,
the
contr
ast
bet
wee
nth
ete
xt
and
the
bac
kgr
ound
orch
angi
ng
fonts
and
font
size
sm
ake
the
pag
esdiffi
cult
tore
ad;
2=on
man
ypag
es,
the
shee
rvo
lum
eof
info
rmat
ion
(e.g
.re
ally
long
text
orre
ally
long
list
sof
links)
mak
esth
epag
esdiffi
cult
tore
ad;
3=ge
ner
ally
,th
ein
form
atio
non
the
site
isea
syto
read
;4=
gener
ally
,th
ein
form
atio
non
the
site
isw
ritt
enfo
rth
eW
eb,
wit
hsh
ort
par
agra
phs,
bullet
s,hea
din
gs,
inte
rnal
links,
etc.
that
mak
esit
easy
tore
adan
dsc
anth
rough
;5=
the
info
rmat
ion
thro
ugh
out
the
site
isw
ritt
enfo
rth
eW
eb
Con
tinued
onnex
tpag
e

Esterling, Lazer & Neblo, Website Diffusion in State Delegations 12
Table
2–
conti
nued
from
pre
vio
us
page
Item
Sca
leC
odin
gR
ule
Org
aniz
atio
n1-
5O
rgan
izat
ion
isab
out
whet
her
ornot
info
rmat
ion
isw
her
eyo
uw
ould
exp
ect
itto
be
orw
het
her
you
hav
eto
hunt
arou
nd
for
it.
Mov
emen
tth
rough
the
site
isnav
igat
ion.
How
wel
lis
the
site
orga
niz
ed?
1=th
esi
teap
pea
rsth
row
nto
geth
erw
ith
no
thou
ght,
rhym
e,or
reas
on;
2=so
me
thou
ght
seem
edto
goin
tohow
the
site
was
orga
niz
ed,
but
itis
diffi
cult
tofigu
reou
tth
eor
ganiz
atio
nsc
hem
ean
ddiffi
cult
tofind
the
info
rmat
ion
you’r
elo
okin
gfo
r;3=
the
site
isor
ganiz
edw
ell
enou
ghth
atyo
uca
nusu
ally
find
what
you’r
elo
okin
gfo
rw
ith
only
one
ortw
ofa
lse
star
ts;
4=th
esi
teis
orga
niz
edw
ell
enou
ghth
atyo
uca
nusu
ally
find
what
you’r
elo
okin
gfo
rw
ithin
thre
ecl
icks
(no
fals
est
arts
);5=
the
site
isor
ganiz
edw
ell
enou
ghth
atyo
uca
nusu
ally
find
what
you’r
elo
okin
gfo
rw
ithin
thre
ecl
icks
AN
Dyo
uusu
ally
hav
eac
cess
toad
dit
ional
info
rmat
ion
from
other
sect
ions
ofth
esi
te(t
he
site
iscr
oss-
refe
rence
d)
Tim
elin
ess
1-5
How
up
todat
eis
the
site
?1=
ever
yth
ing
onth
esi
teis
clea
rly
old,
even
pre
ssre
leas
es;
2=pre
ssre
leas
esar
eup
todat
e(w
ithin
the
last
mon
th)
and
ever
yth
ing
else
isol
d;
3=pre
ssre
leas
esar
eup
todat
ean
dev
eryth
ing
else
isto
oge
ner
icto
tell
the
age;
4=pre
ssre
leas
esan
dis
sues
are
up
todat
e(p
ress
wit
hin
the
last
mon
than
dis
sues
obvio
usl
yfr
omth
e10
9th
Con
gres
s);
5=ev
eryth
ing
iscl
earl
yup
todat
ean
dit
iscl
ear
that
the
office
mak
esan
effor
tto
incl
ude
tim
ely
info
rmat
ion
onth
esi
te

Esterling, Lazer & Neblo, Website Diffusion in State Delegations 13
the website, its Navigability, its Readability, the website’s Organization, and the Timeliness
of the information content on the website. Finally, we use all 11 of these outcome variables
to construct a single factor scale for the latent technological quality of the website using an
ordered item response model. These items all load strongly on a single underlying factor
(factor scores not reported).
4.2 Network Adjacency Data
We expect that the diffusion of the quality of members’ websites will depend to some extent
on informal social communication within the Congress. Following the discussion above, in
this paper we measure informal networks by memberships in state delegations. To construct
this network variable, we simply constructed a matrix with rows representing members,
columns with labels that are identical to the rows, cells [i, j] equal to one if members in row i
and column j are in the same state, and cells equal to zero if members i and j are in different
states.6 Our quasi-experimental design also requires a matrix of district adjacencies. This
matrix is similar to the state delegation matrix, with the exception that the cells are equal
to one if two members’ districts are adjacent, and zero otherwise.7
For the spatial statistical models we report below, it is possible for the precision of
estimated correlation parameters to be a function of the average density of the adjacency
matrix, where the average density is the total number of ones divided by the number of matrix
cells. The average density of the state delegation adjacency matrix is 0.042, while the average
density of the district adjacency matrix is 0.023. To test the robustness of our results below
to variation in network density, we constructed a supplemented district adjacency matrix
that equals one if two districts are either adjacent to each other or are within one district
6Note on how we handle zero rows.7Generating the matrix of district adjacencies takes some doing. We downloaded the GIS shapefile
of congressional districts for the 109th Congress from the USGS National Atlas website. Unfortunately,this shape file does not represent districts, but instead represents smaller polygons that, when aggregated,reconstruct a congressional district, and obviously adjacencies among these polygons are not of any use forthis analysis. Aggregating the data up to the district level turned out to be a very complex task, requiringover a hundred lines of R code. The R script to do this is available from the authors on request.

Esterling, Lazer & Neblo, Website Diffusion in State Delegations 14
of each other (i.e., on a two step path). The average density of this supplemented district
adjacency matrix is 0.064. Thus the two district adjacency matrices create density bounds
below and above the state delegation density. We find little difference in the estimates for
district adjacency across these two distance measures, so below to simplify the discussion we
only present the results on the former, single-step adjacency matrix.
It is worth noting that the USGS data from which the district adjacencies are constructed
include non-voting delegates from D.C., Puerto Rico and the Virgin Islands, but for some
reason not the ones from Guam and American Samoa. Thus, our effective sample is 438
(435 regular members plus three non-voting delegates).
4.3 Control variables
We hold constant two variables that in previous work (Esterling et al., 2005) we found
to have an effect on the quality of legislative websites. In the model below we refer to
these as the fixed effect variables. Members who have longer terms in office tend to make
less effective use of website technology.8 To control for this, we include a measure the
equals one if the member is a Freshmen and zero otherwise (mean 0.096, standard deviation
0.295). In addition, the institutional context within Congress also can create advantages
and disadvantages for members to undertake new initiatives. We control for the member’s
political party by including a variable that equals one if the member is a Republican (the
majority party in 2006) and zero otherwise (mean 0.533, standard deviation 0.499).
8Members gain greater electoral security with longer tenure in office due to the well-known incumbentadvantages (Jacobson, 1987, 26). Members with longer tenures in office have fewer incentives to seek out in-novative ways to interact with constituents through their websites than those with shorter tenures. Memberswith longer tenures also are more likely to have well-established ways of communicating with constituents(Arnold, 2004) and thus are unlikely to place much effort in this new form of legislative communication.

Esterling, Lazer & Neblo, Website Diffusion in State Delegations 15
5 Estimation
We hypothesize that a member’s effective use of website communication technologies depends
on the propensity of other members in her state delegation to use these technologies, and
these other members themselves are in the same estimation sample. Because of this stochastic
dependence among members’ websites, using ordinary probit to examine the relationship
between a member’s adoption practices and the average of the outcomes of the individuals
that person interacts with would result in an estimate of social influence that would be
biased upwards. The statistical literature on geographically connected processes has devised
techniques to study spatial inter-dependencies in a way that appropriately accounts for these
reciprocal effects (Anselin, 1988; Cliff and Ord, 1981; Doreian, 1980). For this paper we
estimate network dependence with a conditionally autoregressive (CAR) model (Congdon,
2003, chapter 7) using Bayesian MCMC sampling to simulate a posterior distribution of all
model parameters. The basic model is:
Oi ∼ Categorical(pi,1...5)pi,1 = 1− qi,1pi,2 = qi,1 − qi,2pi,3 = qi,2 − qi,3pi,4 = qi,3 − qi,4pi,5 = qi,4
logit(qi,1) = b1 · x1,i + b2 · x2,i + ai + si − k1
logit(qi,2) = b1 · x1,i + b2 · x2,i + ai + si − k2
logit(qi,3) = b1 · x1,i + b2 · x2,i + ai + si − k3
logit(qi,4) = b1 · x1,i + b2 · x2,i + ai + si − k4
ai ∼ φ(ai, 1)
ai = ρa ·∑Nai
k=1(Waik)/(Nai)Waik ∈ {aj : j is adjacent to i}Nai = # {aj : j has an adjacent district to i}si ∼ φ(si, 1)
si = ρs ·∑Nsi
k=1(Wsik)/(Nsi)Wsik ∈ {sj : j is in the same state delegation as i}Nsi = # {sj : j is in the same state delegation as i}
1 ≤ i ≤ N

Esterling, Lazer & Neblo, Website Diffusion in State Delegations 16
ρa ∼ Uniform(0, 0.99)ρs ∼ Uniform(0, 0.99)b1 ∼ φ(0.0, 1.0E-5)b2 ∼ φ(0.0, 1.0E-5)k1 ∼ φ(−1, 0.1)C(−5, k2)k2 ∼ φ(-0.5, 0.1)C(k1, k3)k3 ∼ φ(0.5, 0.1)C(k2, k4)k4 ∼ φ(1, 0.1)C(k3, 5)
The set of equations contained within the outermost bracket give the model likelihood.
We estimate the model separately for each ordered indicator, Oi, measuring the presence
of each website quality or feature listed in table 1; each is modeled with an ordered logit
function. Note the dichotomous outcome variables are also ordered so we use the same
equation but estimate only one threshold. The conditional probability of each outcome is
taken to be a function of the two fixed effect control variables, x, their estimated coefficients,
b, a category-specific threshold kj, and the two random intercepts, ai and si. Here, ai is a
random effect that captures local-level heterogeneity, and si is a random effect that captures
dependence among members of a state delegation.
To see that ai and si are random intercepts capturing local- and state-level dependence,
respectively, note that these two variables are themselves a function of other members’
random intercepts. For each member, define the district-level adjacency set of member i
as the set of members j with a one in the ith row of the district adjacency matrix. Define
the state delegation of member i as the set of members j with a one in the ith row of the
state adjacency matrix. The random intercept ai is assumed to have a normally distributed
prior, with mean a function of the random intercepts of the member’s district adjacency set
(this is known as a CAR prior). The random intercept si is assumed to have a normally
distributed prior, with mean a function of the random intercepts of the member’s state
delegation. Inference for the social network effects are based on ρa and ρs, both scalars. ρa
is the effect of a change in the probability a member’s website will have one of the features
or characteristics in table 1 is associated with the propensity of the websites of those that
are in the member’s district adjacency set to also have the feature or characteristic.

Esterling, Lazer & Neblo, Website Diffusion in State Delegations 17
This propensity is based on a weighted average with weight equal to Ni, or the number of
elements in the member’s district adjacency neighborhood set. Likewise, ρs is the effect of a
change in the propensity of a member’s website to have a feature or characteristic associated
with the propensity of the websites of those that are in the member’s state delegation to
have the feature or characteristic. Each ρ is a spatial correlation parameter that captures
the degree of spatial dependence at each geographic level (district and state). Because we
control for district level heterogeneity via ai, ρs captures the causal dependence among the
websites of members within a state delegation.9
To round out the analyzes, below we extend this model in two ways. First, we create
an overall summary measure of the quality of the communication technology on each mem-
ber’s website using an ordered item response model, and embed this model into the main
model to construct a full structural equation model (SEM). This SEM allows us to test for
the dependence of the aggregate or latent quality of website technologies using all of the
indicators simultaneously. Second, we create an interaction between the member’s political
party and the network dependence random effect to test whether diffusion is more preva-
lent within either of the political parties. This requires breaking the conditional mean of
the state diffusion random intercept distribution into two terms: ρRs · Republicani · si and
ρDs · (1− Republicani) · si.
For estimation, we use the MCMC Gibbs sampler in WinBUGS (Spiegelhalter, Thomas,
Best, and Gilks, 1996). We assume diffuse priors for b to minimize the influence of the prior
parameter distributions on the posteriors. We sample three chains and initialize each chain
with overdispersed starting values. We discarded the first 5,000 iterations to allow burn-in,
and then sampled an additional 5001 draws for each chain, keeping one in every ten draws,
for a total sample of 1503 across the three chains. The chains show extremely good mixing
using the Brooks-Gelman-Rubin diagnostic (Gelman and Rubin, 1992). Below we present
9The correlation parameters in principal can take values in the range [-1,1]. In the model, we constraineach ρ to be positive, since a priori it is not plausible under either the diffusion or the heterogeneity hypothesisthat members would systematically be dissimilar with their neighbors.

Esterling, Lazer & Neblo, Website Diffusion in State Delegations 18
the marginal posterior distributions of the model parameters.
6 Findings
One advantage of Bayesian estimation is that the results are reported in full marginal dis-
tributions, rather than as summaries of distributions in the form of point estimates and
standard errors. Thus, one can evaluate the significance of parameter estimates by com-
paring their posterior distributions without relying on strict (frequentist) hypothesis tests.
In this paper, we present these posterior distributions graphically as empirical cumulative
densities and compare these densities to the priors as well as across parameters.
The results of the basic model for the 11 outcomes and the overall latent variable are
shown in figure 2. The results are shown as comparisons of empirical cumulative density
functions for the two spatial dependence parameters, ρa and ρs. See the appendix for spe-
cific guidance on interpreting comparisons between cumulative density functions. In each
figure, we graph the posterior distribution for the heterogeneity dependence parameter for
the district adjacency matrix, F(ρa) in blue, and the cumulative density for the parameter
capturing diffusion within state delegations, F(ρs) in maroon. The cumulative distribution
for the uniform prior on [0,0.9] for each of these parameters is shown as a dashed grey line.
In this application, a rho with a cumulative density that is to the right of the dashed line
indicates that there is a positive dependence at that geographic level, and a one with a cu-
mulative density to the left of the dashed line indicates no dependence or a very low level of
dependence. We test for the difference between distributions using the Kolmogorov-Smirnov
(KS) test.
First, each of the posterior distributions is statistically different from the priors (the
probability level for each KS test is less than 0.001). Note, however, that all of the cumulative
densities for ρa lie to the left of the prior, indicating that there is little to no dependence
at the district level. This means that there are few geographically distributed variables that

Esterling, Lazer & Neblo, Website Diffusion in State Delegations 19
0.0 0.2 0.4 0.6 0.8
0.0
0.4
0.8
Blog
Parameter
KS Test, p<0.001F(ρρs)
F(ρρa)
0.0 0.2 0.4 0.6 0.8 1.0
0.0
0.4
0.8
Podcast
Parameter
Cum
ulat
ive
Den
sity
KS Test, p<0.001
F(ρρs)
F(ρρa)
0.0 0.2 0.4 0.6 0.8 1.0
0.0
0.4
0.8
Text Only
Parameter
Cum
ulat
ive
Den
sity
KS Test, p<0.001F(ρρs)
F(ρρa)
0.0 0.2 0.4 0.6 0.8 1.0
0.0
0.4
0.8
Audio
Parameter
KS Test, p<0.001F(ρρs)
F(ρρa)
0.0 0.2 0.4 0.6 0.8 1.0
0.0
0.4
0.8
Video
Parameter
Cum
ulat
ive
Den
sity
KS Test, p<0.001F(ρρs)
F(ρρa)
0.0 0.2 0.4 0.6 0.8 1.0
0.0
0.4
0.8
RSS Feed
Parameter
Cum
ulat
ive
Den
sity
KS Test, p=0.27
F(ρρs) = F(ρρa)
0.0 0.2 0.4 0.6 0.8 1.0
0.0
0.4
0.8
Look & Feel
Parameter
KS Test, p=0.07
F(ρρs) = F(ρρa)
0.0 0.2 0.4 0.6 0.8 1.0
0.0
0.4
0.8
Navigation
Parameter
Cum
ulat
ive
Den
sity
KS Test, p<0.001F(ρρs)
F(ρρa)
0.0 0.2 0.4 0.6 0.8 1.0
0.0
0.4
0.8
Readability
Parameter
Cum
ulat
ive
Den
sity
KS Test, p<0.001F(ρρs)
F(ρρa)
0.0 0.2 0.4 0.6 0.8 1.0
0.0
0.4
0.8
Organization
KS Test, p=0.48
F(ρρs) = F(ρρa)
0.0 0.2 0.4 0.6 0.8 1.0
0.0
0.4
0.8
Timeliness
Cum
ulat
ive
Den
sity
KS Test, p<0.001F(ρρs)
F(ρρa)
0.0 0.2 0.4 0.6 0.8 1.0
0.0
0.4
0.8
Overall
Cum
ulat
ive
Den
sity
KS Test, p<0.001F(ρρs)
F(ρρa)
Figure 2: The Basic Results
This figure compares the posterior distributions for the estimated effects of state delegation(ρs) and district adjacency (ρa). F(.) indicates the cumulative posterior distribution foreach ρ parameter. A cumulative distribution to the right indicates a higher mode for theparameter. The dashed grey line is the cumulative prior distribution for each parameter.The KS test in each frame is the test for the difference between the two posteriors.

Esterling, Lazer & Neblo, Website Diffusion in State Delegations 20
are correlated with the adoption of new website technologies.
In contrast, many of the cumulative densities for ρs are significantly to the right of both
the prior as well as to the posteriors for ρa. This indicates that for these items, there exists
dependence within state delegations. In particular, we observe dependence within state
delegations for podcast, text only, audio, navigation, readability, and timeliness. Notably,
we do not see a dependence for overall score, which suggests that the dependence is at the
feature level rather than at a deeper, latent quality level. That is, the fact other members in
a state have high quality (feature rich) sites does not drive a member of the state delegation
to have a feature rich site – rather, the presence of a particular feature would drive you to
have that specific feature (for the subset of features where we find dependence).
To test whether diffusion occurs differently within the political parties, we re-ran the
same model including interactions to allow each rho parameter to differ for each party. We
report the results for this model in figure 3. There is very little that is different between the
two political parties with the exception for a few items where there appears to be slightly
more dependence for Democrats than for Republicans. These items are audio, look and feel,
organization, and the overall summary measure. Finally, consider the effect estimates for the
fixed effect regression parameters, reported in table 3. The freshmen (elected in 2004) tend
to score higher on the general technical measures of look and feel, navigation, readability,
organization and timeliness.
More importantly, the fixed effect results for party suggest that, while there are different
diffusion patterns within the parties, the two parties overall have similar average amounts
of communication technology on their websites, with Republicans having a slightly higher
propensity for a few items (text only, audio, a high look and feel rating, and a timeliness
rating). This implies that while there exists more dependence among Democratic members
within state delegations, this dependence does not necessarily improve the quality of websites.
Indeed, the correlation implies that, especially among Democrats, a member with a low
quality website will drive down the quality of the websites of others in the delegation.

Esterling, Lazer & Neblo, Website Diffusion in State Delegations 21
0.0 0.2 0.4 0.6 0.8 1.0
0.0
0.4
0.8
Blog
Parameter
KS Test, p=0.81
F(ρρDs) = F(ρρRs)
0.0 0.2 0.4 0.6 0.8 1.00.
00.
40.
8
Podcast
Parameter
Cum
ulat
ive
Den
sity
KS Test, p<0.001
F(ρρRs)
F(ρρDs)
0.0 0.2 0.4 0.6 0.8 1.0
0.0
0.4
0.8
Text Only
Parameter
Cum
ulat
ive
Den
sity
KS Test, p=0.43
F(ρρDs) = F(ρρRs)
0.0 0.2 0.4 0.6 0.8 1.0
0.0
0.4
0.8
Audio
Parameter
KS Test, p<0.001
F(ρρDs)
F(ρρRs)
0.0 0.2 0.4 0.6 0.8 1.0
0.0
0.4
0.8
Video
Parameter
Cum
ulat
ive
Den
sity
KS Test, p=0.11
F(ρρDs) = F(ρρRs)
0.0 0.2 0.4 0.6 0.8 1.0
0.0
0.4
0.8
RSS Feed
Parameter
Cum
ulat
ive
Den
sity
KS Test, p=0.48
F(ρρDs) = F(ρρRs)
0.0 0.2 0.4 0.6 0.8 1.0
0.0
0.4
0.8
Look & Feel
Parameter
KS Test, p<0.001
F(ρρDs)
F(ρρRs)
0.0 0.2 0.4 0.6 0.8 1.0
0.0
0.4
0.8
Navigation
Parameter
Cum
ulat
ive
Den
sity
KS Test, p=0.10
F(ρρDs) = F(ρρRs)
0.0 0.2 0.4 0.6 0.8 1.0
0.0
0.4
0.8
Readability
Parameter
Cum
ulat
ive
Den
sity
KS Test, p=0.51
F(ρρDs) = F(ρρRs)
0.0 0.2 0.4 0.6 0.8 1.0
0.0
0.4
0.8
Organization
KS Test, p<0.001
F(ρρDs)
F(ρρRs)
0.0 0.2 0.4 0.6 0.8 1.0
0.0
0.4
0.8
Timeliness
Cum
ulat
ive
Den
sity
KS Test, p<0.001
F(ρρDs)
F(ρρRs)
0.0 0.2 0.4 0.6 0.8 1.0
0.0
0.4
0.8
Overall
Cum
ulat
ive
Den
sity
KS Test, p<0.001
F(ρρDs)
F(ρρRs)
Figure 3: The Results Estimated Separately for Each Party
This figure compares the degree of diffusion within state delegations separately for eachpolitical party. ρDs is the posterior distribution for the state delegation diffusion parameterfor Democrats, and ρRs is the same for Republicans. A cumulative distribution to the rightindicates a higher mode for that party. KS tests compare the two posteriors in each graph.
Esterling, Lazer & Neblo, Website Diffusion in State Delegations 22
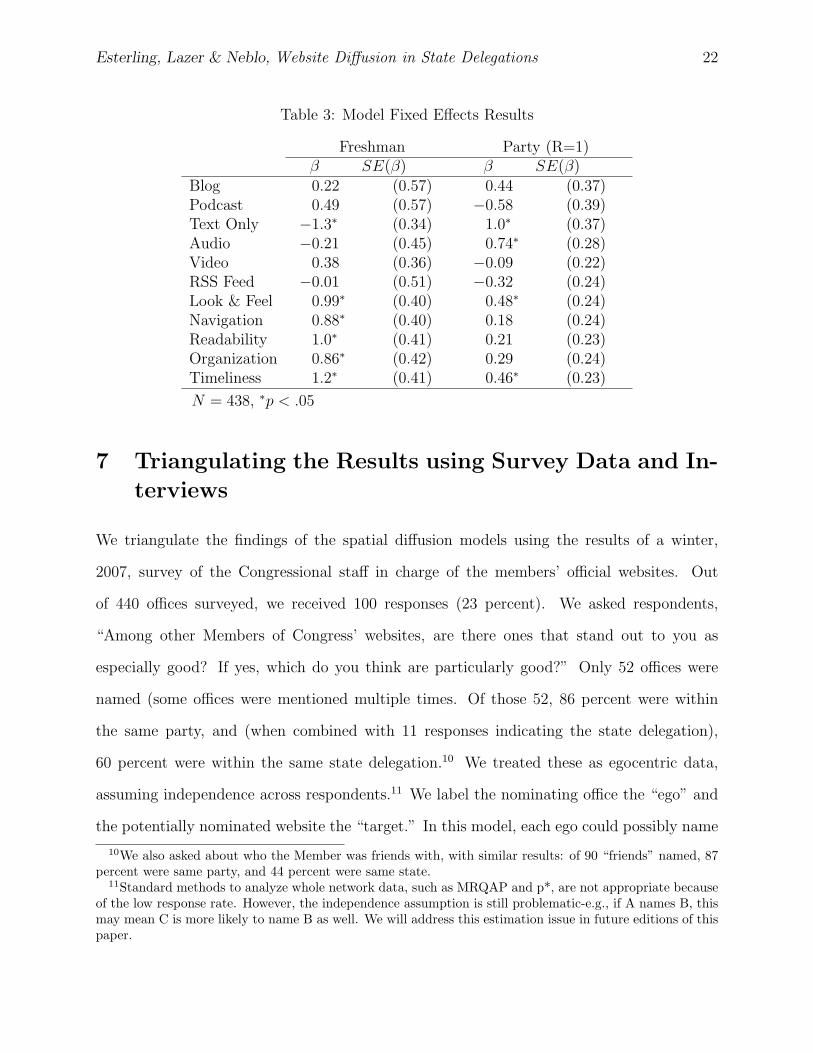
Table 3: Model Fixed Effects Results
Freshman Party (R=1)β SE(β) β SE(β)
Blog 0.22 (0.57) 0.44 (0.37)Podcast 0.49 (0.57) −0.58 (0.39)Text Only −1.3∗ (0.34) 1.0∗ (0.37)Audio −0.21 (0.45) 0.74∗ (0.28)Video 0.38 (0.36) −0.09 (0.22)RSS Feed −0.01 (0.51) −0.32 (0.24)Look & Feel 0.99∗ (0.40) 0.48∗ (0.24)Navigation 0.88∗ (0.40) 0.18 (0.24)Readability 1.0∗ (0.41) 0.21 (0.23)Organization 0.86∗ (0.42) 0.29 (0.24)Timeliness 1.2∗ (0.41) 0.46∗ (0.23)
N = 438, ∗p < .05
7 Triangulating the Results using Survey Data and In-
terviews
We triangulate the findings of the spatial diffusion models using the results of a winter,
2007, survey of the Congressional staff in charge of the members’ official websites. Out
of 440 offices surveyed, we received 100 responses (23 percent). We asked respondents,
“Among other Members of Congress’ websites, are there ones that stand out to you as
especially good? If yes, which do you think are particularly good?” Only 52 offices were
named (some offices were mentioned multiple times. Of those 52, 86 percent were within
the same party, and (when combined with 11 responses indicating the state delegation),
60 percent were within the same state delegation.10 We treated these as egocentric data,
assuming independence across respondents.11 We label the nominating office the “ego” and
the potentially nominated website the “target.” In this model, each ego could possibly name
10We also asked about who the Member was friends with, with similar results: of 90 “friends” named, 87percent were same party, and 44 percent were same state.
11Standard methods to analyze whole network data, such as MRQAP and p*, are not appropriate becauseof the low response rate. However, the independence assumption is still problematic-e.g., if A names B, thismay mean C is more likely to name B as well. We will address this estimation issue in future editions of thispaper.

Esterling, Lazer & Neblo, Website Diffusion in State Delegations 23
Table 4: Logistic (rare event) results for naming other offices
Variable Coef. Std. Err.Same Party 1.57∗ .54Same State 1.52∗ .41Adjacent Districts .33 .66Target is a Leader 1.04∗ .34The Term for Target −.02 .04Target is a Democrat −.61 .56Ego is a Democrat .77 .55Constant −8.50∗ .63
N = 52767; ∗p < 0.05.Note: The model also controls for the CMF ratings of the qualityof both ego’s website and the potential target’s website (results notreported).
any of the potential targets, and given the sparseness of the data, we specified a rare events
logit model (King and Zeng, 2001). For covariates, we use Same party indicating both ego
and potential target are in the same party; Same state indicating both are in the same state
delegation; Adjacent district indicating the districts are geographically adjacent; whether the
potential target is a Party leader ; the potential target’s Term or length of service; whether
the potential Target is a Democrat ; and whether the Ego is a Democrat.12
The logistic regression confirms that state delegation was a powerful predictor that one
office would name another (p < .001), while district adjacency (when controlling for same
state delegation) was not significant. Also important were whether both offices were from
the same party, whether the named offices was from party leadership leadership.
7.1 Interview Qualitative Data
We also conducted structured interviews on information sharing processes among offices in
the summer of 2006 involving 99 offices. These interviews were transcribed and coded in
12We also include a battery of controls for the quality rating of each website (for both ego and target)along a variety of dimensions, such as the quality of the issue content, constituency service, technology, etc.(results not reported).

Esterling, Lazer & Neblo, Website Diffusion in State Delegations 24
NVivo. The interview data also support the proposition that there was a powerful emulation
process within state delegations. As one staff person stated, “I was not in the business of
trying to reinvent the wheel.” There are two pathways by which offices may affect each other:
interpersonal communication and passive mimicry. That is, some staff merely look at other
websites, while others talk to each other about the features of the websites. The following
interviewee illustrates diffusion both through mimicry and interpersonal communication:
We looked at every single website . . . . We probably had [a list of] the top 30sites. I individually contacted every single one of those offices, and found out,who do you use for your website, who does the upkeep of it, who designed it, gotall of the specifics of it . . .
While the interview data make clear that both processes of diffusion existed, it is clear
that mimicry dominated interpersonal communication, where the following statement is
representative:
I didn’t talk to other staff members. I definitely looked at other Members’ sitesvery carefully and tried to see what, what they were doing that might work forus.
Strikingly, only one office out of ninety nine reported talking extensively to other offices
about internal processes (e.g., website design; how to get content on the website, etc.). In-
terpersonal communication was generally limited to identifying vendors, where the following
two responses are typical:
We’ve looked at basically every other member site there is . . . . [W]e picked outthe ones we liked the best, and I contacted their staff, and we found out whotheir . . . vendor was.
I mean, I just talked to a bunch of my friends that are press secretaries basically.I just called them and said hey, who do you guys use, or, you know, is thereanything you’d recommend? I really like your site, who did you use? Yeah, youknow, basically word of mouth. [Name] did the same, our chief of staff. And hetalked to some other chiefs of staff, in terms of cost and benefits, and customerservice.
These last two quotes illustrate two different strategies for identifying who to talk to. The
first relied on an extensive search of what was observable to guide personal contact. The

Esterling, Lazer & Neblo, Website Diffusion in State Delegations 25
Figure 4: Emulation Process in Congress
second indicates a reliance on friends, that is, a particular type of interpersonal network,
friendship, guided interpersonal information seeking. Our interview data suggests that inter-
personal information seeking was significant (23 percent indicated talking to other offices),
but the dominant mode of learning from what other offices were doing was mimicry – just
looking at other websites. Figure 4 summarizes the distribution of social learning strategies
we observed among the people we interviewed (based on a coding of their responses to our
structured interviews).
8 Discussion and Conclusion
The above analyses provide insight into the pathways of innovation within Congress, where
the different data sources provide a degree of triangulation as to what the underlying pro-
cesses are. We find a significant possibility of diffusion within state delegations. The results
of the analysis of the spatial dependence are highly suggestive, but we admit the possibility

Esterling, Lazer & Neblo, Website Diffusion in State Delegations 26
of confounding variables that are conditioned on state boundaries. However, the two other
data sources further bolster the relative plausibility that diffusion is driving this dependence.
Specifically, we conducted a social network survey of the staff in charge of their Member’s
website, and we found that being in the same state delegation was a powerful predictor of
a tie between two offices, while adjacency was not. The interview data further confirms the
interdependence of website features, highlighting a primary role for mimicry (looking at and
copying what other offices have done), and a secondary role for interpersonal communica-
tion. The pattern of spatial dependence also reinforces this conclusion, where the feature of a
website that is most quickly evaluated by a harried communication director-its timeliness-is
also the feature that shows the strongest sign of diffusion.
This is our first cut at these data. There are several obvious lines we intend to pursue.
First, we wish to model diffusion across different possible informal communication networks,
including cosponsorship networks (Fowler, 2006), committee overlap networks (Baughman,
2006), and hallway proximity networks, which would measure the physical distance between
members’ offices. The latter has the interesting feature that the selection of members to
offices is likely exogenous to other informal networks, ruling out the inferential problems
stemming from homophily, or the problem that members connected in informal networks
also share attributes (or the non-geographic version of spatial heterogeneity that we discuss
above). Second, the CMF dataset has a very rich set of indicators of a variety of attributes
of members websites, which allows test across substantive categories of variables, as well as
tests of the diffusion of latent properties of websites that could be captured in spatial latent
variable autoregressive models.
Third, we are refining the alignment between the survey and the analysis of spatial
dependence-for example, the survey suggests that there should be greater dependence among
individuals from the same party member, which we should be able to test directly. Finally,
there are a variety of priors in addition to CAR one can assume to model the diffusion
process, and we hope to test the robustness of our results across these different priors.

Esterling, Lazer & Neblo, Website Diffusion in State Delegations 27
A Appendix: Interpreting Comparisons between Em-
pirical Cumulative Density Functions
Figures 2 and 3 report the results of the statistical models in terms of comparisons of the
posterior distributions of the spatial dependence parameters. Here we walk the reader though
how to read such a graph, using the results for Podcast as the example. Figure 5 shows the
Podcast figure enlarged, and with some more detail given. In this figure, each curve shows the
empirical cumulative posterior (or estimated) density for a model parameter. The top (blue)
line shows the cumulative density for ρa, which is the estimated degree of spatial dependence
among adjacent congressional districts. The bottom (maroon) line is the cumulative density
for ρs, which is the estimated degree of diffusion of website practices within state delegations
(holding constant district level heterogeneity). The dashed grey line indicates the cumulative
prior distribution for each of these parameters. The figure shows both how each posterior
differs from the prior, as well as how much the distribution for each parameter differs from
each other.
To understand differences between cumulative distributions, it is sometimes easier to
first consider how the densities differ, and then consider how changes in densities changes
the shape of the cumulative distribution function. Figure 6 shows the smoothed posterior
densities for each of the two ρ parameters, along with the uniform prior density for each.
First consider the prior Uniform [0,1] density, drawn in grey, where the density accumulates
from zero to one in a linear manner. For this density, the cumulative distribution function is
a straight line connecting the origin to the point (1,1), and is indicated with a dashed grey
line in figure 5.
Next consider the posterior density for ρa. This density has a mode close to zero and is
skewed to the right. This posterior distribution indicates that there is little if any dependence
in this process that result from district adjacency; the spatial correlation at the district level is
approximately zero. In this case, moving from left to right in figure 5, the density accumulates
quickly at first, and then tapers off, resulting in a cumulative distribution function that has

Esterling, Lazer & Neblo, Website Diffusion in State Delegations 28
0.0 0.2 0.4 0.6 0.8
0.0
0.2
0.4
0.6
0.8
1.0
Example Graph for Cumulative Posterior Densities
Parameter Estimate
Cum
ulat
ive
Den
sity
Kolmogorov−Smirnov (KS) Test, p<0.001
Posterior Distribution for ρρs = F(ρρs)
Posterior Distribution for ρρa = F(ρρa)
Uniform Prior Distribution for both ρρa and ρρs
Figure 5: How to interpret the results in figures 2 and 3
a steep slope close to zero and a relatively flat slope above about 0.6. Finally consider the
posterior density for ρs, which has a mode at about 0.8. This indicates that there is stronger
evidence that dependence exists within a state delegation; the probability that the spatial
correlation is above 0.5 is quite high. In this case, moving from left to right in figure 5, the
cumulative distribution function is relatively flat at low values for the parameter estimate,
and then is steep starting around 0.5.
In general, a cumulative distribution function that is to the lower-right indicates a high
correlation estimate, that is, a density that is concentrated at the high range of possible
parameter values. A cumulative distribution function that is to the upper-left indicates

Esterling, Lazer & Neblo, Website Diffusion in State Delegations 29
0.0 0.2 0.4 0.6 0.8 1.0
0.0
0.5
1.0
1.5
Posterior Density for ρρa = f(ρρa)
Parameter
Den
sity
0.0 0.2 0.4 0.6 0.8 1.0
0.0
0.5
1.0
1.5
Posterior Density for ρρs = f(ρρs)
Parameter
Den
sity
Figure 6: Prior and posterior densities for ρa and ρs
a low correlation estimates, or a density that is concentrated at a low range of possible
parameter values. Finally, the farther a cumulative distribution is from the grey dashed line,
the more that has been gleaned about the process from the data; cumulative distributions
that are close to the grey line indicate we have learned nothing beyond the prior beliefs used
to define the model.
Finally, the cumulative distribution graphs also report the p-value for a Kolmogorov-
Smirnov test for the equality of the posterior distributions for ρa and ρa. A low p-value
indicates that the two distributions are different.
References
Allen, T. J. (1978). Managing the Flow of Technology: Technology Transfer and the Dissem-ination of Technological Information within the R&D Organization. Cambridge, Mass.:MIT Press.
Anselin, L. (1988). Spatial Econometrics: Methods and Models. Boston, Mass.: KluwerAcademic.

Esterling, Lazer & Neblo, Website Diffusion in State Delegations 30
Arnold, L. W., R. Dean, and E. Al (2000). Friendship and votes: The impact of interpersonalties on legislative decision making. State and Local Government Review 32, 142–147.
Arnold, R. D. (2004). Congress, the Press, and Political Accountability. Princeton, N.J.:Princeton University Press.
Baughman, J. (2006). Common Ground: Committee Politics in the U.S. House of Repre-sentatives. Palo Alto, Calif.: Stanford University Press.
Caldeira, G. A. and S. C. Patterson (1987). Political friendships in the legislature. Journalof Politics 49, 953–975.
Carpenter, D. P., K. M. Esterling, and D. M. Lazer (1998). The strength of weak ties inlobbying networks: Evidence from health care politics in the united state. Journal ofTheoretical Politics 10 (Oct.), 417–444.
Carpenter, D. P., K. M. Esterling, and D. M. Lazer (2003). Information and contact makingin policy networks: A model with evidence from the u.s. health policy domain. Rationalityand Society 15 (Nov.), 411–440.
Carpenter, D. P., K. M. Esterling, and D. M. Lazer (2004). Friends, brokers, and transitivity:Who informs whom in washington politics? Journal of Politics 66 (Feb.), 224–246.
Cliff, A. and J. Ord (1981). Spatial Processes: Models and Applications. London: Pion.
Coleman, J. S., E. Katz, and et al (1957). The diffusion of an innovation among physicians.Sociometry 20 (4), 253–270.
Congdon, P. (2003). Applied Bayesian Modelling. Hoboken, N.J.: John Wiley & Sons, Ltd.
den Bulte, C. V. and R. Moenaert (1998). The effects of r&d team co-location on communi-cation patterns among r&d, marketing, and manufacturing. Management Science 44 (11),S1–S18.
DiMaggio, P. J. and W. W. Powell (1983). The iron cage revisited – institutional isomorphismand collective rationality in organizational fields. American Sociological Review 48 (2),147–160.
Doreian, P. (1980). Linear models with spatially distributed data: Spatial disturbances orspatial effects? Sociological Methods and Research 9, 29–60.
Druckman, J. N., C. L. Hennessy, M. J. Kifer, and M. Parkin (2009). Issue engagement oncongressional web sites, 2002-2006. Social Science Computer Review 27 (June), 1–21.
Druckman, J. N., M. K. Kifer, and M. Parkin (2007). The technological development ofcongressional candidate websites: How and why candidates use web innovations. SocialScience Computer Review 25, 425–442.

Esterling, Lazer & Neblo, Website Diffusion in State Delegations 31
Esterling, K. M., D. M. Lazer, and M. A. Neblo (2005). Home (page) style: Determinants ofthe quality of house members’ websites. International Journal of Electronic GovernmentReserach 1 (2), 50–63.
Fenno, R. F. (1978). Homestyle: House Members in Their Districts. Boston, Mass.: Little,Brown and Co.
Festinger, L. (1950). Informal social communication. Psychological Review 57 (5), 271–282.
Fowler, J. H. (2006). Legislative cosponsorship networks in the u.s. house and senate. SocialNetworks 28 (Oct.), 454–465.
Galaskiewicz, J. and R. S. Burt (1991). Interorganizational contagion in corporate philan-thropy. Administrative Science Quarterly 36 (1), 88–105.
Gelman, A. and D. B. Rubin (1992). Inference from iterative simulation using multiplesequences. Statistical Science 7 (Nov.), 434–455.
Hagerstrand, T. (1967). Innovation Diffusion as a Spatial Process. Chicago, Ill.: Universityof Chicago Press.
Hansen, B. B. and J. Bowers (2008). Covariate balance in simple, stratified and clusteredcomparative studies. Statistical Science 23 (2), 219–236.
Hansen, M. T. (1999). The search-transfer problem: The role of weak ties in sharing knowl-edge across organizational units. Administrative Science Quarterly 44 (1), 82–111.
Haunschild, P. and A. Milner (1997). Modes of interorganizational imitation: The effects ofoutcome salience and uncertainty. Administrative Science Quarterly 42 (3), 472–500.
Hedlund, R. D. (1984). Organizational attributes of legislatures: Structure, rules, norms,resources. Legislative Studies Quarterly IX (Feb.), 51–121.
Heinz, J. P., E. O. Laumann, R. L. Nelson, and R. H. Salisbury (1993). The Hollow Core:Private Interests in National Policymaking. Cambridge, Mass.: Harvard University Press.
Jacobson, G. C. (1987). The Politics of Congressional Elections. Boston, Mass.: Little,Brown and Co.
King, G. and L. Zeng (2001). Logistic regression in rare events data. Political Analy-sis 9 (Spring), 137–163.
Kraut, R. E., C. Egido, and et al (1990). Intellectual Teamwork: Social and TechnologicalFoundations of Cooperative Work (Jolene Galegher, Robert E. Kraut, Carmen Egido ed.).,Chapter Patterns of Contact and Communication in Scientific Research Collaboration.Lawrence Erlbaum.
Laumann, E. O. and D. Knoke (1984). The Organizational State: Social Choice in NationalPolicy Domains. Madison, Wisc.: University of Wisconsin Press.

Esterling, Lazer & Neblo, Website Diffusion in State Delegations 32
Lazer, D. M. (2001). Coevolution of network and individual. Journal of MathematicalSociology 25 (Jan.), 69–108.
Mintrom, M. (1997). Policy entrepreneurs and the diffusion of innovation. American Journalof Political Science 41 (3), 738–770.
Monge, P., L. Rothman, and et al (1985). The dynamics of organizational proximity. Man-agement Science 31 (9), 1129–1141.
Pitkin, H. F. (1967). The Concept of Representation. Berkeley, Calif.: University of CaliforniaPress.
Rice, R. and C. Aydin (1991). Attitudes toward new organizational technology: Networkproximity as a mechanism for social information processing. Administrative Science Quar-terly 36 (2), 219–244.
Rogers, E. M. (1976). New product adoption and diffusion. The Journal of ConsumerResearch 2 (4), 290–301.
Ryan, B. and N. Gross (1943). The diffusion of hybrid seed corn in two iowa communities.Rural Sociology 8, 15–24.
Salisbury, R. H. and K. Shepsle (1981). U.s. congressman as enterprise. Legislative StudiesQuarterly VI (Nov.), 559–576.
Spiegelhalter, D., A. Thomas, N. Best, and W. Gilks (1996). Bugs 0.5: Bayesian inferenceusing gibbs sampling manual (version ii). Technical report, MRC Biostatistics Unit.
Truman, D. B. (1956). State delegations and the structure of party voting in the unitedstate house of representatives. American Political Science Review 50 (Dec.), 1023–1045.
Valente, T. W. (1995). Network Models of the Diffusion of Innovations. Cresskill, N.J.:Hampton Press.
Walker, J. L. (1969). The diffusion of innovations among the american states. AmericanPolitical Science Review 63 (Sept.), 880–899.
Zahn, G. (1991). Face-to-face communication in an office setting: The effects of position,proximity, and exposure. Communication Research 18, 737–754.