experimental study of ignition in a pilot flame system · (distância crítica de ignição), para...
TRANSCRIPT

Novembro 2009
Experimental Study of Ignition in a Pilot Flame System
Ricardo Alexandre da Fonseca Rato
Dissertação para obtenção do Grau de Mestre em
Engenharia Mecânica
Júri
Presidente: Prof. Mário Manuel Gonçalves da Costa
Orientador: Prof. Edgar Caetano Fernandes
Vogal: Prof. Daniel Cardoso Vaz
2 cm
2 cm


I
RESUMO
Nos novos esquentadores, chamados inteligentes, a chama piloto apenas acende quando a
torneira de água quente é aberta, ao contrário do que acontece nas unidades antigas onde
a chama piloto está sempre acesa. Deste modo, estas unidades necessitam de um sistema
fiável de ignição da chama piloto. Neste contexto, o objectivo deste trabalho foi estudar
detalhadamente um sistema de chama piloto (disponível no mercado), com vista a
identificar as causas que possam contribuir para o insucesso da ignição e propor um novo
sistema de chama piloto com um maior sucesso de ignição. A fim de conseguir este
objectivo, submeteu-se o sistema de chama piloto actual a uma caracterização
experimental. Seguidamente, efectuou-se um estudo experimental para avaliar do ponto
de vista fundamental o efeito de propriedades da mistura e parâmetros dos eléctrodos no
sucesso da descarga da faísca (ocorrência de faísca) e no sucesso da ignição (propagação
de chama sustentada depois de uma descarga de faísca). Estas experiências foram
realizadas controlando o espaçamento dos eléctrodos, d, para determinar ds (distância
crítica de faísca) e di (distância crítica de ignição), para uma tensão/energia fixas,
variando a razão de equivalência, temperatura e humidade do ar, velocidade média da
mistura e diâmetro dos eléctrodos. Por último, com base em todos estes resultados
propôs-se um novo sistema de chama piloto e caracterizado/testado experimentalmente.
A caracterização experimental dos sistemas de chama piloto actual e proposto incluiu:
medições do campo de velocidades à saída do tubo piloto utilizando a técnica LDV,
determinação da razão de equivalência primária e gravações de cinematografia de alta
velocidade do desenvolvimento da faísca e da chama.
Um novo sistema de chama piloto foi proposto com base numa nova configuração dos
eléctrodos e numa nova geometria do tubo piloto. Neste sistema a faísca é descarregada
dentro do jacto piloto (contrariamente ao sistema actual) que tem uma razão de
equivalência, Øprim, 1.27, enquanto o sistema actual funciona com Øprim=2.27. O sistema de
chama piloto proposto tem uma probabilidade de ignição de 100% utilizando uma única
descarga de faísca.
Palavras-Chave: Ignição por Faísca, Chama Piloto, Melhoramento da Ignição.

II
ABSTRACT
In new water-heater units, called “intelligent”, the pilot flame only turns on when the hot
water tap is opened, instead of what happens in the older units where the pilot flame is
always lit. Therefore, these units must have a reliable pilot flame ignition system. In this
context, the objective of the present work was to study in detail a pilot flame system
(commercially available) in order to identify the causes that may contribute to the non
success of ignition and to propose a new pilot flame system with a higher ignition ability.
In order to accomplish this objective, a current pilot flame system was submitted to an
experimental characterization. Secondly, an experimental study was performed to
evaluate from the fundamental point of view the effect of mixture properties and
electrodes parameters on the success of spark discharge (occurrence of a spark discharge)
and on the success of ignition (sustained flame propagation after a spark discharge).
These experiments were performed controlling the electrodes spacing, d, to determine ds
(critical spark distance) and di (critical ignition distance), for a fixed voltage/energy
supply, varying equivalence ratio, temperature and humidity of the air, mean velocity of
the mixture, and electrodes diameter. Finally, based on all these results a new pilot flame
ignition system was proposed and experimental characterized/tested.
The experimental characterization of the current and the proposed pilot flame system
included: measurements of the velocity field at the pilot tube exit using the LDV technique,
determination of the primary equivalence ratio and high-speed cinematography
recordings of spark and flame development.
A new pilot flame system was proposed based on a new electrodes arrangement and on a
new pilot tube geometry. In this system the spark is discharged inside the pilot jet (in
contrast with the current system) which has a primary equivalence ratio, Øprim, of 1.27,
while the current system works with Øprim=2.27. The proposed pilot flame has 100% of
ignition probability using a single spark discharge.
Key-words: Spark Ignition, Pilot Flame, Ignition Improvement.

III
ACKNOWLEDGMENTS
I would like to express my deepest thanks to my advisor Professor Edgar Caetano
Fernandes for his scientific support, availability, friendship, and encouragement through
the course of this work. Working with Professor Edgar has been a great pleasure.
The present work was developed at the IN+ - Center for Innovation Technology and Policy
Research in Instituto Superior Técnico – Technical University of Lisbon (UTL).
I would like to thank to Eng. Luís Monteiro, Eng. Bruno Ribeiro and Eng. Sérgio Salustio
from BOSCH.
I would like to thank to Mário de Matos and other colleagues of Instituto de Soldadura e
Qualidade (ISQ) for their encouragement and support.
I am deeply grateful for the help of Ivo, Vânia, Filipa, Gonçalo, João, Janaína, Tiago, Teodoro
and all the others colleagues that have supported me in this work.
I would like to thank to my girlfriend Rute for her unconditional support and
encouragement, and for being always next to me.
I would like to thank all my friends who helped me in this long work, especially for their
words of encouragement, and all above, for their friendship.
I am grateful to my parents for their advices and encouragement during all the time.
IV
TABLE OF CONTENTS
RESUMO ......................................................................................................................................................................I
ABSTRACT ............................................................................................................................................................... II
ACKNOWLEDGMENTS ...................................................................................................................................... III
TABLE OF CONTENTS ........................................................................................................................................ IV
NOMENCLATURE ................................................................................................................................................. VI
LIST OF FIGURES.................................................................................................................................................. IX
LIST OF TABLES ................................................................................................................................................. XII
CHAPTER 1 -INTRODUCTION .......................................................................................................................... 1
1.1 Purpose and Objective – The Problem Under Analysis ..................................................... 1
1.2 Literature Review .............................................................................................................................. 4
1.2.1 Characteristics of Spark Discharges ...................................................................................... 5
1.2.2 Flame Initiation Process and Ignition Energy Requirements .................................. 12
1.3 Thesis Contribution ........................................................................................................................ 18
1.4 Thesis Outline ................................................................................................................................... 19
CHAPTER 2 –EXPERIMENTAL SETUP AND DIAGNOSTIC TECNIQUES ........................................ 20
2.1 Experimental Setup ........................................................................................................................ 21
2.2 Diagnostic Techniques .................................................................................................................. 27
2.2.1 Velocity Measurements ............................................................................................................ 27
2.2.2 High-speed Cinematography ................................................................................................. 29
2.2.3 Primary Equivalence Ratio Estimation .............................................................................. 30
2.2.4 “Up-and-Down” Method ........................................................................................................... 31
CHAPTER 3 – CURRENT PILOT FLAME SYSTEM ................................................................................... 35
3.1 Description of the System ............................................................................................................ 36
3.2 Experimental Characterization .................................................................................................. 37
3.2.1 Velocity Measurements and Primary Equivalence Ratio Estimation .................... 37
3.2.2 Ignition tests ................................................................................................................................. 40
V
3.2.3 High-Speed Cinematography ................................................................................................. 42
3.3 Discussion and Conclusions ........................................................................................................ 43
CHAPTER 4 - IGNITION ANALYSIS IN A MODEL BURNER ............................................................... 46
4.1 Introduction ....................................................................................................................................... 47
4.2 Results and Discussion .................................................................................................................. 50
4.2.1 Critical Spark Distance - ds ...................................................................................................... 51
4.2.2 Critical Ignition Distance -di ................................................................................................... 52
4.3 Discussion and Conclusions ........................................................................................................ 58
CHAPTER 5 – PROPOSED PILOT FLAME SYSTEM ................................................................................ 62
5.1 Improvement of Air Entrainment ............................................................................................. 63
5.2 Proposed Pilot Flame System ..................................................................................................... 67
5.3 Discussion and Conclusions ........................................................................................................ 73
CHAPTER 6 - CONCLUSIONS .......................................................................................................................... 74
REFERENCES ........................................................................................................................................................ 79
APPENDIX 1 .......................................................................................................................................................... 81
APPENDIX 2 .......................................................................................................................................................... 82
APPENDIX 3 .......................................................................................................................................................... 82

VI
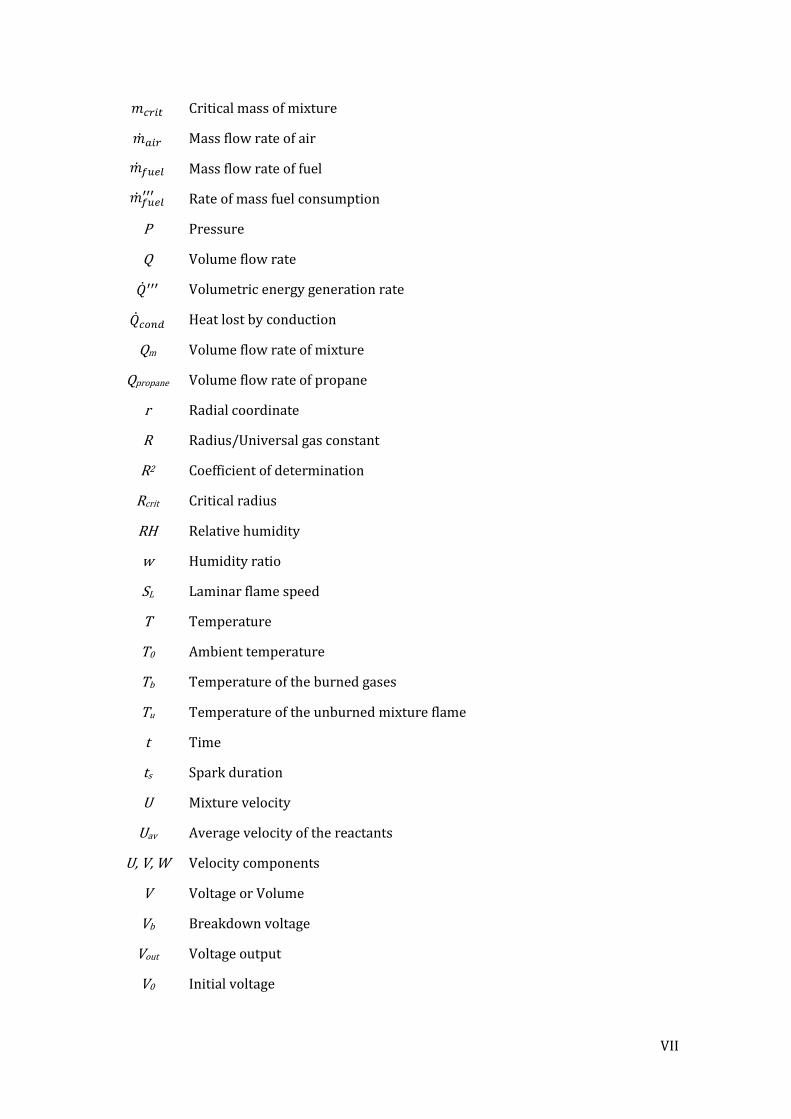
NOMENCLATURE
Arabic characters
A Ionization coefficient
A3 Internal area of the pilot tube
A4 Internal area of the pilot tube exit
B Ionization coefficient
cp Constant-pressure specific heat
cp,b Constant-pressure specific heat of burned gas
Dtube Internal diameter of the pilot tube
d Electrodes spacing
d0 Electrodes diameter
di Critical ignition distance
dq Quenching distance
ds Critical spark distance
EAbs.min Absolute minimum of minimum ignition energy
Heat release by chemical reaction
EConduction Energy losses by heat conduction to the electrodes
ELosses Energy losses
Emin Minimum ignition energy
EPlasma Energy released in the plasma volume
ERadiation Energy losses by thermal radiation
ESupplied Supplied electric energy
gB Blowoff gradient
gF Flashback gradient
Δhc Heat of combustion
I Current
k Thermal conductivity
Mass flow rate
VII
Critical mass of mixture
Mass flow rate of air
Mass flow rate of fuel
Rate of mass fuel consumption
P Pressure
Q Volume flow rate
Volumetric energy generation rate
Heat lost by conduction
Qm Volume flow rate of mixture
Qpropane Volume flow rate of propane
r Radial coordinate
R Radius/Universal gas constant
R2 Coefficient of determination
Rcrit Critical radius
RH Relative humidity
w Humidity ratio
SL Laminar flame speed
T Temperature
T0 Ambient temperature
Tb Temperature of the burned gases
Tu Temperature of the unburned mixture flame
t Time
ts Spark duration
U Mixture velocity
Uav Average velocity of the reactants
U, V, W Velocity components
V Voltage or Volume
Vb Breakdown voltage
Vout Voltage output
V0 Initial voltage
VIII
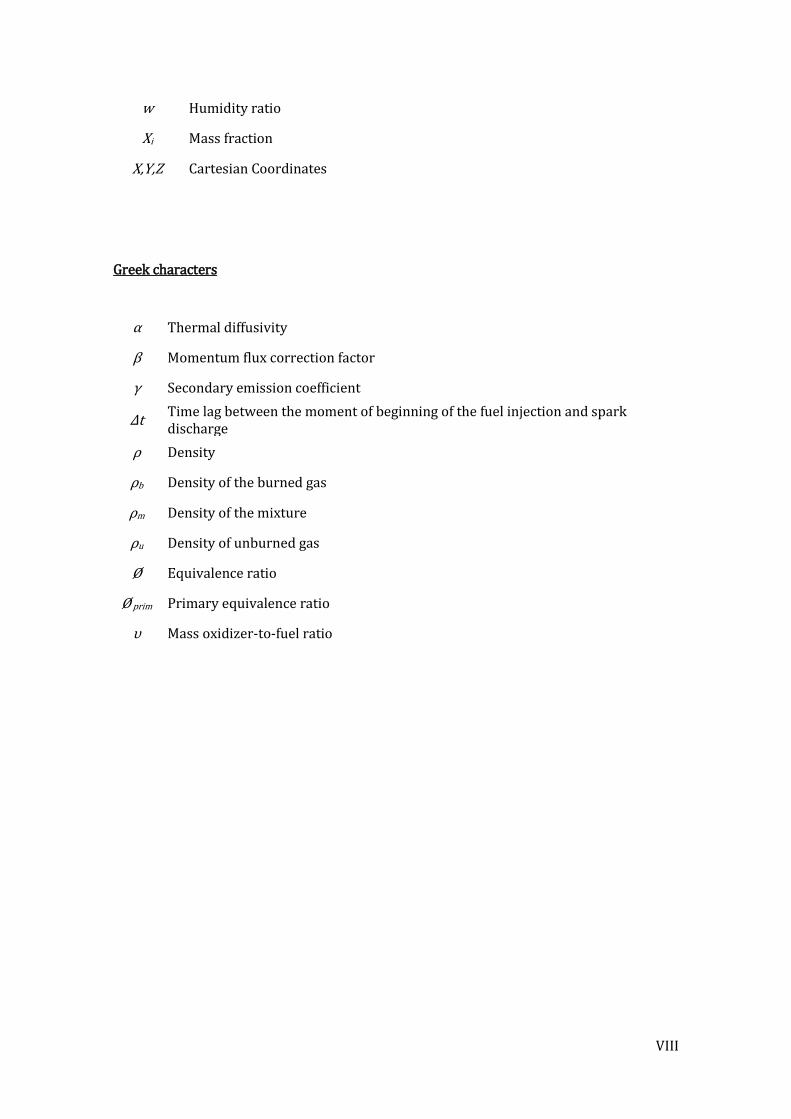
w Humidity ratio
Xi Mass fraction
X,Y,Z Cartesian Coordinates
Greek characters
α Thermal diffusivity
β Momentum flux correction factor
γ Secondary emission coefficient
Δt Time lag between the moment of beginning of the fuel injection and spark discharge
ρ Density
ρb Density of the burned gas
ρm Density of the mixture
ρu Density of unburned gas
Ø Equivalence ratio
Ø prim Primary equivalence ratio
υ Mass oxidizer-to-fuel ratio
IX
LIST OF FIGURES
Figure 1.1: Pilot burner tube location on the water-heater unit and its geometry. ...................................... 2
Figure 1.2: Representation of a spark discharge within the electrodes with a resume of the
important parameters that influences the spark ignition process. ...................................................................... 4
Figure 1.3: Representation of the electrodes and mixture conditions, at the moment just before the
spark discharge ............................................................................................................................................................................ 5
Figure 1.4: Breakdown voltages in various gases over a wide range of Pd values, called Paschen’s
curves, from [5]. .......................................................................................................................................................................... 6
Figure 1.5: Breakdown voltages in function of pressure and electrodes spacing for quiescent air
mixtures. ......................................................................................................................................................................................... 7
Figure 1.6: Schematic diagrams of voltage and current of typical spark ignition systems as functions
of discharge time, illustrating the six basic discharge phases. The actual values depend of the
electrical components of the discharge circuit; some typical values are given in parentheses [8]. ...... 8
Figure 1.7: Model of spark discharge in flowing mixture, showing lengthening of discharge path
with time (t) [2]. ....................................................................................................................................................................... 10
Figure 1.8: Comparison between the supplied electrical energy and the total energy transferred to
the plasma by the three discharge modes under quiescent conditions [9]. .................................................. 11
Figure 1.9: Effect of change in the energy supplied upon flame propagation, 5mJ and 50mJ
respectively. Schlieren photographs of the propagation of flame from an electric spark in vertical
gas stream and its relative time to the spark discharge, from [13]. .................................................................. 12
Figure 1.10: Schematic representation of the critical volume of gas for spark ignition .......................... 14
Figure 1.11: Minimum ignition energy in function of the electrodes spacing for quiescent and
flowing mixtures. ..................................................................................................................................................................... 16
Figure 1.12: Minimum ignition energy dependency of the equivalence ratio for quiescent and
flowing mixtures. ..................................................................................................................................................................... 17
Figure 1.13: Effect of the temperature on minimum ignition energy in flowing mixtures [2] ............. 18
Figure 2.1 Configuration of the pilot burner: a) Schematic representation; b), c) Photographs. ........ 21
Figure 2.2: Configuration of the model burner. a) Schematic representation; b), c) Photographs. ... 23
Figure 2.3: Velocity profiles of the mean and root mean square of the axial velocity at 1.5mm of the
model burner exit for different flow rates. ................................................................................................................... 23
Figure 2.4: Air and fuel conditioning system. a) Schematic representation, b) Photograph ................. 24
Figure 2.5: Temperature and humidity range of the air ......................................................................................... 25
X
Figure 2.6: Data flow in the real-time acquisition system ..................................................................................... 26
Figure 2.7: LDV system with the signal acquisition configuration and the seeded atmosphere setup.
.......................................................................................................................................................................................................... 27
Figure 2.8: Seeding setup and LDV laser beams. ....................................................................................................... 29
Figure 2.9: High-speed digital camera Phantom V4.2 with the Micro-Nikkor 60mm f/2.8D lens
mounted. ...................................................................................................................................................................................... 30
Figure 2.10: “Up-and-Down” method procedure....................................................................................................... 32
Figure 2.11: Typical result of a critical ignition distance experiment .............................................................. 33
Figure 3.1: Drawing of the current pilot flame system with the components relative distances and
detail pictures from different parts of the system: ................................................................................................... 36
Figure 3.2: Velocity profiles of the current pilot tube with coil and without the coil: .............................. 38
Figure 3.3: Histogram of the measured time series of the radial velocity at bottom of the current
pilot coil between its turns .................................................................................................................................................. 39
Figure 3.4: Pilot flame of the current system at nominal conditions. ............................................................... 40
Figure 3.5: Schematic explanation of the time lag, Δt. between the moment of beginning of the fuel
injection and spark discharge. ........................................................................................................................................... 40
Figure 3.6: Results of the ignition tests of the current pilot flame system from Bosch ............................ 41
Figure 3.7: Frames of the earliest moments of a current pilot flame system typical ignition process.
The images time shown is the time of the capture of the image relative to the image (b). .................... 42
Figure 3.8: Representation of the primary equivalence ratio of the current pilot flame system in a
graph of minimum ignition energy function of the equivalence ratio, for propane-air quiescent
mixtures from [1]. .................................................................................................................................................................... 44
Figure 3.9: Representation of the spark discharge location in the current pilot flame system. ........... 44
Figure 3.10: Representation of the electrodes configuration proposal. .......................................................... 45
Figure 4.1: Schematic diagram of the critical spark distance and the critical ignition distance. ......... 47
Figure 4.2: Representation of heat fluxes involved in spark ignition process. ............................................ 48
Figure 4.3: Relation between the absolute minimum ignition energy and quenching distance with
the constant supplied energy and the critical ignition distance. ........................................................................ 49
Figure 4.4: Representation of relations between variables in function of the equivalence ratio. ....... 49
Figure 4.5 : Summary of the tested conditions. .......................................................................................................... 50
Figure 4.6: The influence of the humidity of the air, mixture temperature, equivalence ratio and
electrodes diameter on the critical spark distance. .................................................................................................. 51
XI
Figure 4.7: Critical ignition distance and minimum ignition energy in function of the equivalence
ratio. ............................................................................................................................................................................................... 53
Figure 4.8: Frames of the spark ignition process for different electrode spacing, ..................................... 54
Figure 4.9: Effect of the mixture temperature on the critical ignition distance. ......................................... 55
Figure 4.10: Effect of the humidity on the critical ignition distance. ................................................................ 56
Figure 4.11: Effect of the humidity ratio on the critical ignition distance. ..................................................... 56
Figure 4.12: Critical ignition distance dependency of the mixture velocity. ................................................. 57
Figure 4.13: Effect of the d0 on the critical ignition distance. .............................................................................. 58
Figure 4.14: Critical spark distance and critical ignition distance. .................................................................... 59
Figure 4.15: Effect of the humidity on the working area in propane-air mixtures. ................................... 60
Figure 4.16: Effect of the electrode diameter on the working area. .................................................................. 61
Figure 5.1: Schematic drawing of the pilot tube system with the different sections used in the
entrainment model. ................................................................................................................................................................ 63
Figure 5.2: Computation of the Øprim dependency of the Dtube. ............................................................................ 64
Figure 5.3: New pilot tube geometry. ............................................................................................................................. 64
Figure 5.4: Velocity profiles of the new pilot tube geometry with Dtube=4.8 mm (a and b)and 6.5mm
(c and d). ...................................................................................................................................................................................... 65
Figure 5.5: Comparison between the experimental and the theoretical model results. .......................... 66
Figure 5.6: Proposed pilot flame ignition system. ..................................................................................................... 67
Figure 5.7: Representation of the Øprim of the proposed pilot flame system and the proposed d in a
graph of the ds dependency of the Ø................................................................................................................................ 68
Figure 5.8: Graphs and images of the pilot flame characteristics in function of the Qpropane. ................. 69
Figure 5.9: Operation limits of a Bunsen burner for a propane-air mixture with Ø=1.27 . ................... 70
Figure 5.10: Frames of the earliest moments of a proposal pilot flame system typical ignition
process. The images time shown is the time of the capture of the image relative to the image (b). . 72
Figure 6.1: Schematic drawing of the current pilot flame system. .................................................................... 76
Figure 6.2: Schematic drawing of the proposed pilot flame system. ............................................................... 76
Figure 6.3: Representation of the Øprim of the current and proposed system in a graph of Emin as
function of Ø, for propane-air quiescent mixtures [1]. ........................................................................................... 77
Figure 6.4: Schematic representation of the effect of the humidity ratio on ds and di curves. .............. 78
Figure 6.5: Comparison between the ignition probability in proposed and current systems. ............. 78
XII
Figure A1.1: Scheme of the amplifier circuit…………………………………………………………..………..………….81
Figure A2.1: Graphical code of the developed LabView program……………………………………….…….…..82
LIST OF TABLES
Table 1.1: Energy balance for the three discharge modes in air [7]. ................................................................ 11
Table 2.1: The LDV system main characteristics. ...................................................................................................... 28
Table 2.2: Resumed characteristics of the high-speed camera and the optical system ........................... 30
Table 5.1: Resume of the ignition tests made in the proposed pilot flame system. ................................... 71
Table A1.1: Main characteristics of the AMPO2E ...................................................................................................... 81
1
CHAPTER 1
INTRODUCTION
1.1 Purpose and Objective – The Problem Under Analysis
In a commercial water-heater unit the aim of the pilot flame is to ignite several burner
flutes that exist inside, as shown in Fig. 1.1. In new water-heater units, called “intelligent”,
the pilot flame only turns on when the hot water tap is opened, instead of what happens in
conventional units where the pilot flame is always lit. This solution brings an
improvement in the energy efficiency of the unit, eliminating the fuel consumption of the
pilot flame during period when hot water is not required.

2
These units must have a reliable pilot flame ignition system in order to provide hot water
when is needed. However, sometimes, the pilot mixture does not ignite, causing
inconvenience for users. This occurrence is more frequent in specific countries, suggesting
that it is being associated with the local gas supply and eventually atmospheric conditions
as ambient temperature and humidity.
Fig. 1.1c-d) shows the main components of a pilot flame ignition system, which are: the
pilot burner tube, the fuel injector, the electrode and the spark discharge unit. Since the
fuel injector is detached from the pilot burner tube, ambient air is entrained by the gas jet
both enter the pilot burner tube. At the exit of the pilot tube, the mixture forms a free jet
where again ambient air is entrained: secondary air entrainment. The spark discharge unit
supplies several successive spark discharges with a predefined time interval of 100ms
until a flame is established.
Figure 1.1: Pilot burner tube location on the water-heater unit and its geometry.
a) Water-heater unit
b) Location of the pilot burner in the water-heater
c) Pilot burner geometry
d) Schematic representation of the pilot flame ignition system.
In order to ignite a mixture it is necessary to add a certain amount of energy to it, which in
this case is provided by a spark. The amount of energy depends, among other factors, on
the equivalence ratio [1]. In jet flames, when air-fuel mixture is not controlled, the
equivalence ratio is spatially distributed, suggesting that the success of ignition is
influenced by the electrode position and arrangement. In addition, when the jet flames are
partially premixed the value of the local equivalence ratio depends on the upstream
conditions such as fuel injector and pilot tube geometry.
( a)
( b)
( c)
Air
Fuel
Injector
Primary
Air-Fuel
Mixture
Electrode
Secondary Air
Entrainment
Spark
discharge
unit
( d)
Air
Fuel
Injector
Primary
Air-Fuel
Mixture
Electrode
Secondary Air
Entrainment
Spark
discharge
unit

3
The flow properties, such as the mean velocity, also have an effect on the amount of energy
required for ignition [2,3]. Ambient air conditions as temperature and humidity may be
other important factors that influence the success of ignition (sustained flame propagation
after a spark discharge).
In order to increase the occurrence of successful ignitions, the present work intends to
study a current pilot flame system, analyse the effect of parameters as equivalence ratio,
temperature, humidity, mean velocity, electrodes spacing and electrodes diameter on the
success of spark discharge (occurrence of a spark discharge) and on success of ignition,
and based on all these results to propose a new pilot system.
To accomplish these objectives, it was firstly submitted the current pilot flame system to
an experimental characterization, where it was taken into account: measurements of the
velocity field at the burner exit, determination of the primary equivalence ratio, ignition
tests and recordings the earliest moments of the flame ignition.
The effects of mixture properties and electrode parameters on success of the spark
discharge and on success of ignition the spark ignition were performed by controlling the
electrodes spacing, which became a most important variable since it defines the ability of
the system (for a fixed voltage/energy supply) to have a spark and a flame. These tests
were conducted in a model burner, which ensures constant properties of the flowing
mixture within electrodes. The mixture was supplied with different temperature and
humidity levels, using a developed air and fuel conditioning system.
Finally, with all the results obtained, a new pilot flame ignition system was proposed. The
new system was experimentally characterized according with the same procedure of the
current system.

4
1.2 Literature Review
The spark ignition is the first and most prevalent form of forced ignition [4], present in:
internal combustion engines, gas turbines, industrial burners and domestic stoves and
water heater units.
To ignite a mixture using spark ignition it is necessary, firstly, to have a spark discharge
and secondly the energy added by the spark to the mixture must be enough to cause a self-
sustained flame. With these two conditions a successful ignition is accomplished.
The spark discharge and the success of ignition are dependent on various factors, which
are related with the electrodes geometry parameters [1,2,5-7], spark discharge
parameters [2,5,7-9] and properties of the mixture [1-3,10-12], as it is summarized
schematically in Fig. 1.2. The relevant electrodes parameters are: spacing (d), electrodes
diameter (d0), electrode material and tip geometry. The mixture and flow parameters are:
equivalence ratio (Ø), mixture mean velocity (U), temperature (T), and humidity of air
(relative humidity RH or humidity ratio w). The important spark discharge parameters
are: supplied energy (Esupplied), spark duration (ts), discharge mode, and the initial voltage
between the electrodes (V0).
Figure 1.2: Representation of a spark discharge within the electrodes with a resume of the
important parameters that influences the spark ignition process.
Mixture and flow parameters:Equivalence ratio, ØMean velocity UTemperature, THumidity, RH or w
Spark discharge parameters:Supplied energy, Esupplied
Spark duration, ts
Discharge modeInitial voltage, V0
Electrode geometric parameters:Electrode distance, dElectrode diameter, d0
Electrode materialElectrode tips geometry

5
In this literature review, the characteristics of spark discharges are described in Section
1.2.1, and the flame initiation process and ignition energy requirements are presented in
Section 1.2.2.
1.2.1 Characteristics of Spark Discharges
The first step of the spark ignition process is presented in this section, encompassing: the
requirements to have a spark discharge (breakdown voltage), the spark discharge process,
the spark shape and the energy transfer efficiencies.
Breakdown Voltage
At the moment just before the spark discharge, a gas mixture at a pressure (P) is within
two electrodes. The electrodes have spacing (d), a diameter (d0), an applied initial voltage
(V0) and are constituted with an electrode material, as shown in Fig.1.3.
Figure 1.3: Representation of the electrodes and mixture conditions, at the moment just before
the spark discharge
An electric spark discharge occurs between the electrodes when the electric field reaches
the breakdown voltage (Vb), which is the lowest voltage that will cause a spark to be
established between the electrodes [2]. Paschen’s law (established experimentally in
1889) states that, Vb=f(Pd), which means that the breakdown voltage in a uniform field
gap (d0/d→∞) is a unique function of the product of pressure and the electrodes spacing
for a particular gas mixture and electrode material [5].
d0 d
Mixture
V0
Electrode Material
P
AnodeCathode
6
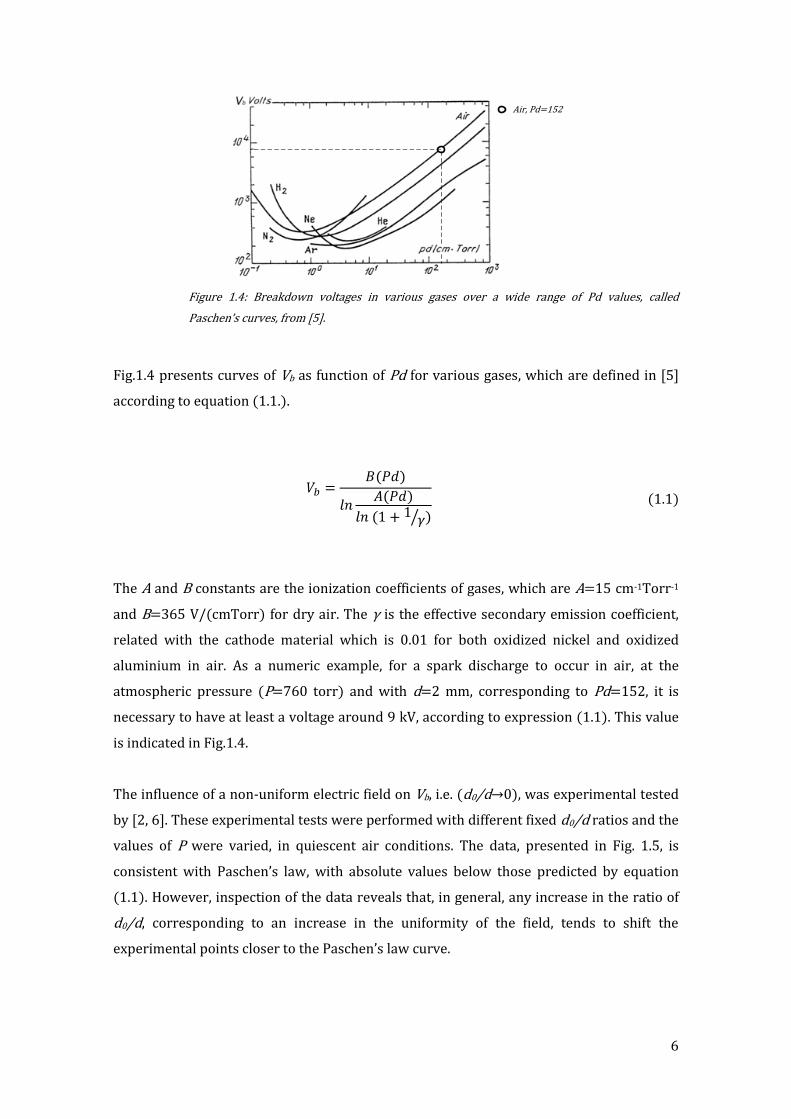
Figure 1.4: Breakdown voltages in various gases over a wide range of Pd values, called
Paschen’s curves, from [5].
Fig.1.4 presents curves of Vb as function of Pd for various gases, which are defined in [5]
according to equation (1.1.).
(1.1)
The A and B constants are the ionization coefficients of gases, which are A=15 cm-1Torr-1
and B=365 V/(cmTorr) for dry air. The γ is the effective secondary emission coefficient,
related with the cathode material which is 0.01 for both oxidized nickel and oxidized
aluminium in air. As a numeric example, for a spark discharge to occur in air, at the
atmospheric pressure (P=760 torr) and with d=2 mm, corresponding to Pd=152, it is
necessary to have at least a voltage around 9 kV, according to expression (1.1). This value
is indicated in Fig.1.4.
The influence of a non-uniform electric field on Vb, i.e. (d0/d→0), was experimental tested
by [2, 6]. These experimental tests were performed with different fixed d0/d ratios and the
values of P were varied, in quiescent air conditions. The data, presented in Fig. 1.5, is
consistent with Paschen’s law, with absolute values below those predicted by equation
(1.1). However, inspection of the data reveals that, in general, any increase in the ratio of
d0/d, corresponding to an increase in the uniformity of the field, tends to shift the
experimental points closer to the Paschen’s law curve.
Air, Pd=152
7
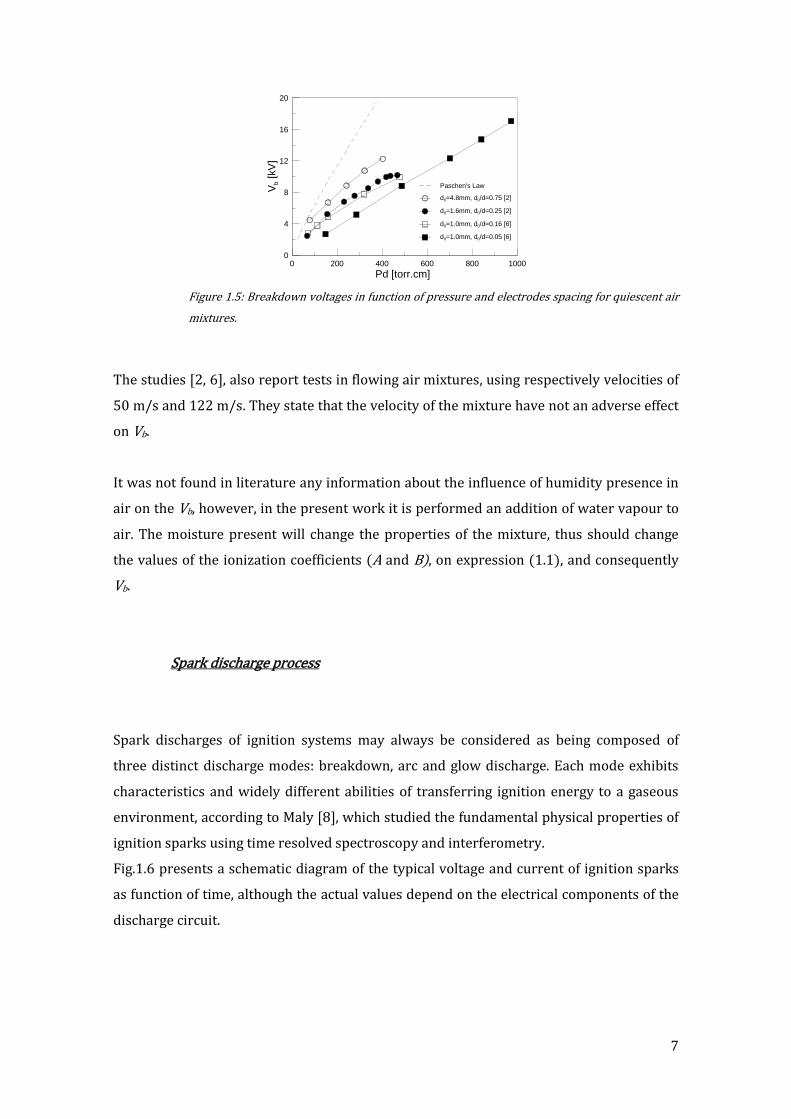
Figure 1.5: Breakdown voltages in function of pressure and electrodes spacing for quiescent air
mixtures.
The studies [2, 6], also report tests in flowing air mixtures, using respectively velocities of
50 m/s and 122 m/s. They state that the velocity of the mixture have not an adverse effect
on Vb.
It was not found in literature any information about the influence of humidity presence in
air on the Vb, however, in the present work it is performed an addition of water vapour to
air. The moisture present will change the properties of the mixture, thus should change
the values of the ionization coefficients (A and B), on expression (1.1), and consequently
Vb.
Spark discharge process
Spark discharges of ignition systems may always be considered as being composed of
three distinct discharge modes: breakdown, arc and glow discharge. Each mode exhibits
characteristics and widely different abilities of transferring ignition energy to a gaseous
environment, according to Maly [8], which studied the fundamental physical properties of
ignition sparks using time resolved spectroscopy and interferometry.
Fig.1.6 presents a schematic diagram of the typical voltage and current of ignition sparks
as function of time, although the actual values depend on the electrical components of the
discharge circuit.
0 200 400 600 800 1000
Pd [torr.cm]
0
4
8
12
16
20
Vb [
kV
]
Paschen's Law
d0=4.8mm, d0/d=0.75 [2]
d0=1.6mm, d0/d=0.25 [2]
d0=1.0mm, d0/d=0.16 [6]
d0=1.0mm, d0/d=0.05 [6]
8
(a) (b)
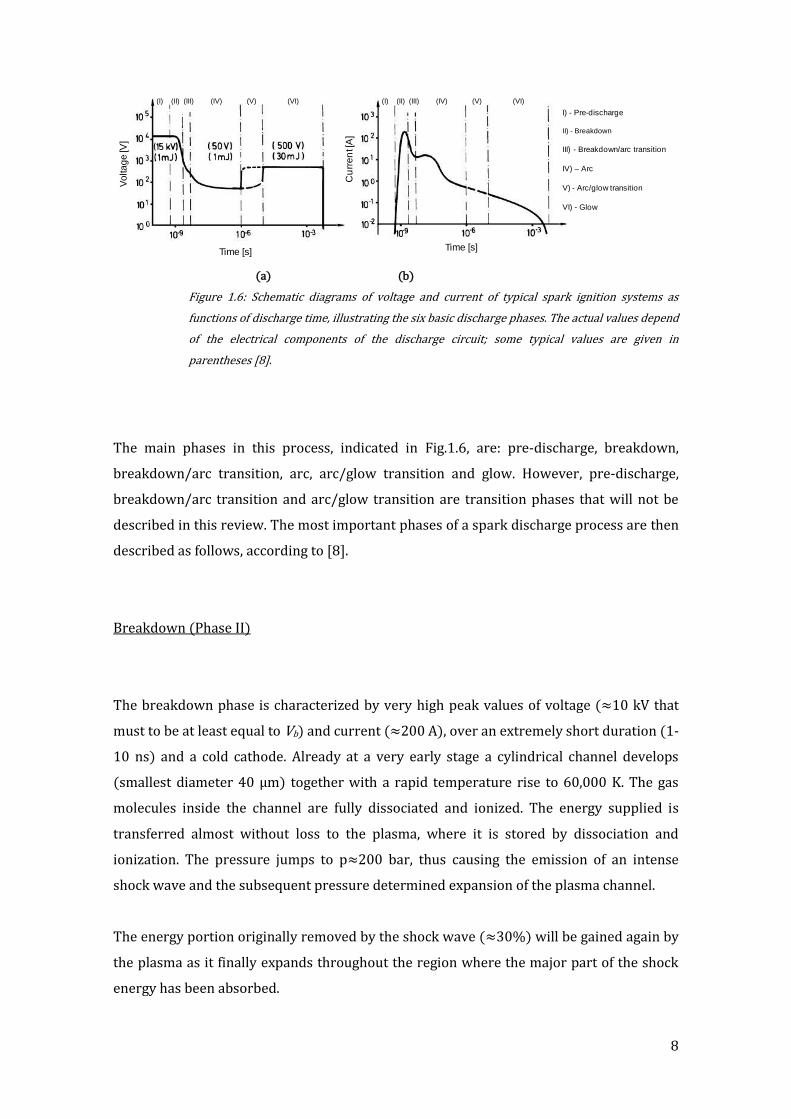
Figure 1.6: Schematic diagrams of voltage and current of typical spark ignition systems as
functions of discharge time, illustrating the six basic discharge phases. The actual values depend
of the electrical components of the discharge circuit; some typical values are given in
parentheses [8].
The main phases in this process, indicated in Fig.1.6, are: pre-discharge, breakdown,
breakdown/arc transition, arc, arc/glow transition and glow. However, pre-discharge,
breakdown/arc transition and arc/glow transition are transition phases that will not be
described in this review. The most important phases of a spark discharge process are then
described as follows, according to [8].
Breakdown (Phase II)
The breakdown phase is characterized by very high peak values of voltage (≈10 kV that
must to be at least equal to Vb) and current (≈200 A), over an extremely short duration (1-
10 ns) and a cold cathode. Already at a very early stage a cylindrical channel develops
(smallest diameter 40 μm) together with a rapid temperature rise to 60,000 K. The gas
molecules inside the channel are fully dissociated and ionized. The energy supplied is
transferred almost without loss to the plasma, where it is stored by dissociation and
ionization. The pressure jumps to p≈200 bar, thus causing the emission of an intense
shock wave and the subsequent pressure determined expansion of the plasma channel.
The energy portion originally removed by the shock wave (≈30%) will be gained again by
the plasma as it finally expands throughout the region where the major part of the shock
energy has been absorbed.
Vo
lta
ge
[V]
(II)(I) (III) (IV) (V) (VI) (II)(I) (III) (IV) (V) (VI)
Cu
rre
nt [
A]
Time [s] Time [s]
I) - Pre-discharge
II) - Breakdown
III) - Breakdown/arc transition
IV) – Arc
V) - Arc/glow transition
VI) - Glow
9
Arc and Glow (Phase IV and VI)
The arc and the glow discharge must always be preceded by a breakdown phase which
provides the conductive path between the electrodes necessary to start these discharges.
The arc voltage is very low (<100 V), although the current may be as high as the
impedances of the external circuit permit (500 mA to several kA). Only 1% of the particles
are ionized, but the degree of dissociation may be quite high in the central region of the
discharge. Cathode and anode falls constitute appreciable fractions of the arc voltage. The
corresponding energy portions however are conducted away by the metal electrodes and
considerable losses occur. As the arc requires a hot cathode spot, there is also severe
erosion (evaporation) of the cathode material. The arc expands mainly due to heat
conduction and mass diffusion, producing almost bell shaped temperature profiles. Due to
continuous energy losses, the equilibrium kernel gas temperature will be limited to
≈6,000 K. Temperature and degree of dissociation decrease rapidly with increasing
distance from the axis.
Currents less than 200 mA, a high cathode fall (300-500 V), a cold cathode and less than
0.01% ionization are typical for the glow discharge. Overall losses are higher than in the
arc, the equilibrium kernel gas temperature will be ≈3,000 K and the degree of
dissociation smaller.
Spark Shape
The spark discharge established between electrodes, ionizes a small channel of the gas. In
stagnant mixtures (U=0), the discharge passes in a straight line between the electrodes.
However, if the discharge occurs in a flowing gas, the local velocity field convects and the
ionized path moves downstream. The path of the spark was idealized by [2], as shown in
Fig.1.7. Actually, this idealisation does not consider a curved spark discharge as would be
expected at the vertices of the idealised path.

10
Figure 1.7: Model of spark discharge in flowing mixture, showing lengthening of discharge path
with time (t) [2].
The value of the spark length is d for stagnant mixtures and for flowing gases its value is
d+2Uts, according to [2]. The increase of spark length with velocity means that the energy
input is to be distributed over a larger volume, which leads to a decrease of the energy
density.
Energy transfer efficiency
The electric energy supplied in the spark gap, Esupplied, is the integration of V and I across
the gap over time, presented in expression (1.2). Due to the specific plasma properties, of
each discharge mode can transmit only fractions of the supplied electric energy into the
gas in the spark gap volume (1.3).
(1.2)
(1.3)
In Fig. 1.8 Esupplied and Eplasma under the three discharge modes are compared in quiescent
conditions [9]. Since the breakdown duration is extremely short, it is not dependent on the
gas velocity, and the quiescent data in Fig. 1.8 is applied in all cases.
t=t t=ts
UtsUt
d
Electrodes
Spark
U
11
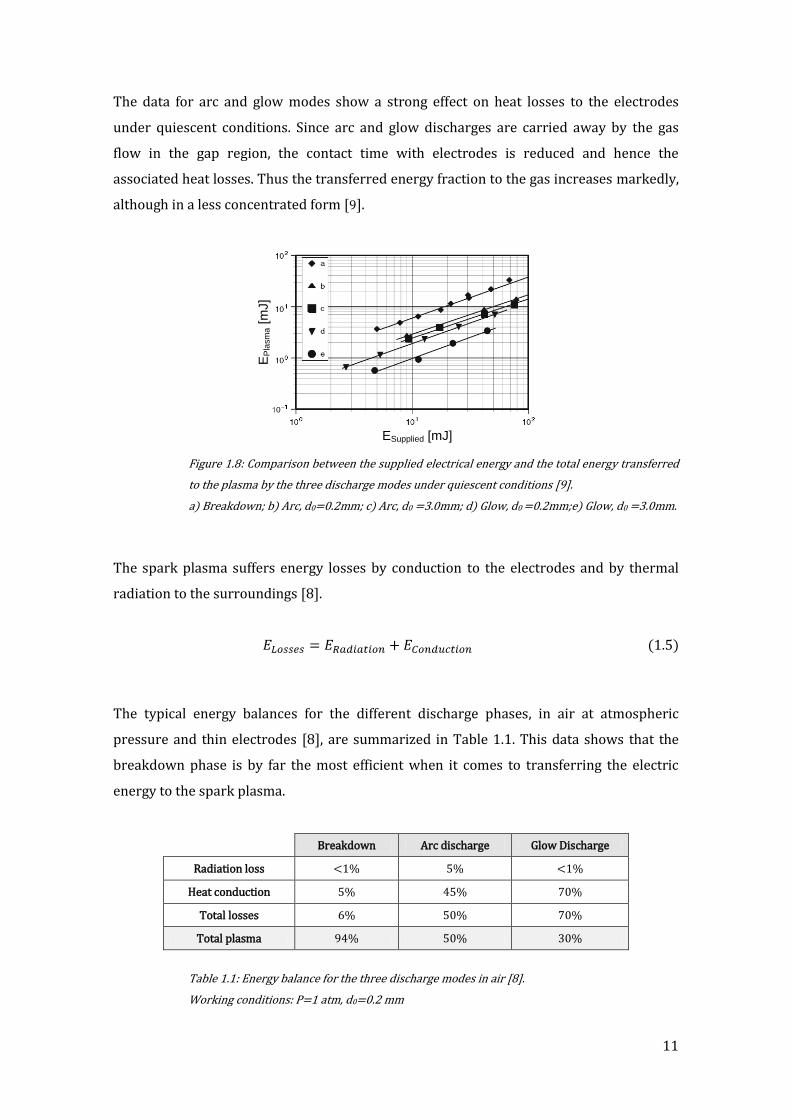
The data for arc and glow modes show a strong effect on heat losses to the electrodes
under quiescent conditions. Since arc and glow discharges are carried away by the gas
flow in the gap region, the contact time with electrodes is reduced and hence the
associated heat losses. Thus the transferred energy fraction to the gas increases markedly,
although in a less concentrated form [9].
Figure 1.8: Comparison between the supplied electrical energy and the total energy transferred
to the plasma by the three discharge modes under quiescent conditions [9].
a) Breakdown; b) Arc, d0=0.2mm; c) Arc, d0 =3.0mm; d) Glow, d0 =0.2mm;e) Glow, d0 =3.0mm.
The spark plasma suffers energy losses by conduction to the electrodes and by thermal
radiation to the surroundings [8].
(1.5)
The typical energy balances for the different discharge phases, in air at atmospheric
pressure and thin electrodes [8], are summarized in Table 1.1. This data shows that the
breakdown phase is by far the most efficient when it comes to transferring the electric
energy to the spark plasma.
Breakdown Arc discharge Glow Discharge
Radiation loss <1% 5% <1%
Heat conduction 5% 45% 70%
Total losses 6% 50% 70%
Total plasma 94% 50% 30%
Table 1.1: Energy balance for the three discharge modes in air [8].
Working conditions: P=1 atm, d0=0.2 mm
ESupplied [mJ]
EP
lasm
a [m
J]
12
1.2.2 Flame Initiation Process and Ignition Energy Requirements
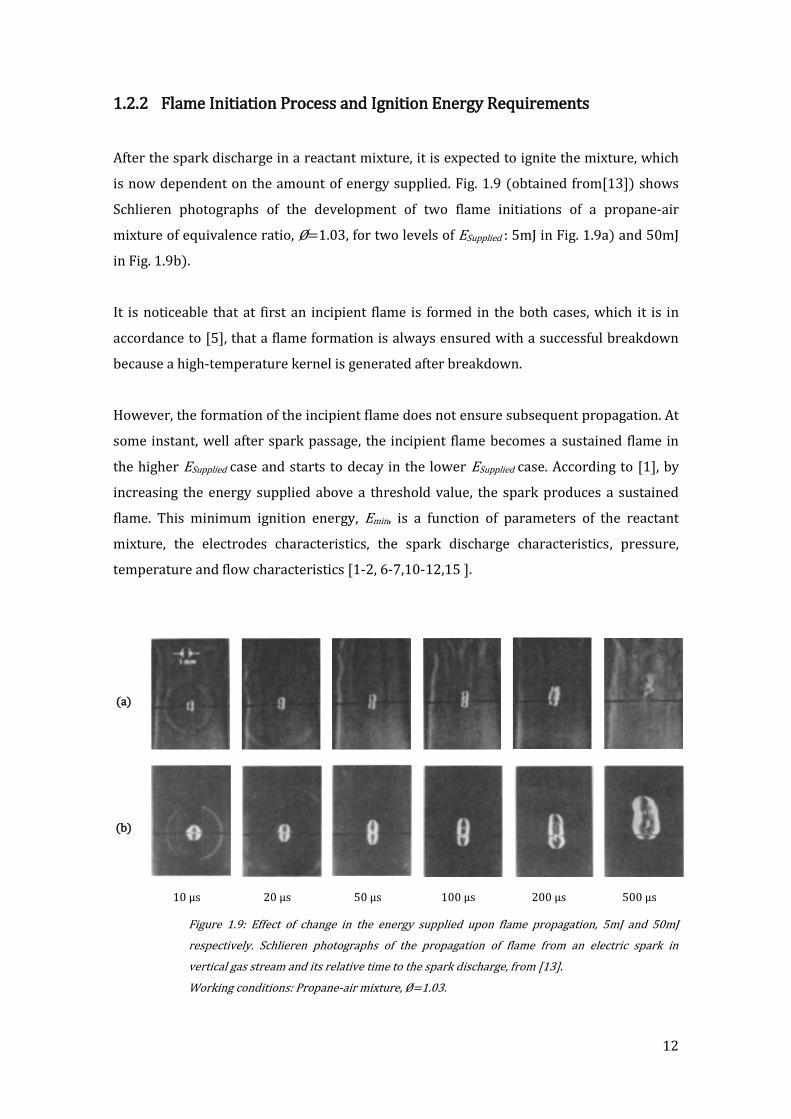
After the spark discharge in a reactant mixture, it is expected to ignite the mixture, which
is now dependent on the amount of energy supplied. Fig. 1.9 (obtained from[13]) shows
Schlieren photographs of the development of two flame initiations of a propane-air
mixture of equivalence ratio, Ø=1.03, for two levels of ESupplied : 5mJ in Fig. 1.9a) and 50mJ
in Fig. 1.9b).
It is noticeable that at first an incipient flame is formed in the both cases, which it is in
accordance to [5], that a flame formation is always ensured with a successful breakdown
because a high-temperature kernel is generated after breakdown.
However, the formation of the incipient flame does not ensure subsequent propagation. At
some instant, well after spark passage, the incipient flame becomes a sustained flame in
the higher ESupplied case and starts to decay in the lower ESupplied case. According to [1], by
increasing the energy supplied above a threshold value, the spark produces a sustained
flame. This minimum ignition energy, Emin, is a function of parameters of the reactant
mixture, the electrodes characteristics, the spark discharge characteristics, pressure,
temperature and flow characteristics [1-2, 6-7,10-12,15 ].
(a)
(b)
10 μs 20 μs 50 μs 100 μs 200 μs 500 μs
Figure 1.9: Effect of change in the energy supplied upon flame propagation, 5mJ and 50mJ
respectively. Schlieren photographs of the propagation of flame from an electric spark in
vertical gas stream and its relative time to the spark discharge, from [13].
Working conditions: Propane-air mixture, Ø=1.03.
13
Fig. 1.9 also shows, a spherical shock wave appearing in the field of view, during the early
growth of the flame, caused by the high pressure of the plasma in the breakdown phase
[8]. The gas flow produced by the secondary effect of the shock wave creates a toroidal
plasma kernel [16], with very steep gradients, a structure being most favourable for
ignition [9].
There are several thermal models, in the open literature which try to predict the Emin in
quiescent conditions. The various versions start from different ignition criteria. As
referred in [17], it is may be assumed that the ignition takes place when the amount of
heat released in the chemical reactions in the heated region becomes equal to the amount
of heat lost to the surroundings (Jost), or when the cooling time of the mixture heated to
the adiabatic flame temperature exceeds the characteristic time of the mixture of reaction
in the laminar flame front (Zeldovich), or ignition occurs when the mixture is supplied
with enough heat to heat a layer of a thickness to the adiabatic flame temperature of this
flame (Lewis), or, as referred in [18], the rate of heat production by chemical reaction
inside the slab must approximately balance the rate of heat loss from the slab by thermal
conduction (Williams).
The various models have in common that, they find a critical condition (defined by its own
criterion) that leads to establish a critical radius, Rcrit, and then is assumed that the Emin to
be supplied by the spark is the energy required to heat the critical gas volume from the
initial state to the flame temperature, i.e.,
(1.6)
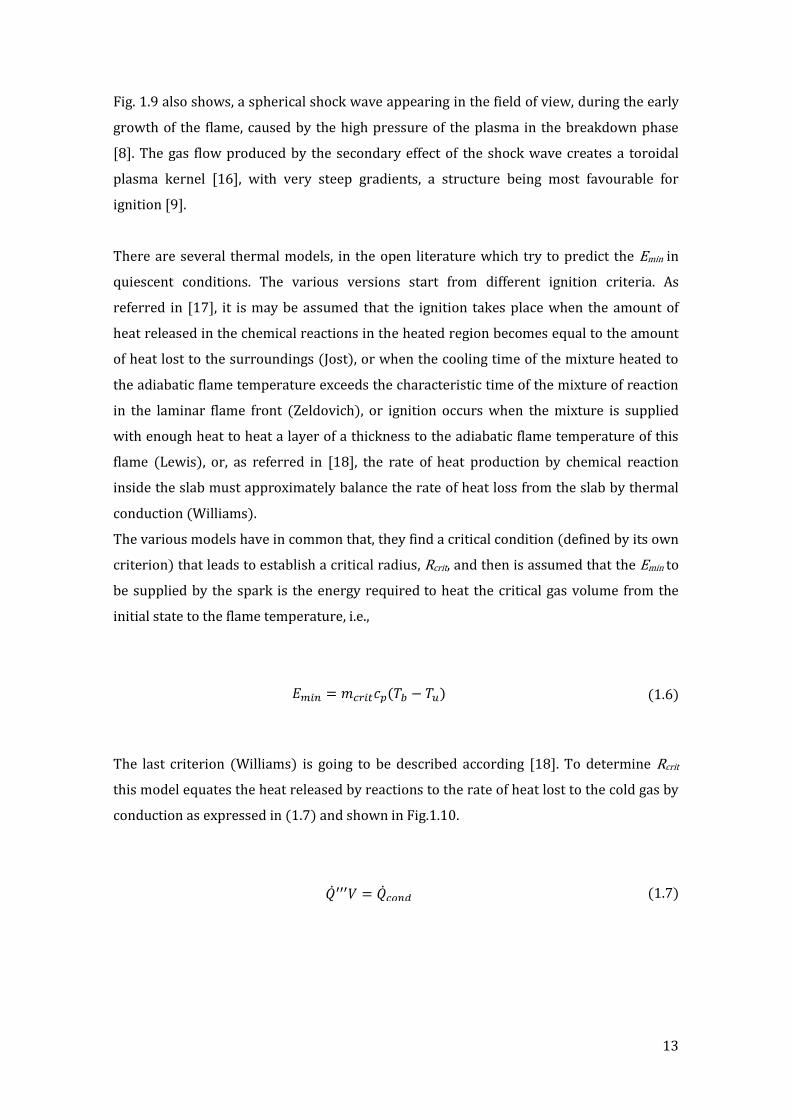
The last criterion (Williams) is going to be described according [18]. To determine Rcrit
this model equates the heat released by reactions to the rate of heat lost to the cold gas by
conduction as expressed in (1.7) and shown in Fig.1.10.
(1.7)
14
Figure 1.10: Schematic representation of the critical volume of gas for spark ignition
or
(1.8)
where, the surface area and volume of the sphere are expressed in terms of and
is the consumption rate of the fuel and Δhc is its heat of combustion.
(1.9)
Substituting equation (1.9) into (1.8) yields
(1.10)
Now substituting the relation of with for laminar flames
present in [18] and recognizing that
and , yields
(1.11)
T
rTbTu
Rcrit
0Qcond
Q V
15
Finally substituting the critical radius in equation (1.6), yields
(1.12)
One important fact in spark ignition is that the electrical energy is discharged through the
electrodes while the flame kernel develops around the electrodes. The contact of the flame
kernel with the electrodes is inevitable and results in energy losses, which are dependent
of the electrodes characteristics such as spacing and diameter. The energy losses to the
electrodes are not included in the William’s model.
Lewis and von Elbe [1] observed in a quiescent natural gas-air mixture, using a free
electrode and glass flanged tips, that by decreasing the electrodes spacing below a critical
distance Emin increases, as it is shown in Fig.1.11a). It is seen that for glass-flanged
electrodes the curve takes a rather sharp vertical turn, due to the glass plates have the
effect of suppressing ignition when the electrodes are approached to within a critical
distance. This critical distance was named the quenching distance, dq. The curve of the free
electrodes rises gradually with the electrodes spacing for distances below the quenching
distance, the quenching effect of small electrode tips can be compensated by an increasing
supplied of energy. It is noticeable, however, that the beginning of the rising part of the
free electrode curve coincides with the quenching distance of the glass flanged, that is, the
quenching effect, although much weaker, extends over the same electrodes spacing.
Increasing d above dq over a considerable range, Emin it is seen to be independent of the
electrodes spacing. The rise of Emin, for d larger than dq, is caused by the increase of the
spark plasma volume, being necessary to supply more energy in order to maintain a
constant energy density in the plasma which results in a constant temperature gradient in
the plasma surface [15]. The absolute minimum ignition energy is, therefore, the minimum
ignition energy at an electrodes spacing of the quenching distance.
A similar effect of the influence of the electrode spacing on the ignition of flowing gases
was found by [2], as presented in Fig. 1.11b). These results were obtained using a
propane-air mixture with 1.5 m/s velocity at a sub-atmospheric pressure of 0.1 atm and
various electrode diameters and configurations.
16
(a) (b)
Figure 1.11: Minimum ignition energy in function of the electrodes spacing for quiescent and
flowing mixtures.
a) Quiescent mixtures with free and glass flanged electrode tips [1].
Working conditions: Natural gas–air mixtures, Ø=1. d0=1.5 mm and glass flange
diameter=25mm, P=1 atm.
b) Flowing mixtures at sub-atmospheric pressure [2].
Working conditions: Propane-air mixture, Ø=1.3, P=0.1 atm, U=1.5 m/s,
The increase of the electrodes diameter, leads to increased surface of contact with the
flame kernel and consequent energy losses, increasing the value of the minimum ignition
energy in both quiescent [7], and flowing mixtures [2]. It is seen in Fig. 1.11b) that below
the quenching distance the electrodes with higher surface area require more energy input
for the same electrodes spacing.
The equivalence ratio is another important factor that affects the value of the minimum
ignition energy of a combustible mixture. Emin was determined systematically by [1], for
numerous quiescent mixtures of hydrocarbons, oxygen, and inert gas, at various
pressures, using glass-flanged electrodes. Fig. 1.12 shows Emin for a mixture of air and
various hydrocarbons at atmospheric pressure. It is remarkable that the minimum of the
Emin curves for these various compounds occur at nearly identical energy values.
It is noted also that the shift of the minima to richer-than-stoichiometric mixtures as the
number of carbon atoms in the fuel increases, which the authors attribute to a preferential
diffusion effect. The influence of flow parameters on Emin, for propane-air mixtures at sub-
atmospheric pressures, was studied by [3]. Fig. 1.12b) presentes Emin as function of the
equivalence ratio for different mixture velocities 0, 6 and 15 m/s.
0 0.5 1 1.5 2 2.5 3 3.5 4 4.5
d [mm]
0
3
6
9
12
Em
in [
mJ]
Free electrode
tips
Glass flanged
tips
5 10 15 20
d [mm]
10
20
30
40
50
60
Em
in [
mJ]
4.76mm rod
0.64mm rod
0.64mm needle
17
The curves of Emin of the flowing mixtures have a shape similar to that of the quiescent
mixtures but their values are higher and the rise is even sharper for deviations from the
minimum value of the curve. The increase of Emin for flowing mixtures is due to the
increase of the heated region by the spark with mixture velocity, along with higher heat
losses to the vicinity [2-3, 19].
Emin rises rapidly when the equivalence ratio moves away from the value at which the
minimum of Emin occurs (for quiescent and even more evident for flowing mixtures). This
result suggests that the improvement of the ignitability of mixtures is more effective for
the success of ignition than the improvement of the ignition system itself.
(a) (b)
Figure 1.12: Minimum ignition energy dependency of the equivalence ratio for quiescent and
flowing mixtures.
a) Quiescent combustible-air mixtures [1]
Working conditions: Glass-flanged electrodes, Pressure=1 atm.
b) Flowing propane-air mixtures at sub-atmospheric pressure [3].
Working conditions: P=0.17 atm.
The temperature of the mixture also affects Emin. Indeed, the increase of the mixture
temperature leads to a decrease of the minimum ignition energy due to the lower heat
requirement to heat up the mixture and also due to the lower temperature gradient
between the flame kernel and the electrodes and the surrounding air, reducing heat losses.
Fig. 1.13 shows the effect of the mixture temperature in Emin for a propane-air flowing
mixture at a sub-atmospheric pressure [2], which is consistent with the trend found by
[12] for quiescent mixtures.
Ø
Em
in[m
J]
Min
imu
m Ig
nitio
n E
ne
rgy [
mJ]
Equivalence Ratio
Min
imu
m Ig
nitio
n E
ne
rgy [m
J]
Equivalence Ratio
Min
imu
m Ig
nitio
n E
ne
rgy [m
J]
Equivalence Ratio Ø
Em
in[m
J]
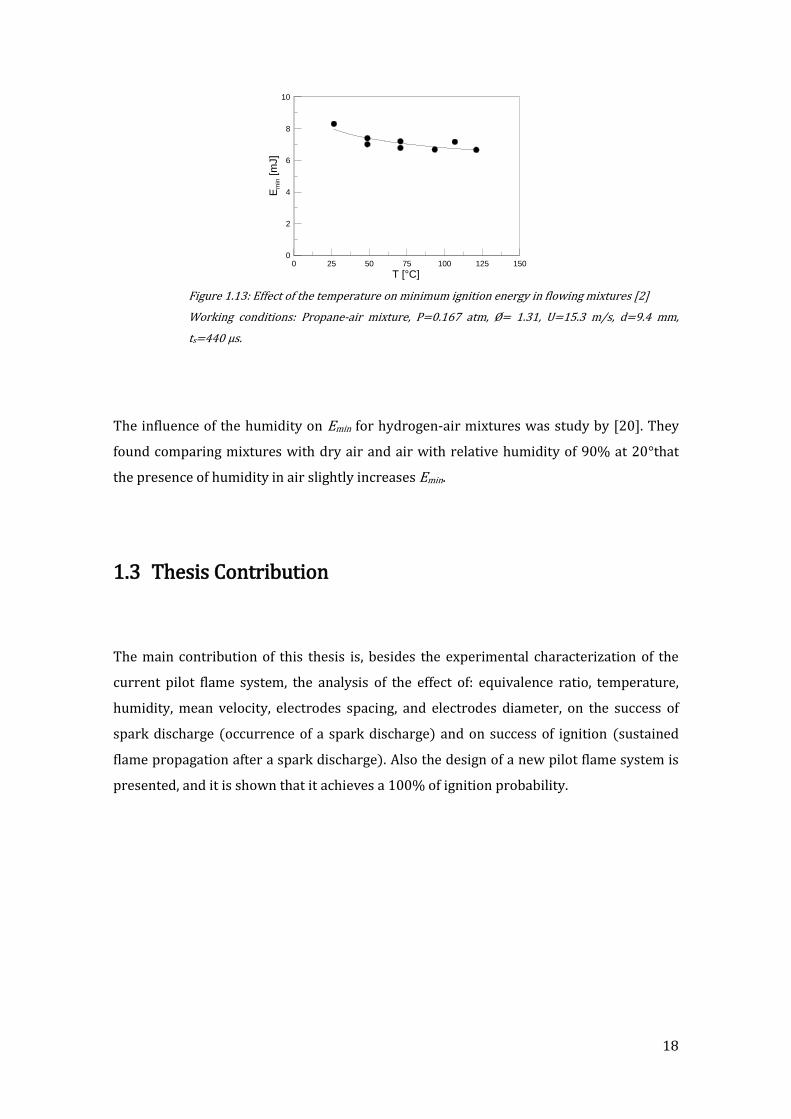
18
Figure 1.13: Effect of the temperature on minimum ignition energy in flowing mixtures [2]
Working conditions: Propane-air mixture, P=0.167 atm, Ø= 1.31, U=15.3 m/s, d=9.4 mm,
ts=440 μs.
The influence of the humidity on Emin for hydrogen-air mixtures was study by [20]. They
found comparing mixtures with dry air and air with relative humidity of 90% at 20°that
the presence of humidity in air slightly increases Emin.
1.3 Thesis Contribution
The main contribution of this thesis is, besides the experimental characterization of the
current pilot flame system, the analysis of the effect of: equivalence ratio, temperature,
humidity, mean velocity, electrodes spacing, and electrodes diameter, on the success of
spark discharge (occurrence of a spark discharge) and on success of ignition (sustained
flame propagation after a spark discharge). Also the design of a new pilot flame system is
presented, and it is shown that it achieves a 100% of ignition probability.
0 25 50 75 100 125 150
T [°C]
0
2
4
6
8
10
Em
in [
mJ]
19
1.4 Thesis Outline
The present thesis is divided in six Chapters, including the present Chapter 1.
Chapter 2 presents the experimental setup and the experimental diagnostic techniques
used in the present work.
In Chapter 3 the current pilot flame system is studied. The geometry and operation system
is described as well as the results of the experimental characterization of the system,
which include: velocity measurements, primary equivalence ratio determination, ignition
tests and recordings of the early moments of the ignition process.
Chapter 4 presents the results of an experimental study of the influence of mixture
properties and electrode parameters on the success of spark discharge and on the success
of ignition. The tests were conducted in a model burner and the tested variables were:
equivalence ratio, mixture velocity, mixture temperature, humidity of air, and electrode
diameter.
Chapter 5 presents the study of the proposed pilot flame system based on a new pilot tube
geometry, to improve air entrainment, and a new configuration and arrangement of the
electrodes.
In Chapter 6 the conclusions of the present work are taken.

20
CHAPTER 2 EXPERIMENTAL SETUP AN DIAGNOSTIC TECNIQUES
This chapter presents the experimental setup and techniques used this work.
21
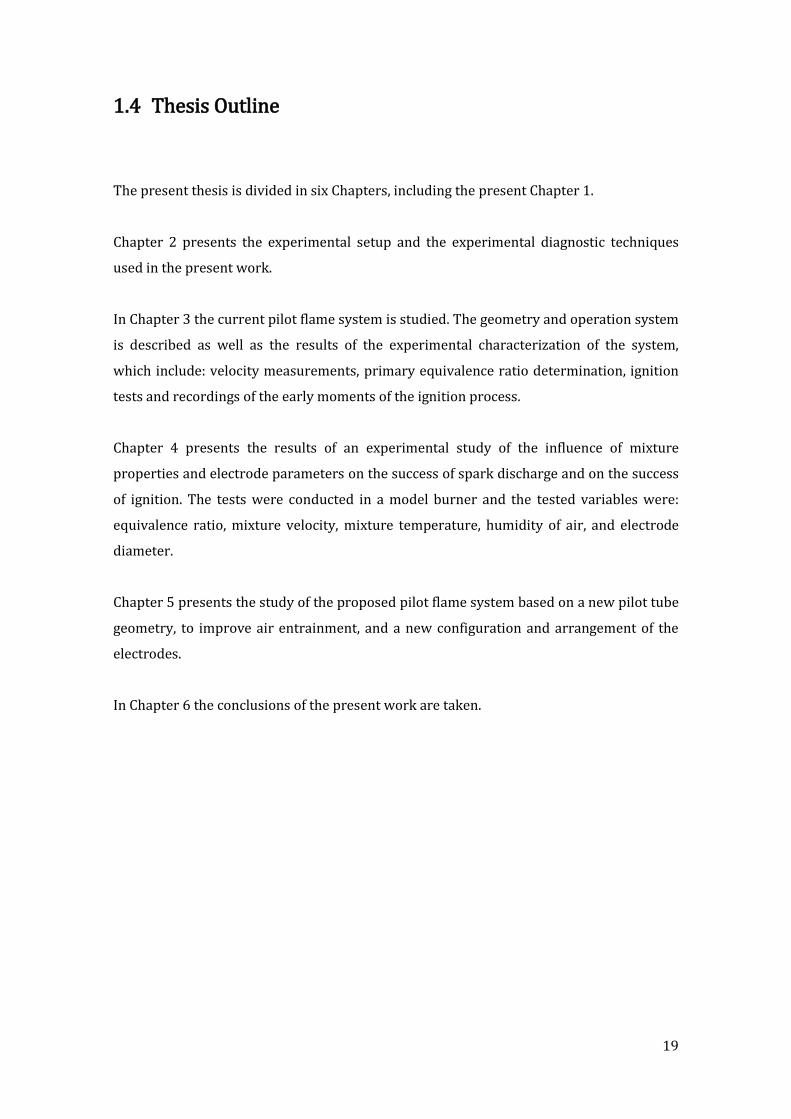
2.1 Experimental Setups
During this work two main experimental configurations were used: the configuration of
the pilot burner, presented in Fig. 2.1, and the configuration of the model burner,
presented in Fig. 2.2.
The configuration of the pilot burner, Fig. 2.1, was used to conduct ignition experiments
with different pilot tubes and electrodes geometries. In the ignition experiments, several
independent single spark discharges were performed and the number of ignition
successes and ignition failures were counted. The sparks were provided by the spark
discharge unit present in a current pilot flame system from Bosch. The energy supplied by
the sparks is constant, around 5 mJ, according to the manufacturer. This unit is powered
by two regular AA batteries with 1.5 V as is possible to observe in Fig.2.2.
(a)
(b)
(c)
Figure 2.1 Configuration of the pilot burner: a) Schematic representation; b), c) Photographs.
Propane/Methane Tank
Electronic Flowmeter
FuelInjector
Pilot tube
XY
Z
XY
Z
Spark Discharge Unit
Thermocouple & Humidity sensor
Support and Positioning System
Data acquisition and processing
Electrode

22
In this experimental configuration the position of the injector and of the electrode was
controlled by X-Y-Z micro positioning stages, which allow tri-dimensional movements
until 0.01mm in each direction with 2 μm of accuracy. The combustible flow rate was
controlled by an electronic flowmeter (Alicat Scientific MC) with a maximum flow capacity
of 1 standard liter per minute (SLPM). The control of the flow meters is done by PC and
the maximum error involved is ±0.006 SLPM. Also, it were used a thermocouple and a
humidity sensor (that will be described in the last part of this section) to measure the
ambient air temperature and the relative humidity.
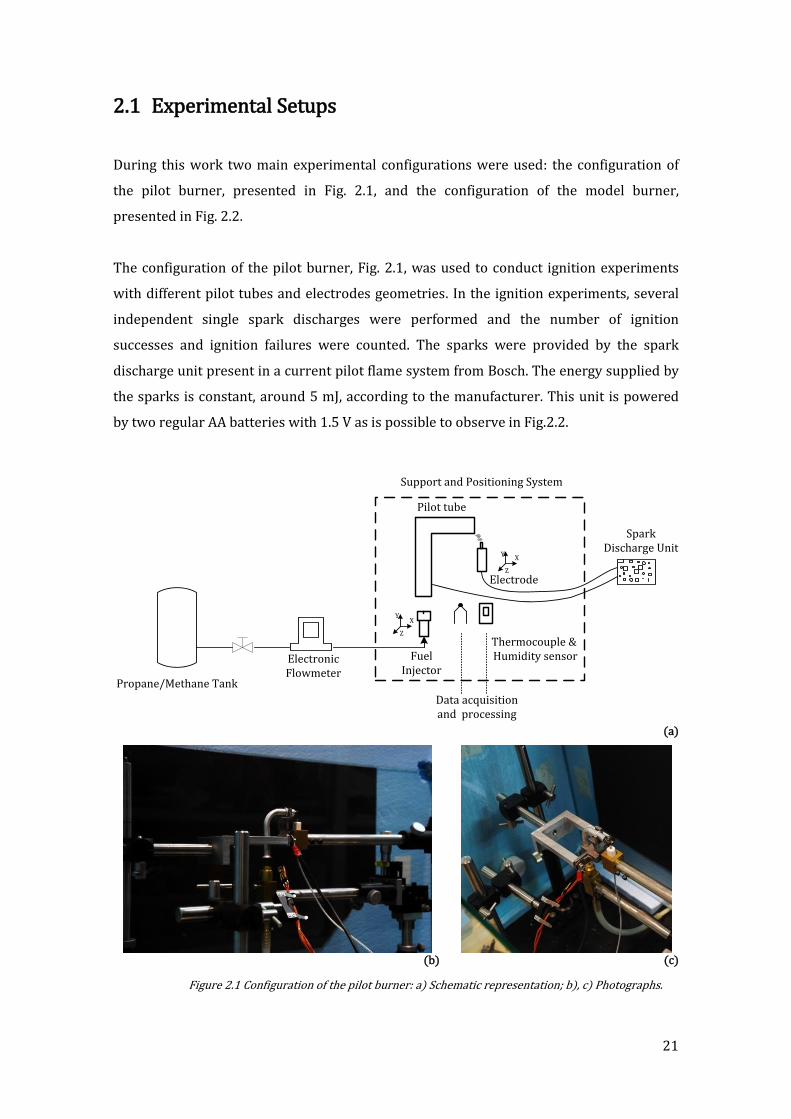
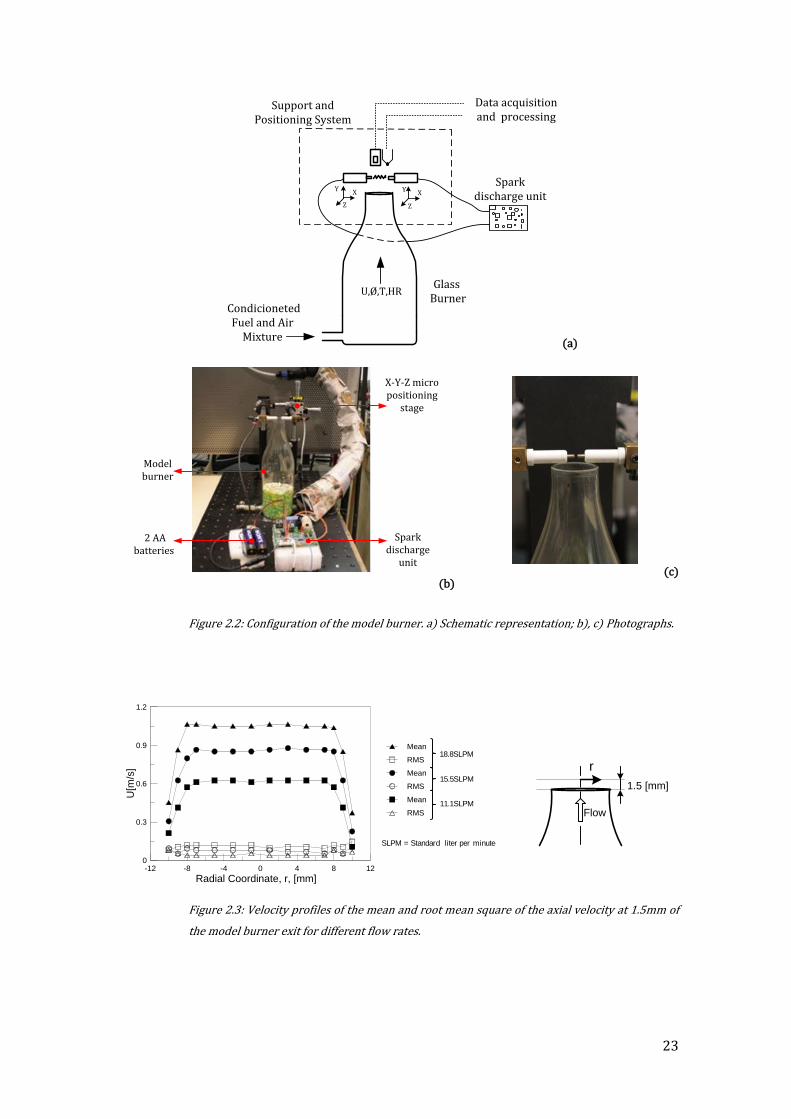
The configuration of the model burner, Fig.2.2, was created to evaluate the influence of
flowing mixture properties and electrode parameters on the success of spark discharge
and the success of ignition. To perform these tests, the burner should provide constant
properties of the flowing mixture in the zone where the spark is discharged, which does
not occur in the current pilot flame system. The model burner is made of glass and has an
exit diameter of 20.6 mm and the electrodes are positioned in front of the burner exit. This
burner, Fig 2.2c), has a parabolic curvature, which produces a plug flow at the exit of the
burner, as shown Fig. 2.3. The plug flow resuls in the desired constant properties at the
core region, where the electrodes are positioned.
The success of spark discharge and the success of ignition were studied as function of
electrodes spacing varying: equivalence ratio, temperature, relative humidity, mean
velocity of the mixture and electrode diameter. The electrodes spacing was controlled
using the X-Y-Z micro positioning stages (the same as the real burner configuration). A
thermocouple and a humidity sensor were used, to measure the temperature and relative
humidity at the burner exit.
23
(a)
(b)
(c)
Figure 2.2: Configuration of the model burner. a) Schematic representation; b), c) Photographs.
Figure 2.3: Velocity profiles of the mean and root mean square of the axial velocity at 1.5mm of
the model burner exit for different flow rates.
XY
Z
XY
Z
Spark discharge unit
Data acquisition and processing
Glass Burner
Condicioneted Fuel and Air
Mixture
U,Ø,T,HR
Support and Positioning System
Model burner
2 AA batteries
X-Y-Z micro positioning
stage
Spark discharge
unit
18.8SLPM
15.5SLPM
11.1SLPM
-12 -8 -4 0 4 8 12
Radial Coordinate, r, [mm]
0
0.3
0.6
0.9
1.2
U[m
/s]
Mean
RMS
Mean
RMS
Mean
RMS
SLPM = Standard liter per minute
r
Flow
1.5 [mm]
24
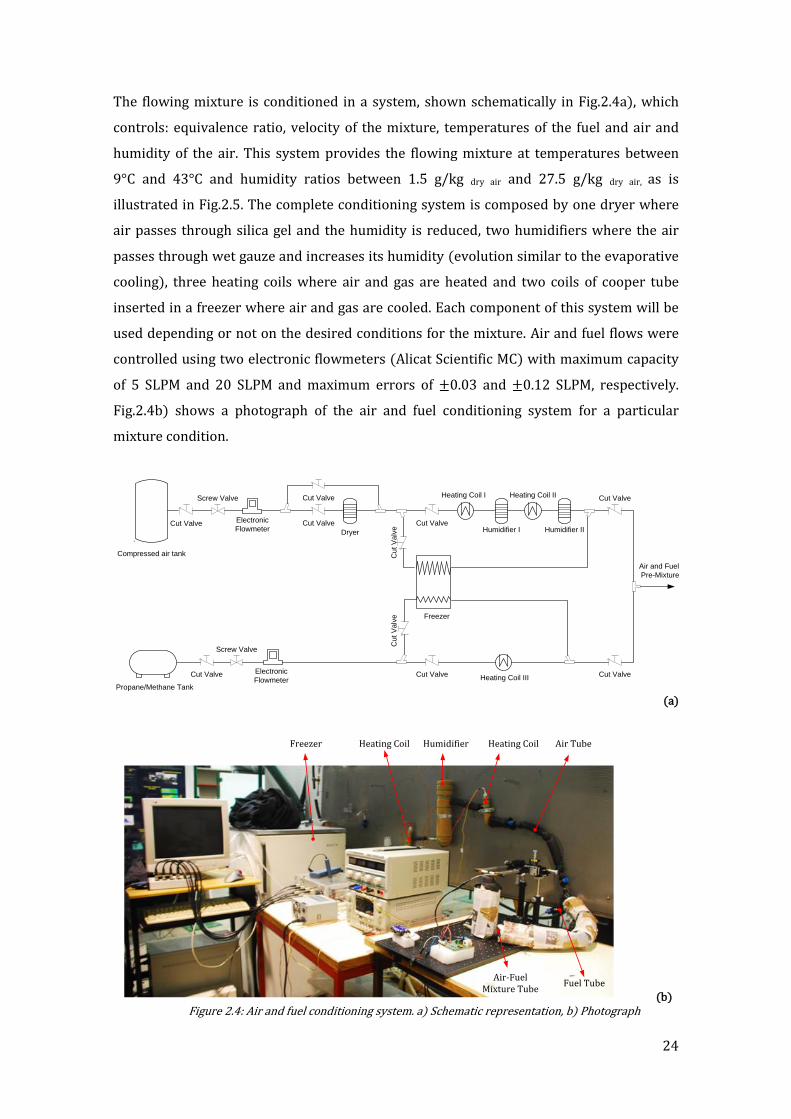
The flowing mixture is conditioned in a system, shown schematically in Fig.2.4a), which
controls: equivalence ratio, velocity of the mixture, temperatures of the fuel and air and
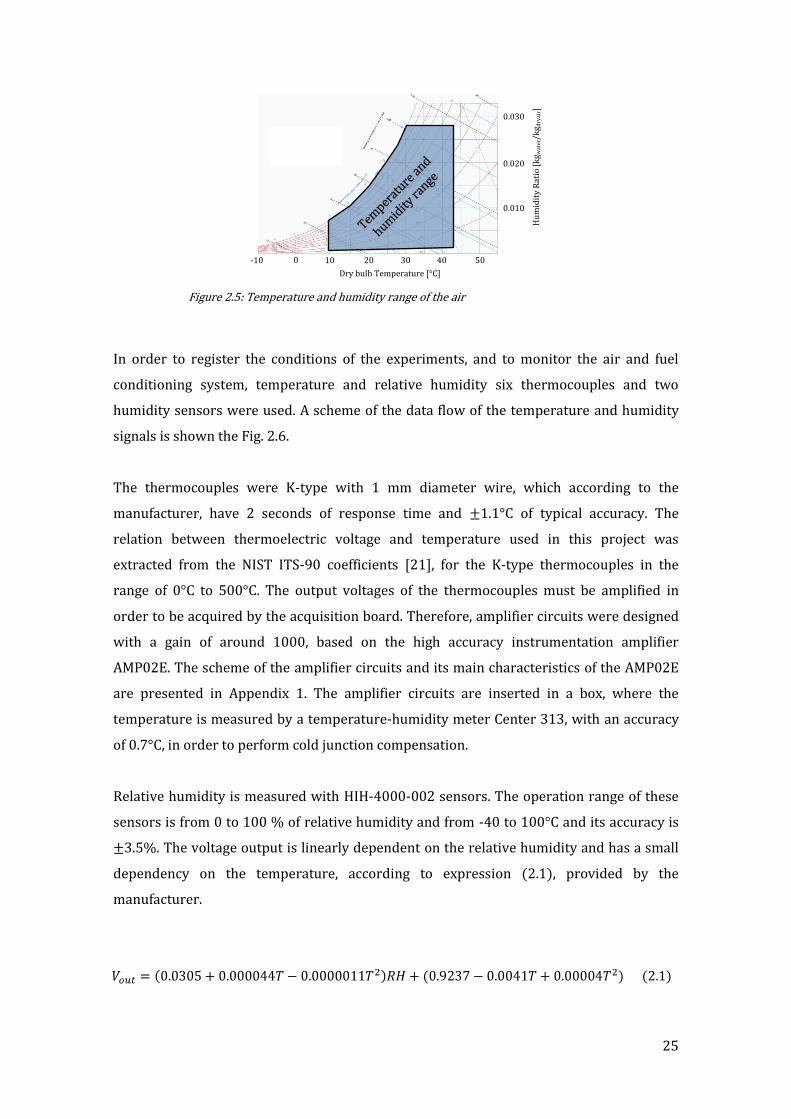
humidity of the air. This system provides the flowing mixture at temperatures between
9°C and 43°C and humidity ratios between 1.5 g/kg dry air and 27.5 g/kg dry air, as is
illustrated in Fig.2.5. The complete conditioning system is composed by one dryer where
air passes through silica gel and the humidity is reduced, two humidifiers where the air
passes through wet gauze and increases its humidity (evolution similar to the evaporative
cooling), three heating coils where air and gas are heated and two coils of cooper tube
inserted in a freezer where air and gas are cooled. Each component of this system will be
used depending or not on the desired conditions for the mixture. Air and fuel flows were
controlled using two electronic flowmeters (Alicat Scientific MC) with maximum capacity
of 5 SLPM and 20 SLPM and maximum errors of ±0.03 and ±0.12 SLPM, respectively.
Fig.2.4b) shows a photograph of the air and fuel conditioning system for a particular
mixture condition.
(a)
(b) Figure 2.4: Air and fuel conditioning system. a) Schematic representation, b) Photograph
Dryer
Compressed air tank
.
Screw Valve
Cut Valve Cut Valve
Cut Valve
Cut Valve
Cu
t V
alv
e Humidifier I
Heating Coil I
Humidifier II
Heating Coil II
Screw Valve
Cut Valve
Freezer
Cu
t V
alv
e
Cut Valve Heating Coil III Cut ValveElectronic
Flowmeter
Electronic
Flowmeter
Air and Fuel
Pre-Mixture
Cut Valve
Propane/Methane Tank
Humidifier Heating CoilHeating Coil Air Tube
Fuel Tube
Freezer
Air-Fuel Mixture Tube
25
Figure 2.5: Temperature and humidity range of the air
In order to register the conditions of the experiments, and to monitor the air and fuel
conditioning system, temperature and relative humidity six thermocouples and two
humidity sensors were used. A scheme of the data flow of the temperature and humidity
signals is shown the Fig. 2.6.
The thermocouples were K-type with 1 mm diameter wire, which according to the
manufacturer, have 2 seconds of response time and ±1.1°C of typical accuracy. The
relation between thermoelectric voltage and temperature used in this project was
extracted from the NIST ITS-90 coefficients [21], for the K-type thermocouples in the
range of 0°C to 500°C. The output voltages of the thermocouples must be amplified in
order to be acquired by the acquisition board. Therefore, amplifier circuits were designed
with a gain of around 1000, based on the high accuracy instrumentation amplifier
AMP02E. The scheme of the amplifier circuits and its main characteristics of the AMP02E
are presented in Appendix 1. The amplifier circuits are inserted in a box, where the
temperature is measured by a temperature-humidity meter Center 313, with an accuracy
of 0.7°C, in order to perform cold junction compensation.
Relative humidity is measured with HIH-4000-002 sensors. The operation range of these
sensors is from 0 to 100 % of relative humidity and from -40 to 100°C and its accuracy is
±3.5%. The voltage output is linearly dependent on the relative humidity and has a small
dependency on the temperature, according to expression (2.1), provided by the
manufacturer.
(2.1)
10-10 0 20 30 40 50
0.010
0.020
0.030
Dry bulb Temperature [°C]
Hu
mid
ity
Rat
io [
kg w
ater
/kg d
ryai
r]
Tempera
ture
and
humid
ity ra
nge

26
Figure 2.6: Data flow in the real-time acquisition system
The output voltages of the humidity sensors and the amplifier circuits are sent to a
National Instruments BNC Connector NI-BNC-2110 and acquired by a computer using a
National Instruments 12 bit NI PCI-6024E digital acquisition board. The error introduced
by the digitalization process of typical analogue signals, in the present A/D with 12 bits of
resolution, is less than 1.3 mV. This amplitude error represents less than 0.03°C in T
measurement and 0.04% in RH measurements, which is negligibly small when compared
with the typical error of the sensors. A Labview computer code was written to control data
acquisition, which processes the signals, converting voltages to values of temperature and
relative humidity. These values are displayed in real-time on the computer screen as
shown in Fig. 2.6. The developed Labview routine is presented in graphical form in the
Appendix 2.
Amplifier CircuitThermocouple
Humidity Sensor
BNC Adapter
ComputerAcquisition Board
Circuits Box
Humidity Sensors Power Supply
(5V)
Amplifier Circuits Power supply(-12 ; +12V)
27
2.2 Diagnostic Techniques
2.2.1 Velocity Measurements
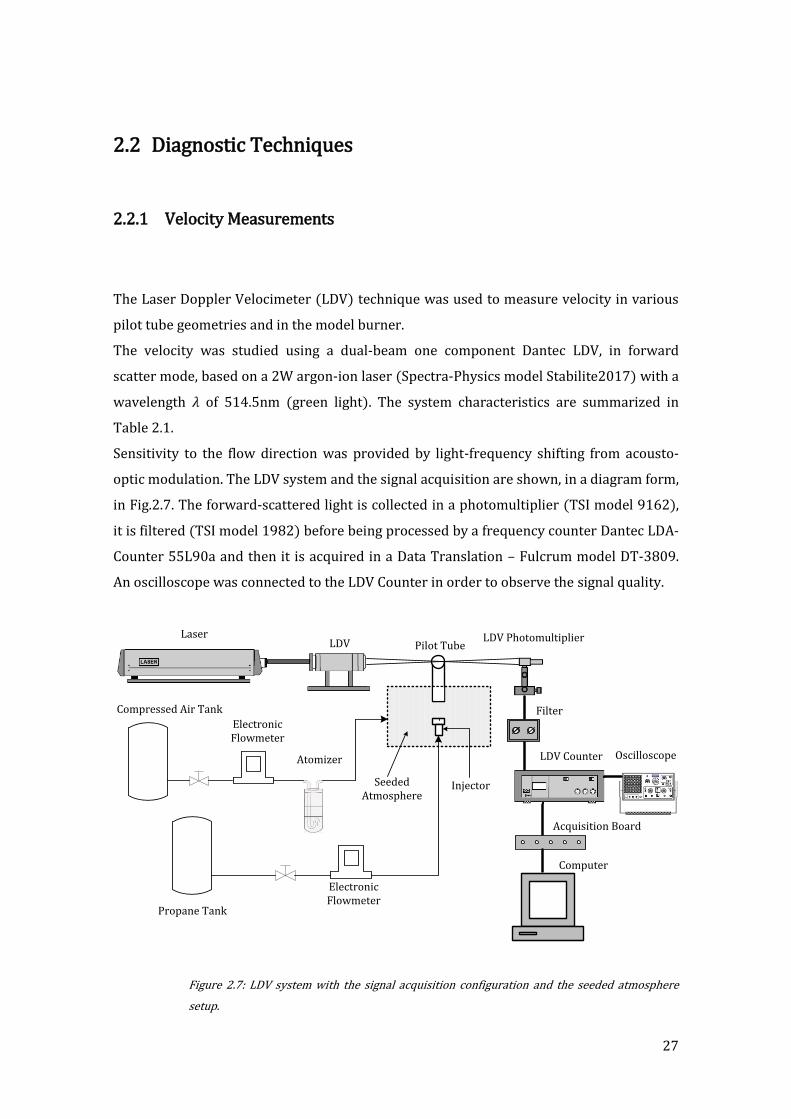
The Laser Doppler Velocimeter (LDV) technique was used to measure velocity in various
pilot tube geometries and in the model burner.
The velocity was studied using a dual-beam one component Dantec LDV, in forward
scatter mode, based on a 2W argon-ion laser (Spectra-Physics model Stabilite2017) with a
wavelength of 514.5nm (green light). The system characteristics are summarized in
Table 2.1.
Sensitivity to the flow direction was provided by light-frequency shifting from acousto-
optic modulation. The LDV system and the signal acquisition are shown, in a diagram form,
in Fig.2.7. The forward-scattered light is collected in a photomultiplier (TSI model 9162),
it is filtered (TSI model 1982) before being processed by a frequency counter Dantec LDA-
Counter 55L90a and then it is acquired in a Data Translation – Fulcrum model DT-3809.
An oscilloscope was connected to the LDV Counter in order to observe the signal quality.
Figure 2.7: LDV system with the signal acquisition configuration and the seeded atmosphere
setup.
LaserLDV
LDV Counter Oscilloscope
Computer
LDV Photomultiplier
FilterCompressed Air Tank
Propane Tank
Electronic Flowmeter
Atomizer
Electronic Flowmeter
Pilot Tube
Seeded Atmosphere
Injector
Acquisition Board
28
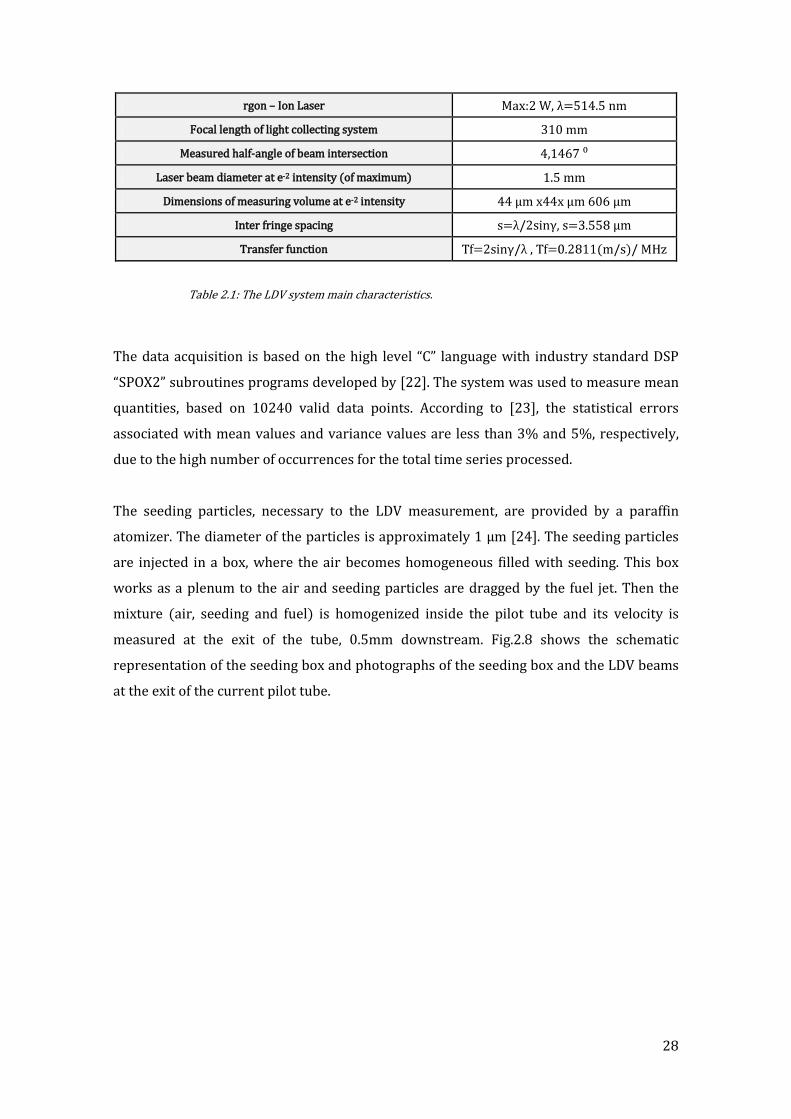
rgon – Ion Laser Max:2 W, λ=514.5 nm
Focal length of light collecting system 310 mm
Measured half-angle of beam intersection 4,1467 :
Laser beam diameter at e-2 intensity (of maximum) 1.5 mm
Dimensions of measuring volume at e-2 intensity 44 μm x44x μm 606 μm
Inter fringe spacing
Transfer function ,
Table 2.1: The LDV system main characteristics.
The data acquisition is based on the high level “C” language with industry standard DSP
“SPOX2” subroutines programs developed by [22]. The system was used to measure mean
quantities, based on 10240 valid data points. According to [23], the statistical errors
associated with mean values and variance values are less than 3% and 5%, respectively,
due to the high number of occurrences for the total time series processed.
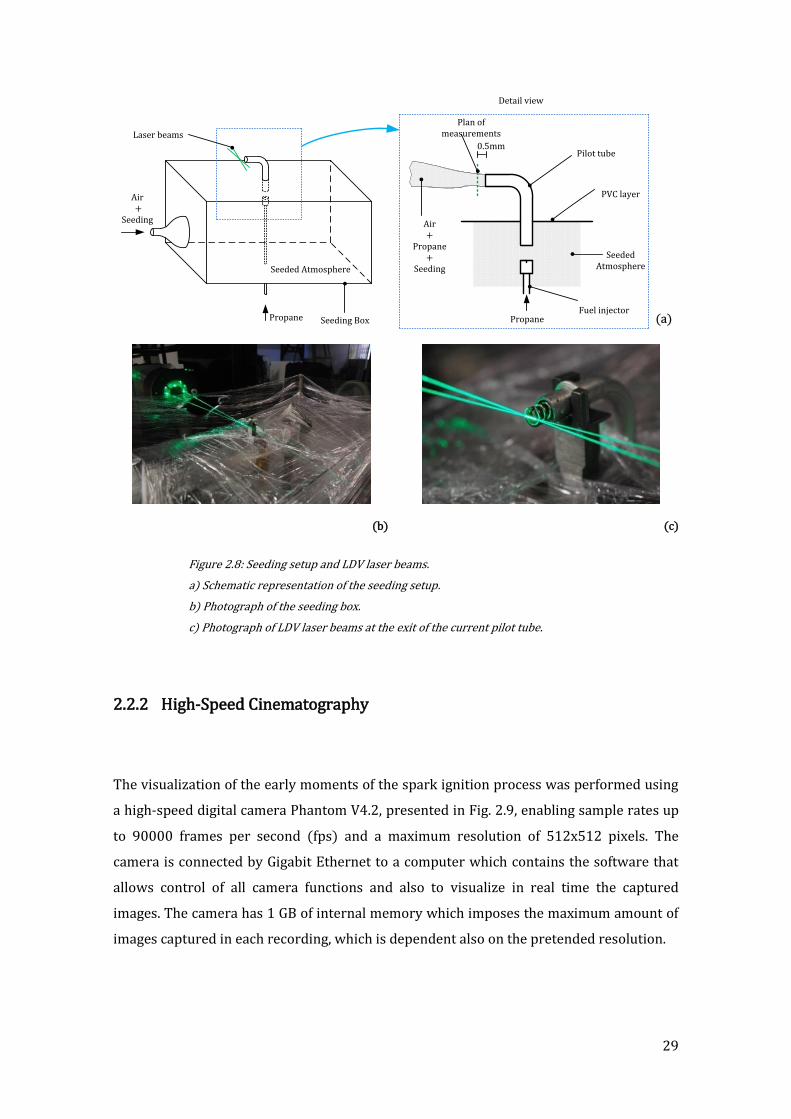
The seeding particles, necessary to the LDV measurement, are provided by a paraffin
atomizer. The diameter of the particles is approximately 1 μm [24]. The seeding particles
are injected in a box, where the air becomes homogeneous filled with seeding. This box
works as a plenum to the air and seeding particles are dragged by the fuel jet. Then the
mixture (air, seeding and fuel) is homogenized inside the pilot tube and its velocity is
measured at the exit of the tube, 0.5mm downstream. Fig.2.8 shows the schematic
representation of the seeding box and photographs of the seeding box and the LDV beams
at the exit of the current pilot tube.
29
(b)
(c)
Figure 2.8: Seeding setup and LDV laser beams.
a) Schematic representation of the seeding setup.
b) Photograph of the seeding box.
c) Photograph of LDV laser beams at the exit of the current pilot tube.
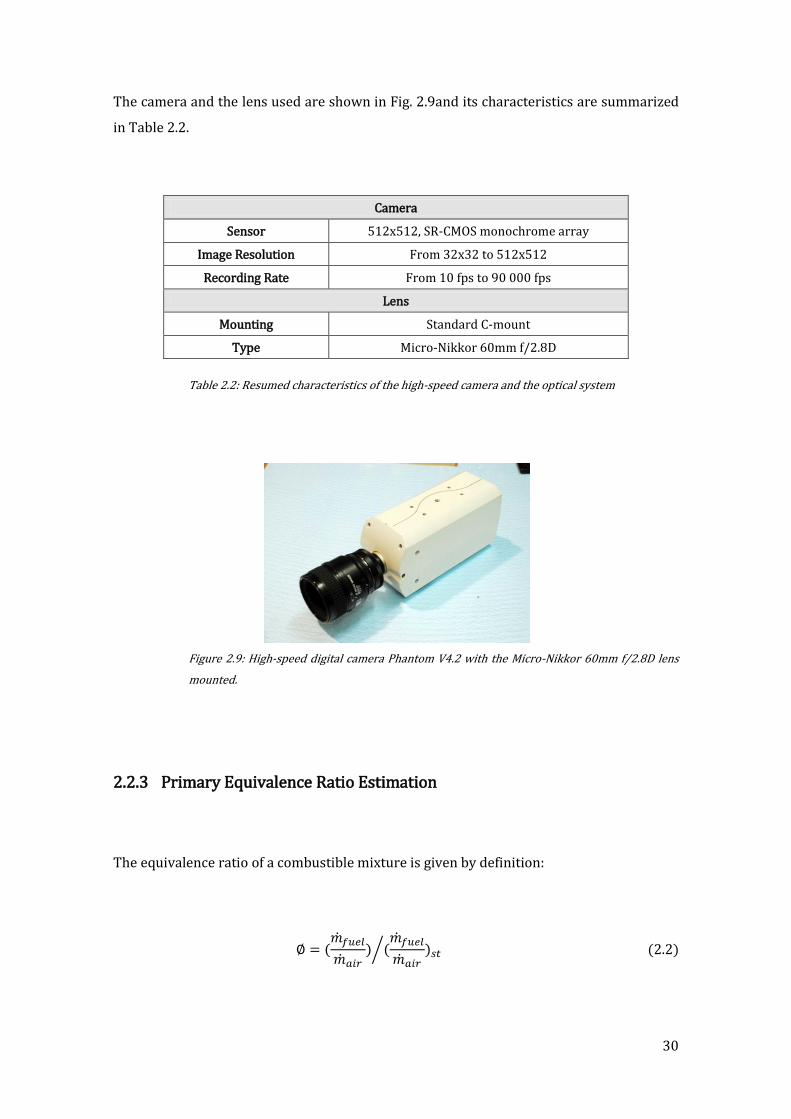
2.2.2 High-Speed Cinematography
The visualization of the early moments of the spark ignition process was performed using
a high-speed digital camera Phantom V4.2, presented in Fig. 2.9, enabling sample rates up
to 90000 frames per second (fps) and a maximum resolution of 512x512 pixels. The
camera is connected by Gigabit Ethernet to a computer which contains the software that
allows control of all camera functions and also to visualize in real time the captured
images. The camera has 1 GB of internal memory which imposes the maximum amount of
images captured in each recording, which is dependent also on the pretended resolution.
Propane
Air +
Seeding
Seeded Atmosphere
Seeded Atmosphere
0.5mm
PVC layer
Pilot tube
Detail view
PropaneFuel injector
Laser beams
Air+
Propane+
Seeding
Plan of measurements
Seeding Box (a)
30
The camera and the lens used are shown in Fig. 2.9and its characteristics are summarized
in Table 2.2.
Camera
Sensor 512x512, SR-CMOS monochrome array
Image Resolution From 32x32 to 512x512
Recording Rate From 10 fps to 90 000 fps
Lens
Mounting Standard C-mount
Type Micro-Nikkor 60mm f/2.8D
Table 2.2: Resumed characteristics of the high-speed camera and the optical system
Figure 2.9: High-speed digital camera Phantom V4.2 with the Micro-Nikkor 60mm f/2.8D lens
mounted.
2.2.3 Primary Equivalence Ratio Estimation
The equivalence ratio of a combustible mixture is given by definition:
(2.2)

31
The primary equivalence ratio Øprim of the jet was calculated for different pilot tube
geometries. It is based on the knowledge of the injected fuel mass flow rate, , and the
mixture volume flow rate at the pilot exit, Qm, which is determined by integrating the
velocity profiles of the jet (obtained with the LDV measurements). With these two values
and some algebraic manipulation of the continuity equation (2.3) and law of the perfect
gases law (2.4), it is possible to obtain the mass flow rate of the air present in the jet, ,
by solving expression (2.5). The complete development from expressions (2.3) and (2.4)
to (2.5) is presented in the Appendix 3.
(2.3)
(2.4)
(2.5)
Finally with the obtained mass flow rate of the air, , and the injected fuel mass flow
rate, , the primary equivalence ratio of the jet is calculated using expression (2.2).
2.2.4 “Up-and-Down” Method
In order to evaluate the effect of several properties on the success of spark discharge and
on the success of ignition (for a fixed V0 and Esupplied), two variables were introduced in this
work. These two variables are: critical spark distance (ds) which is related with the
requirements to have a spark discharge, and the critical ignition distance (di) which is
related with the requirements to have sustained flame propagation after the spark
discharge. These two variables will be explained in detail in Section 4.1.
32
The present experimental investigations of the critical spark distance, ds,, and the critical
ignition distance, di, are sensitivity experiments. A sensitivity experiment is a method for
estimating continuous parameters that cannot be measured directly in practice [25]. For
example, each explosive specimen has a threshold. The specimen will detonate if and only
if an applied stimulus level exceeds this value. Since, there is no way to determine the
threshold of an individual, specimens are tested at various levels to determine parameters
of the population [26].
In order to quantify ds and di, the “Up-and-Down” method were used, which one is the
most widely used method to calculate the statistical properties of explosive testing and it
is also called “Bruceton Test”[27]. This method has been developed by Dixon and Massey
Jr. [25] to estimate the mean value of the critical stimulus where the variable has a 50%
probability of success, as well as the standard deviation of the mean value. The stimulus in
the experiments performed in this project is the electrodes spacing, d.
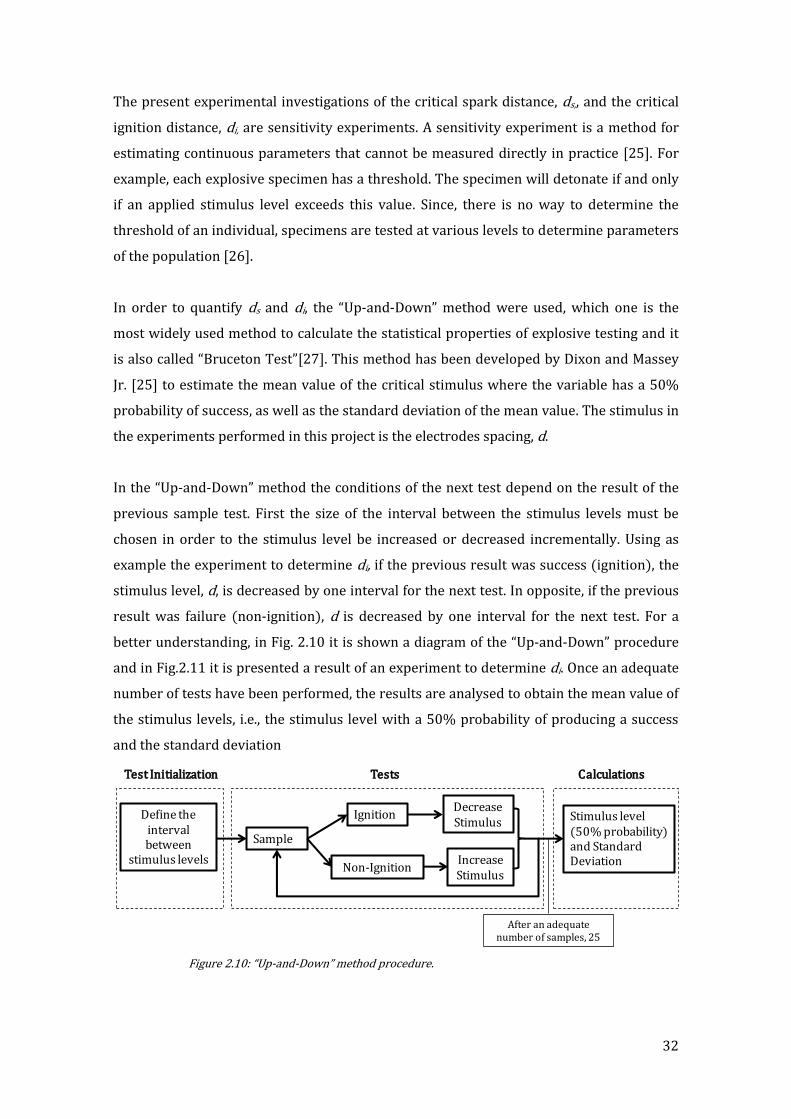
In the “Up-and-Down” method the conditions of the next test depend on the result of the
previous sample test. First the size of the interval between the stimulus levels must be
chosen in order to the stimulus level be increased or decreased incrementally. Using as
example the experiment to determine di, if the previous result was success (ignition), the
stimulus level, d, is decreased by one interval for the next test. In opposite, if the previous
result was failure (non-ignition), d is decreased by one interval for the next test. For a
better understanding, in Fig. 2.10 it is shown a diagram of the “Up-and-Down” procedure
and in Fig.2.11 it is presented a result of an experiment to determine di. Once an adequate
number of tests have been performed, the results are analysed to obtain the mean value of
the stimulus levels, i.e., the stimulus level with a 50% probability of producing a success
and the standard deviation
Figure 2.10: “Up-and-Down” method procedure.
Define the interval between
stimulus levels
Sample
Ignition
Non-Ignition
Decrease Stimulus
Increase Stimulus
Stimulus level (50% probability) and Standard Deviation
After an adequate number of samples, 25
Tests CalculationsTest Initialization
33
(a)
Ignition failures
(b)
Ignition success
(c)
Figure 2.11: Typical result of a critical ignition distance experiment
a) Result of 25 tests in an “Up-and-Down” experiment to determine the critical ignition
distance.
b) Histogram of ignition failures.
c) Histogram of ignition success.
Results: Critical Ignition Distance 1.65 mm, Standard Deviation 0.064 mm.
Working conditions: U=0.9 m/s, T=27.5 :C, HR=66 %, w=14.02 gwater/kgdryair, Ø=0.88
Fig. 2.11 presents the result of the experiment to determine di, the value found was
di=1.65 mm and its standard deviation equals to 0.064 mm.
For the “Up-and-Down” method to be applicable, the data must meet the follow condition
[25] :
The stimulus levels have to be normal distributed,
The interval size between stimulus levels must be fixed and smaller than twice the
standard deviation.
0 5 10 15 20 25
Sample Number
1.4
1.5
1.6
1.7
1.8
1.9d
[m
m]
Success
Failure
Critical Ignition Distance
1.4 1.5 1.6 1.7 1.8
Electrodes Distance[mm]
0
2
4
6
8
Sa
mp
les
1.5 1.6 1.7 1.8 1.9
Electrodes Distance[mm]
0
2
4
6
8
Sa
mp
les

34
The number of tests performed for the ds and di experiments was 25, higher than the 20
tests suggested by Zukas and Walter [28], cited in [27], for obtaining reliable results. The
used interval sizes between stimulus levels were 0.1 mm for di experiments and 0.25 mm
for ds experiments. With the number of tests performed and the interval sizes between
stimulus levels used, the criteria defined above were satisfied, being the experiment to
determine di presented in Fig. 2.11 an example.
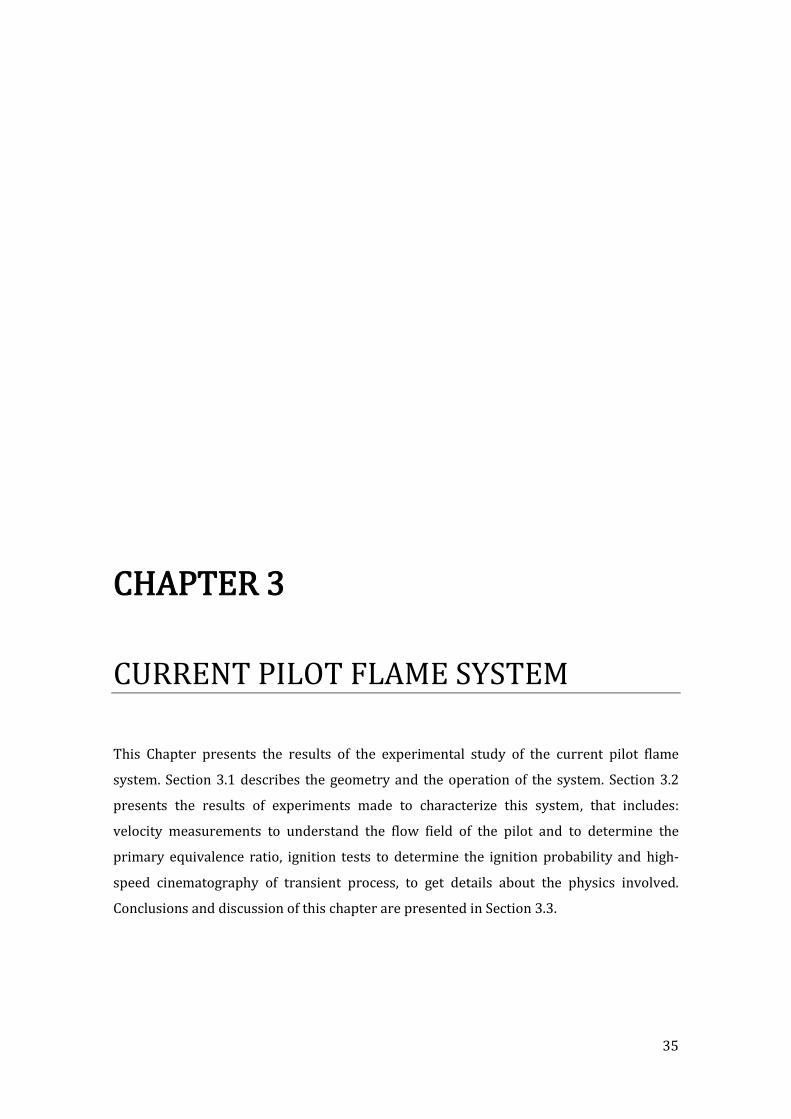
35
CHAPTER 3
CURRENT PILOT FLAME SYSTEM
This Chapter presents the results of the experimental study of the current pilot flame
system. Section 3.1 describes the geometry and the operation of the system. Section 3.2
presents the results of experiments made to characterize this system, that includes:
velocity measurements to understand the flow field of the pilot and to determine the
primary equivalence ratio, ignition tests to determine the ignition probability and high-
speed cinematography of transient process, to get details about the physics involved.
Conclusions and discussion of this chapter are presented in Section 3.3.

36
3.1 Description of the System
The current pilot flame ignition system from Bosch is composed by four parts: the fuel
injector, the pilot tube, the electrode and the spark discharge unit, as shown in Fig. 3.1. The
injector is of the plate orifice type with an orifice of 0.35 mm in diameter. The pilot tube is
positioned 10 mm above the propane injector and has an internal diameter of 4.8mm,
ending with a coil. This coil reduces the internal diameter to 3.8 mm. The electrode,
positioned 4 mm below the end of the pilot tube coil, is 2.0 mm in diameter and is made of
a high temperature iron-chromium-aluminium alloy known as Kantal A.
Figure 3.1: Drawing of the current pilot flame system with the components relative distances
and detail pictures from different parts of the system:
a) Current system
b) Pilot tube exit and the electrode
c) Entrance zone of the pilot tube
d) Propane injector
Fuel
Injector
Electrode
10
Ø4.8
Pilot
tube
4Spark
Discharge
Unit
Fuel
Injector
Electrode
10
Ø4.8
Pilot
tube
4Spark
Discharge
Unit
Fuel
Injector
Electrode
10
Ø4.8
Pilot
tube
4Spark
Discharge
Unit
Fuel
Injector
Electrode
10
Ø4.8
Pilot
tube
4Spark
Discharge
Unit
Fuel
Injector
Electrode
10
Ø4.8
Pilot
tube
4Spark
Discharge
Unit
(a)
(b)
(d)
(c)
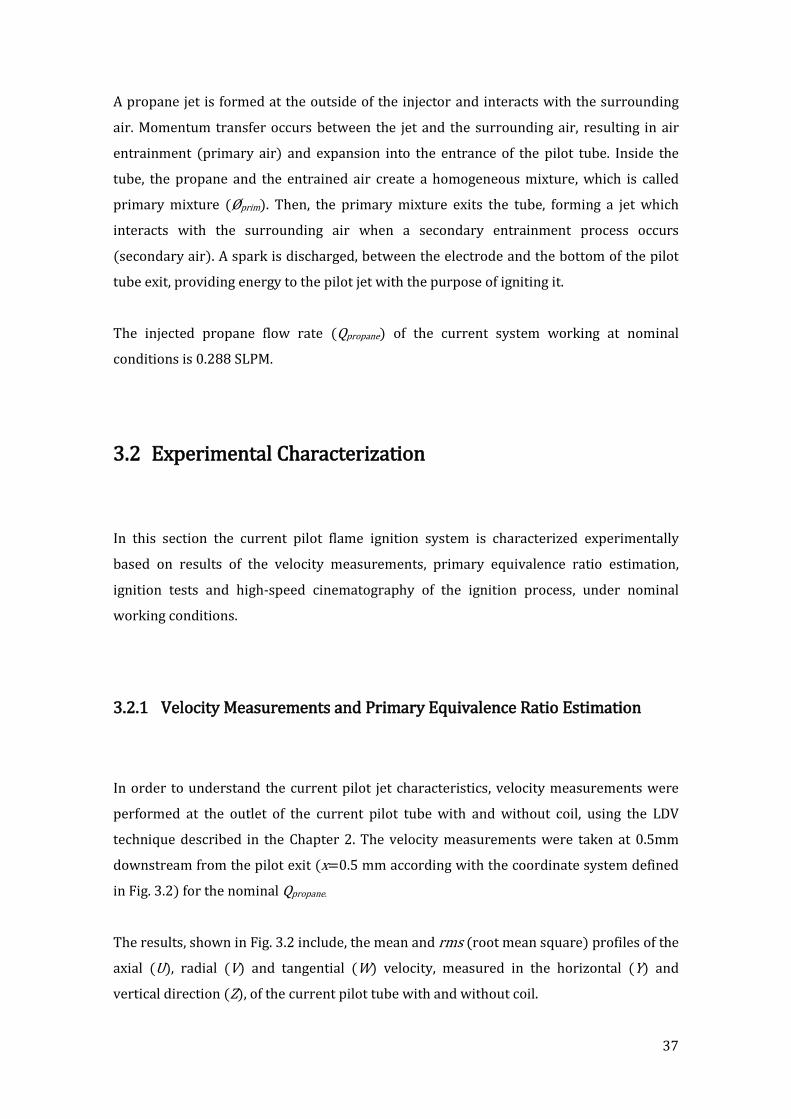
37
A propane jet is formed at the outside of the injector and interacts with the surrounding
air. Momentum transfer occurs between the jet and the surrounding air, resulting in air
entrainment (primary air) and expansion into the entrance of the pilot tube. Inside the
tube, the propane and the entrained air create a homogeneous mixture, which is called
primary mixture (Øprim). Then, the primary mixture exits the tube, forming a jet which
interacts with the surrounding air when a secondary entrainment process occurs
(secondary air). A spark is discharged, between the electrode and the bottom of the pilot
tube exit, providing energy to the pilot jet with the purpose of igniting it.
The injected propane flow rate (Qpropane) of the current system working at nominal
conditions is 0.288 SLPM.
3.2 Experimental Characterization
In this section the current pilot flame ignition system is characterized experimentally
based on results of the velocity measurements, primary equivalence ratio estimation,
ignition tests and high-speed cinematography of the ignition process, under nominal
working conditions.
3.2.1 Velocity Measurements and Primary Equivalence Ratio Estimation
In order to understand the current pilot jet characteristics, velocity measurements were
performed at the outlet of the current pilot tube with and without coil, using the LDV
technique described in the Chapter 2. The velocity measurements were taken at 0.5mm
downstream from the pilot exit (x=0.5 mm according with the coordinate system defined
in Fig. 3.2) for the nominal Qpropane.
The results, shown in Fig. 3.2 include, the mean and rms (root mean square) profiles of the
axial (U), radial (V) and tangential (W) velocity, measured in the horizontal (Y) and
vertical direction (Z), of the current pilot tube with and without coil.

38
(a)
(b)
(c)
(d)
Figure 3.2: Velocity profiles of the current pilot tube with coil and without the coil:
Current pilot system with coil
a) Profiles of the mean and rms of the axial and tangential velocities in horizontal direction
b) Profiles of the mean and rms of the axial and radial velocities in vertical direction
Current pilot system without coil
c) Profiles of the mean and rms of the axial and tangential velocities in horizontal direction
d) Profiles of the mean and rms of the axial and radial velocities in vertical direction
Working conditions: Qpropane=0.288 SLPM, X=0.5 mm.
X
Z
Y
Z
Y
V
U
W
-4 -3 -2 -1 0 1 2 3 4
Y [mm]
-2
0
2
4
6
8
Ve
locity [
m/s
]
U MEAN
U RMS
W MEAN
W RMS
-4 -3 -2 -1 0 1 2 3 4
Z [mm]
-2
0
2
4
6
8
Ve
locity [
m/s
]
U MEAN
U RMS
V MEAN
V RMS
X
Z
Y
Z
Y
V
U
W
-4 -3 -2 -1 0 1 2 3 4
Y [mm]
-2
0
2
4
6
8
Ve
locity [
m/s
]
U MEAN
U RMS
W MEAN
W RMS
-4 -3 -2 -1 0 1 2 3 4
Z [mm]
-2
0
2
4
6
8
Ve
locity [
m/s
]
U MEAN
U RMS
V MEAN
V RMS

39
The axial velocity is the dominant component of mean velocity vector in both pilot tube
configurations. The axial mean velocity profiles (in both directions Y and Z) of the pilot
tube with coil are quasi-symmetric, with a maximum velocity in the inner zone around 6
m/s. In contrast, the pilot tube without coil has a completely different flow field, which it is
symmetric about the XZ plane but not about the XY plane and presents the maximum of
the axial mean velocity close to the top of the pilot tube. The difference between the flows
fields of the two configurations are due to the presence of the coil which reduces the
internal passage area, introducing an additional flow resistance, enhancing the radial
momentum diffusion.
A velocity measurement was performed at the bottom of the current pilot coil between its
turns, as shown in Fig.3.3. The mean radial velocity in this point is zero. Fig. 3.3 shows the
histogram of the measured time series of the radial velocity, where it can be seen that
although the mean velocity is zero, there are velocity fluctuations.
Figure 3.3: Histogram of the measured time series of the radial velocity at bottom of the current
pilot coil between its turns
The mixture volume flow rate of the current pilot, obtained by integration of the velocity
profiles from the LDV measurements, is 0.0459X10⁻³ Nm3/s (normal cubic meters per
second). Based on the method described in Section 2.2.3, the primary equivalence ratio of
the current pilot tube with coil is 2.27. This value of the Øprim is in agreement with the
appearance of the current pilot flame, shown in Fig. 3.4, that exhibits a significant yellow
tip, typical of rich hydrocarbon flames [18]. The visible horizontal length of the current
pilot flame, under nominal conditions, is near 10 cm (measured by image analysis).
Measurement point
Pilot tube
V
-1 -0.5 0 0.5 1
V [m/s]
0
2500
5000
7500
10000
12500
15000
Sa
mp
les
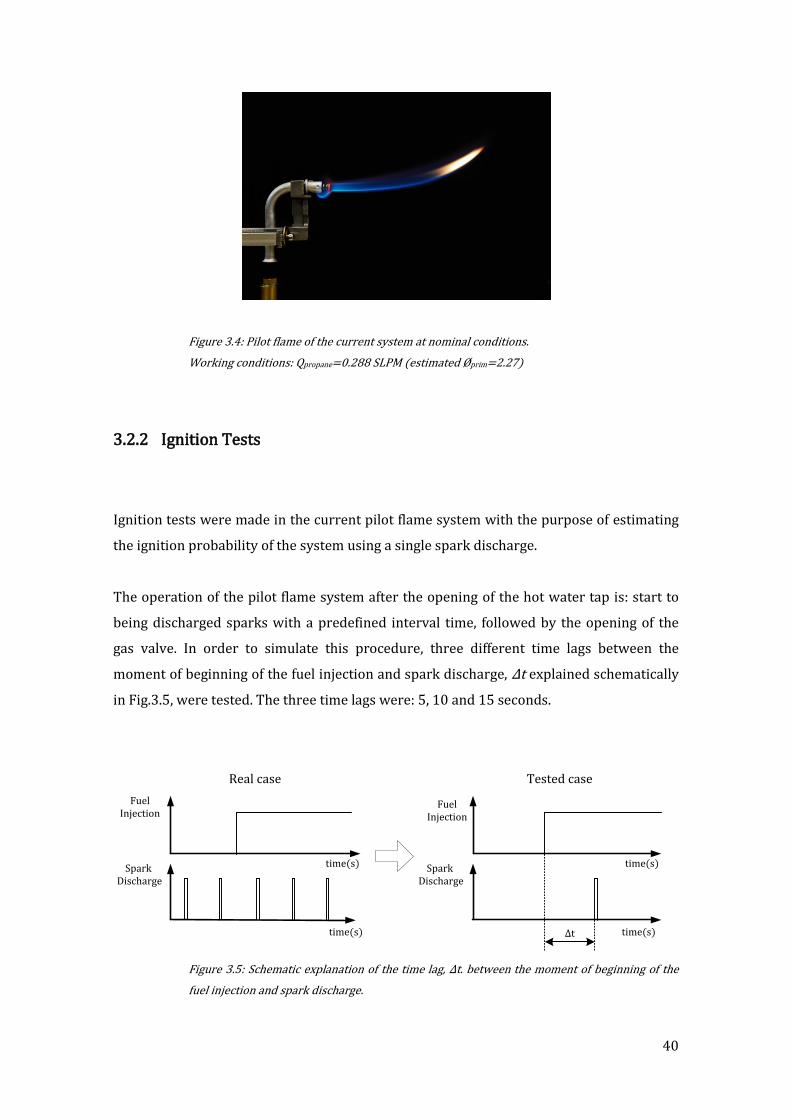
40
Figure 3.4: Pilot flame of the current system at nominal conditions.
Working conditions: Qpropane=0.288 SLPM (estimated Øprim=2.27)
3.2.2 Ignition Tests
Ignition tests were made in the current pilot flame system with the purpose of estimating
the ignition probability of the system using a single spark discharge.
The operation of the pilot flame system after the opening of the hot water tap is: start to
being discharged sparks with a predefined interval time, followed by the opening of the
gas valve. In order to simulate this procedure, three different time lags between the
moment of beginning of the fuel injection and spark discharge, Δt explained schematically
in Fig.3.5, were tested. The three time lags were: 5, 10 and 15 seconds.
Figure 3.5: Schematic explanation of the time lag, Δt. between the moment of beginning of the
fuel injection and spark discharge.
Fuel Injection
Spark Discharge
Δt time(s)
time(s)
Tested case
Fuel Injection
Spark Discharge
time(s)
time(s)
Real case
41
In the ignition tests three different responses can occur: successful ignition, spark
discharge without ignition, no spark production. The last two types of response are
considered in this study as ignition failures.
The ignition tests were conducted at the ambient air conditions of T=22°C and RH=48%,
using the nominal Qpropane and the system geometry shown in the Fig. 3.1.
For the shortest time lag Δt= 5s, 18 independent ignition tests were made, which
produced 18 responses of spark discharges without ignition. Increasing Δt to 10s, 18
independent ignition tests were made which resulted in 6 successful ignition responses
and 12 spark without ignition responses. Finally for Δt=15 s, 100 independent ignition
tests were made which resulted in 39 successful ignitions responses, 55 sparks without
ignitions responses and 6 no spark productions responses.
The results of the tests, summarized in Fig.3.6, show that the ignition probability has a
dependency of Δt. The ignition probability starts with 0% for Δt= 5s, increasing to 33% for
the Δt=10s and reaches it maximum 39%, for Δt=15s .
(a)
(b)
Δt[s]
Number of independent realizations Prob. of ignition
[%] Total Ignition Spark
without ignition
No spark
5 18 0 18 0 0.0
10 18 6 12 0 33.3
15 100 39 55 6 39.0
Figure 3.6: Results of the ignition tests of the current pilot flame system from Bosch
a) Graph of the ignition probability of with different time lag.
b) Resume of the ignition test results in a form of table.
Working conditions: =0.288 SLPM, T=22°C, RH=48%.
0 5 10 15 20
Time lag [s]
0
10
20
30
40
50
Ign
itio
n P
rob
ab
ility
[%
]
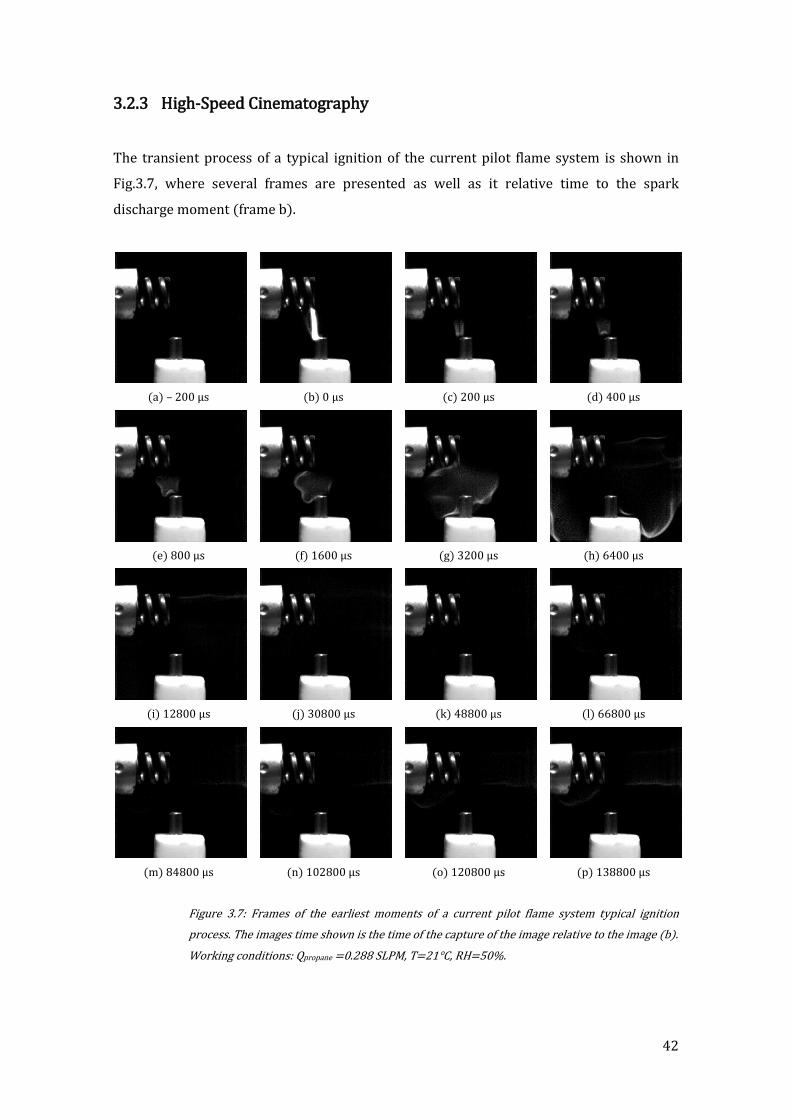
42
3.2.3 High-Speed Cinematography
The transient process of a typical ignition of the current pilot flame system is shown in
Fig.3.7, where several frames are presented as well as it relative time to the spark
discharge moment (frame b).
(a) – 200 μs (b) 0 μs (c) 200 μs (d) 400 μs
(e) 800 μs (f) 1600 μs (g) 3200 μs (h) 6400 μs
(i) 12800 μs (j) 30800 μs (k) 48800 μs (l) 66800 μs
(m) 84800 μs (n) 102800 μs (o) 120800 μs (p) 138800 μs
Figure 3.7: Frames of the earliest moments of a current pilot flame system typical ignition
process. The images time shown is the time of the capture of the image relative to the image (b).
Working conditions: Qpropane =0.288 SLPM, T=21°C, RH=50%.

43
The recordings were conducted for a Δt=15 s with the ambient air conditions of T=21 °C
and RH=50 %, using the nominal Qpropane and respecting the geometry of system shown in
the Fig. 3.1.
The images show that the spark discharge occurs in the region between the electrode and
the lower part of the pilot tube coil, where an incipient flame appear after the discharge.
However, it is noticeable that the pilot jet does not reach the region where the spark it is
discharged. The incipient flame propagates, first between the pilot tube and the electrode
and then (after the frame (g)) reaches the pilot jet and ignite it.
3.3 Discussion and Conclusions
The velocity measurements taken at the burner exit, for the nominal propane flow rate
(0.288 SLPM), has shown that the axial velocity in the current pilot tube has an quasi-
axisymmetrical distribution, with a maximum velocity in the inner zone around 6 m/s. The
presence of the coil at the pilot exit introduces an area reduction, enhancing the radial
momentum diffusion. As a consequence, the velocity profile is more symmetric tending
toward a flat-top profile.
The results of the ignition tests showed that the ignition probability has a dependency of
the time lag between the moment of beginning of the fuel injection and spark discharge, Δt.
The higher ignition probability of the current system using a single spark was found with
the time lag of Δt=15 s, being 39 %. Decreasing Δt to 10 s, the ignition probability
decreases to 33 % and it is 0 when Δt=5 s.
A critical analysis of the obtained results of the current pilot flame system characterization
reveals that the primary equivalence ratio and the electrode location are not the most
adequate for the occurrence of a successful ignition.

44
In fact, the primary equivalence ratio of the current pilot jet is 2.27, as estimated in this
work, which requires an amount of energy supplied in excess of 5 mJ (see Fig.3.8), that
corresponds in extremis to the amount of energy supplied by the spark discharge unit.
Figure 3.8: Representation of the primary equivalence ratio of the current pilot flame system in
a graph of minimum ignition energy function of the equivalence ratio, for propane-air quiescent
mixtures from [1].
Also, the spark develops in a region between the electrode and the bottom of the pilot coil
exit, a region that the pilot jet does not reach, as illustrated in Fig.3.9. Therefore, in this
region apparently, there is no propane, just air. Effectively, the propane reaches that
region due to his mass diffusion in surrounding air, assisted by the random fluctuations of
radial velocity in between the coil turns. However, due to the nature of the processes
involved, it is necessary some time for the propane to reach this region. This is consistent
with the increase of the ignition probability with the time lag. This situation is critical
because the local equivalence ratio in the region where the spark is discharged is not
known and its evolution with time (after the opening of the gas valve), is not a controlled
process.
Figure 3.9: Representation of the spark discharge location in the current pilot flame system.
0.4 0.6 0.8 1 1.2 1.4 1.6 1.8 2 2.2 2.4
Ø
0.1
1
Em
in [
mJ]
5
ØprimCurrent System
Flowing reactant mixturePilot Tube
Air
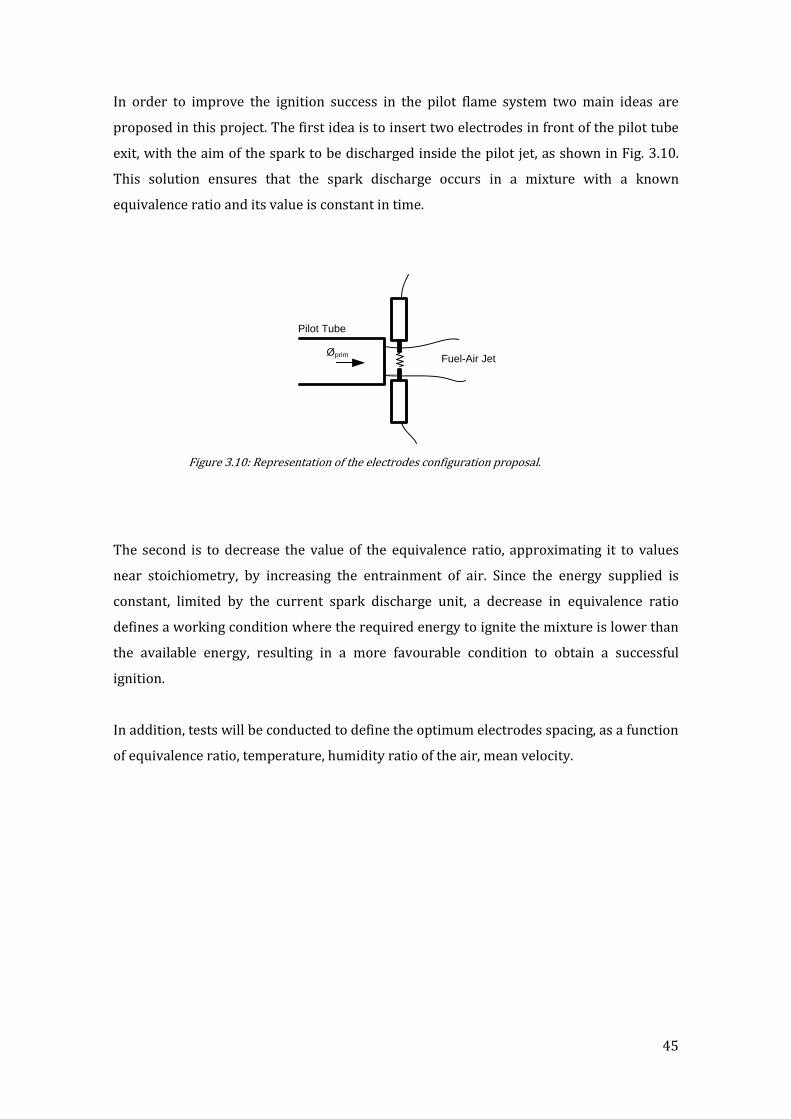
45
In order to improve the ignition success in the pilot flame system two main ideas are
proposed in this project. The first idea is to insert two electrodes in front of the pilot tube
exit, with the aim of the spark to be discharged inside the pilot jet, as shown in Fig. 3.10.
This solution ensures that the spark discharge occurs in a mixture with a known
equivalence ratio and its value is constant in time.
Figure 3.10: Representation of the electrodes configuration proposal.
The second is to decrease the value of the equivalence ratio, approximating it to values
near stoichiometry, by increasing the entrainment of air. Since the energy supplied is
constant, limited by the current spark discharge unit, a decrease in equivalence ratio
defines a working condition where the required energy to ignite the mixture is lower than
the available energy, resulting in a more favourable condition to obtain a successful
ignition.
In addition, tests will be conducted to define the optimum electrodes spacing, as a function
of equivalence ratio, temperature, humidity ratio of the air, mean velocity.
Pilot Tube
Fuel-Air JetØprim

46
CHAPTER 4 IGNITION ANALYSIS IN A MODEL BURNER
Chapter 4 presents the results of an experimental study of the influence of different
properties of the mixture and parameters of the electrodes on the success of spark
discharge and on the success of ignition. The experiments have been conducted in a model
burner and the tested variables are: equivalence ratio, mixture velocity, mixture
temperature, humidity of the air, and electrode diameter.
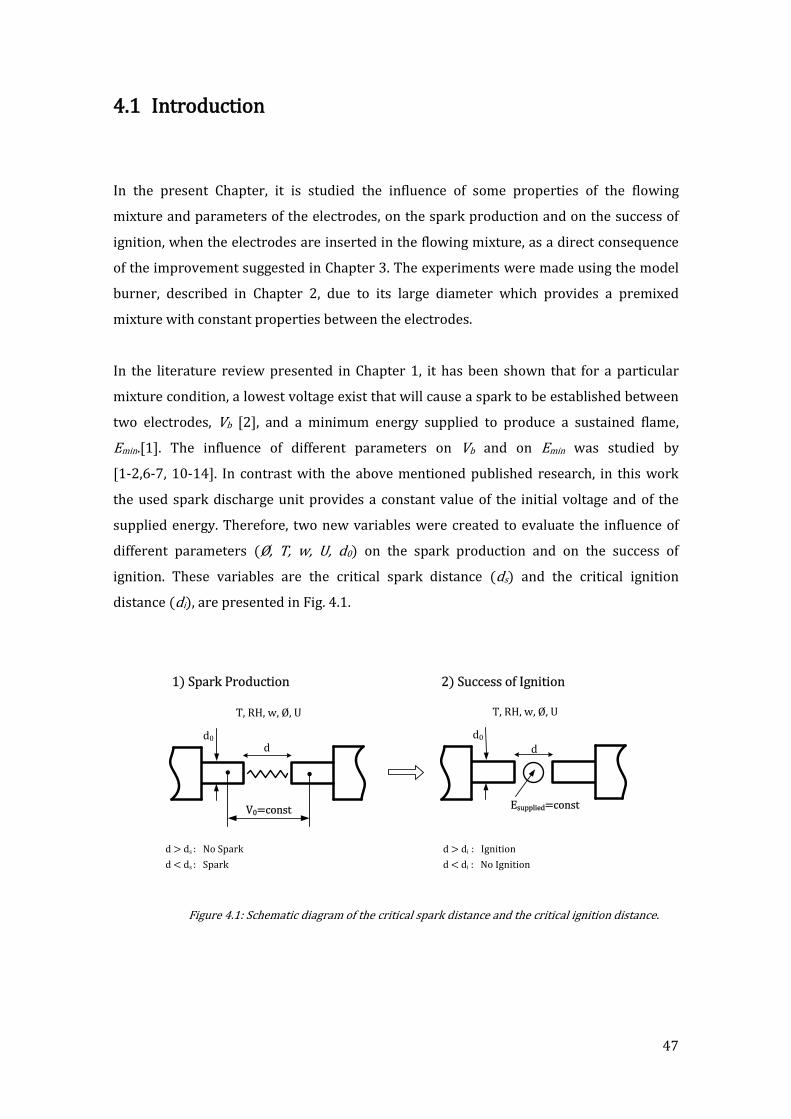
47
4.1 Introduction
In the present Chapter, it is studied the influence of some properties of the flowing
mixture and parameters of the electrodes, on the spark production and on the success of
ignition, when the electrodes are inserted in the flowing mixture, as a direct consequence
of the improvement suggested in Chapter 3. The experiments were made using the model
burner, described in Chapter 2, due to its large diameter which provides a premixed
mixture with constant properties between the electrodes.
In the literature review presented in Chapter 1, it has been shown that for a particular
mixture condition, a lowest voltage exist that will cause a spark to be established between
two electrodes, Vb [2], and a minimum energy supplied to produce a sustained flame,
Emin.[1]. The influence of different parameters on Vb and on Emin was studied by
[1-2,6-7, 10-14]. In contrast with the above mentioned published research, in this work
the used spark discharge unit provides a constant value of the initial voltage and of the
supplied energy. Therefore, two new variables were created to evaluate the influence of
different parameters (Ø, T, w, U, d0) on the spark production and on the success of
ignition. These variables are the critical spark distance (ds) and the critical ignition
distance (di), are presented in Fig. 4.1.
Figure 4.1: Schematic diagram of the critical spark distance and the critical ignition distance.
d
d > ds : No Spark
d < ds : Spark
d > di : Ignition
d < di : No Ignition
1) Spark Production 2) Success of Ignition
d
V0=const
d0
T, RH, w, Ø, U T, RH, w, Ø, U
d0
Esupplied=const
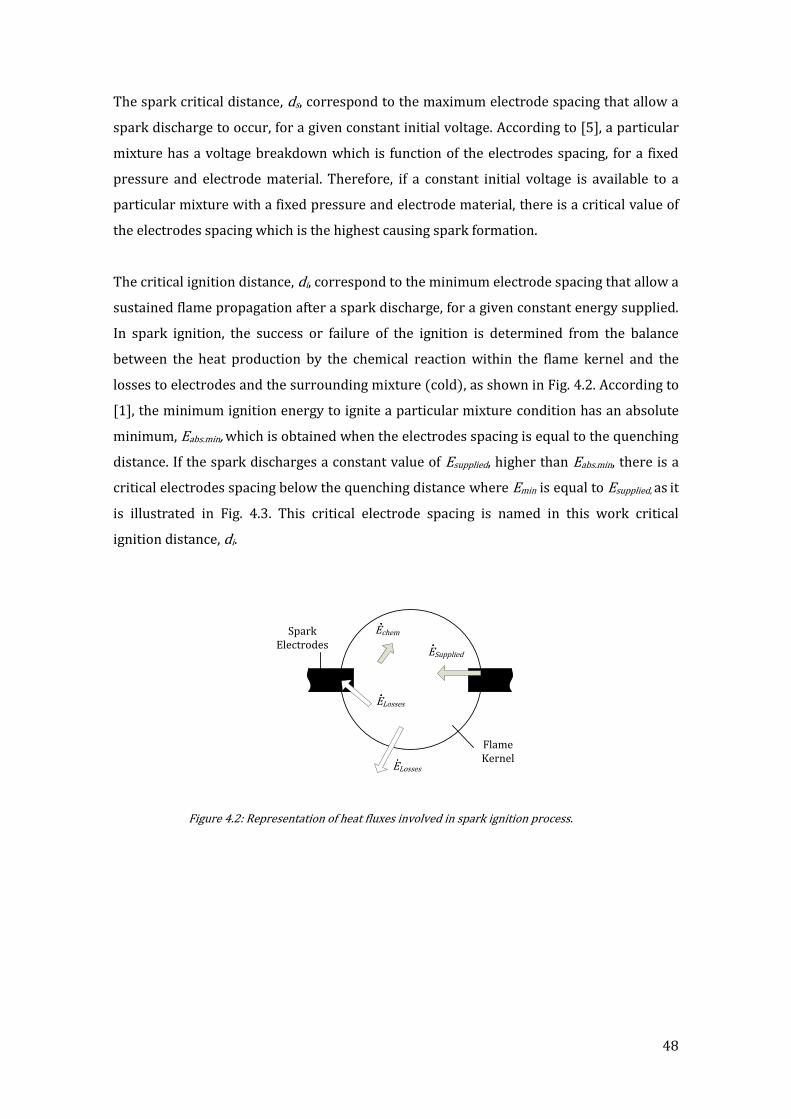
48
The spark critical distance, ds, correspond to the maximum electrode spacing that allow a
spark discharge to occur, for a given constant initial voltage. According to [5], a particular
mixture has a voltage breakdown which is function of the electrodes spacing, for a fixed
pressure and electrode material. Therefore, if a constant initial voltage is available to a
particular mixture with a fixed pressure and electrode material, there is a critical value of
the electrodes spacing which is the highest causing spark formation.
The critical ignition distance, di, correspond to the minimum electrode spacing that allow a
sustained flame propagation after a spark discharge, for a given constant energy supplied.
In spark ignition, the success or failure of the ignition is determined from the balance
between the heat production by the chemical reaction within the flame kernel and the
losses to electrodes and the surrounding mixture (cold), as shown in Fig. 4.2. According to
[1], the minimum ignition energy to ignite a particular mixture condition has an absolute
minimum, Eabs.min, which is obtained when the electrodes spacing is equal to the quenching
distance. If the spark discharges a constant value of Esupplied, higher than Eabs.min, there is a
critical electrodes spacing below the quenching distance where Emin is equal to Esupplied, as it
is illustrated in Fig. 4.3. This critical electrode spacing is named in this work critical
ignition distance, di.
Figure 4.2: Representation of heat fluxes involved in spark ignition process.
Spark Electrodes
Flame Kernel
Echem
ESupplied
ELosses
ELosses
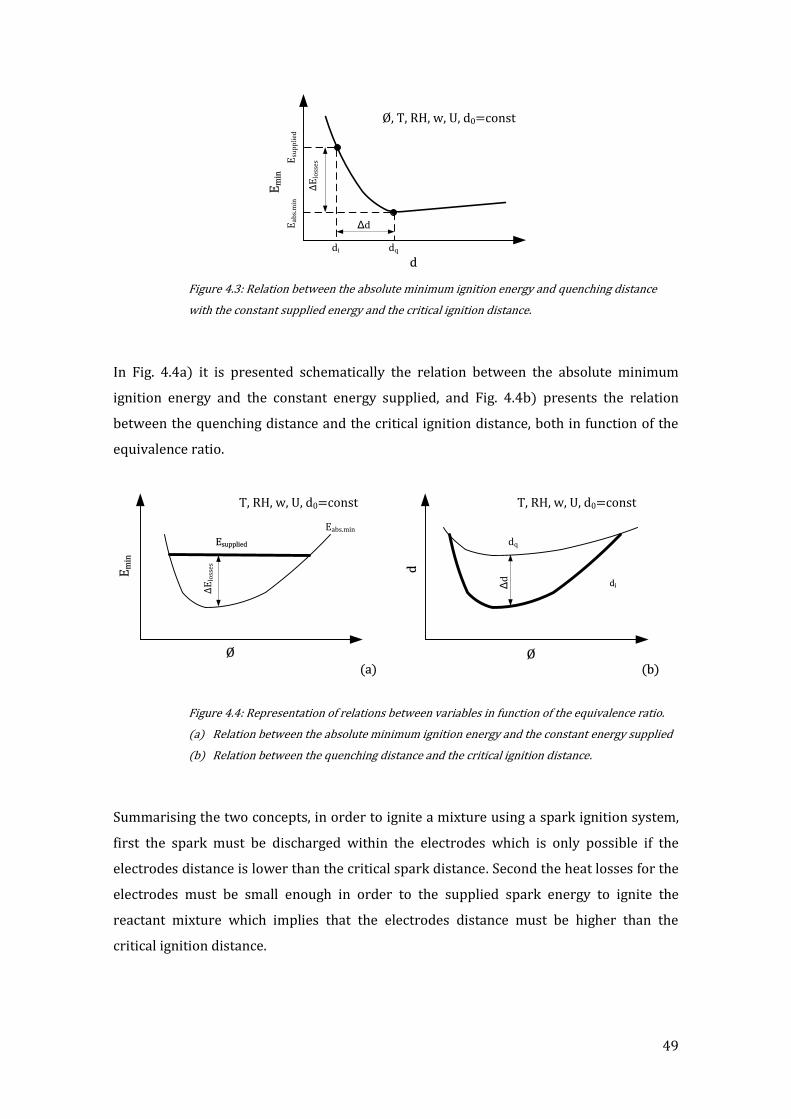
49
Figure 4.3: Relation between the absolute minimum ignition energy and quenching distance
with the constant supplied energy and the critical ignition distance.
In Fig. 4.4a) it is presented schematically the relation between the absolute minimum
ignition energy and the constant energy supplied, and Fig. 4.4b) presents the relation
between the quenching distance and the critical ignition distance, both in function of the
equivalence ratio.
Figure 4.4: Representation of relations between variables in function of the equivalence ratio.
(a) Relation between the absolute minimum ignition energy and the constant energy supplied
(b) Relation between the quenching distance and the critical ignition distance.
Summarising the two concepts, in order to ignite a mixture using a spark ignition system,
first the spark must be discharged within the electrodes which is only possible if the
electrodes distance is lower than the critical spark distance. Second the heat losses for the
electrodes must be small enough in order to the supplied spark energy to ignite the
reactant mixture which implies that the electrodes distance must be higher than the
critical ignition distance.
Esu
pp
lied
ddqdi
Eab
s.m
in
Em
in
ΔE
loss
es
Δd
Ø, T, RH, w, U, d0=const
Esupplied
Em
in
ΔE
loss
es
Eabs.min
Ø
T, RH, w, U, d0=const
(a)
dq
di
d
Ø
Δd
T, RH, w, U, d0=const
(b)
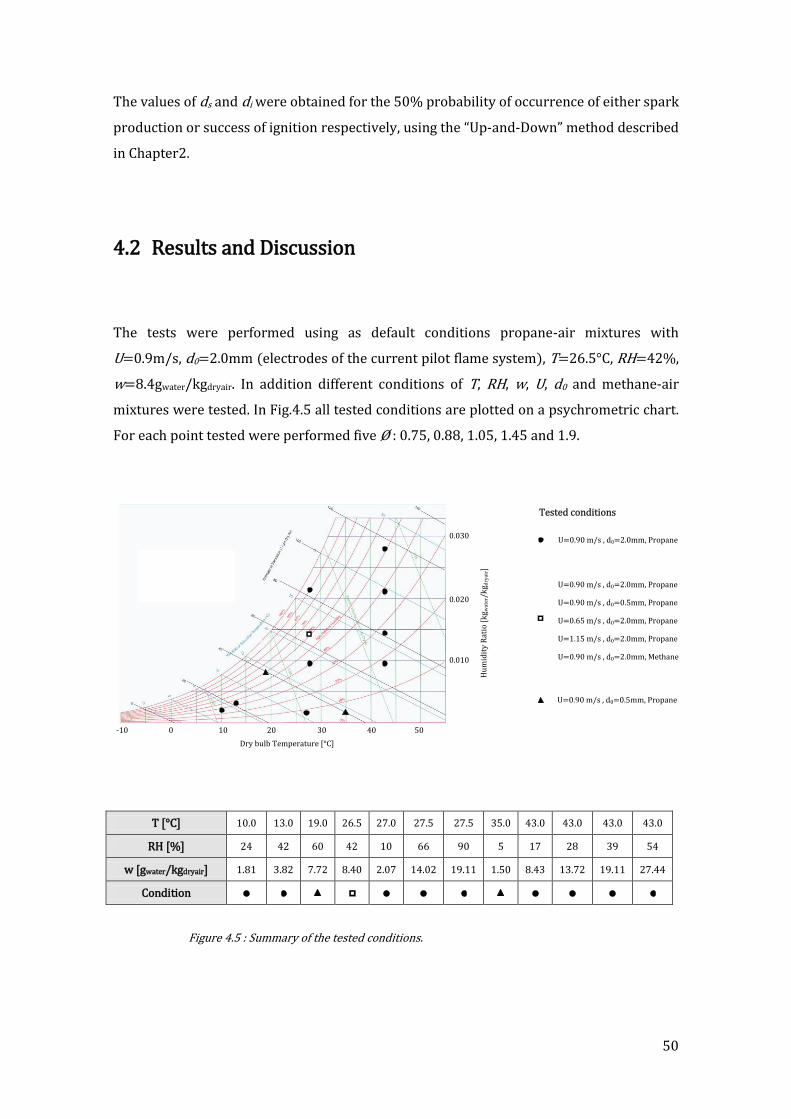
50
The values of ds and di were obtained for the 50% probability of occurrence of either spark
production or success of ignition respectively, using the “Up-and-Down” method described
in Chapter2.
4.2 Results and Discussion
The tests were performed using as default conditions propane-air mixtures with
U=0.9m/s, d0=2.0mm (electrodes of the current pilot flame system), T=26.5°C, RH=42%,
w=8.4gwater/kgdryair. In addition different conditions of T, RH, w, U, d0 and methane-air
mixtures were tested. In Fig.4.5 all tested conditions are plotted on a psychrometric chart.
For each point tested were performed five Ø : 0.75, 0.88, 1.05, 1.45 and 1.9.
T [°C] 10.0 13.0 19.0 26.5 27.0 27.5 27.5 35.0 43.0 43.0 43.0 43.0
RH [%] 24 42 60 42 10 66 90 5 17 28 39 54
w [gwater/kgdryair] 1.81 3.82 7.72 8.40 2.07 14.02 19.11 1.50 8.43 13.72 19.11 27.44
Condition
Figure 4.5 : Summary of the tested conditions.
10-10 0 20 30 40 50
0.010
0.020
0.030
Dry bulb Temperature [°C]
Hu
mid
ity
Rat
io [
kg w
ater
/kg d
ryai
r]
U=0.90 m/s , d0=2.0mm, Propane
U=0.90 m/s , d0=2.0mm, Propane
U=0.90 m/s , d0=0.5mm, Propane
U=0.65 m/s , d0=2.0mm, Propane
U=1.15 m/s , d0=2.0mm, Propane
U=0.90 m/s , d0=2.0mm, Methane
U=0.90 m/s , d0=0.5mm, Propane
Tested conditions
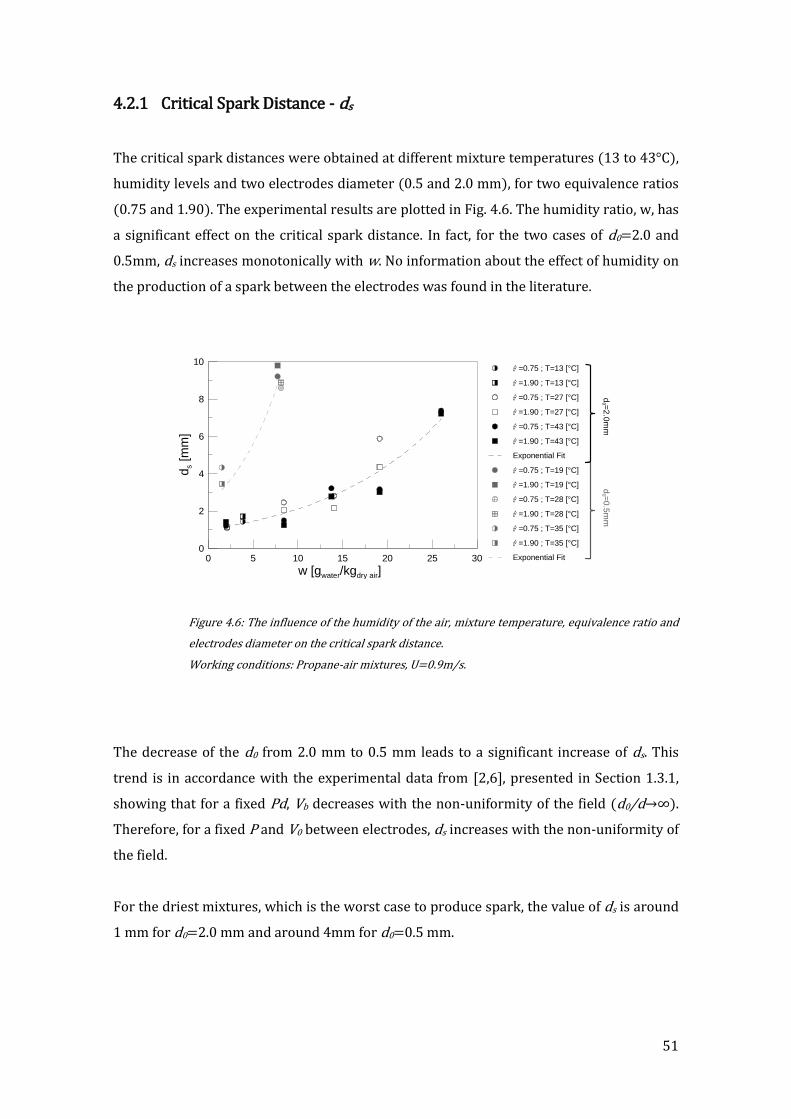
51
4.2.1 Critical Spark Distance - ds
The critical spark distances were obtained at different mixture temperatures (13 to 43°C),
humidity levels and two electrodes diameter (0.5 and 2.0 mm), for two equivalence ratios
(0.75 and 1.90). The experimental results are plotted in Fig. 4.6. The humidity ratio, w, has
a significant effect on the critical spark distance. In fact, for the two cases of d0=2.0 and
0.5mm, ds increases monotonically with w. No information about the effect of humidity on
the production of a spark between the electrodes was found in the literature.
Figure 4.6: The influence of the humidity of the air, mixture temperature, equivalence ratio and
electrodes diameter on the critical spark distance.
Working conditions: Propane-air mixtures, U=0.9m/s.
The decrease of the d0 from 2.0 mm to 0.5 mm leads to a significant increase of ds. This
trend is in accordance with the experimental data from [2,6], presented in Section 1.3.1,
showing that for a fixed Pd, Vb decreases with the non-uniformity of the field (d0/d→∞).
Therefore, for a fixed P and V0 between electrodes, ds increases with the non-uniformity of
the field.
For the driest mixtures, which is the worst case to produce spark, the value of ds is around
1 mm for d0=2.0 mm and around 4mm for d0=0.5 mm.
d0 =
2.0
mm
d0 =
0.5
mm
0 5 10 15 20 25 30
w [gwater/kgdry air]
0
2
4
6
8
10
ds [
mm
]
=0.75 ; T=13 [°C]
=1.90 ; T=13 [°C]
=0.75 ; T=27 [°C]
=1.90 ; T=27 [°C]
=0.75 ; T=43 [°C]
=1.90 ; T=43 [°C]
Exponential Fit
=0.75 ; T=19 [°C]
=1.90 ; T=19 [°C]
=0.75 ; T=28 [°C]
=1.90 ; T=28 [°C]
=0.75 ; T=35 [°C]
=1.90 ; T=35 [°C]
Exponential Fit
52
4.2.2 Critical Ignition Distance - di
This section presents the experimental study of the effect of equivalence ratio,
temperature, humidity ratio and electrodes diameter on the critical ignition distance, di.
Equivalence Ratio
The equivalence ratio of a fuel-air mixture is an important factor in spark ignition,
influencing the value of the minimum ignition energy for quiescent [1, 11] and flowing
mixtures [2,3].
Fig. 4.7a) shows the experimental results of the effect of Ø on di for propane-air and
methane-air mixtures tested for a fixed condition of U=0.9 m/s, T=26.5°C, RH=42%,
w=8.4 gwater/kgdryair, d0 =2.0 mm. The curves of the experimental di have a similar shape
with the curves of Emin obtained for quiescent mixtures by [1], shown in Fig.4.7b). The
minimum of di curve for the propane-air mixture is smaller than the minimum of di for the
methane-air mixture which is in accordance with the data of Emin. These results
demonstrate that di is a good qualitative parameter to evaluate the energy requirements
to ignite a mixture.
In Fig. 4.8 it is shown sequence of images of a flames initiations after a spark discharge
with a constant Esupplied for different electrodes spacing, 1.0mm, 1.45mm, and 2.0mm for
the same mixture conditions of Fig. 4.7a) with Ø=1.45. For these conditions of mixture, the
critical ignition distance obtained in Fig. 4.7a), is 1.45 mm.
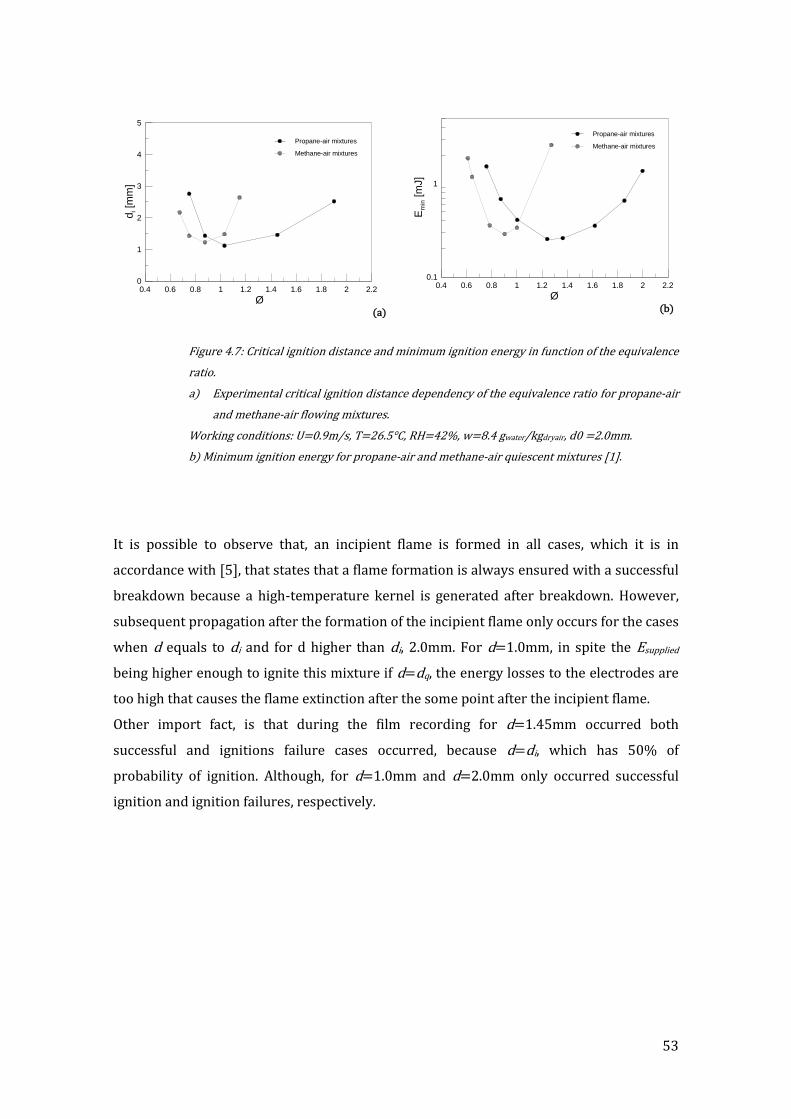
53
(a)
(b)
Figure 4.7: Critical ignition distance and minimum ignition energy in function of the equivalence
ratio.
a) Experimental critical ignition distance dependency of the equivalence ratio for propane-air
and methane-air flowing mixtures.
Working conditions: U=0.9m/s, T=26.5°C, RH=42%, w=8.4 gwater/kgdryair, d0 =2.0mm.
b) Minimum ignition energy for propane-air and methane-air quiescent mixtures [1].
It is possible to observe that, an incipient flame is formed in all cases, which it is in
accordance with [5], that states that a flame formation is always ensured with a successful
breakdown because a high-temperature kernel is generated after breakdown. However,
subsequent propagation after the formation of the incipient flame only occurs for the cases
when d equals to di and for d higher than di, 2.0mm. For d=1.0mm, in spite the Esupplied
being higher enough to ignite this mixture if d=dq, the energy losses to the electrodes are
too high that causes the flame extinction after the some point after the incipient flame.
Other import fact, is that during the film recording for d=1.45mm occurred both
successful and ignitions failure cases occurred, because d=di, which has 50% of
probability of ignition. Although, for d=1.0mm and d=2.0mm only occurred successful
ignition and ignition failures, respectively.
0.4 0.6 0.8 1 1.2 1.4 1.6 1.8 2 2.2
Ø
0
1
2
3
4
5d
i [m
m]
Propane-air mixtures
Methane-air mixtures
0.4 0.6 0.8 1 1.2 1.4 1.6 1.8 2 2.2
Ø
0.1
1
Em
in [
mJ]
Propane-air mixtures
Methane-air mixtures
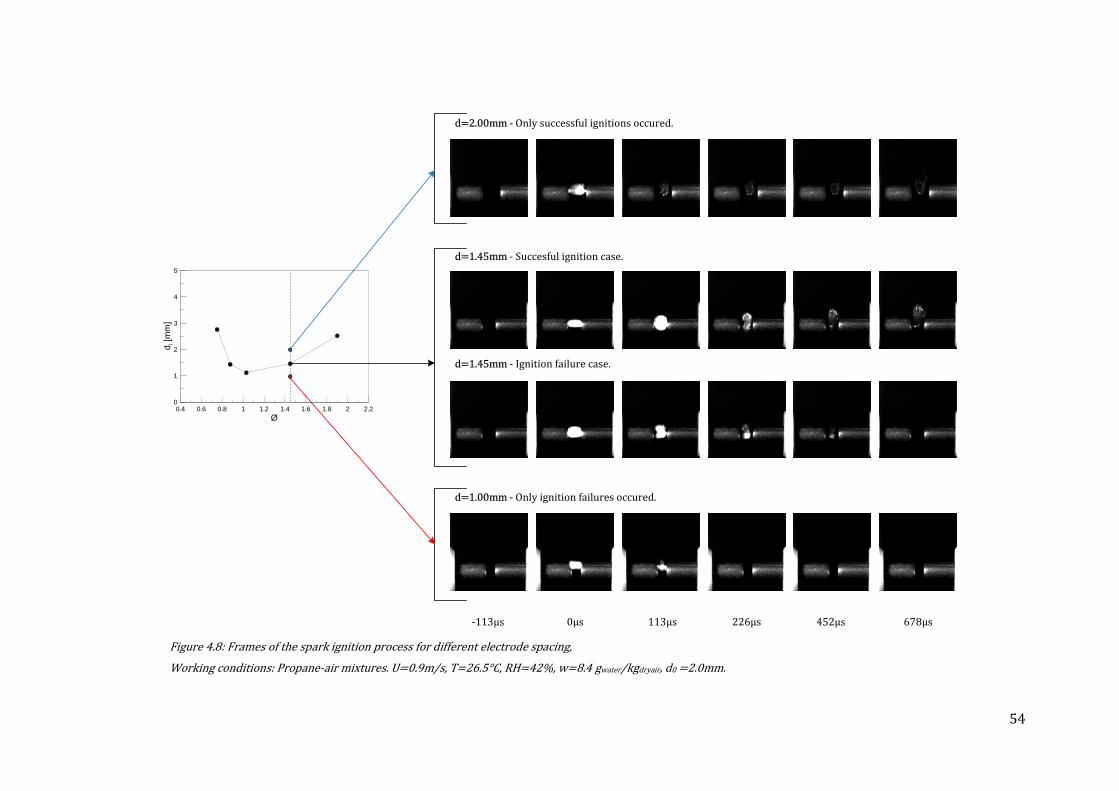
54
Figure 4.8: Frames of the spark ignition process for different electrode spacing,
Working conditions: Propane-air mixtures. U=0.9m/s, T=26.5°C, RH=42%, w=8.4 gwater/kgdryair, d0 =2.0mm.
-113μs 0μs 113μs 226μs 452μs 678μs
d=2.00mm - Only successful ignitions occured.
d=1.45mm - Succesful ignition case.
d=1.45mm - Ignition failure case.
d=1.00mm - Only ignition failures occured.
0.4 0.6 0.8 1 1.2 1.4 1.6 1.8 2 2.2
Ø
0
1
2
3
4
5
di [
mm
]
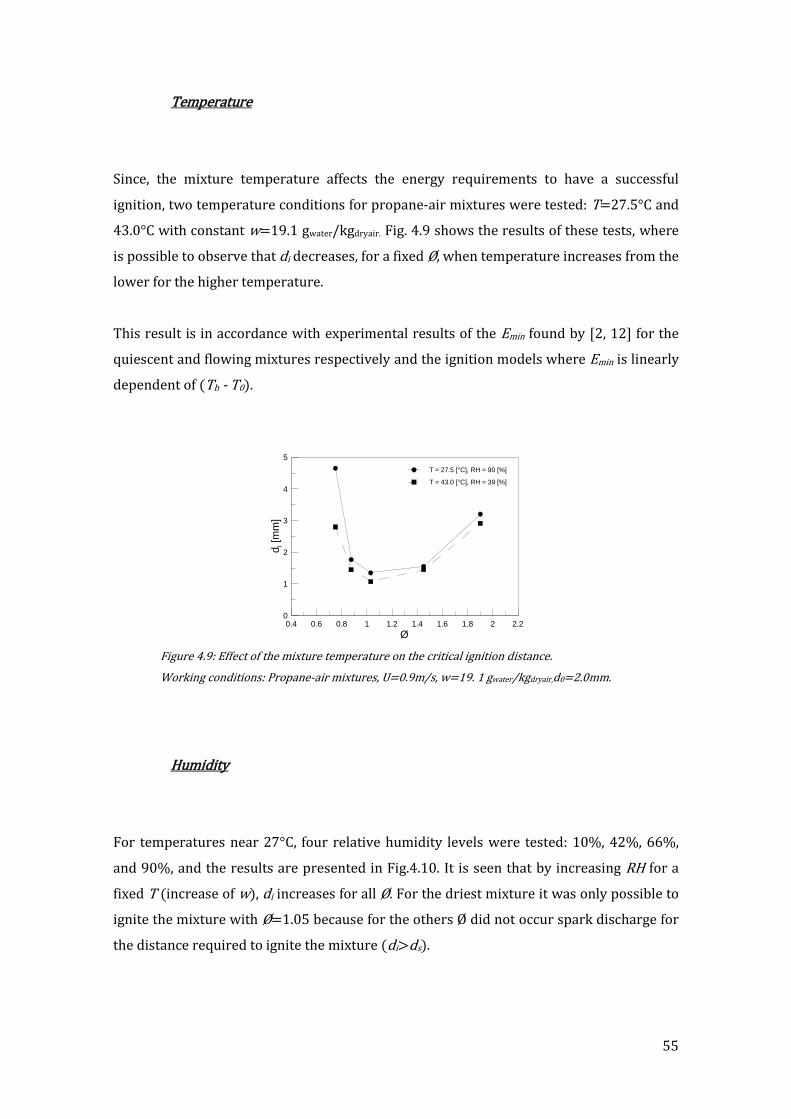
55
Temperature
Since, the mixture temperature affects the energy requirements to have a successful
ignition, two temperature conditions for propane-air mixtures were tested: T=27.5°C and
43.0°C with constant w=19.1 gwater/kgdryair. Fig. 4.9 shows the results of these tests, where
is possible to observe that di decreases, for a fixed Ø, when temperature increases from the
lower for the higher temperature.
This result is in accordance with experimental results of the Emin found by [2, 12] for the
quiescent and flowing mixtures respectively and the ignition models where Emin is linearly
dependent of (Tb - T0).
Figure 4.9: Effect of the mixture temperature on the critical ignition distance.
Working conditions: Propane-air mixtures, U=0.9m/s, w=19. 1 gwater/kgdryair,d0=2.0mm.
Humidity
For temperatures near 27°C, four relative humidity levels were tested: 10%, 42%, 66%,
and 90%, and the results are presented in Fig.4.10. It is seen that by increasing RH for a
fixed T (increase of w), di increases for all Ø. For the driest mixture it was only possible to
ignite the mixture with Ø=1.05 because for the others Ø did not occur spark discharge for
the distance required to ignite the mixture (di>ds).
0.4 0.6 0.8 1 1.2 1.4 1.6 1.8 2 2.2
Ø
0
1
2
3
4
5
di [
mm
]
T = 27.5 [°C], RH = 90 [%]
T = 43.0 [°C], RH = 39 [%]
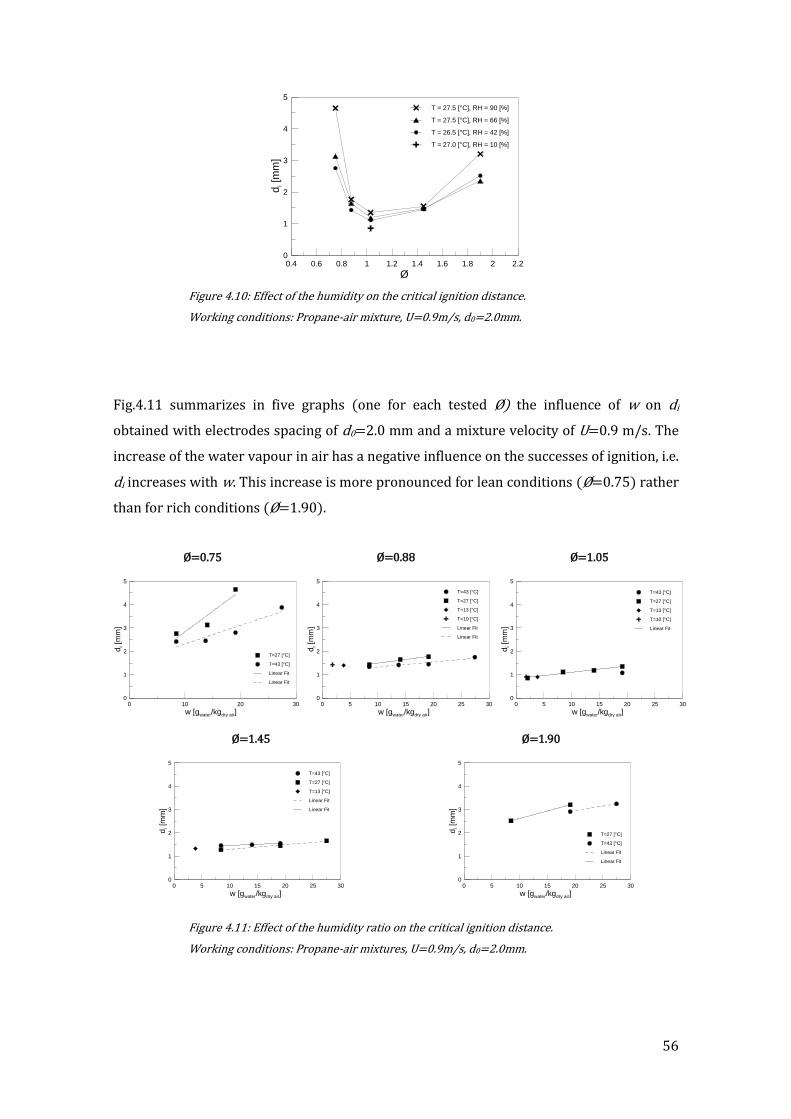
56
Figure 4.10: Effect of the humidity on the critical ignition distance.
Working conditions: Propane-air mixture, U=0.9m/s, d0=2.0mm.
Fig.4.11 summarizes in five graphs (one for each tested Ø) the influence of w on di
obtained with electrodes spacing of d0=2.0 mm and a mixture velocity of U=0.9 m/s. The
increase of the water vapour in air has a negative influence on the successes of ignition, i.e.
di increases with w. This increase is more pronounced for lean conditions (Ø=0.75) rather
than for rich conditions (Ø=1.90).
Ø=0.75
Ø=0.88
Ø=1.05
Ø=1.45
Ø=1.90
Figure 4.11: Effect of the humidity ratio on the critical ignition distance.
Working conditions: Propane-air mixtures, U=0.9m/s, d0=2.0mm.
0.4 0.6 0.8 1 1.2 1.4 1.6 1.8 2 2.2
Ø
0
1
2
3
4
5
di [
mm
]
T = 27.5 [°C], RH = 90 [%]
T = 27.5 [°C], RH = 66 [%]
T = 26.5 [°C], RH = 42 [%]
T = 27.0 [°C], RH = 10 [%]
0 10 20 30
w [gwater/kgdry air]
0
1
2
3
4
5
di [
mm
]
T=27 [°C]
T=43 [°C]
Linear Fit
Linear Fit
0 5 10 15 20 25 30
w [gwater/kgdry air]
0
1
2
3
4
5
di [
mm
]
T=43 [°C]
T=27 [°C]
T=13 [°C]
T=10 [°C]
Linear Fit
Linear Fit
0 5 10 15 20 25 30
w [gwater/kgdry air]
0
1
2
3
4
5
di [
mm
]
T=43 [°C]
T=27 [°C]
T=13 [°C]
T=10 [°C]
Linear Fit
0 5 10 15 20 25 30
w [gwater/kgdry air]
0
1
2
3
4
5
di [
mm
]
T=43 [°C]
T=27 [°C]
T=13 [°C]
Linear Fit
Linear Fit
0 5 10 15 20 25 30
w [gwater/kgdry air]
0
1
2
3
4
5
di [
mm
]
T=27 [°C]
T=43 [°C]
Linear Fit
Linear Fit

57
The negative influence of w on di, is probably explained by the humidity effect on the
inhibition of flames. According to [29], who studied the effect of adding small amounts of
water vapour on inhibition of natural gas-air flames, the laminar burning velocity
decreases by increasing water vapour concentration, which is caused by the thermal
capacity of water vapour that acts as a heat sink (cp of water vapour is two times higher
than cp of air).
The slowing down of the propagation, affects two terms in the balance presented in
Fig.4.2. First, decreases the rate of heat release by the chemical reaction, , and
secondly gives more time to the heat losses to occur due to slower expansion of the flame
kernel. These two contributions have a negative effect on the balance which has to be
compensated by the increase of d (reducing the heat losses to the electrodes) in order to
ensure a successful ignition.
Velocity
In flowing mixtures, the volume heated by the spark increases with the mean mixture
velocity. The heat losses to the vicinity are affected by the flow and increase with the mean
velocity, according to [2,3].
Fig. 4.12 presents the experimental results of the critical ignition distance for three
mixture velocities: 0.65, 0.9 and 1.15 m/s. For these velocities, di only suffers a slightly
increase with the mean velocity, which can be related with the small range of tested
velocities.
Figure 4.12: Critical ignition distance dependency of the mixture velocity.
Working conditions: Propane-air mixture, T=26.5°C, RH=42%, w=8.4 gwater/kgdryair, d0=2.0mm.
0.4 0.6 0.8 1 1.2 1.4 1.6 1.8 2 2.2
Ø
0
1
2
3
4
5
di [
mm
]
U = 0.65 [m/s]
U = 0.90 [m/s]
U = 1.15 [m/s]
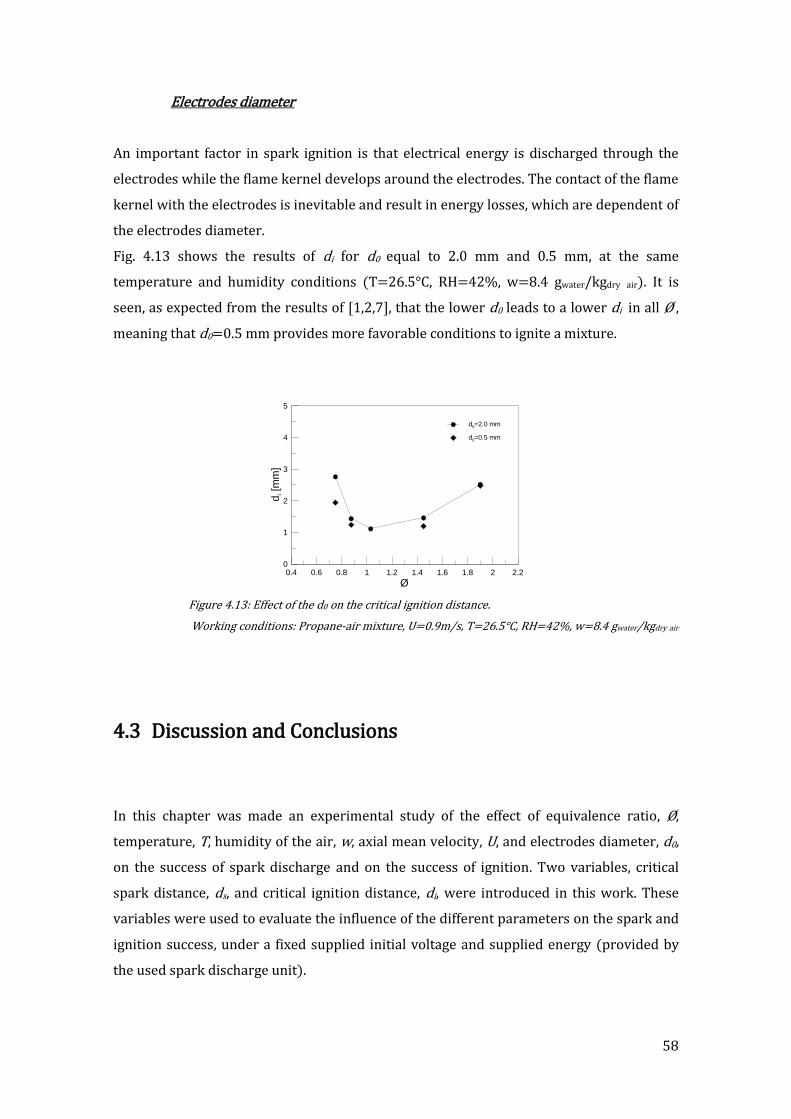
58
Electrodes diameter
An important factor in spark ignition is that electrical energy is discharged through the
electrodes while the flame kernel develops around the electrodes. The contact of the flame
kernel with the electrodes is inevitable and result in energy losses, which are dependent of
the electrodes diameter.
Fig. 4.13 shows the results of di for d0 equal to 2.0 mm and 0.5 mm, at the same
temperature and humidity conditions (T=26.5°C, RH=42%, w=8.4 gwater/kgdry air). It is
seen, as expected from the results of [1,2,7], that the lower d0 leads to a lower di in all Ø ,
meaning that d0=0.5 mm provides more favorable conditions to ignite a mixture.
Figure 4.13: Effect of the d0 on the critical ignition distance.
Working conditions: Propane-air mixture, U=0.9m/s, T=26.5°C, RH=42%, w=8.4 gwater/kgdry air
4.3 Discussion and Conclusions
In this chapter was made an experimental study of the effect of equivalence ratio, Ø,
temperature, T, humidity of the air, w, axial mean velocity, U, and electrodes diameter, d0,
on the success of spark discharge and on the success of ignition. Two variables, critical
spark distance, ds, and critical ignition distance, di, were introduced in this work. These
variables were used to evaluate the influence of the different parameters on the spark and
ignition success, under a fixed supplied initial voltage and supplied energy (provided by
the used spark discharge unit).
0.4 0.6 0.8 1 1.2 1.4 1.6 1.8 2 2.2
Ø
0
1
2
3
4
5
di [
mm
]
d0=2.0 mm
d0=0.5 mm

59
The results of the tests to determine ds, shown that:
ds increases with w (seems to be exponential relation)
ds decreases with d0
The results of the tests to determine di, shown that:
di varies with Ø, having a minimum for slightly rich mixtures and increases for
deviations from this minimum.
di decreases with T
di increase with w
di increases with U
ds increases with d0
In order ignite a mixture using a spark ignition system, first the spark must be discharged
between the electrodes (d<ds ) and secondly the heat losses to the electrodes must be
small enough in order to the discharged spark energy to ignite the reactant mixture
(d>di). In Fig.4.14 a graph is shown with the curves of ds and di as function of Ø that
explains graphically the two conditions expressed above, for a propane-air mixture with:
T, RH, U, d0 fixed parameters.
Figure 4.14: Critical spark distance and critical ignition distance.
Working conditions: Propane-air mixtures, U=0.9m/s T=26.5°C, RH=42%, w=8.4 gwater/kgdryair,
d0=2.0mm.
The work area (di<d<ds) can vary, by changing the ds curve or the di curve. However, the
results obtained in Sections 4.2.1 and 4.2.2 showed for the tested conditions that ds
changes significantly but di only changes slightly with humidity ratio and the electrodes
diameter.
0.4 0.6 0.8 1 1.2 1.4 1.6 1.8 2 2.2
Ø
0
2
4
6
8
d [m
m]
ds
di
Spark + Ignition = Flame
No Spark
No Ignition
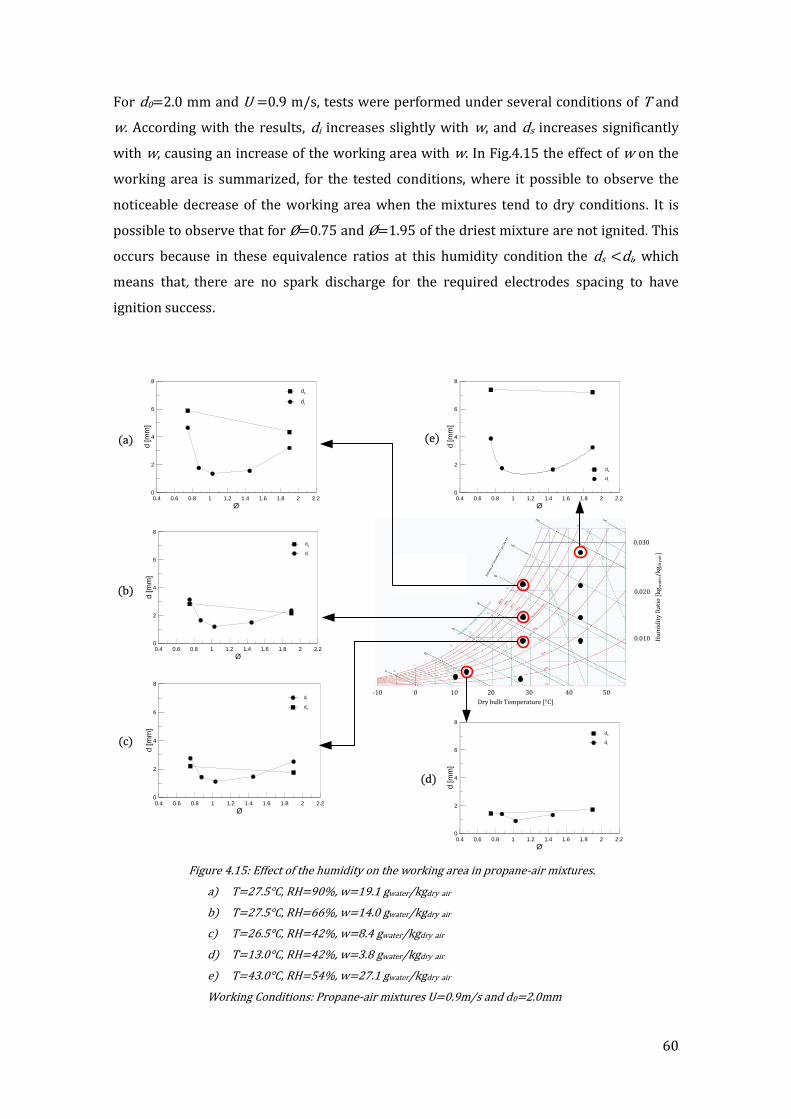
60
For d0=2.0 mm and U =0.9 m/s, tests were performed under several conditions of T and
w. According with the results, di increases slightly with w, and ds increases significantly
with w, causing an increase of the working area with w. In Fig.4.15 the effect of w on the
working area is summarized, for the tested conditions, where it possible to observe the
noticeable decrease of the working area when the mixtures tend to dry conditions. It is
possible to observe that for Ø=0.75 and Ø=1.95 of the driest mixture are not ignited. This
occurs because in these equivalence ratios at this humidity condition the ds <di, which
means that, there are no spark discharge for the required electrodes spacing to have
ignition success.
Figure 4.15: Effect of the humidity on the working area in propane-air mixtures.
a) T=27.5°C, RH=90%, w=19.1 gwater/kgdry air
b) T=27.5°C, RH=66%, w=14.0 gwater/kgdry air
c) T=26.5°C, RH=42%, w=8.4 gwater/kgdry air
d) T=13.0°C, RH=42%, w=3.8 gwater/kgdry air
e) T=43.0°C, RH=54%, w=27.1 gwater/kgdry air
Working Conditions: Propane-air mixtures U=0.9m/s and d0=2.0mm
10-10 0 20 30 40 50
0.010
0.020
0.030
Dry bulb Temperature [°C]
Hu
mid
ity
Rat
io [
kg w
ater
/kg d
ryai
r]
(a)
(b)
(c)
0.4 0.6 0.8 1 1.2 1.4 1.6 1.8 2 2.2
Ø
0
2
4
6
8
d [m
m]
ds
di
0.4 0.6 0.8 1 1.2 1.4 1.6 1.8 2 2.2
Ø
0
2
4
6
8
d [m
m]
ds
di
0.4 0.6 0.8 1 1.2 1.4 1.6 1.8 2 2.2
Ø
0
2
4
6
8
d [m
m]
ds
di
0.4 0.6 0.8 1 1.2 1.4 1.6 1.8 2 2.2
Ø
0
2
4
6
8
d [m
m]
ds
di
(e)
0.4 0.6 0.8 1 1.2 1.4 1.6 1.8 2 2.2
Ø
0
2
4
6
8
d [m
m]
di
ds
(d)
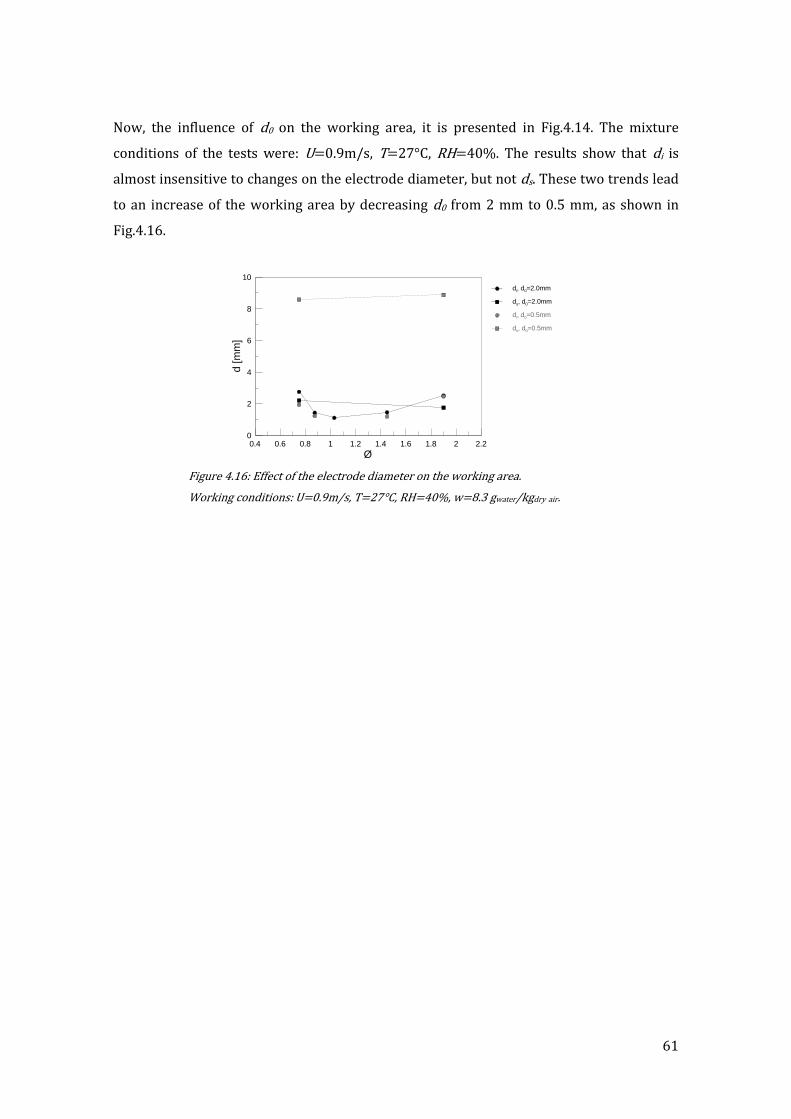
61
Now, the influence of d0 on the working area, it is presented in Fig.4.14. The mixture
conditions of the tests were: U=0.9m/s, T=27°C, RH=40%. The results show that di is
almost insensitive to changes on the electrode diameter, but not ds. These two trends lead
to an increase of the working area by decreasing d0 from 2 mm to 0.5 mm, as shown in
Fig.4.16.
Figure 4.16: Effect of the electrode diameter on the working area.
Working conditions: U=0.9m/s, T=27°C, RH=40%, w=8.3 gwater/kgdry air.
0.4 0.6 0.8 1 1.2 1.4 1.6 1.8 2 2.2
Ø
0
2
4
6
8
10
d [m
m]
di, d0=2.0mm
ds, d0=2.0mm
di, d0=0.5mm
ds, d0=0.5mm

62
CHAPTER 5
SYSTEM OPTIMIZATION
In this chapter it is proposed a new pilot flame system. In Section 5.1 it is present the
study of new pilot tube geometry to improve air entrainment. In Section 5.2 it is presented
the proposed pilot flame system, based on the new tube geometry and on a new electrodes
arrangement and configuration, and their experimental characterization. In Section 5.3 a
discussion and conclusions of this chapter are presented.

63
5.1 Improvement of Air Entrainment
One of the main ideas suggested in this work to improve the ignition success is to reduce
the Øprim of the pilot jet to a value near stoichiometry, which is the more adequate
condition to ignite a propane-air mixture, as shown in Chapter 4. In this condition the Emin
is the lowest required to ignite a propane-air mixture, either quiescent or flowing
according to [1,3], respectively.
In order to predict the influence of the geometric parameters of the fuel injector and pilot
tube system on Øprim, a theoretical model was used for the determination of the primary
air entrainment [30]. This model is based on momentum and energy balances between
different sections of a general burner system, as: fuel injector, burner nozzle, and burner
exit. The model is composed by three equations (5.1, 5.2, 5.3), which are constrained
essentially by the geometric parameters of the system. Fig.5.1 shows a schematic drawing
of the pilot flame system with the different sections used in the air entrainment model.
(5.1)
(5.2)
(5.3)
Figure 5.1: Schematic drawing of the pilot tube system with the different sections used in the
entrainment model.
From the manipulation of the previous equations, results a final equation (5.4) where it is
possible to determine and consequently Øprim.
(5.4)
The parameter β, associated to U3, is a momentum flux correction factor due to non-
uniformity of the axial velocity profile inside the tube and is described in [31].
inj
Pilot
tube
2
3
4
mfuel
.
.mair + mfuel
.
Air entrainment

64
Based on the air entrainment model, the Øprim of the pilot jet was computed in function of
the internal diameter of the pilot tube (Dtube). The computation was made for the current
propane injector of 0.35 mm of diameter and a pilot tube of uniform diameter (A3=A4), in
which case and consequently Øprim are independent of the parameter β. The result of
the computation is shown in Fig.5.2 where it is possible to observe the decrease of Øprim
with Dtube.
Figure 5.2: Computation of the Øprim dependency of the Dtube.
Working conditions: Propane injector diameter=0.35mm
In order to validate the computation, velocity measurements were made in the new pilot
tube geometry with a uniform Dtube of 4.8 mm. The new pilot tube geometry is shown in
Fig.5.3a-c). The velocity measurements were performed at the same conditions as the
current pilot tube geometry measurements (0.5 mm downstream from the pilot exit and
for the Qpropane= 0.288 l/min).
(a) (b) (c) (d)
Figure 5.3: New pilot tube geometry.
a) and b)- New pilot tube global appearance
c) Entrance and exit of the new pilot tube with Dtube=4.8 mm.
d) Entrance and exit of the new pilot tube with Dtube=6.5 mm.
2 3 4 5 6 7 8 9
Dtube [mm]
0
0.5
1
1.5
2
2.5
3
3.5Ø
pri
m
Theoretical model
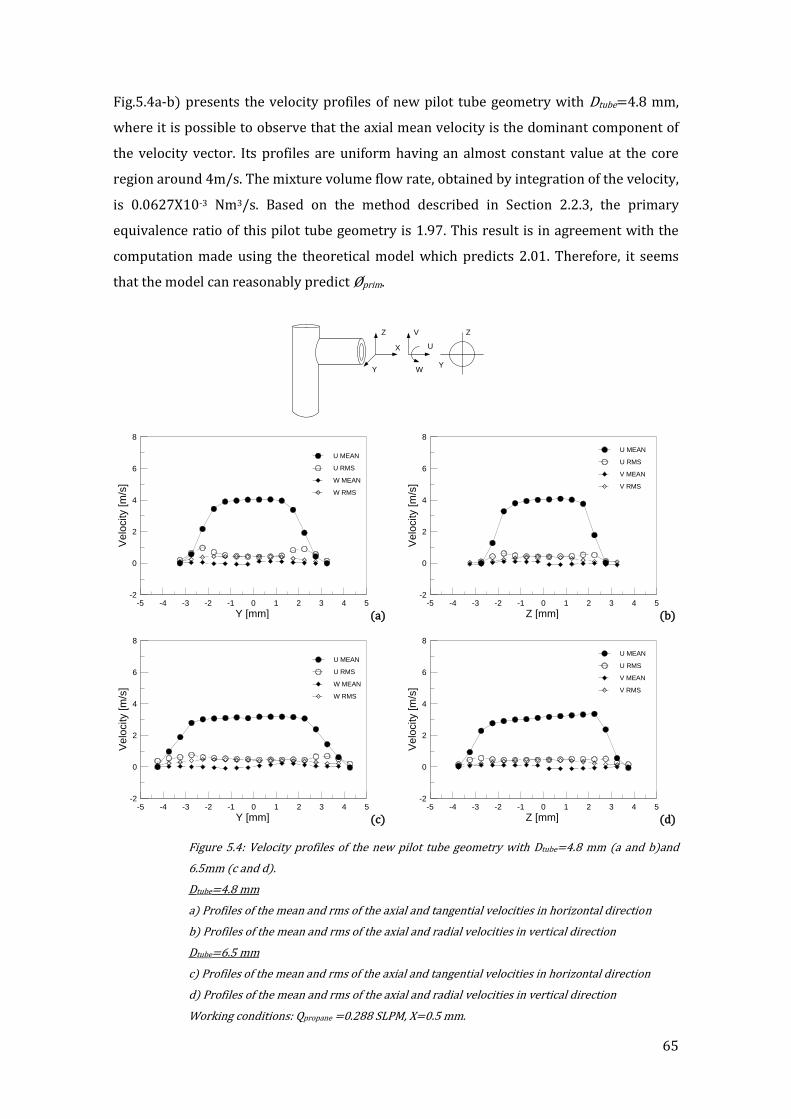
65
Fig.5.4a-b) presents the velocity profiles of new pilot tube geometry with Dtube=4.8 mm,
where it is possible to observe that the axial mean velocity is the dominant component of
the velocity vector. Its profiles are uniform having an almost constant value at the core
region around 4m/s. The mixture volume flow rate, obtained by integration of the velocity,
is 0.0627X10⁻³ Nm3/s. Based on the method described in Section 2.2.3, the primary
equivalence ratio of this pilot tube geometry is 1.97. This result is in agreement with the
computation made using the theoretical model which predicts 2.01. Therefore, it seems
that the model can reasonably predict Øprim.
(a)
(b)
(c)
(d)
Figure 5.4: Velocity profiles of the new pilot tube geometry with Dtube=4.8 mm (a and b)and
6.5mm (c and d).
Dtube=4.8 mm
a) Profiles of the mean and rms of the axial and tangential velocities in horizontal direction
b) Profiles of the mean and rms of the axial and radial velocities in vertical direction
Dtube=6.5 mm
c) Profiles of the mean and rms of the axial and tangential velocities in horizontal direction
d) Profiles of the mean and rms of the axial and radial velocities in vertical direction
Working conditions: Qpropane =0.288 SLPM, X=0.5 mm.
X
Z
Y
Z
Y
V
U
W
-5 -4 -3 -2 -1 0 1 2 3 4 5
Y [mm]
-2
0
2
4
6
8
Ve
locity [
m/s
]
U MEAN
U RMS
W MEAN
W RMS
-5 -4 -3 -2 -1 0 1 2 3 4 5
Z [mm]
-2
0
2
4
6
8
Ve
locity [
m/s
]
U MEAN
U RMS
V MEAN
V RMS
-5 -4 -3 -2 -1 0 1 2 3 4 5
Y [mm]
-2
0
2
4
6
8
Ve
locity [
m/s
]
U MEAN
U RMS
W MEAN
W RMS
-5 -4 -3 -2 -1 0 1 2 3 4 5
Z [mm]
-2
0
2
4
6
8
Ve
locity [
m/s
]
U MEAN
U RMS
V MEAN
V RMS
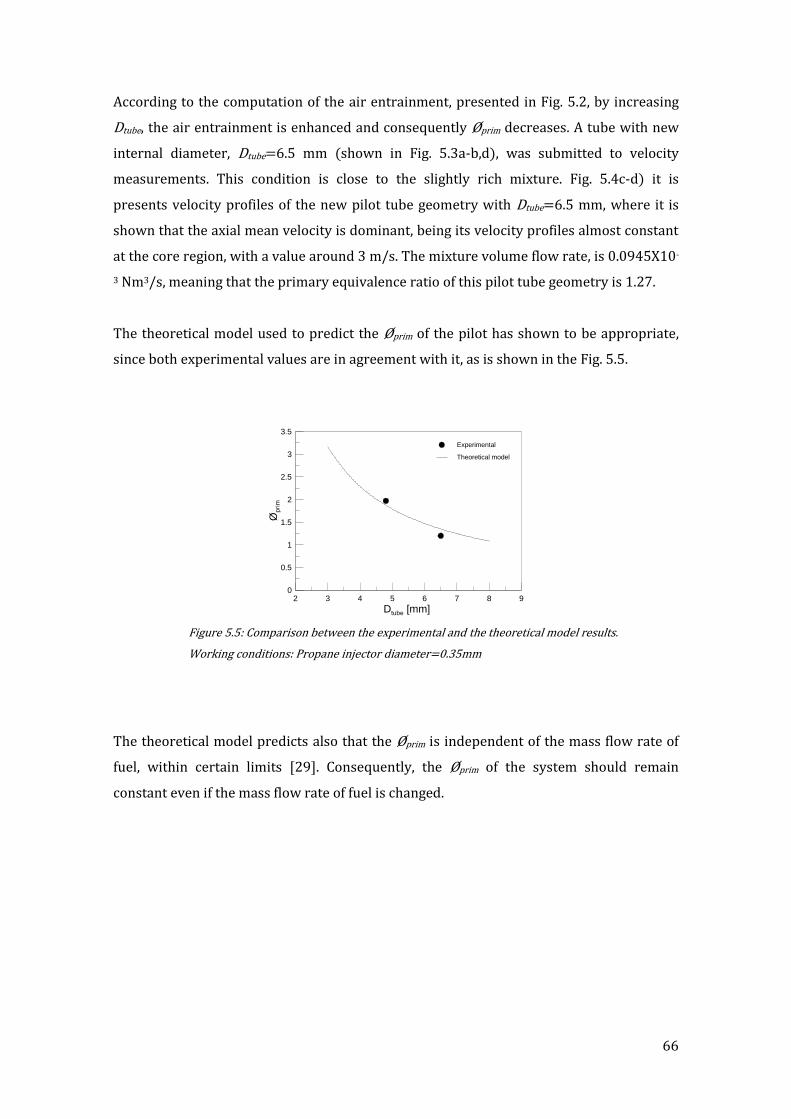
66
According to the computation of the air entrainment, presented in Fig. 5.2, by increasing
Dtube, the air entrainment is enhanced and consequently Øprim decreases. A tube with new
internal diameter, Dtube=6.5 mm (shown in Fig. 5.3a-b,d), was submitted to velocity
measurements. This condition is close to the slightly rich mixture. Fig. 5.4c-d) it is
presents velocity profiles of the new pilot tube geometry with Dtube=6.5 mm, where it is
shown that the axial mean velocity is dominant, being its velocity profiles almost constant
at the core region, with a value around 3 m/s. The mixture volume flow rate, is 0.0945X10-
3 Nm3/s, meaning that the primary equivalence ratio of this pilot tube geometry is 1.27.
The theoretical model used to predict the Øprim of the pilot has shown to be appropriate,
since both experimental values are in agreement with it, as is shown in the Fig. 5.5.
Figure 5.5: Comparison between the experimental and the theoretical model results.
Working conditions: Propane injector diameter=0.35mm
The theoretical model predicts also that the Øprim is independent of the mass flow rate of
fuel, within certain limits [29]. Consequently, the Øprim of the system should remain
constant even if the mass flow rate of fuel is changed.
2 3 4 5 6 7 8 9
Dtube [mm]
0
0.5
1
1.5
2
2.5
3
3.5
Øp
rim
Experimental
Theoretical model
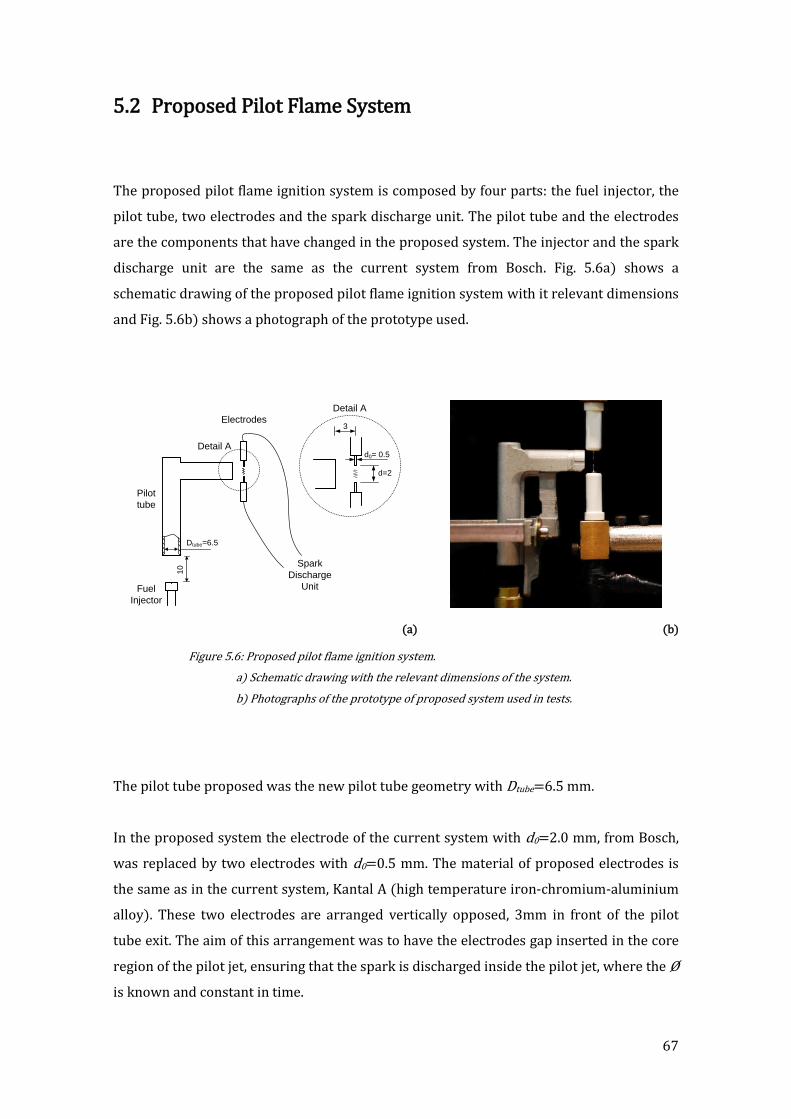
67
5.2 Proposed Pilot Flame System
The proposed pilot flame ignition system is composed by four parts: the fuel injector, the
pilot tube, two electrodes and the spark discharge unit. The pilot tube and the electrodes
are the components that have changed in the proposed system. The injector and the spark
discharge unit are the same as the current system from Bosch. Fig. 5.6a) shows a
schematic drawing of the proposed pilot flame ignition system with it relevant dimensions
and Fig. 5.6b) shows a photograph of the prototype used.
(a)
(b)
Figure 5.6: Proposed pilot flame ignition system.
a) Schematic drawing with the relevant dimensions of the system.
b) Photographs of the prototype of proposed system used in tests.
The pilot tube proposed was the new pilot tube geometry with Dtube=6.5 mm.
In the proposed system the electrode of the current system with d0=2.0 mm, from Bosch,
was replaced by two electrodes with d0=0.5 mm. The material of proposed electrodes is
the same as in the current system, Kantal A (high temperature iron-chromium-aluminium
alloy). These two electrodes are arranged vertically opposed, 3mm in front of the pilot
tube exit. The aim of this arrangement was to have the electrodes gap inserted in the core
region of the pilot jet, ensuring that the spark is discharged inside the pilot jet, where the Ø
is known and constant in time.
Fuel
Injector
10
Pilot
tube
Spark
Discharge
Unit
Detail A
3
d=2
Dtube=6.5
d0= 0.5
Electrodes
Detail A

68
The choice of the electrodes with d0=0.5 mm was made due to the higher ds obtained with
d0=0.5 mm compared to those ones with d0=2.0 mm (current system), as was shown in
Section 4.2.1. Additionally, the d0=0.5 mm gives more favourable conditions to have
successful ignition, requiring a di lower than the current electrodes according to the
results obtained in the Section 4.2.2.
The chosen electrodes spacing was 2.0 mm, based on the already established criteria that
di<d<ds. In Section 4.1 was shown that the critical spark distance is significantly affected
by the humidity ratio, decreasing with it. Thus, the worst condition to discharge a spark
occurs in dry mixtures. The tests performed in Section 4.1 showed that the minimum ds
obtained with d0=0.5 mm was 3.5 mm. The results of the Section 4.2 showed that for Øprim
of the proposed pilot, di is always lower than 2 mm (for the tested condition). Therefore,
the electrode spacing of 2.0 mm was chose to cover a wide range of ambient conditions.
Fig.5.7 shows a graph with the results of di as function of the Ø obtained in Chapter 4 from
model system using the electrodes with d0=0.5 mm, for U=0.9 m/s, T=27°C, RH=40% and
w=8.4g/kg. Fig.5.7 also represent Øprim of the proposed pilot flame system and the
proposed d.
Figure 5.7: Representation of the Øprim of the proposed pilot flame system and the proposed d in
a graph of the ds dependency of the Ø.
Working conditions: U=0.9 m/s, d0 = 0.5 mm, T=27°C, RH=40%, w=8.4g/kg
In order to analyze the flame structure, shape and stability in this new pilot tube, images
were recorded of the flame at different Qpropane, from 0.05 SLPM to 0.288 SLPM. In addition
was measured the axial mean velocity of the jet, in the center of the pilot tube, at 0.5 mm
downstream of the exit, using the LDV.
0.4 0.6 0.8 1 1.2 1.4 1.6 1.8 2 2.2
Ø
0
2
4
6
8
10
d [m
m]
ds
di
Spline smoothing
Proposed d
Øprim

69
Fig.5.8 presents images of the pilot flame of for three different Qpropane and graphs of the
evolutions with the Qpropane of the horizontal length of the flame, the angle formed between
the flame and horizontal and the axial mean velocity. The length and the angle of flame
were based in the visual shape of the flame and were determined by image analysis.
Figure 5.8: Graphs and images of the pilot flame characteristics in function of the Qpropane.
a) Horizontal length of the flame in function of the Qpropane
b) Angle between the flame and horizontal in function of the Qpropane
c) Velocity at the center of the pilot tube in function of the Qpropane.(LDV).
The produced flame is blue with two cones of reaction in any of the tested conditions,
which are in agreement with the independence of the Øprim with mass flow rate of fuel,
revealed by the theoretical model [29]. By increasing the Qpropane, the horizontal length of
the flame increases, reaching 65 mm with 0.288 SLPM. The angle formed between the
flame and horizontal decreases with the Qpropane, and the mean velocity increases linearly.
0 0.1 0.2 0.3 0.4
Qpropane [SLPM]
0
15
30
45
60
Fla
me
An
gle
[°]
0 0.1 0.2 0.3 0.4
Qpropane [SLPM]
0
1
2
3
4
U [
m/s
]
0.1 SLPM 0.2 SLPM 0.288 SLPM
(a)
(b)
(c)
0 0.1 0.2 0.3 0.4
Qpropane [SLPM]
0
20
40
60
80
Hori
zo
nta
l fla
me
le
ng
th [
mm
]
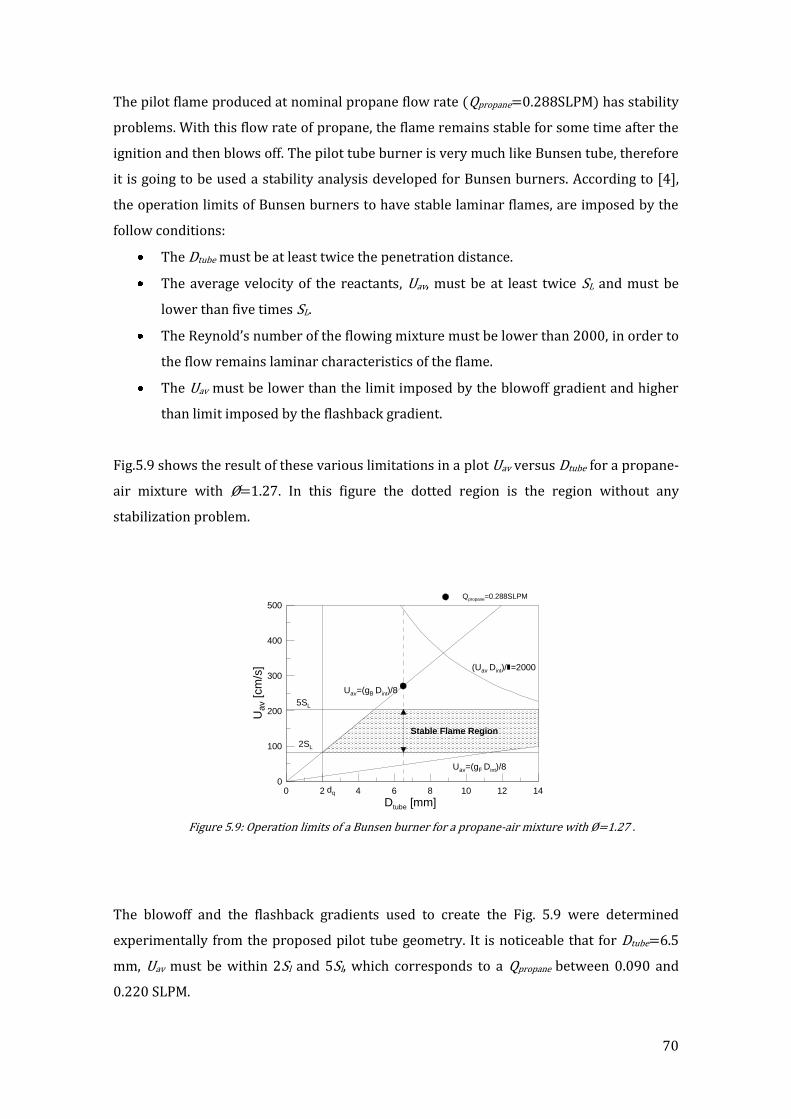
70
The pilot flame produced at nominal propane flow rate (Qpropane=0.288SLPM) has stability
problems. With this flow rate of propane, the flame remains stable for some time after the
ignition and then blows off. The pilot tube burner is very much like Bunsen tube, therefore
it is going to be used a stability analysis developed for Bunsen burners. According to [4],
the operation limits of Bunsen burners to have stable laminar flames, are imposed by the
follow conditions:
The Dtube must be at least twice the penetration distance.
The average velocity of the reactants, Uav, must be at least twice SL and must be
lower than five times SL.
The Reynold’s number of the flowing mixture must be lower than 2000, in order to
the flow remains laminar characteristics of the flame.
The Uav must be lower than the limit imposed by the blowoff gradient and higher
than limit imposed by the flashback gradient.
Fig.5.9 shows the result of these various limitations in a plot Uav versus Dtube for a propane-
air mixture with Ø=1.27. In this figure the dotted region is the region without any
stabilization problem.
Figure 5.9: Operation limits of a Bunsen burner for a propane-air mixture with Ø=1.27 .
The blowoff and the flashback gradients used to create the Fig. 5.9 were determined
experimentally from the proposed pilot tube geometry. It is noticeable that for Dtube=6.5
mm, Uav must be within 2Sl and 5Sl, which corresponds to a Qpropane between 0.090 and
0.220 SLPM.
0 2 4 6 8 10 12 14
Dtube [mm]
0
100
200
300
400
500
Uav [
cm
/s]
Qpropane=0.288SLPM
2SL
5SL
dq
(Uav Dint)/=2000
Stable Flame Region
Uav=(gF Dint)/8
Uav=(gB Dint)/8
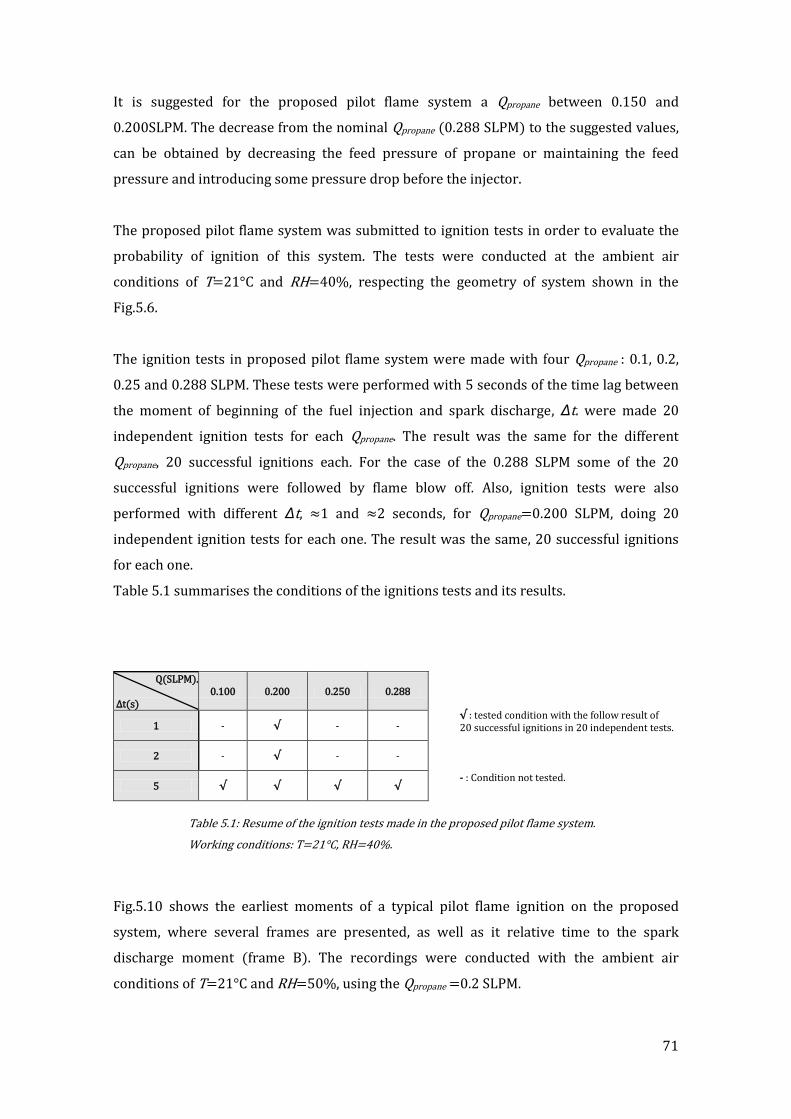
71
It is suggested for the proposed pilot flame system a Qpropane between 0.150 and
0.200SLPM. The decrease from the nominal Qpropane (0.288 SLPM) to the suggested values,
can be obtained by decreasing the feed pressure of propane or maintaining the feed
pressure and introducing some pressure drop before the injector.
The proposed pilot flame system was submitted to ignition tests in order to evaluate the
probability of ignition of this system. The tests were conducted at the ambient air
conditions of T=21°C and RH=40%, respecting the geometry of system shown in the
Fig.5.6.
The ignition tests in proposed pilot flame system were made with four Qpropane : 0.1, 0.2,
0.25 and 0.288 SLPM. These tests were performed with 5 seconds of the time lag between
the moment of beginning of the fuel injection and spark discharge, Δt. were made 20
independent ignition tests for each Qpropane. The result was the same for the different
Qpropane, 20 successful ignitions each. For the case of the 0.288 SLPM some of the 20
successful ignitions were followed by flame blow off. Also, ignition tests were also
performed with different Δt, ≈1 and ≈2 seconds, for Qpropane=0.200 SLPM, doing 20
independent ignition tests for each one. The result was the same, 20 successful ignitions
for each one.
Table 5.1 summarises the conditions of the ignitions tests and its results.
Q(SLPM).
Δt(s) 0.100 0.200 0.250 0.288
1 - √ - -
2 - √ - -
5 √ √ √ √
√ : tested condition with the follow result of 20 successful ignitions in 20 independent tests. - : Condition not tested.
Table 5.1: Resume of the ignition tests made in the proposed pilot flame system.
Working conditions: T=21°C, RH=40%.
Fig.5.10 shows the earliest moments of a typical pilot flame ignition on the proposed
system, where several frames are presented, as well as it relative time to the spark
discharge moment (frame B). The recordings were conducted with the ambient air
conditions of T=21°C and RH=50%, using the Qpropane =0.2 SLPM.
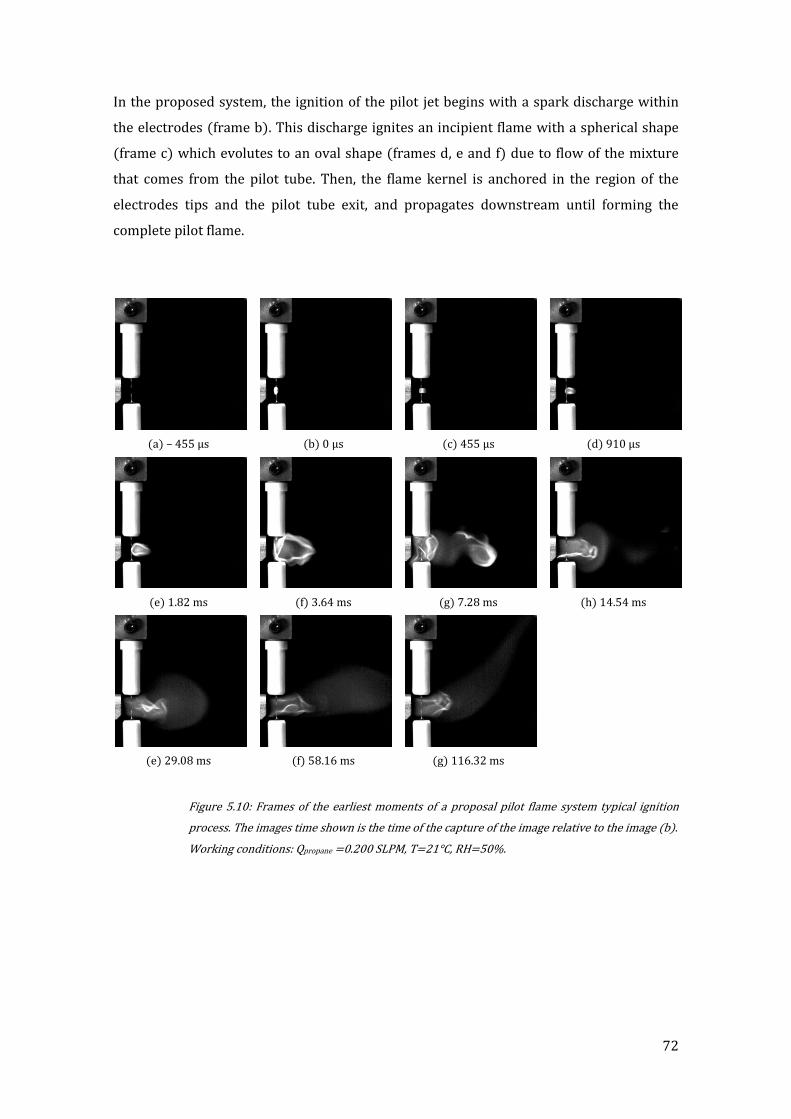
72
In the proposed system, the ignition of the pilot jet begins with a spark discharge within
the electrodes (frame b). This discharge ignites an incipient flame with a spherical shape
(frame c) which evolutes to an oval shape (frames d, e and f) due to flow of the mixture
that comes from the pilot tube. Then, the flame kernel is anchored in the region of the
electrodes tips and the pilot tube exit, and propagates downstream until forming the
complete pilot flame.
(a) – 455 μs (b) 0 μs (c) 455 μs (d) 910 μs
(e) 1.82 ms (f) 3.64 ms (g) 7.28 ms (h) 14.54 ms
(e) 29.08 ms (f) 58.16 ms (g) 116.32 ms
Figure 5.10: Frames of the earliest moments of a proposal pilot flame system typical ignition
process. The images time shown is the time of the capture of the image relative to the image (b).
Working conditions: Qpropane =0.200 SLPM, T=21°C, RH=50%.

73
5.3 Discussion and Conclusions
In this chapter it was proposed a new pilot flame system in order to improve the ignition
ability. This system is based in a new pilot tube and a new electrode arrangement.
The new pilot tube has a uniform internal diameter of 6.5mm. The velocity profiles of the
axial mean velocity are flat-top velocity type, with a velocity at top around 3 m/s, for the
nominal volume flow rate of propane, Qpropane, equals to 0.288 SLPM. The primary
equivalence ratio obtained in this system is 1.27. The pilot flame produced by new pilot
tube burner is composed by two cones of reaction and its colour is light blue.
The new electrodes arrangement is composed by two electrodes of 0.5mm tip vertically
opposed with 2.0 mm of electrode spacing, placed 3.0 mm in front of the pilot port. This
electrode arrangement ensures that the spark is discharged in core of the pilot jet. For the
design of this system the results of the Chapter 4 were used.
The pilot flame of this system blows off, after to be ignited, with the nominal
Qpropane=0.288SLPM. Therefore, based in the stability study it is recommended that the
Qpropane values should be in the interval between 0.15 and 0.20 SLPM, which produces
stable flames with the horizontal length around 3.7 cm to 4.3 cm respectively. The
reduction of the Qpropane can be accomplished by decreasing the feed static pressure of the
propane or by adding some head loss by like a thin-plate orifice before the propane
injector. This reduction of the Qpropane does not change the Øprim, according with [27].
The results of the ignition tests had shown that this system has 100% of ignition
probability with a single spark, for the tested range of Qpropane (0.1 SLPM to 0.288 SLPM).
In this system, due to the spark be discharged in the core of the pilot jet, the ignition
probability does not depend of the time lag between the opening of the propane valve and
the spark discharge.
74
CHAPTER 6 Conclusions
The objective of the present work was to study in detail a pilot ignition system
(commercially available) in order to identify the causes that may contribute to the non
success of ignition and to propose a new pilot flame system with a higher ignition ability.
In order to accomplish this objective, first the current pilot flame system was submitted to
an experimental characterization. Secondly, an experimental study was performed to
evaluate the effect of mixture properties and electrode parameters on the success of spark
discharge (occurrence of a spark discharge) and on the success of ignition (sustained
flame propagation after a spark discharge). Finally, with the all results obtained, a new
pilot flame ignition system was proposed and experimental characterized.

75
The experimental characterization of the current and the proposed pilot flame system
included: measurements of the velocity field at the pilot tube exit using LDV technique,
determination of the primary equivalence ratio and high-speed cinematography
recordings of spark-flame development.
The study of the effect of several parameters on success of spark discharge and on success
of ignition was performed by controlling the electrodes spacing, which became the most
important variable since it defines the ability of the system (for a fixed voltage/energy
supply) to have a spark and a flame. In this context, two variables were introduced in this
work: critical spark distance, ds, and critical ignition distance, di, were extensively tested
for different mixtures and electrodes conditions that include: equivalence ratio, mixture
temperature, humidity of air, mean velocity and electrodes diameter. These experiments
were conducted in a model burner configuration, which ensures constant properties of the
mixture within electrodes. The mixture was conditioned, using a developed air and fuel
conditioning system which allows to provide mixture at temperatures between 9°C and
43°C and the humidity ratios between 1.5 g/kg dry air and 27.5 g/kg dry air, and its
temperature and the relative humidity were monitored by a developed real-time
acquisition system. The values of ds and di were obtained for the 50% probability of
occurrence of either success of spark discharge or success of ignition respectively, using
the “Up-and-Down” method.
The current pilot flame ignition system from Bosch, shown in Fig. 6.1, is composed by four
parts: the fuel injector, the pilot tube, the electrode and the spark discharge unit. In this
system, the fuel injected entrains primary ambient air until entering into the pilot tube,
where mixing occurs. At the exit of the pilot tube, the mixture forms a free jet, which has a
primary equivalence ratio of 2.27, as estimated in this work. In order to ignite this mixture
it is required an amount of energy supplied in excess of 5 mJ, that corresponds in extremis
to the amount of energy supplied by the spark discharge unit. Also, the spark is discharged
in a region between the electrode and the bottom of the pilot coil exit, as illustrated in
Fig.6.1, where the propane only reaches that region due to his mass diffusion in
surrounding air, assisted by the random fluctuation of radial velocity in between the coil
turns. Due to the nature of these processes, it is necessary some time to propane reaches
this region. This situation is critical because the local equivalence ratio in the region where
the spark is discharged is not known and changes with the time (after the opening of the
gas valve), being a not controlled process.
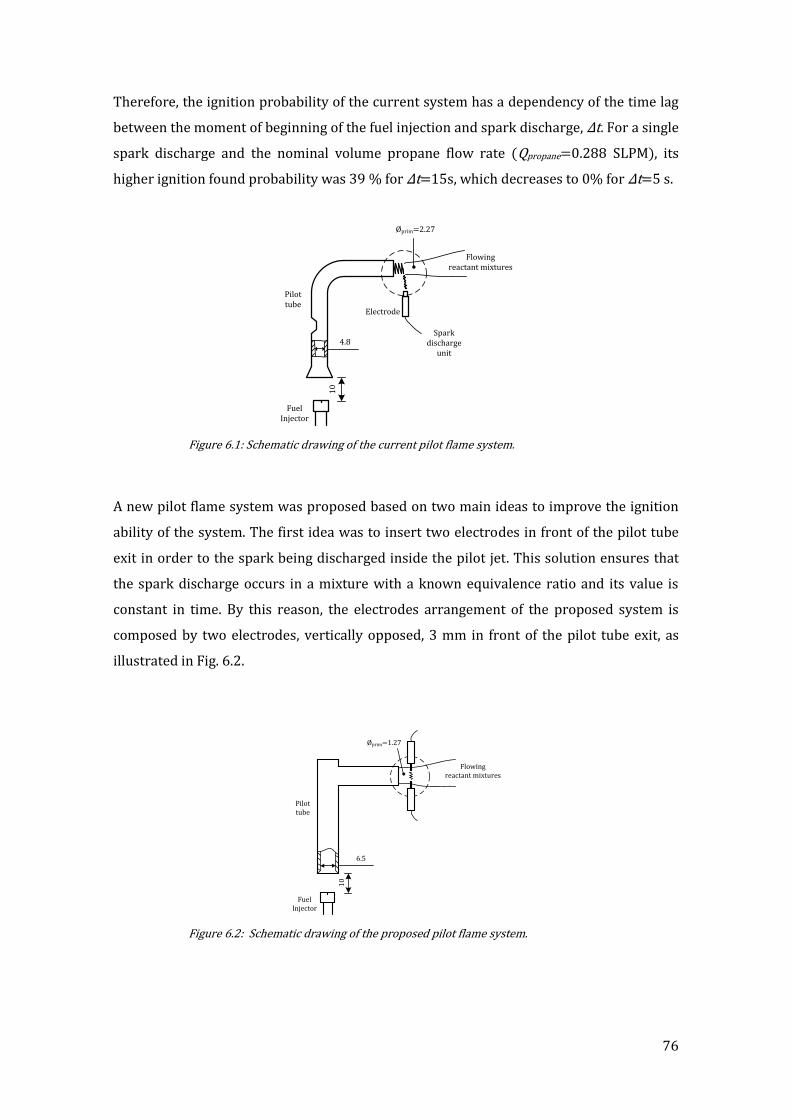
76
Therefore, the ignition probability of the current system has a dependency of the time lag
between the moment of beginning of the fuel injection and spark discharge, Δt. For a single
spark discharge and the nominal volume propane flow rate (Qpropane=0.288 SLPM), its
higher ignition found probability was 39 % for Δt=15s, which decreases to 0% for Δt=5 s.
Figure 6.1: Schematic drawing of the current pilot flame system.
A new pilot flame system was proposed based on two main ideas to improve the ignition
ability of the system. The first idea was to insert two electrodes in front of the pilot tube
exit in order to the spark being discharged inside the pilot jet. This solution ensures that
the spark discharge occurs in a mixture with a known equivalence ratio and its value is
constant in time. By this reason, the electrodes arrangement of the proposed system is
composed by two electrodes, vertically opposed, 3 mm in front of the pilot tube exit, as
illustrated in Fig. 6.2.
Figure 6.2: Schematic drawing of the proposed pilot flame system.
FuelInjector
Electrode
10
Pilot tube
Spark discharge
unit
4.8
Flowing reactant mixtures
Øprim=2.27
Pilot tube
6.5
FuelInjector
10
Flowing reactant mixtures
Øprim=1.27
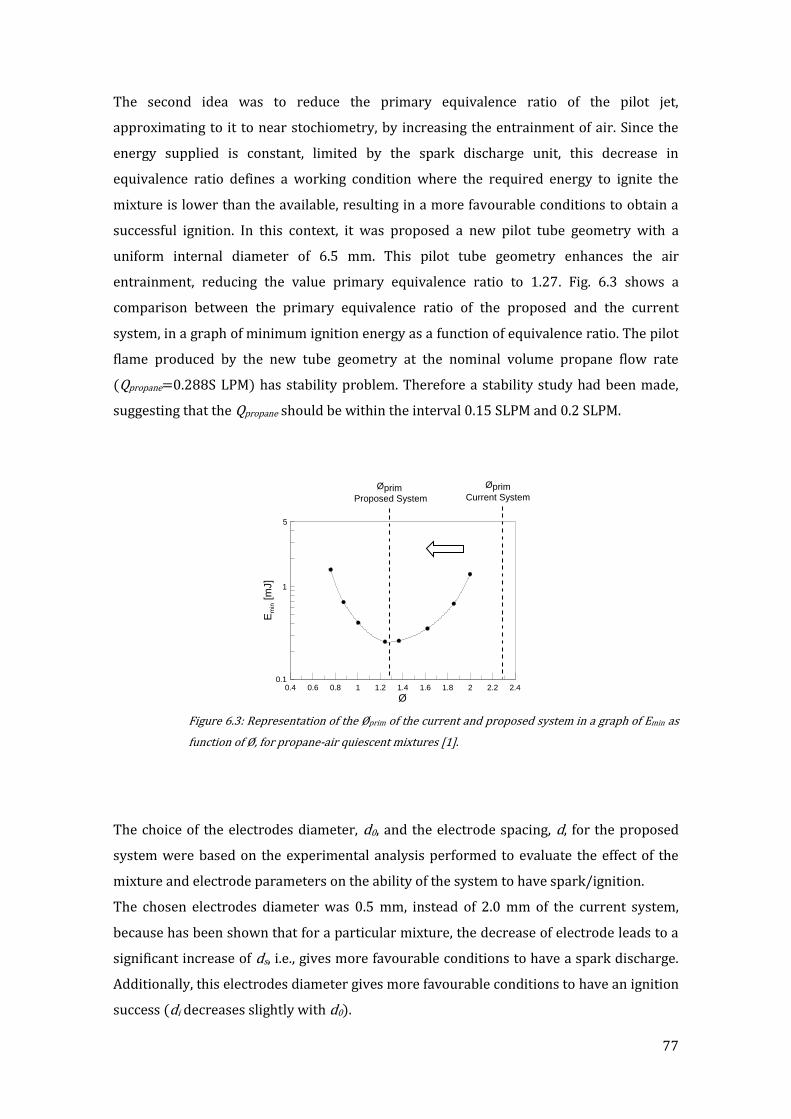
77
The second idea was to reduce the primary equivalence ratio of the pilot jet,
approximating to it to near stochiometry, by increasing the entrainment of air. Since the
energy supplied is constant, limited by the spark discharge unit, this decrease in
equivalence ratio defines a working condition where the required energy to ignite the
mixture is lower than the available, resulting in a more favourable conditions to obtain a
successful ignition. In this context, it was proposed a new pilot tube geometry with a
uniform internal diameter of 6.5 mm. This pilot tube geometry enhances the air
entrainment, reducing the value primary equivalence ratio to 1.27. Fig. 6.3 shows a
comparison between the primary equivalence ratio of the proposed and the current
system, in a graph of minimum ignition energy as a function of equivalence ratio. The pilot
flame produced by the new tube geometry at the nominal volume propane flow rate
(Qpropane=0.288S LPM) has stability problem. Therefore a stability study had been made,
suggesting that the Qpropane should be within the interval 0.15 SLPM and 0.2 SLPM.
Figure 6.3: Representation of the Øprim of the current and proposed system in a graph of Emin as
function of Ø, for propane-air quiescent mixtures [1].
The choice of the electrodes diameter, d0, and the electrode spacing, d, for the proposed
system were based on the experimental analysis performed to evaluate the effect of the
mixture and electrode parameters on the ability of the system to have spark/ignition.
The chosen electrodes diameter was 0.5 mm, instead of 2.0 mm of the current system,
because has been shown that for a particular mixture, the decrease of electrode leads to a
significant increase of ds, i.e., gives more favourable conditions to have a spark discharge.
Additionally, this electrodes diameter gives more favourable conditions to have an ignition
success (di decreases slightly with d0).
0.4 0.6 0.8 1 1.2 1.4 1.6 1.8 2 2.2 2.4
Ø
0.1
1
Em
in [
mJ]
5
ØprimCurrent System
Øprim Proposed System
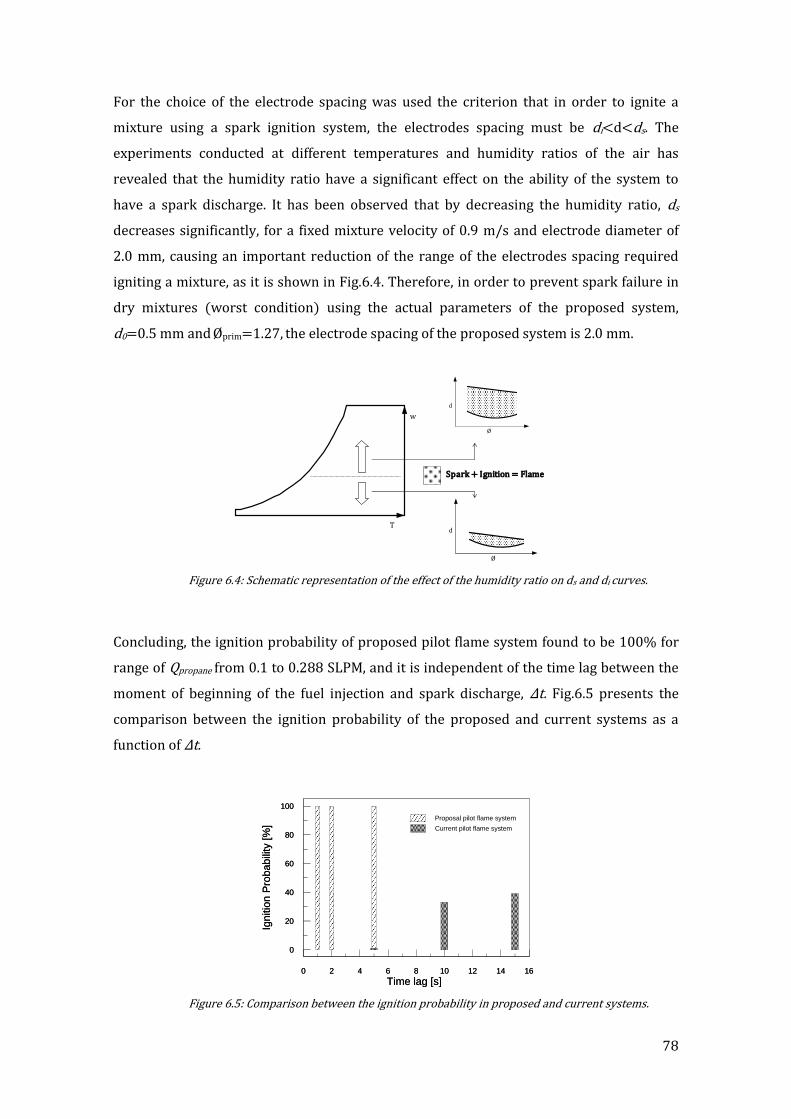
78
For the choice of the electrode spacing was used the criterion that in order to ignite a
mixture using a spark ignition system, the electrodes spacing must be di<d<ds. The
experiments conducted at different temperatures and humidity ratios of the air has
revealed that the humidity ratio have a significant effect on the ability of the system to
have a spark discharge. It has been observed that by decreasing the humidity ratio, ds
decreases significantly, for a fixed mixture velocity of 0.9 m/s and electrode diameter of
2.0 mm, causing an important reduction of the range of the electrodes spacing required
igniting a mixture, as it is shown in Fig.6.4. Therefore, in order to prevent spark failure in
dry mixtures (worst condition) using the actual parameters of the proposed system,
d0=0.5 mm and Øprim=1.27, the electrode spacing of the proposed system is 2.0 mm.
Figure 6.4: Schematic representation of the effect of the humidity ratio on ds and di curves.
Concluding, the ignition probability of proposed pilot flame system found to be 100% for
range of Qpropane from 0.1 to 0.288 SLPM, and it is independent of the time lag between the
moment of beginning of the fuel injection and spark discharge, Δt. Fig.6.5 presents the
comparison between the ignition probability of the proposed and current systems as a
function of Δt.
Figure 6.5: Comparison between the ignition probability in proposed and current systems.
T
w
Spark + Ignition = Flame
Ø
d
Ø
d
0 2 4 6 8 10 12 14 16
Time lag [s]
0
20
40
60
80
100
Ign
itio
n P
rob
ab
ility
[%
]
Proposal pilot flame system
0 2 4 6 8 10 12 14 16
Time lag [s]
0
20
40
60
80
100
Ign
itio
n P
rob
ab
ility
[%
] Current pilot flame system

79
REFERENCES
[1] Lewis B, and von Elbe G (1961) "Combustion, Flames and Explosion of Gases". Academic Press, 2nd Edition
[2] Swett C C (1956) "Spark Ignition of flowing gases". NACA Report 1287
[3] Ballal D R, and Lefebvre A H (1974) "The influence of flow parameters on minimum ignition energy and quencinhg distance". Proceedings of the Combustion Institute, 15:1473-1480
[4] Glassman I (1987) "Combustion". Academic Press 2nd Edition
[5] Raizer Y P (1997)"Gas Discharge Physics". Springer Verlag
[6] Ballal D R and Lefebvre A H (1975) "The influence of spark discharge characteristics on minimum ignition energy in flowing gases”. Combustion and Flame, 24: 99-108
[7] Kono M, Kumagai S, and Sakai T (1976) “The optimum condition for ignition of gases by composite sparks”. Proceedings of the Combustion Institute, 16: 757-766
[8] Maly R, and Vogel M (1978) "Initiation and Propagation of Flame Fronts in Lean CH4-Air Mixtures by Three Modes of the Ignition Spark". Proceedings of the Combustion Institute, 17: 821-831
[9] Arcoumanis C, and Kamimoto T (2009) "Flow and Combustion in Reciprocating Engines". Springer-Verlag
[10] Belles F E, and Swett C C (1957) “Ignition and flammability of hydrocarbon fuels". NACA Report 1300
[11] Calcote H F, Gregory C A, Barnett C M, and Gilmer R B “Spark ignition - Effect of molecular structure”. Industrial and Engineering Chemistry, 44: 2656-2662
[12] Fenn J B “Lean inflammability limit and minimum spark ignition energy”. Industrial and Engineering Chemistry, 43: 2865-2869
[13] Olsen H L, Gayhart E L, and Edmonson R B (1953) “Propagation of Incipient Spark-Ignited Flames in Hydrogen-Air and Propane-Air Mixtures”. Proceedings of the Combustion Institute, 14: 144-148.
[14] Maly, R. (1981) "Ignition model for spark discharges and the early phase of flame front growth". Proceedings of the Combustion Institute, 18: 1747-1754
[15] Ziegler G W, Wagner E P, and Maly R R (1984) "Ignition of lean methane-air mixtures by high pressure glow and arc discharges", Proceedings of the Combustion Institute 20:1817-1824
80
[16] Kono M, Niu K, Tsukamoto T, and Ujiie Y. (1988) "Mechanism of flame kernel formation produced by short duration sparks". Proceedings of the Combustion Institute, 22: 1643-1649
[17] Chomiak, J. (1990) "Combustion : A study in theory, fact and application". Abacus Press/Gordon and Breach
[18] Turns S R (2000) "An introduction to combustion: Concepts and applications". 2nd edition Mc Graw Hill
[19] Coelho P, and Costa M. (2007) "Combustão". Edições Orion
[20] Ono R, Nifuku M, Fujiwara S, Horiguchi S, and Oda T, (2007) "Minimum ignition energy of hydrogen-air mixture: Effects of humidity and spark duration". Journal of Electrostatics, 65:87-93
[21] http://srdata.nist.gov/its90/main/
[22] Fernandes E C (1998). The Onset of Combustion-Driven Acoustic Oscillations, Ph.D. Thesis. Instituto Superior Técnico.
[23] Yanta W J, and Smith R A (1978) “Measurements of Turbulent Transport Properties with a Laser Doppler Velocimetry”. 11th AIAA Aerospace Science Meeting.
[24] Leandro R E (2006) “Modelling and Experimental Validation of Unsteady Impinging Flames”. MSc. Thesis, Instituto Superior Técnico
[25] Dixon W J, and Massey F J (1983) "Introduction to statistical analysis". McGraw-Hill, 4th edition
[26] http://neyersoftware.com/
[27] Lee J J, and Shepherd J E (2000) "Spark Ignition Measurements in Jet A: part II". Report FM 99-7, California Institute of Technology
[28] Zukas J, and Walters W (1998) "Explosive effects and applications". Springer-Verlag
[29] Dlougogorski B Z, Hichens R K, Kennedy E M, and Bozzeli J W (1998) "Propagation of laminar flames in wet premixed natural gas-air mixtures". Trans IChemE, 76: 81-89
[30] Duarte G N (2008) "Improvement of the stable limits and primary air entrainment in a single burner of a domestic water heater unit". MSc Thesis, Instituto Superior Técnico.
[31] White F M (2003) "Fluid Mechanics" 5th edition McGraw-Hill

81
APPENDIX 1
In Fig.A1.1 it is shown the schematic representation of the amplifier circuit used in this
work to amplify the thermocouples voltages in order to be acquired by the acquisition
board. This circuit is based on the high accuracy instrumentation amplifier AMP02E.
Figure A1.1: Scheme of the amplifier circuit.
The main characteristic of the high accuracy instrumentation amplifier AMP02E are
presented in Table A1.1.
Gain Range 1-10k
Nonlinearity 0.006%
Bandwitdth 200 kHz
Common-Mode Rejection 115 dB
Table A1.1: Main characteristics of the AMPO2E
6
10pF
AMP02
50Ω
8
7
5
4
3
2
1
10pF
0.1μF
0.1μF
70kΩ
70
kΩ
V+
V -
OUT
Thermocouple
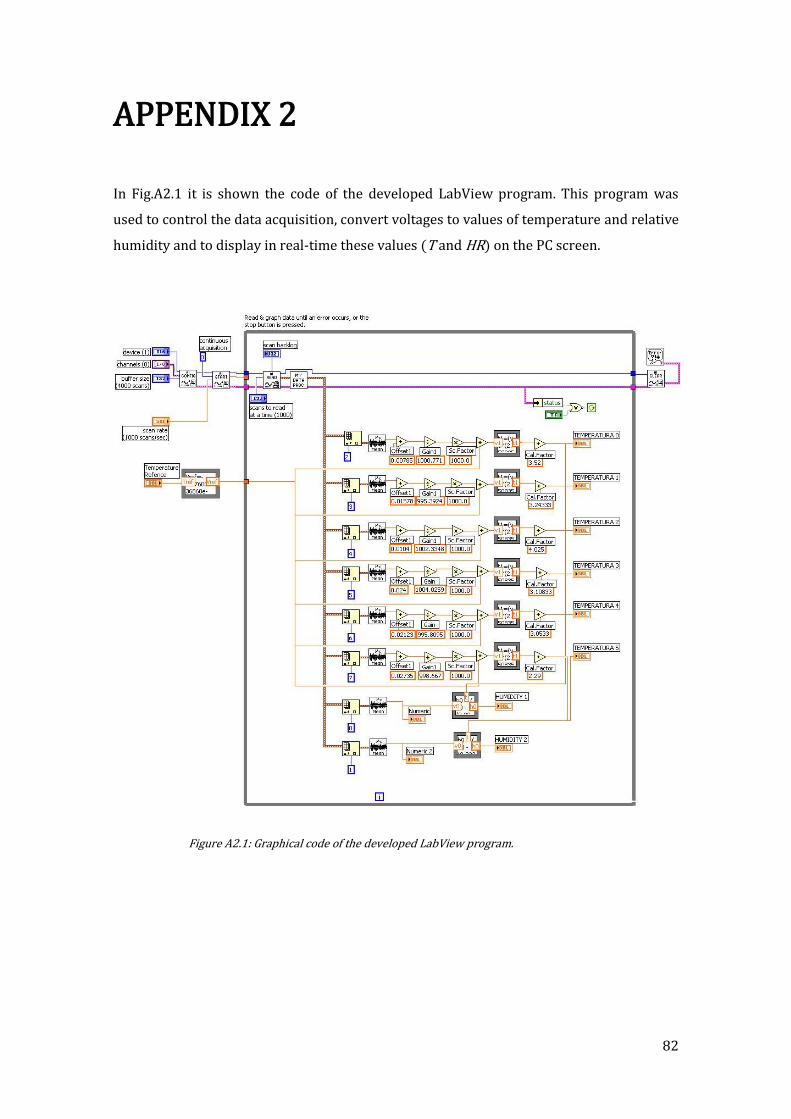
82
APPENDIX 2
In Fig.A2.1 it is shown the code of the developed LabView program. This program was
used to control the data acquisition, convert voltages to values of temperature and relative
humidity and to display in real-time these values (T and HR) on the PC screen.
Figure A2.1: Graphical code of the developed LabView program.

83
APPENDIX 3
The mass balance between the pilot tube inlet and exit is given by,
(1)
According to the ideal gas law,
(2)
In a gaseous mixture,
(3)
Substituting equation (3) in (2) yields,
(4)
Substituting equation (4) in (1) yields,
(5)
Moving the term with brackets to the left side of the equation yields,
(6)
Rearranging equation (6) yields
(7)