experimental studies of the quantum chromodynamics phase
TRANSCRIPT

PRAMANA c© Indian Academy of Sciences Vol. 84, No. 5— journal of May 2015
physics pp. 773–786
Experimental studies of the quantum chromodynamicsphase diagram at the STAR experiment
LOKESH KUMAR1,2,∗ and DECLAN KEANE3
1School of Physical Sciences, National Institute of Science Education and Research,Bhubaneswar 751 005, India2Department of Physics, Panjab University, Chandigarh 160 014, India3Department of Physics, Kent State University, Kent, Ohio 44242, USA∗Corresponding author. E-mail: [email protected]
DOI: 10.1007/s12043-015-0969-9; ePublication: 6 May 2015
Abstract. We review the STAR experiment’s results to date from the Beam Energy Scan (BES)at Brookhaven’s Relativistic Heavy Ion Collider, and outline future plans and prospects in this area.BES Phase-I is based on Au + Au data taken in 2010 and 2011 at
√sNN = 7.7, 11.5, 19.6,
27 and 39 GeV, and when interpreted in conjunction with the large datasets available at 62.4 and200 GeV, permits an initial exploration of the phase diagram of quantum chromodynamics (QCD)matter. The three goals of BES Phase-I are as follows: (1) a search for turn-off of the promisingsignatures of quark gluon plasma (QGP) already reported at the top RHIC energies; (2) a searchfor evidence of a possible first-order phase transition such as a signature of softening of the QCDequation of state (EoS); (3) a search for a critical end point as expected in a scenario where there isa cross-over transition from hadronic matter to QGP at the highest RHIC energies, but a first-orderphase transition at lower energies with finite net-baryon density. We summarize several analysesof BES data from 2010 and 2011 that are either published or submitted, as well as several morethat have been reported at meetings in preliminary forms. The physics interpretation of BES Phase-I measurements is frequently limited by the increasing statistical error bars as the beam energydecreases, and the planned BES Phase-II will have much improved capabilities in this regard.
Keywords. Quark gluon plasma; quantum chromodynamics phase diagram; quantum chromo-dynamics critical point; phase transition; chemical freeze-out; directed and elliptic flow; chiralmagnetic effect; nuclear modification factor.
PACS Nos 25.75.−q; 25.75.Nq; 12.38.Mh; 25.75.Dw; 25.75.Gz; 25.75.Ld
1. Introduction
Experiments to date at the Relativistic Heavy-Ion Collider (RHIC) at BrookhavenNational Laboratory have uncovered evidence for production of a deconfined partonicphase – quark gluon plasma (QGP) – in Au+Au collisions at top RHIC energies [1–5].
Pramana – J. Phys., Vol. 84, No. 5, May 2015 773

Lokesh Kumar and Declan Keane
However, questions remain about how nuclear matter undergoes the transition from itsinitial state to a deconfined QGP and then back to a hot hadronic gas. Our current levelof understanding is illustrated by the conceptual phase diagram in figure 1. The transi-tion is believed to be a smooth cross-over [6–8] at top RHIC energies. By collidingat progressively lower energies, it should be possible to traverse regions of increasinglyhigh baryon chemical potential μB, offering the possibility to explore the hypothesizedfirst-order phase transition [9,10] and the vicinity of the associated critical point.
In this review paper, we focus on a dedicated programme at RHIC called the beamenergy scan (BES), whose three goals are given in the abstract. Two main phases arepredicted in the QCD phase diagram: QGP and hadronic gas. The end-point of the first-order phase transition line (while going towards the cross-over) is the position of a criticalpoint [11]. While there is little guidance from the theory side about the QCD phasediagram, efforts are going on from the experimental side to establish some of its distinctstructures, such as the phase boundary between the deconfined phase of quarks and gluonsand the hadron gas phase, the first-order phase transition line, and the critical point.
The QCD phase diagram can be studied by inferring the location of a particular exper-imental dataset along the two axes, T and μB. These quantities can be obtained from themomentum distributions and the ratios of the produced particles. Each beam energy pointcorresponds to one T –μB coordinate pair on the phase diagram. Data at different centre-of-mass energies can be collected, and once the T –μB coordinates are inferred from amodel-dependent calculation, the various signatures for the phase boundary, first-orderphase transition, and critical point can be investigated. One promising approach is to notethe beam energy where the signatures of QGP, already established at the top RHIC energy,
Figure 1. Schematic QCD phase diagram, plotted as temperature T vs. baryon chemi-cal potential μB.
774 Pramana – J. Phys., Vol. 84, No. 5, May 2015

Experimental studies of the QCD phase diagram at the STAR experiment
Table 1. Summary of data collected during BES-I, currently proposed energies,corresponding μB values, event rates, and the required number of events for BESPhase-II. Also listed are the corresponding fixed target
√sNN , number of events, and
μB reach.
Collider energies Fixed target collisions√
sNN μB BES-I Rate BES-II√
sNN Evts μB
(GeV) (MeV) Evts (M)(
MEvtsday
)Evts (M) (GeV) (M) (MeV)
39 115 130 20 – – – –27 155 70 9 – – – –19.6 205 36 3.6 400 4.5 5 58514.5 250 – 1.6 100 4.0 5 62011.5 315 12 1.1 120 3.5 5 670
7.7 420 4.3 0.5 80 3.0 5 720
disappear or ‘turn-off’. This is the above-mentioned first goal of the RHIC beam energyscan programme [12–14].
The proposal for the BES programme was given in 2008. This was followed the sameyear by successful data taking and a physics analysis of a short Au+Au test run at
√sNN =
9.2 GeV [15]. The first phase of the BES programme was conducted in the year 2010,with data taking for Au+Au collisions at the three energies of 7.7, 11.5, and 39 GeV.In the year 2011, two additional energy points were added:
√sNN = 19.6 and 27 GeV.
Table 1 lists various energies and the corresponding number of events collected by theSTAR detector in 2010–2011 for Phase-I of the BES programme.
This article is organized as follows. In §2, freeze-out parameters that provide informa-tion about T –μB points in the QCD phase diagram are discussed. Subsequent sectionscover signatures of a possible first-order phase transition and the topic of ‘turn-off’ ofQGP. Signatures of a possible critical point are then discussed. The last section before thesummary addresses the plans and outlook for the BES Phase-II programme.
2. Freeze-out parameters
The QCD phase diagram shows the region of each phase in the space of temperature T
and baryon chemical potential μB. These quantities can be extracted from the measuredhadron yields. Transverse momentum pT spectra for the BES Phase-I energies are obtainedfor π , K , p, �, �, K0
S , and φ [16,17]. From these distributions, the corresponding par-ticle yields are obtained and various particle ratios are constructed. These particle ratiosare used to obtain the chemical freeze-out conditions (at which point, particle yields areno longer able to change), using the statistical thermal model (THERMUS) [2,18,19].The two main extracted parameters are chemical freeze-out temperature Tch and μB.Figure 2 shows the variation of the extracted chemical freeze-out parameters using thegrand-canonical ensemble (GCE) approach of THERMUS for different energies and cen-tralities [20,21]. The curves represent the parametrizations of T and μB [22,23]. Weobserve that at top RHIC energy, there is little variation of chemical freeze-out parameters
Pramana – J. Phys., Vol. 84, No. 5, May 2015 775

Lokesh Kumar and Declan Keane
(GeV)B
μ0 0.1 0.2 0.3 0.4 0.5
(G
eV)
chT
0.1
0.12
0.14
0.16
0.18
00-05%05-10%10-20%20-30%30-40%40-60%60-80%
CleymansAndronic
Au+Au
200 GeV39 GeV
7.7 GeV
11.5 GeV
STAR Preliminary
Grand Canonical Ensemble
Figure 2. Variation of Tch with μB for different energies and centralities. The curvesrepresent theoretical calculations [22,23].
with centrality, while at lower energies, Tch shows a variation with μB as a function ofcentrality. The centrality dependence of these parameters is observed for the first time inheavy-ion collisions at these lower energies. One advantage of having such a dependenceis that experiments can explore a larger region of the QCD phase diagram without as manychanges in beam energy as might otherwise be needed, allowing collider beam time to beutilized more efficiently.
3. Directed flow
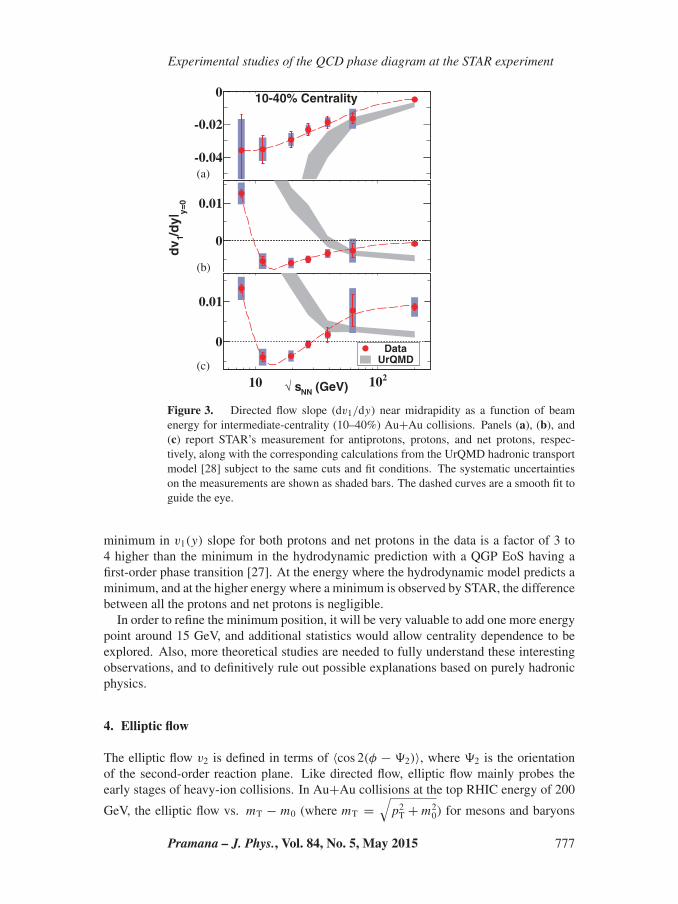
The directed flow v1 is calculated as 〈cos(φ − �1)〉, where φ and �1 are the azimuthalangle of the produced particles and the azimuthal orientation of the first-order reactionplane, respectively. The directed flow measurements for protons are proposed to be sen-sitive to the equation of state (EoS) [24–27]. Based on a 3-fluid hydrodynamic modelwith a first-order phase transition from hadronic matter to QGP, it has been specificallypredicted that proton v1(y) slope should exhibit a sharp minimum as a function of beamenergy [26,27], whereas the same model with a purely hadronic EoS predicts monotonicbehaviour. The Frankfurt theory group refers to the QGP EoS behaviour as a collapse ofproton flow. Figure 3 shows directed flow results from the beam energy scan. In figure 3,the v1 slope dv1/dy near midrapidity is plotted as a function of beam energy for mid-central (10–40%) Au+Au collisions, for antiprotons, protons, and net protons [29,30].The antiproton slope increases with increasing collision energy but stays below zero up to200 GeV. The proton slope decreases strongly with energy and changes sign from positiveto negative between 7.7 and 11.5 GeV, shows a minimum between 11.5 and 19.6 GeV, andremains small but negative up to 200 GeV. The v1(y) slope for net-protons is negligiblydifferent from protons at and below the energy of the minimum, but then crosses zerobetween 27 GeV and 39 GeV, and remains positive up to 200 GeV. The UrQMD modeldoes not reproduce the behaviour shown in the data. The observed beam energy of the
776 Pramana – J. Phys., Vol. 84, No. 5, May 2015
Experimental studies of the QCD phase diagram at the STAR experiment
-0.04
-0.02
0 10-40% Centrality
10 210
y=0
/dy|
1d
v 0
0.01
10 210
0
0.01
DataUrQMD
(GeV)NN s√
(a)
(b)
(c)
Figure 3. Directed flow slope (dv1/dy) near midrapidity as a function of beamenergy for intermediate-centrality (10–40%) Au+Au collisions. Panels (a), (b), and(c) report STAR’s measurement for antiprotons, protons, and net protons, respec-tively, along with the corresponding calculations from the UrQMD hadronic transportmodel [28] subject to the same cuts and fit conditions. The systematic uncertaintieson the measurements are shown as shaded bars. The dashed curves are a smooth fit toguide the eye.
minimum in v1(y) slope for both protons and net protons in the data is a factor of 3 to4 higher than the minimum in the hydrodynamic prediction with a QGP EoS having afirst-order phase transition [27]. At the energy where the hydrodynamic model predicts aminimum, and at the higher energy where a minimum is observed by STAR, the differencebetween all the protons and net protons is negligible.
In order to refine the minimum position, it will be very valuable to add one more energypoint around 15 GeV, and additional statistics would allow centrality dependence to beexplored. Also, more theoretical studies are needed to fully understand these interestingobservations, and to definitively rule out possible explanations based on purely hadronicphysics.
4. Elliptic flow
The elliptic flow v2 is defined in terms of 〈cos 2(φ − �2)〉, where �2 is the orientationof the second-order reaction plane. Like directed flow, elliptic flow mainly probes theearly stages of heavy-ion collisions. In Au+Au collisions at the top RHIC energy of 200
GeV, the elliptic flow vs. mT − m0 (where mT =√
p2T + m2
0) for mesons and baryons
Pramana – J. Phys., Vol. 84, No. 5, May 2015 777

Lokesh Kumar and Declan Keane
show separation at intermediate pT. However, when both axes are scaled by the num-ber of constituent quarks (nq), v2 shows a scaling behaviour where mesons and baryonsalmost coincide over a range of pT values. This is referred to as the number of constituentquark (NCQ) scaling [31]. It is a widely accepted signature of partonic matter formed inAu+Au collisions at 200 GeV [1,2], and deviations from such scaling might indicate areturn to dominance by hadronic interactions. Hence, breaking of NCQ scaling at lowerenergies could be an indication of a ‘turn-off’ of QGP production. For NCQ scaling tohappen, v2 of mesons and baryons must show splitting or separation at intermediate pT.Absence of such a splitting could also be taken as an indication of ‘turn-off’ of QGP.Figure 4 shows the difference in v2 of particles and the corresponding antiparticles as afunction of beam energy [32]. The difference in v2 between particles and antiparticlesis observed to increase as the energy is lowered. At low energies, v2(π
−) > v2(π+),
v2(K+) > v2(K
−), and v2(baryons) > v2(antibaryons). This difference between parti-cles and antiparticles suggests that the NCQ scaling among particles and antiparticles isbroken. However, the observed difference between v2 of particles and antiparticles couldbe qualitatively explained by models incorporating baryon transport at midrapidity andhadronic interactions [33,34].
Figure 5 shows v2 vs. mT − m0 for different particle types at√
sNN = 7.7–62.4GeV, and the splitting into one common curve for mesons and another common curve forbaryons can be seen for higher energies [32]. The splitting between baryons and mesonsdecreases with decreasing beam energy, and disappears around
√sNN ≤ 11.5 GeV. As the
baryon–meson splitting at top RHIC energy is attributed to partonic degrees of freedom,its absence at lower energies suggests that partonic effects are less dominant at lower ener-gies. In addition, it is also observed that all particle types, both mesons and baryons, whenscaled by the corresponding number of quarks (two for mesons and three for baryons),follow a single common curve within about ±10%, except for φ-mesons at
√sNN ≤ 11.5
GeV [32]. At the largest mT − m0, the φ-meson datapoints deviate by 1.8σ and 2.3σ for√sNN = 7.7 and 11.5 GeV, respectively. As φ-mesons have a smaller hadronic interaction
(GeV)NNs
0 20 40 60
)(X 2
(X)-
v2v
0
0.02
0.04
0.06 Au+Au, 0-80%-sub EPη
+Ξ--Ξ
pp-Λ-Λ
--K+K
-π-+π
Figure 4. The difference in v2 between particles and their corresponding antiparticlesas a function of beam energy in 0–80% Au+Au collisions. Both statistical (verticallines) and systematic errors (caps) are shown.
778 Pramana – J. Phys., Vol. 84, No. 5, May 2015

Experimental studies of the QCD phase diagram at the STAR experiment
0
0.1
0.2
2v
7.7 GeVAu+Au, 0-80%
-sub EPη
pΛ
+Ξ
+Ω
-π-Ks0K
φ
0 1 2 3 4
11.5 GeV
0 1 2 3 4
19.6 GeV
0 1 2 3 4
0
0.1
0.2 27 GeV
)2 (GeV/c0-mTm0 1 2 3 4
39 GeV
0 1 2 3 4
62.4 GeV
Figure 5. v2 as a function of mT −m0 for different particle types in Au+Au collisionsat
√sNN = 7.7, 11.5, 19.6, 27, 39, and 62.4 GeV. The errors shown are statistical only.
cross-section, their smaller v2 could indicate that the hadronic interactions start to domi-nate over partonic effects for systems formed at beam energies
√sNN ≤ 11.5 GeV [35].
However, much higher statistics are needed to extend the mT −m0 range of φ-mesons andimprove the significance of the observed deviation.
5. Chiral magnetic effect
In non-central heavy-ion collisions, a large orbital angular momentum vector (L) exists at90◦ to the reaction plane, leading to an exceptionally intense localized magnetic field(∼1015 T). If the system is deconfined, there can be strong parity-violating domains,and different numbers of quarks of left- and right-handed helicity, leading to preferen-tial emission of like-sign charged particles along L. The phenomenon is sometimescalled the chiral magnetic effect (CME) [36–38], and has been studied in lattice QCD[39–41]. Experimentally, such a phenomenon could be studied through a three-particlemixed-harmonic azimuthal correlator [42,43], γ = 〈cos(φα + φβ − 2�RP)〉. This observ-able represents the difference between azimuthal correlations projected onto the directionof the angular momentum vector and correlations projected onto the collision reactionplane. At top RHIC energies, the correlator γ shows a separation between the correla-tions of same- and opposite-sign charges with respect to the reaction plane [42,43]. Theseresults are consistent with the expected signal for local parity violation, especially thecentrality dependence. However, there are caveats attached to this observation [42–44].If this difference can be attributed to the QCD phase transition, the absence of such anobservation at lower energies could be an indication that the system did not undergo thephase transition. Hence, the observable could be useful to locate the beam energy wherethe QGP signature ‘turns off’.
Figure 6 shows the correlator γ as a function of centrality from Au+Au collisions at√sNN = 7.7–200 GeV [45]. For comparison, we also show the ALICE results for Pb+Pb
Pramana – J. Phys., Vol. 84, No. 5, May 2015 779

Lokesh Kumar and Declan Keane
0
10
20
20406080
19.6 GeV Au+Au
2040600
11.5 GeV Au+Au
STAR preliminary
02040600
7.7 GeV Au+Au
β=-αOpposite Sign:
β=αSame Sign:
0
10
202.76 TeV Pb+Pb200 GeV Au+Au
β=-αOpposite Sign:
β=αSame Sign:
62.4 GeV Au+Au39 GeV Au+Au 27 GeV Au+Au
% Most Central
410×]⟩)
RP
ψ -
2βφ
+
αφco
s(⟨
=
γ[
Figure 6. The correlator γ as a function of centrality for Au+Au collisions from 200GeV to 7.7 GeV. For comparison, we also show ALICE results for Pb+Pb at 2.76TeV [46]. The plotted errors are statistical only.
collisions at 2.76 TeV [46]. As can be seen in figure 6, the γ signals are very similarin collisions throughout the beam energy range
√sNN = 2.76 TeV down to 19.6 GeV.
However, changes in the correlation function are seen at lower energies:√
sNN = 11.5and 7.7 GeV, where the difference between same-sign and opposite-sign γ fades awayat all collision centralities. As discussed above, one possible explanation for this fadingaway would be the disappearance of CME due to a turn-off of deconfinement at lowerBES energy points.
6. Nuclear modification factor
The behaviour of the nuclear modification factor RCP is a widely accepted signature ofQGP at top RHIC energy [47]. This observable is defined as the ratio of yields in centralcollisions to yields in peripheral collisions, scaled by the corresponding number of binarycollisions Nbin. The number of binary collisions is calculated from a Monte Carlo model.At high pT, it has been observed that RCP of various particles is less than unity [47],which is attributed to energy loss of the partons in the dense medium. In the absence of adense medium, there may not be suppression of high pT particles, which might serve asan indication of ‘turn-off’ of QGP production.
Figure 7 shows RCP results for charged hadrons in Au+Au collisions at√
sNN =7.7–200 GeV [48]. We observed that for pT > 2 GeV/c, RCP > 1 for lower energies. Thissuggests that partonic effects become less important and the cold nuclear matter effects(Cronin effect) start to dominate at these lower energies [49]. A caveat is that, as the hardspectrum component fades away with decreasing beam energy, disentangling the variousfactors as the beam energy is scanned down remains a challenge to be solved in future.
Figure 8 shows the baryon-to-meson ratio N(�− + �+)/2N(φ) as a function of pT incentral Au+Au collisions at
√sNN = 11.5–200 GeV [50]. The curves represent model
calculations by Hwa and Yang [51,52] in central collisions at√
sNN = 200 GeV whichassume the � and φ yields to be generated from the recombination of thermal strange
780 Pramana – J. Phys., Vol. 84, No. 5, May 2015

Experimental studies of the QCD phase diagram at the STAR experiment
Figure 7. RCP ((0–5%)/(60–80%)) for charged hadrons in Au+Au collisionsat
√sNN = 7.7–200 GeV. The grey band at the right corresponds to systematic
uncertainties.
quarks having an exponential pT distribution. The particle ratio results at√
sNN = 19.6,27, and 39 GeV seem to be consistent with 200 GeV results, indicating a maximum aroundpT ≥ 3 GeV/c, then turning down as pT increases further. However, results at 11.5 GeVsuggest a different behaviour, i.e., they show a maximum at the somewhat lower pT of∼ 2 GeV/c before turning down at higher pT. This observation suggests that there mightbe a change in the underlying pT distributions of strange quarks recombining to form thefinal � and φ for
√sNN = 11.5 GeV, compared with
√sNN ≥ 19.6 GeV. This is another
good example of a measurement where the expected roughly ten-fold increase in statisticsin BES Phase-II could allow a major step forward.
(GeV/c)T
p
0 1 2 3 4 5 6
)φ2N
(/)+
Ω+-Ω
N(
0
0.1
0.2
0.3 200 GeV 0-12%Hwa&Yang (total)Hwa&Yang (thermal)39 GeV 0-10%27 GeV 0-10%19.6 GeV 0-10%11.5 GeV 0-10%
STAR Preliminary
Figure 8. The baryon-to-meson ratio N(�− + �+)/2N(φ) as a function of pT incentral Au+Au collisions at
√sNN = 11.5–200 GeV. The curves are from model
calculations by Hwa and Yang for√
sNN = 200 GeV. Both statistical errors (verticallines) and systematic errors (shaded bands) are shown.
Pramana – J. Phys., Vol. 84, No. 5, May 2015 781

Lokesh Kumar and Declan Keane
7. Conserved number fluctuations
Higher moments of conserved number fluctuations have been proposed as promisingobservables in the search for a critical point [53–55]. For a static, infinite medium, thecorrelation length ξ diverges at a critical point. The various moments of event-by-eventconserved numbers (such as net baryons, net charge, and net strangeness) are related todifferent powers of the correlation length. Higher moments such as skewness S andkurtosis κ are related to higher powers of the correlation length [56,57]. Thus, thesehigher moments have a better sensitivity in searching for the critical point. It has beenproposed that the appropriate products of these moments, such as κσ 2 and Sσ , canbe related to the ratios of order susceptibilities calculated in lattice QCD and HRGmodels as κσ 2 = χ
(4)B /χ
(2)B and Sσ = χ
(3)B /χ
(2)B [58,59]. Here, χ
(2)B , χ
(3)B , and χ
(4)B are the
second-, third-, and fourth-order baryon number susceptibilities, respectively. One of theadvantages of using these products or ratios is that they cancel volume effects which aredifficult to estimate in an experiment. In this way, one can relate experimental measure-ments to lattice QCD observables in searching for a critical point. In an experiment, it
0.2
0.4
0.6
0.8
1.0
1.2 Au+Au Collisions at RHIC
Net-proton<0.8 (GeV/c),|y|<0.5
T0.4<p
Skellam Distribution70-80%0-5%
0.4
0.6
0.8
1.0
1.2
p+p dataAu+Au 70-80%Au+Au 0-5%Au+Au 0-5% (UrQMD)Ind. Prod. (0-5%)
5 6 7 8 10 20 30 40 100 2000.85
0.90
0.95
1.00
1.05
σS
2 σκ
)/S
kella
mσ
(S
(GeV)NNsColliding Energy
Figure 9. κσ 2, Sσ , and Sσ values normalized by the Skellam expectations as a func-tion of collision energy and two different centralities. Results from p + p collisionsare also shown. All the results presented are corrected for detector efficiency. Oneshaded band is an expectation based on assuming independent proton and antiprotonproduction, and the other shaded band is based on the UrQMD model. The widths ofthe bands represent statistical uncertainties. The error bars on datapoints are statisticalwhile caps represent the systematic errors.
782 Pramana – J. Phys., Vol. 84, No. 5, May 2015
Experimental studies of the QCD phase diagram at the STAR experiment
is difficult to measure total baryons on an event-by-event basis, and therefore net protonsare used as a proxy for net baryons.
Figure 9 shows κσ 2 and Sσ for net protons as a function of beam energy for dif-ferent collision centralities [60,61]. For comparison, results are shown for: (i) Skellamexpectations, (ii) expectations based on assuming independent production of protons andantiprotons, and (iii) the UrQMD model, which incorporates much of the relevant physics,but not a critical point [28]. The results from p + p collisions at 200 GeV are alsoshown. The bottom panel shows the Sσ values normalized by the corresponding Skellamexpectations. The moment products κσ 2 and Sσ show similar values for central (0–5%)and peripheral (70–80%) collisions for
√sNN = 39–200 GeV. For beam energies below
39 GeV, they have different values for central and peripheral collisions. These valuesare below Skellam expectations for
√sNN > 7.7 GeV for 0–5% central collisions, but
are described very well at all energies by the expectation based on assuming indepen-dent proton and antiproton production. The UrQMD model calculations show a smoothmonotonic behaviour as a function of collision energy.
Thus, it is necessary to acquire the much increased statistics of a new Phase-II of theBES programme to continue the search for a critical point. In addition, a direct compar-ison to QCD calculations with a critical point obtained using similar dynamics as that ofheavy-ion collisions is a high priority.
8. BES Phase-II
The first phase of the BES programme has yielded several promising results for under-standing the QCD phase diagram. Some of the observables require high statistics datato make definite statements. In addition, the energy dependence of some observablessuggests that one more energy point around 15 GeV would be very advantageous. Forexample, proton and net proton v1 slopes suggest a minimum as a function of beamenergy around 11.5–19.6 GeV, which could be related to the softest point in the equationof state. Similar reasoning might be argued for the freeze-out eccentricity, although thereis a monotonic variation as a function of beam energy at this time. For higher moments,adding 14.5 GeV along with high statistics data at lower energies might provide a clearenergy dependence trend with high significance. One more energy point at 14.5 GeV isalso important in view of the fact that the gap between 11.5 and 19.6 GeV in terms of μB
is more than 100 MeV.For the reasons mentioned above, Brookhaven National Lab has decided to continue the
exploration of the QCD phase diagram and hence a second phase of the BES programmeis planned. The proposal for BES Phase-II includes high statistics data below 20 GeV aslisted in table 1. To achieve high statistics data at lower energies, electron cooling willbe installed at RHIC for increasing the beam luminosity [62]. Additional improvementsin luminosity will be possible by operating with longer bunches at the space-charge limitin the collider [63]. Electron cooling may increase the luminosity by a factor of 3–10,and with longer bunches, the luminosity may be increased by another factor of 2–5. Thehigh statistics data from BES Phase-II will allow precision measurements of the importantobservables discussed here, and will also be helpful in the measurements of rare probessuch as dilepton production and hypertriton measurements at lower energies [64,65].
Pramana – J. Phys., Vol. 84, No. 5, May 2015 783

Lokesh Kumar and Declan Keane
Figure 10. (a) Lay-out of the original inner pad plane of the STAR time projectionchamber, showing the sparse spatial coverage. (b) The new inner pad plane lay-out,with continuous spatial coverage, proposed for the STAR iTPC upgrade.
To maximize the use of collisions provided at STAR, a fixed-target configuration isunder consideration as part of the plan for BES Phase-II. The concept is to install a fixedAu target inside the STAR beam pipe to measure Au(beam) on Au(fixed target) collisions,providing a lower reach for the centre-of-mass energies, and thus a higher reach for theμB values for a given BES Phase-II energy in each ring. The beam energies and the μB
values for fixed-target collisions are listed in table 1 corresponding to the proposed BESPhase-II collider-mode energies. The μB values are obtained from the parametrizationsin ref. [23]. One of the advantages of such a proposal is that data taking for fixed targetcollisions can be done concurrently with normal RHIC running in collider mode.
These programmes will also benefit from a proposed inner sector upgrade of the STARTPC, called the iTPC upgrade [66]. At the moment, inner sector wires of the TPC showsigns of ageing, and unlike the outer TPC sectors, they do not have continuous pad cov-erage at all radii. The spacing between the rows is greater than 5 cm, resulting in missingrows (see figure 10). To overcome these issues, increasing the segmentation and coverageon the inner pad plane, and renewing the inner sector wires has been proposed. Simula-tion studies indicate that with the iTPC upgrade, it will be possible to improve momentumresolution and dE/dx resolution for particle identification. Also, there will be improvedacceptance at higher pseudorapidity and low pT. At the moment, TPC η coverage isabout |η| < 1.0, but with the iTPC upgrade, |η| < 1.7 is expected. Similarly, the lowestpT reached with the iTPC can be as low as 60 MeV/c, compared to the present value of125 MeV/c. BES Phase-II is expected to start around 2018 or 2019.
9. Summary
BES Phase-I enables RHIC to cover a large range of μB (20–400 MeV) in the QCD phasediagram. At lower energies, a centrality dependence of freeze-out parameters is observed.
784 Pramana – J. Phys., Vol. 84, No. 5, May 2015

Experimental studies of the QCD phase diagram at the STAR experiment
Observables such as elliptic flow v2, the correlator associated with the chiral magneticeffect, the nuclear modification factor RCP, and the baryon-to-meson ratio �/φ, addressthe issue of whether hadronic interactions dominate at the lowest energies, with someindications of an answer in the affirmative. The directed flow v1(y) slope for protons andnet protons shows a minimum between 11.5 and 19.6 GeV that bears a closer resemblanceto a model with a first-order phase transition than to a purely hadronic model, but furtherwork in both theory and experiment is needed to clarify the interpretation. The κσ 2 andSσ for net protons show deviations from Skellam expectations at some energies but arereproduced by an expectation based on independent proton and antiproton production.BES Phase-II will be enhanced by electron cooling, a planned fixed target, and the iTPCupgrade at STAR. These developments offer an optimistic future for the exploration ofthe QCD phase diagram.
References
[1] S A Bass et al, White Paper Hot & Dense QCD Matter, submitted to 2012 US Nuclear ScienceAdvisory Committee, http://www.bnl.gov/npp/docs/Bass_RHI_WP_final.pdf
[2] STAR Collaboration: J Adams et al, Nucl. Phys. A 757, 102 (2005)[3] PHENIX Collaboration: K Adcox et al, Nucl. Phys. A 757, 184 (2005)[4] BRAHMS Collaboration: I Arsene et al, Nucl. Phys. A 757, 1 (2005)[5] PHOBOS Collaboration: B B Back et al, Nucl. Phys. A 757, 28 (2005)[6] F Karsch et al, Nucl. Phys. Proc. Suppl. 129, 614 (2004)[7] Y Aoki, G Endroli, Z Fodor, S D Katz and K K Szabo, Nature 443, 675 (2006)[8] M Cheng et al, Phys. Rev. D 79, 074505 (2009), and references therein[9] S Ejiri, Phys. Rev. D 78, 074507 (2008)
[10] E S Bowman and J I Kapusta, Phys. Rev. C 79, 015202 (2009)[11] M A Stephanov, Prog. Theor. Phys. Suppl. 153, 139 (2004); Int. J. Mod. Phys. A 20, 4387
(2005), [hep-ph/0402115][12] STAR Collaboration: M M Aggarwal et al, arXiv:1007.2613 (2010)[13] STAR Collaboration: L Kumar, Nucl. Phys. A 862, 125 (2011)[14] B Mohanty, Nucl. Phys. A 830, 899C (2009)[15] STAR Collaboration: B I Abelev et al, Phys. Rev. C 81, 024911 (2010)[16] STAR Collaboration: L Kumar, J. Phys. G: Nucl. Part. Phys. 38, 124145 (2011)[17] STAR Collaboration: X Zhu, Acta Phys. Polon. B Proc. Suppl. 5, 213 (2012)[18] A Andronic, F Beutler, P Braun-Munzinger, K Redlich and J Stachel, Phys. Lett. B 675, 312
(2009), arXiv:0804.4132[19] S Wheaton and J Cleymans, Comput. Phys. Commun. 180, 84 (2009), hep-ph/0407174[20] STAR Collaboration: L Kumar, Nucl. Phys. A 904–905, 256c (2013), arXiv:1211.1350[21] STAR Collaboration: S Das, Nucl. Phys. A 904–905, 891c (2013), arXiv:1210.6099[22] A Andronic, P Braun-Munzinger and J Stachel, Nucl. Phys. A 834, 237C (2010),
arXiv:0911.4931[23] J Cleymans, H Oeschler, K Redlich and S Wheaton, Phys. Rev. C 73, 034905 (2006),
hep-ph/0511094[24] J Brachmann, S Soff, A Dumitru, H Stoecker, J A Maruhn, W Greiner, L V Bravina and D H
Rischke, Phys. Rev. C 61, 024909 (2000), nucl-th/9908010[25] L P Csernai and D Rohrich, Phys. Lett. B 458, 454 (1999), nucl-th/9908034[26] D H Rischke et al, Heavy Ion Phys. 1, 309 (1995)[27] H Stoecker, Nucl. Phys. A 750, 121 (2005), nucl-th/0406018
Pramana – J. Phys., Vol. 84, No. 5, May 2015 785

Lokesh Kumar and Declan Keane
[28] M Bleicher, E Zabrodin, C Spieles, S A Bass, C Ernst, S Soff, L Bravina, M Belkacem et al,J. Phys. G 25, 1859 (1999), hep-ph/9909407
[29] STAR Collaboration: Y Pandit, Nucl. Phys. A 904–905, 357c (2013), arXiv:1210.5315[30] STAR Collaboration: L Adamczyk et al, arXiv:1401.3043 [nucl-ex][31] STAR Collaboration: J Adams et al, Phys. Rev. Lett. 95, 122301 (2005)[32] STAR Collaboration: L Adamczyk et al, Phys. Rev. Lett. 110, 0142301 (2013)[33] J C Dunlop, M A Lisa and P Sorensen, Phys. Rev. C 84, 044914 (2011), arXiv:1107.3078[34] J Xu, L-W Chen, C M Ko and Z-W Lin, Phys. Rev. C 85, 041901 (2012), arXiv:1201.3391[35] B Mohanty and N Xu, J. Phys. G 36, 064022 (2009)[36] D Kharzeev, Phys. Lett. B 633, 260 (2006)[37] D E Kharzeev, L D McLerran and H J Warringa, Nucl. Phys. A 803, 227 (2008)[38] K Fukushima, D E Kharzeev and H J Warringa, Phys. Rev. D 78, 074033 (2008),
arXiv:0808.3382[39] P V Buividovich, M N Chernodub, E V Luschevskaya and M I Polikarpov, Phys. Rev. D 80,
054503 (2009)[40] M Abramczyk, T Blum, G Petropoulos and R Zhou, PoS LAT 2009, 181 (2009)[41] P V Buividovich, E V Lushchevskaya, M I Polikarpov and M N Chernodub, JETP Lett. 90,
412 (2009)[42] STAR Collaboration: B I Abelev et al, Phys. Rev. Lett. 103, 251601 (2009)[43] STAR Collaboration: B I Abelev et al, Phys. Rev. C 81, 054908 (2010)[44] S Pratt, Phys. Rev. C 83, 014913 (2011)
S Pratt, S Schlichting and S Gavin, Phys. Rev. C 84, 024909 (2011)[45] STAR Collaboration: G Wang, Nucl. Phys. A 904–905, 248c (2013)[46] ALICE Collaboration: B Abelev et al, Phys. Rev. Lett. 110, 012301 (2013), arXiv:1207.0900[47] STAR Collaboration: M A C Lamont, J. Phys. Conf. Ser. 50, 192 (2006)[48] STAR Collaboration: E Sangaline, Nucl. Phys. A 904–905, 771c (2013)[49] J W Cronin, H J Frisch, M J Shochet, J P Boymond, R Mermod, P A Piroue and R L Sumner,
Phys. Rev. D 11, 3105 (1975)[50] STAR Collaboration: X Zhang, Nucl. Phys. A 904–905, 543c (2013)[51] R C Hwa and C B Yang, Phys. Rev. C 75, 054904 (2007), nucl-th/0602024[52] R C Hwa and C B Yang, Phys. Rev. C 66, 025205 (2002), hep-ph/0204289[53] STAR Collaboration: M M Aggarwal et al, Phys. Rev. Lett. 105, 022302 (2010),
arXiv:1004.4959[54] S Gupta, X Luo, B Mohanty, H G Ritter and N Xu, Science 332, 1525 (2011), arXiv:1105.3934[55] F Karsch and K Redlich, Phys. Lett. B 695, 136 (2011)[56] M A Stephanov, Phys. Rev. Lett. 102, 032301 (2009)[57] M A Stephanov, Phys. Rev. Lett. 107, 052301 (2011)[58] R V Gavai and S Gupta, Phys. Lett. B 696, 459 (2011), arXiv:1001.3796[59] M Cheng, P Hendge, C Jung, F Karsch, O Kaczmarek, E Laermann, R D Mawhinney, C Miao,
P Petreczky, C Schmidt and W Soeldner, Phys. Rev. D 79, 074505 (2009), arXiv:0811.1006[60] STAR Collaboration: X Luo, Nucl. Phys. A 904–905, 911c (2013)[61] STAR Collaboration: L Adamczyk et al, Phys. Rev. Lett. 112, 032302 (2014),
arXiv:1309.5681[nucl-ex][62] A Fedotov and W Fischer, Private communications, 2012[63] A Fedotov and M Blaskiewicz, BNL CAD Tech Note: C-A/AP/449 (February 10, 2012)[64] STAR Collaboration: B Huang, Nucl. Phys. A 904–905, 565c (2013)[65] STAR Collaboration: Y Zhu, Nucl. Phys. A 904–905, 551c (2013)[66] STAR Collaboration: Y Xu, poster “Inner TPC Upgrade at STAR”, 2013 RHIC & AGS
Annual Usersù Meeting, BNL, USA
786 Pramana – J. Phys., Vol. 84, No. 5, May 2015