experimental investigations from conventional to high ... · 2 nomenclature density c calorific...
TRANSCRIPT
HAL Id: hal-00861789https://hal.archives-ouvertes.fr/hal-00861789
Submitted on 17 Sep 2013
HAL is a multi-disciplinary open accessarchive for the deposit and dissemination of sci-entific research documents, whether they are pub-lished or not. The documents may come fromteaching and research institutions in France orabroad, or from public or private research centers.
L’archive ouverte pluridisciplinaire HAL, estdestinée au dépôt et à la diffusion de documentsscientifiques de niveau recherche, publiés ou non,émanant des établissements d’enseignement et derecherche français ou étrangers, des laboratoirespublics ou privés.
Experimental investigations from conventional to highspeed milling on a 304-L stainless steel
Aurelien Maurel-Pantel, Michael Fontaine, Gérard Michel, Sébastien Thibaud,Jean-Claude Gelin
To cite this version:Aurelien Maurel-Pantel, Michael Fontaine, Gérard Michel, Sébastien Thibaud, Jean-ClaudeGelin. Experimental investigations from conventional to high speed milling on a 304-L stain-less steel. International Journal of Advanced Manufacturing Technology, Springer Verlag, 2013,http://link.springer.com/article/10.1007/s00170-013-5159-7. <10.1007/s00170-013-5159-7>. <hal-00861789>

1
Experimental investigations from conventional to high speed milling on a 304L stainless steel. A. Maurel-Pantel*1, M. Fontaine2, G. Michel2, S. Thibaud2, J.C. Gelin2
1LMA, Aix-Marseille Univ, CNRS, UPR 7051, Centrale Marseille, F-13402 Marseille Cedex 20, France
2FEMTO-ST Institute, Department of Applied Mechanics, UMR CNRS 6174, ENSMM/ UFC / UTBM, France.
*Corresponding author: Dr. Ing. Aurélien MAUREL-PANTEL
Tel: + 33 (0)4 91 16 42 27
Fax: + 33 (0) 4 91 16 44 81
Email: [email protected]
Abstract
Last years analytical or finite element models of milling become more efficient and focus on more physical aspects, nevertheless the milling process is still experimentally unknown on a wide range of use. This paper propose to analyse with accuracy milling operations by investigating the cutting forces values, shape of cutting forces curves obtained for different cutting speeds, and related phenomena as tool wear or tool run-out. These detailed experimental data in milling constitute a suitable experimental basis available to develop predictive machining modelling. All the tests have been conducted on the 304L stainless steel in many cutting configurations and for different tool geometries. The machinability of the 304L stainless steel with different tools geometries and configurations in shoulder milling is defined by three working zones: a conventional zone permitting stable cutting (low cutting speed; under 200-250 m.min-1), a dead zone (unfavourable for cutting forces level and cutting stability; between 250 and 450 m.min-1), and a high speed machining zone (high cutting speed; up to 450-500 m.min-1). All the used criteria (cutting forces, chips, wear) confirm the existence of these different zones and a correlation is proposed with cutting perturbations as run-out, cutting instability, ploughing and abrasive wear.
Keywords: Machinability, High-speed milling, Cutting forces, Tool run-out, 304L stainless steel.

2
Nomenclature
Density c Calorific capacity T Temperature Taylor-Quinney coefficient Equivalent stress Equivalent strain rate A Yield stress constant of Johnson-Cook law B Strain hardening constant of Johnson-Cook law n Strain hardening exponent of Johnson-Cook law C Strain rate hardening constant of Johnson-Cook law m Temperature dependant coefficient of Johnson-Cook law
p Cumulated plastic strain
S Static friction coefficient
f Feed rate N Spindle frequency
CV Cutting speed
tf Feed per tooth
ad Axial depth of cut
rd Radial depth of cut
r Cutting edge radius
Tool nominal diameter Number of elements in the chip maximal section Angular position of the mill
XF Cutting force along the X axis (here Transverse force)
YF Cutting force along the Y axis (here Feed force)
ZF Cutting force along the tool Z axis (here Axial force)
1 Introduction
Milling is one of the most frequently used machining processes in mechanical
industries. But some essential physical phenomena are still difficult to understand.
Indeed milling is a very complex process with physical interactions between
shearing, compression, ploughing, friction, high strain rate, thermal effects, failure
and forced vibrations. Nevertheless manufacturing industries own a good
empirical knowledge of the process and search essentially to optimise
productivity. Although, in academic research field, works on machining focus
mainly on turning process and try to extrapolate issues to the milling process.
3
Many empirical, analytical or finite element models have been developed in
orthogonal cutting, in oblique cutting or more recently in 3D turning and 3D
milling. At the beginning, Merchant [1] has proposed the first basic analytical
model in orthogonal cutting taking into account only shearing effects in a specific
plane orthogonal to the cutting edge. Then, Oxley [2] has improved the model
with introduction of semi empirical relations and a behaviour law for the
machined material. More recently, Ceretti et al. [3] have proposed a finite element
model of a 2D orthogonal cutting to reproduce the chip formation with different
cutting conditions. Then Baker [4] proposed a finite element model in orthogonal
cutting and validate the cutting predictions with experimental cutting forces
confrontation. The first milling models were developed with an empirical
description of local cutting process based on cutting coefficients, and by using an
axial decomposition of the mill to consider elementary straight edges in oblique
cutting position by [5] and improved after by Yellowley [6]. Many models based
on the same approach were proposed during the twenty following years with some
remarkable advances on ball-end milling by Yang and Park [7], in milling process
dynamics by Altintas and Lee [8], in an advanced cutters geometrical description
by Engin and Altintas [9-10], or even free-form machining by Zhu et al. [11]. But
very few more complete models of milling were proposed more complete
including specifically an accurate description of different tool geometries, of tool
complex pathes and engagement, and taking into consideration the tool run-out.
Only one model mixed these developments with a thermo-mechanical description
of local cutting process with the purpose to enhance the understanding of milling
cutting process, Fontaine et al. [12] validate strong hypotheses associated to
oblique cutting and propose a more predictive approach. This model uses the
shear band model developed for high speed machining by Molinari et al. [13] and

4
Dudzinski et al. [14] and the analytical modelling of the 3D oblique cutting
configuration developed by Moufki et al. [15]. And now Zeroudi et al. [16] have
integered in model the use of CAM tool paths and Zeroudi and Fontaine [17] have
also predicted the produced form and roughness. More recently finite elements
models have been extended to milling process but only few detailed experimental
research are available in literature : Shao et al. [18] proposed a machinability
study on 3%Co-12%Cr stainless steel in milling and D’Errico et al. [19] studied
the tool-life reliability of cermet inserts with milling tests. In the FEMTO-ST
Institute, a 3D finite element model of milling has been developped with the
commercial software LS-Dyna by Maurel-Pantel et al. [20]. This milling
simulation is able to model the chip formation, to predict the cutting forces curves
and to furnish thermo-mechanical information during the cutting process.
Some experimental research have been also conducted to determine the
machinability of the material. Tekiner et al. [21] have developed measurement
methods to compare process sound with the cutting parameters in turning of AISI
304 austenitic stainless steel. Sullivan et al. [22] have proposed the on-line work
hardening detection techniques to study the machinability of SS303 austenitic
stainless steel. Salak et al. [23] have proposed an experimental method to compare
the machinability of different powder metallurgy steels in face turning
configuration. Other experimental research have been conducted to analyse some
different aspects in stainless steel machining as tool wear in order to predict the
tool life like in the works of Senthil Kumar et al. [24] or in order to compare free
cutting additives influences on cutting conditions as in Akasawa et al. [25], or to
study the surface integrity of machined workpiece as in Shao et al. [18], to
identify and develop modelling of friction conditions as in Valiorgue et al. [26-27]

5
and improve numerical model predictivity in turning simulation as in Bonnet et al.
[28].
Last years analytical or finite element models of milling become more efficient
and focus on more physical aspects, nevertheless the milling process is still
experimentally unknown on a wide range of use in literature. Now, it seems
interesting to improve the predictive capacity of these models on a wide
machining range. Milling experiments in many conditions are necessary to
analyse, to understand and to quantify the experimental phenomena with for
example the help of cutting forces measurement directly during milling
operations.
The works related in the present paper describe a set of milling tests lead on a
common stainless steel (AISI 304L). The aim consist to analyse the material
behaviour in a wide range of machining conditions, from low speed to high speed
machining, in order to obtain a wide experimental knowledge of the machinability
of this steel in milling. In this work, the analysis essentially leans on the direct
measure of cutting forces during the milling operations and examination of the
classical machining results (chips, wear, surface integrity…). The final aim
consists to build an accurate experimental basis to develop and improve analytical
and finite element models of milling on a wide range of use.
2 The 304L stainless steel
The 304L stainless steel is widely used in product manufacturing because it
presents a very good forming capacity, an excellent resistance to corrosion and a
high ductility. In last years, use of AISI 304L was widely expanded to other fields
as chemical, biomedical and power plant industries. The steel grade 304
6
represents today 80 % of the world-wide stainless steel market but austenitic
stainless steels are usually considered as quite difficult to machine. Actually
stainless steel are commonly machined with a maximal cutting speed equal to 250
m.min-1 but this limit increases continually with improvements in machine-tools
and tools design. The machinability of this steel is more difficult than other alloy
steels due to low heat conductivity, high built-up edge tendency and high
deformation hardening. The 304L stainless steel has a face centred cubic structure,
and it is composed of purely austenitic phases but a mechanical solicitation
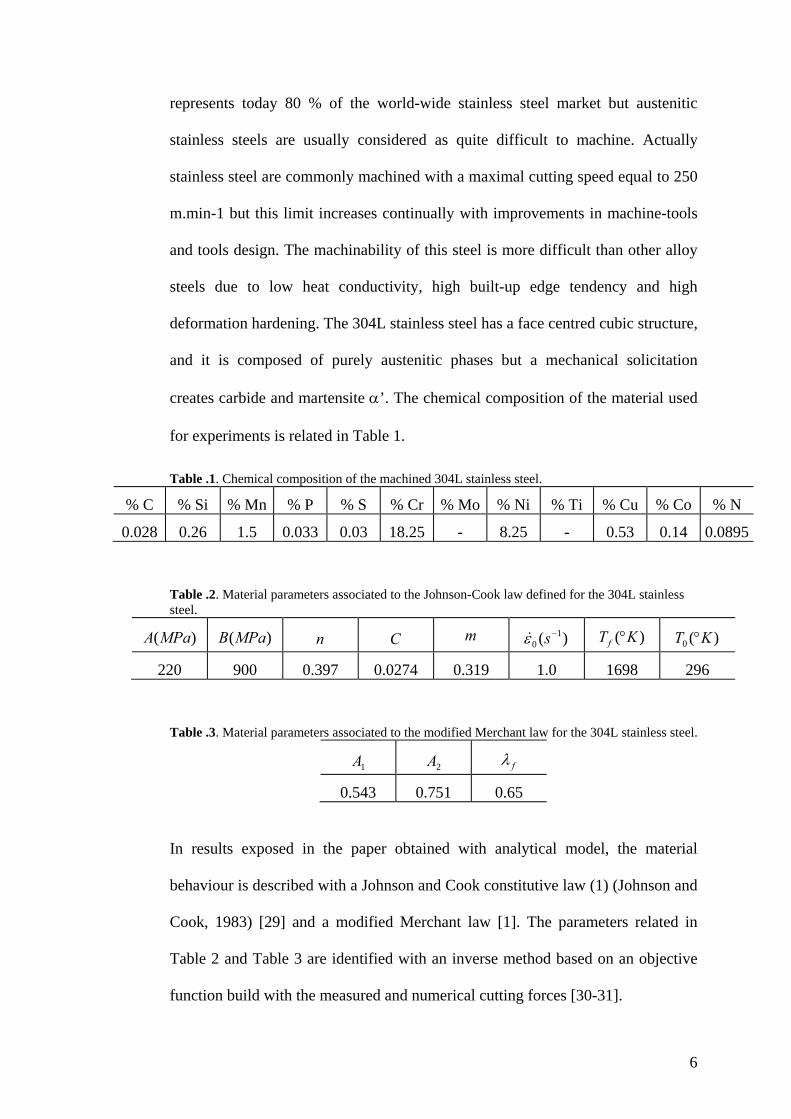
creates carbide and martensite ’. The chemical composition of the material used
for experiments is related in Table 1.
Table .1. Chemical composition of the machined 304L stainless steel.
% C % Si % Mn % P % S % Cr % Mo % Ni % Ti % Cu % Co % N
0.028 0.26 1.5 0.033 0.03 18.25 - 8.25 - 0.53 0.14 0.0895
Table .2. Material parameters associated to the Johnson-Cook law defined for the 304L stainless steel.
)(MPaA )(MPaB n C m )( 10
s )( KTf )(0 KT
220 900 0.397 0.0274 0.319 1.0 1698 296
Table .3. Material parameters associated to the modified Merchant law for the 304L stainless steel.
1A 2A f
0.543 0.751 0.65
In results exposed in the paper obtained with analytical model, the material
behaviour is described with a Johnson and Cook constitutive law (1) (Johnson and
Cook, 1983) [29] and a modified Merchant law [1]. The parameters related in
Table 2 and Table 3 are identified with an inverse method based on an objective
function build with the measured and numerical cutting forces [30-31].

7
m
f
n
TT
TTCBAR
0
0
0
1 ln1
(1)
Where A corresponds to yield strength, B and n corresponds to the hardening
coefficients, C defined the strain rate sensitivity, and m defined the temperature
dependency coefficient. fT and 0T are respectively the melting temperature and
the ambient temperature.
fffn ArcλλAA tan with 21 (2)
Where f and f are respectively the average friction angle and friction
coefficient at the tool/chip interface, n corresponds to the normal rake angle
defined by the tool geometry and local direction of cutting velocity. 1A and 2A
parameters depending of the machined material.
3 Milling experiments protocol
3.1 Micro-milling machine
All the milling tests described in this paper were performed at ENSMM
(Engineering School in Mechanics and Microtechnics) in Besançon, on a three
axes KERN© HSPC2525 micro-milling machine. This machine allows reaching
high cutting speeds (spindle frequency up to 35000 rev/min) and guaranties very
good repeatability and stability of the tests due to its high rigidity (concrete
polymer frame) and high precision (+/- 0.5 µm positioning).
8
3.2 Cutting forces measurement setup
The cutting forces measurement is performed with a Kistler dynamometer 9272.
Classically this product is used in drilling, but it presents a good polyvalence and
especially a high frequency bandwidth. The 4 sensors of the device deliver an
electric signal proportional to the loads in X, Y and Z directions and the cutting
force on each axis are obtained by summation. The dynamometer is connected to
a PC through a 5070 Kistler charge amplifier and a National Instruments
input/output data acquisition card (sample frequency limit: 40 kHz). Then data is
treated through a specific software, in which the sample frequency available is
adjustable and always corresponds to an integer multiple of the tooth path
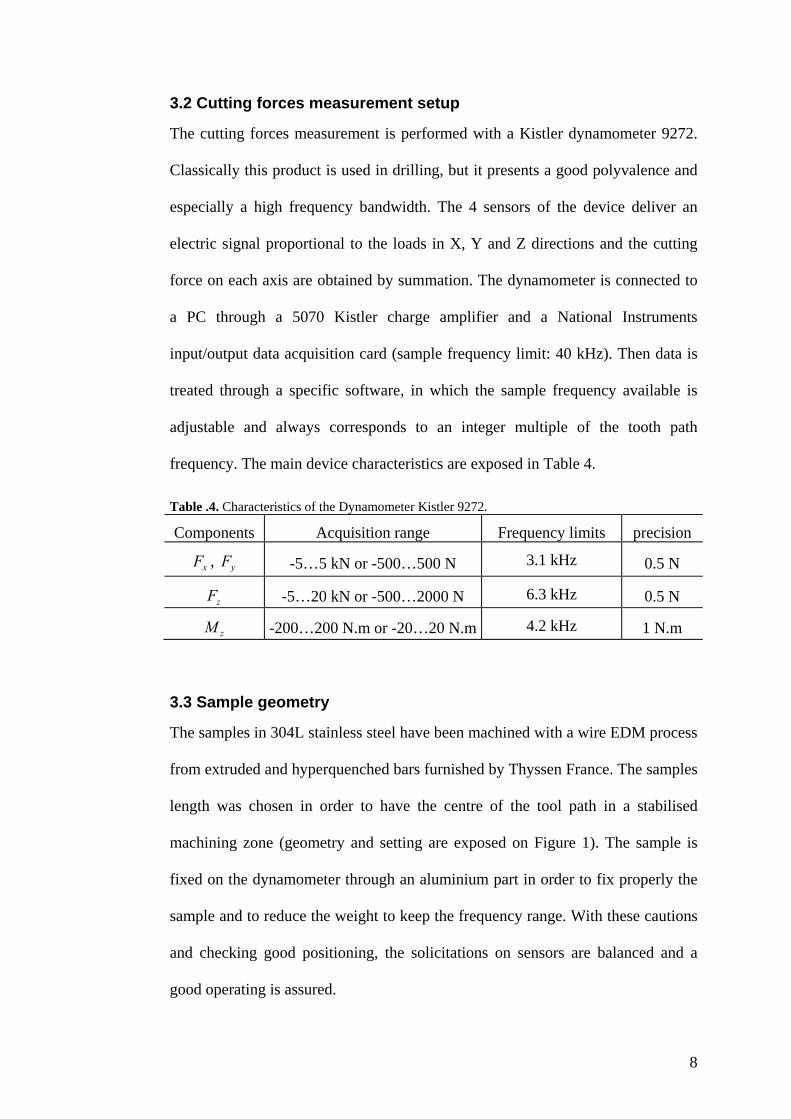
frequency. The main device characteristics are exposed in Table 4.
Table .4. Characteristics of the Dynamometer Kistler 9272.
Components Acquisition range Frequency limits precision
xF , yF -5…5 kN or -500…500 N 3.1 kHz 0.5 N
zF -5…20 kN or -500…2000 N 6.3 kHz 0.5 N
zM -200…200 N.m or -20…20 N.m 4.2 kHz 1 N.m
3.3 Sample geometry
The samples in 304L stainless steel have been machined with a wire EDM process
from extruded and hyperquenched bars furnished by Thyssen France. The samples
length was chosen in order to have the centre of the tool path in a stabilised
machining zone (geometry and setting are exposed on Figure 1). The sample is
fixed on the dynamometer through an aluminium part in order to fix properly the
sample and to reduce the weight to keep the frequency range. With these cautions
and checking good positioning, the solicitations on sensors are balanced and a
good operating is assured.

9
Fig .1. Assembly of the samples used for the experiments and pictures of the milling acquisition systems.
Fig .2. Measure validity range with a 6 mm diameter mill function of cutting speed
3.4 Acquisition limits in milling
The validity range of the cutting forces measurements is described by the cutting
speed range available with our acquisition system. Figure 2 exposes the
experimental system limits but also describe the actual technological difficulties
to reach high cutting speed in milling. The case of a milling operation with a 6
mm diameter end mill is considered accordingly to the experiments.

10
Figure 2 relates the maximum number of sample points available to describe a
tooth path and underlines the technological limits of the experimental setup.
The first limit consists to keep at minimum 20 sample points by tooth to
obtain a good description of the cutting forces curves. This first condition
determined by the maximal frequency of the acquisition card, limit the
experimental range to a maximal cutting speed of 1130 m.min-1.
Then, two technological limits appear: the acquisition frequency maximal
limit of the dynamometer and the limit of the machine spindle. It is very
important to perform the tests below the frequency limit of the
dynamometer, that's why we pay attention in our experimental test to keep
a gap of 30 % in order to avoid measurement errors due to amplification.
The machine spindle impose the more severe criterion in this configuration
and the maximal cutting speed reachable experimentally is 660 m.min-1.
3.5 Device used for the analysis
A topo-microscope Alicona has been used for qualitative and quantitative
analyses of machined samples. This device is designed to perform optical
measures without contact in three dimensions. It is based on an optical
microscope coupling with a camera. Topo-microscopy is combination of two
types of measure: microscopy and micro-topography. It is possible from obtained
high resolution juxtaposed 3D fields to perform measure of dimensions,
topography, waviness profile, roughness, surfaces and volumes.

11
Fig .3. Characteristics of tools used in the experiments.
3.6 Tested tools
In this study, tools are solid cutters made in tungsten carbide coated or uncoated.
The mills have been specifically chosen for their good dynamic balancing and
good symmetry of cutting edges. The both aspects permit to respect the tool
engagement induced by the feed, to avoid the amplification of the radial tool run-
out and to reduce vibration phenomena induced by a high spindle frequency. All
mills used in experiments have a 6 mm diameter and two teeth in order to simplify
the interpretation of cutting forces curves in function of the tool engagement in
matter. At the beginning, tests have been led on with coated and uncoated end
mills commercially proposed for such applications. The uncoated ones present the
benefits to homogenize and simplify the experimental observations. Then, bull
nose end mills have been tested for their robustness and to reach higher feed
values. The cylindrical end mills (noted mill A) and the bull nose end mills (noted
mill B) have been provided by two different manufacturers. The mills
characteristics are described and exposed in Figure 3.

12
Tools Type Coating Cutting speed(m.min-1)Feed
(mm.tooth-1) Configurations
Tool 1
Mill A - 70 to 650 0.03 Slotting
Mill A - 70 to 650 0.015 Up cutting
Mill A - 70 to 650 0.03 Up cutting
Mill A - 70 to 650 0.045 Up cutting
Mill A - 70 to 370 0.06 Up cutting
Mill A - 70 to 650 0.03 Down cutting
Tool 2
Mill A TiCN 70 to 650 0.015 Up cutting
Mill A TiCN 70 to 650 0.03 Up cutting
Mill A TiCN 70 to 650 0.045 Up cutting
Mill A TiCN 70 to 650 0.03 Down cutting
Tool 3
Mill B - 70 to 590 0.03 Slotting
Mill B - 70 to 590 0.01 Up cutting
Mill B - 70 to 590 0.015 Up cutting
Mill B - 70 to 590 0.03 Up cutting
Mill B - 70 to 590 0.045 Up cutting
Mill B - 70 to 590 0.06 Up cutting
Mill B - 70 to 590 0.015 Down cutting
Mill B - 70 to 590 0.03 Down cutting
Mill B - 70 to 590 0.045 Down cutting
Table .5. Milling tests performed.
3.7 Tested cutting conditions
Different feeds and cutting configurations, and a large range of cutting speeds
were tested with the selected tools. The reference values of cutting speed and feed
recommended by tools manufacturers were about 150 m.min-1 and 0.03 mm.tooth-
1 respectively. The minimum and maximum values were defined after preliminary
milling tests in association with the tool manufacturers. The cutting speed of
650m.min-1 corresponds to the maximum value reachable with a 6 mm diameter
mill and the used spindle. All the parameters configurations were tested with a
cutting speed pitch of 30 m.min-1 in order to obtain a complete and pertinent data
13
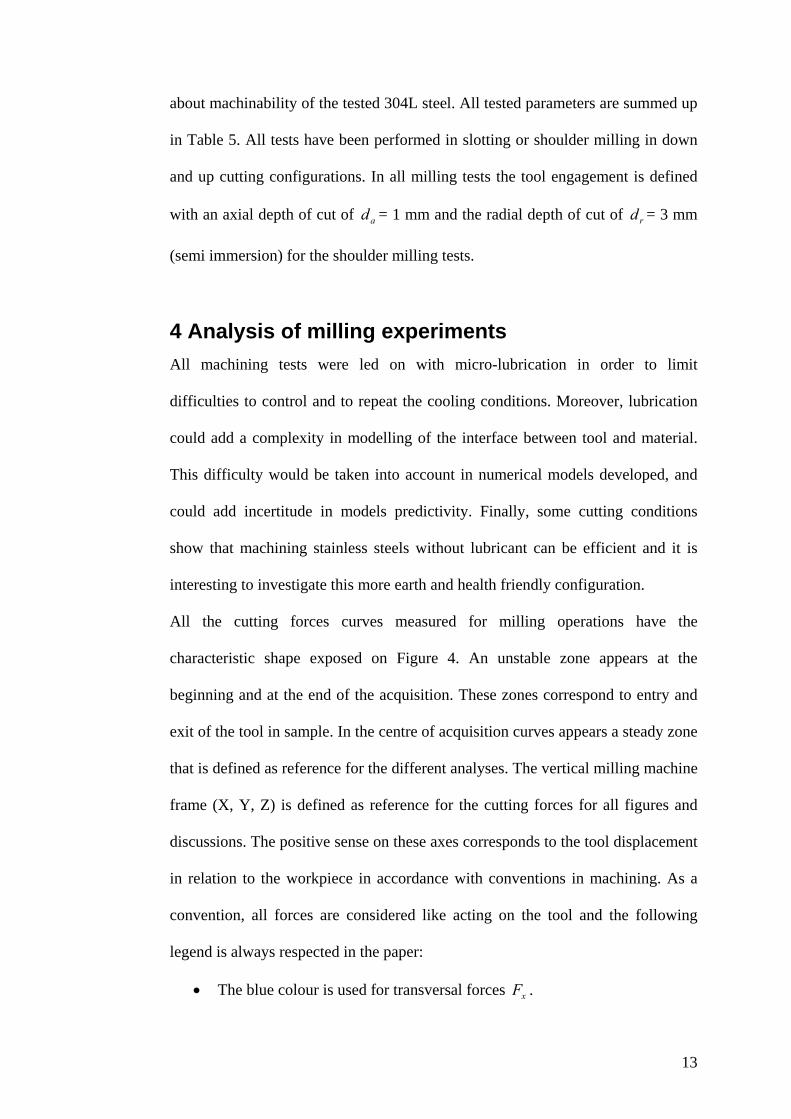
about machinability of the tested 304L steel. All tested parameters are summed up
in Table 5. All tests have been performed in slotting or shoulder milling in down
and up cutting configurations. In all milling tests the tool engagement is defined
with an axial depth of cut of ad = 1 mm and the radial depth of cut of rd = 3 mm
(semi immersion) for the shoulder milling tests.
4 Analysis of milling experiments
All machining tests were led on with micro-lubrication in order to limit
difficulties to control and to repeat the cooling conditions. Moreover, lubrication
could add a complexity in modelling of the interface between tool and material.
This difficulty would be taken into account in numerical models developed, and
could add incertitude in models predictivity. Finally, some cutting conditions
show that machining stainless steels without lubricant can be efficient and it is
interesting to investigate this more earth and health friendly configuration.
All the cutting forces curves measured for milling operations have the
characteristic shape exposed on Figure 4. An unstable zone appears at the
beginning and at the end of the acquisition. These zones correspond to entry and
exit of the tool in sample. In the centre of acquisition curves appears a steady zone
that is defined as reference for the different analyses. The vertical milling machine
frame (X, Y, Z) is defined as reference for the cutting forces for all figures and
discussions. The positive sense on these axes corresponds to the tool displacement
in relation to the workpiece in accordance with conventions in machining. As a
convention, all forces are considered like acting on the tool and the following
legend is always respected in the paper:
The blue colour is used for transversal forces xF .

14
The red colour is used for feed forces yF .
The green colour is used for vertical forces zF .
Fig .4. Measured cutting forces curves with a zoom on the steady zone. (a) slotting configuration and (b) down cutting configuration (semi immersion)
4.1 Cutting configurations in milling
In this section, the main tool engagement conditions in three axes milling are
analysed from the cutting forces curves measured and calculated with our
analytical model using a rigid description of the tool engagement and firstly
proposed in Fontaine et al. [12] [32]. Discussions in this section focus mainly on
the transverse force xF and feed force yF . Indeed, it is difficult to confront the
vertical force zF with the tool engagement because zF force it shows lesser
cutting force levels and is directly perturbed by non shearing cutting phenomena
as ploughing mainly due to the cutting zone at tool end where cutting speed and
chip thickness tend to zero. For instance Fontaine et al. [32] described in slotting a
confrontation between the negative values on zF obtained with an end mill and
the positive values obtained with a bull nose end mill for which the projection of

15
local forces on the tool change and the non shearing phenomena at tool end
increase. The case considered corresponds to a mill with two teeth, but
conclusions can be easily generalised for a mill designed with one, three or more
teeth. A spectral analysis has been conducted on each test in order to verify that
measures are not disturbed by unexpected frequencies. We are able with this
protocol to have a good correlation and interpretation of cutting forces curves with
the tool engagement in matter.
Fig .5. Theoretical tool engagement, tooth path, and cutting forces curves characteristics in slotting configuration
4.1.1 Slotting configuration
In slotting configuration, the radial depth of cut corresponds to the mill diameter
( rd = 6 mm). Classically, ad corresponds to the vertical depth of cut, the
configuration is described in Figure 5. If a cross section in (X, Y) plane for an
altitude z is considered, the tooth path related in Figure 5 corresponds to the
section of material removed by a tooth on a height ad and a maximum width
corresponds to the feed tf . The mill has a helix angle and the cutting edge follows
this helix, that’s why the cutting edge is not in the same place for different
altitudes z considered. The tool engagement is totally three-dimensional with a
trochoïdal geometry and imposes the chip motion and formation. These essential
remarks put in evidence limits to make comparisons between turning process and
16
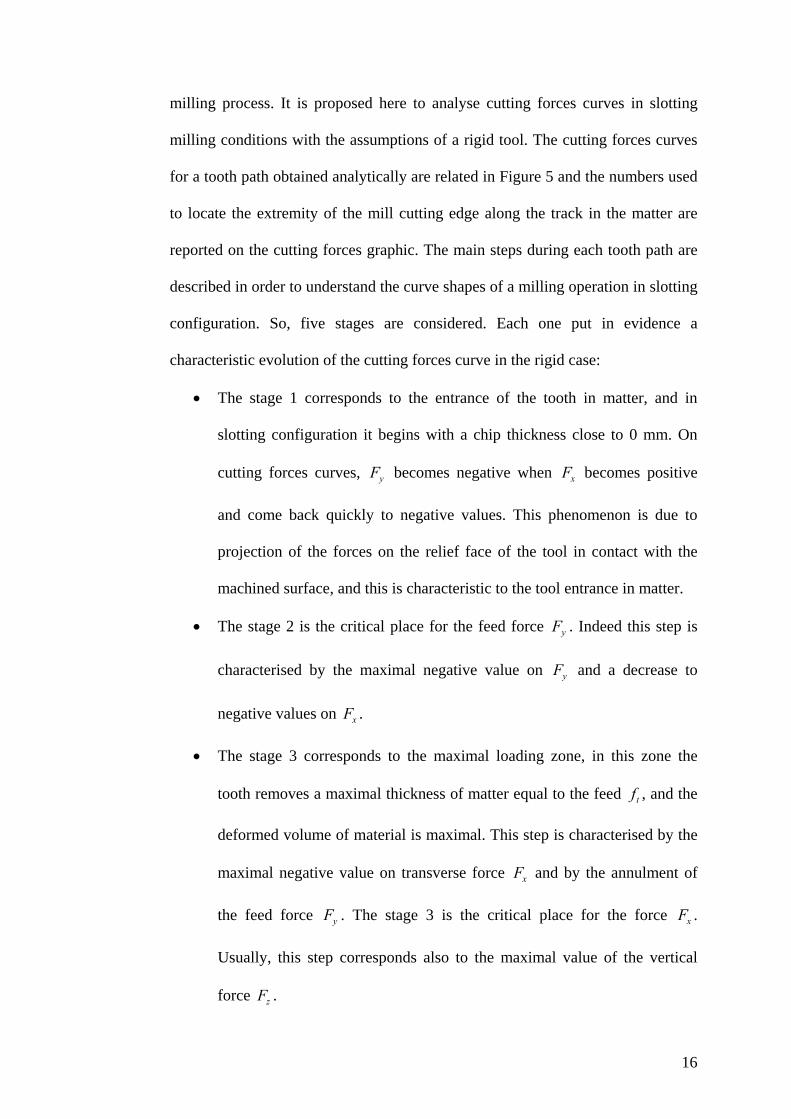
milling process. It is proposed here to analyse cutting forces curves in slotting
milling conditions with the assumptions of a rigid tool. The cutting forces curves
for a tooth path obtained analytically are related in Figure 5 and the numbers used
to locate the extremity of the mill cutting edge along the track in the matter are
reported on the cutting forces graphic. The main steps during each tooth path are
described in order to understand the curve shapes of a milling operation in slotting
configuration. So, five stages are considered. Each one put in evidence a
characteristic evolution of the cutting forces curve in the rigid case:
The stage 1 corresponds to the entrance of the tooth in matter, and in
slotting configuration it begins with a chip thickness close to 0 mm. On
cutting forces curves, yF becomes negative when xF becomes positive
and come back quickly to negative values. This phenomenon is due to
projection of the forces on the relief face of the tool in contact with the
machined surface, and this is characteristic to the tool entrance in matter.
The stage 2 is the critical place for the feed force yF . Indeed this step is
characterised by the maximal negative value on yF and a decrease to
negative values on xF .
The stage 3 corresponds to the maximal loading zone, in this zone the
tooth removes a maximal thickness of matter equal to the feed tf , and the
deformed volume of material is maximal. This step is characterised by the
maximal negative value on transverse force xF and by the annulment of
the feed force yF . The stage 3 is the critical place for the force xF .
Usually, this step corresponds also to the maximal value of the vertical
force zF .

17
The stage 4 is symmetric to the stage 2. This step is characterised by the
maximal positive value on yF and a force xF tending to zero.
The virtual stage 5 corresponds to the outgoing of the tooth in matter. Both
forces yF and xF are close to zero corresponding to the end of the cutting
cycle for the first tooth. In case of slotting with a two teeth end mill, the
curves begin immediately another identical cycle with the second tooth as
related in Figure 6 (a).
Fig .6. Qualitative comparison of cutting forces curves in slotting configuration with mill A. (a) rigid case obtained analytically. (b) cutting speed equal to 70 m.min-1. (c) cutting speed equal to 310 m.min-1. (d) cutting speed equal to 590 m.min-1. (ft = 0.015 mm.tooth-1, dr = 6 mm, da = 1 mm)
An angular difference appears between the tool position located and the different
stages on the curves. This is due to the fact that the maximal loads are located on a
point in the median immersion plane of the mill, and it depends on the depth of
cut ad and the value of the helix angle. The tooth angular position is considered at
the extremity of the tool cutting edge and this choice induced the angular

18
difference observed on the curves. For a mill with more than two teeth, the
interpretation would not be easy but the same tendencies will be observed on the
resultant force on the tool. This analysis allows having a better understanding to
analyse the experimental curves. Figure 6 exposes four sets of cutting forces
curves for a mill rotation (two tooth paths in this case). The first cutting forces
curves noted (a) are calculated analytically with the material parameters
previously exposed and with the same cutting conditions than the cutting forces
curves (b) that is to say for a low cutting speed. Cutting forces curves (c) and (d)
are chosen respectively for a middle cutting speed and for the higher cutting speed
tested in slotting. The curve shapes obtained analytically in a rigid case are
equivalent for the three cutting speeds and only the forces level slightly decreases.
The best correlation is obtained for the cutting forces curves (b) with the lower
cutting speed. In slotting configuration, the tool motion is balanced by the guiding
of the slot, and the tool globally respects a motion close to the rigid case
considered in machining models. Only some medium cutting speeds imply cutting
instabilities and then cutting forces amplification, for example for 310 m.min-1.
Fig .7. Tool engagement, tooth path, cutting forces curves characteristics in up cutting configuration.
4.1.2 Shoulder milling in up cutting configuration
In up cutting configurations in shoulder milling, the radial depth of cut is strictly
inferior to the mill diameter ( rd ). The operation is a contouring one and
consists to remove the matter only on a side of the tool with an axial depth of cut

19
ad . Up cutting configuration is described on figure 7 and corresponds to the case
where the matter comes on a mill tooth globally in the opposite way than the tool
displacement in relation to the workpiece. The teeth begin to remove matter with a
thickness equal to 0 mm and finish cutting with a varying thickness (maximal in
case of radial semi-immersion and equal to feed per tooth tf ). The shoulder
milling case in up cutting is considered in this paper for a radial semi-immersion
(i.e. 2
rd ). If a cross section in (X, Y) plane is considered as previously, the
tooth path related in Figure 7 corresponds to the section of matter removed by a
tooth. Figure 7 described the cutting forces curves obtained in up cutting
configuration analytically in a rigid case and like previously the four main stages
are described:
The stage 1 corresponds to the entrance of the tooth in matter, and in this
case begins by a thickness equal to 0 mm. For this step same
interpretations than in slotting configurations can be considered.
The stage 2 is the critical place for the feed force like in slotting
configuration.
One more time the stage 3 corresponds to the maximal loading zone. In
this position the tooth removes a maximal thickness of material equal to
the feed tf (only in case of semi-immersion). The stage 3 is the critical
place for the transverse force xF and the split-up of the chip. Just after this
stage, the chip is removed, and the tooth comes outside the matter, a
nickpoint appears on curves, the cutting forces increase quickly to value
zero. In this zone the chip separation mode and the tool geometry have a
high influence. And lots of phenomena (wear, vibrations…) are initiated in
this zone due to the fast change of loading on the tool.
20
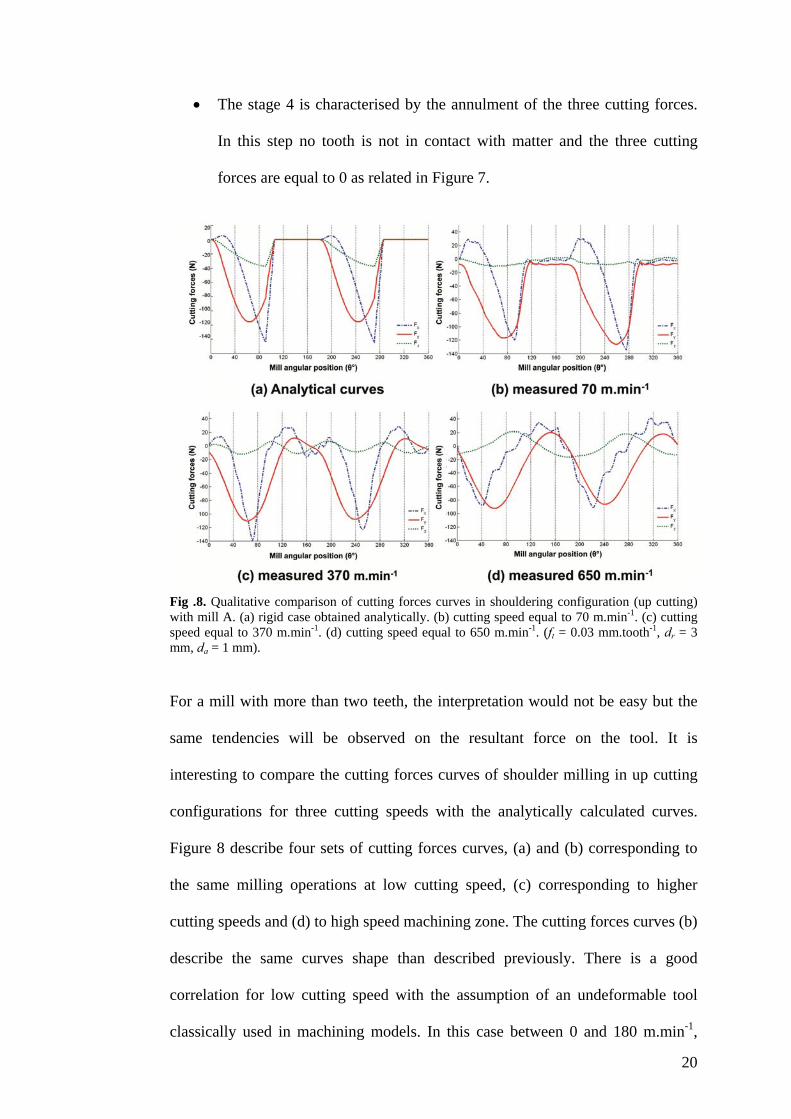
The stage 4 is characterised by the annulment of the three cutting forces.
In this step no tooth is not in contact with matter and the three cutting
forces are equal to 0 as related in Figure 7.
Fig .8. Qualitative comparison of cutting forces curves in shouldering configuration (up cutting) with mill A. (a) rigid case obtained analytically. (b) cutting speed equal to 70 m.min-1. (c) cutting speed equal to 370 m.min-1. (d) cutting speed equal to 650 m.min-1. (ft = 0.03 mm.tooth-1, dr = 3 mm, da = 1 mm).
For a mill with more than two teeth, the interpretation would not be easy but the
same tendencies will be observed on the resultant force on the tool. It is
interesting to compare the cutting forces curves of shoulder milling in up cutting
configurations for three cutting speeds with the analytically calculated curves.
Figure 8 describe four sets of cutting forces curves, (a) and (b) corresponding to
the same milling operations at low cutting speed, (c) corresponding to higher
cutting speeds and (d) to high speed machining zone. The cutting forces curves (b)
describe the same curves shape than described previously. There is a good
correlation for low cutting speed with the assumption of an undeformable tool
classically used in machining models. In this case between 0 and 180 m.min-1,

21
analytical modelling gives a good description of cutting forces. For higher cutting
speeds, some stages disappear. For instance on chart (c) there is no continuous
zero value and on (d) the nickpoint has disappeared, the curves are sinusoidal and
the cutting process seems to be continuous. Cutting forces curves (d) seems to
present the same curve shapes than in slotting operations. Actually, rigid
machining models are not able to be predictive in this machining zone. Vibrations
phenomena and flexible behaviour of the tool have to be considered in modelling
in order to reach high speed milling zones.
Fig.9. Tool engagement, tooth path, cutting forces curves characteristics in down cutting configuration.
4.1.3 Shoulder milling in down cutting configuration
In down cutting configurations in shoulder milling, the radial depth of cut is
strictly inferior to the mill diameter ( rd ). The operation is the symmetric of
up cutting. Down cutting configuration corresponds to the case where the matter
comes on a mill tooth globally in the same way than the tool displacement in
relation to the workpiece. The teeth begin to remove matter with a maximal
thickness (equal to tf in semi-immersion case) and finish cutting with thickness
equal to 0 mm. This configuration is described in Figure 9. The shoulder milling
case in down cutting is considered in this paper for a radial semi-immersion (i.e.
2
rd ). If a cross section in (X, Y) plane is considered as previously, the tooth
path related in Figure 9 corresponds to the section of material removed by a tooth.

22
Figure 9 described the cutting forces curves obtained in down cutting
configuration analytically in a rigid case and the four main stages can be
described:
The stage 1 corresponds to the tooth entrance in matter, and it begins by a
maximal thickness equal to tf in radial semi-immersion. It corresponds to
the maximal loading zone. Nickpoints are observed on three cutting forces
curves corresponding to the fast entrance in matter and to the particular
form of the first undeformed chips because of the presence of the straight
initial workpiece surface. This step are characterised classically by a
maximal negative value on transverse force xF and a decrease of feed
force yF . This negative value of feed force is mainly due to the projection
of forces on the tool relief surface and induced by the tool/matter interface.
This step is the critical place for the transverse force xF . The stage 2
corresponds to the feed force yF annulment and to the beginning of the
xF force decrease.
The stage 3 is characterised by the maximal positive value on feed force
yF , it is the critical place for the feed force yF .
The stage 4 is characterised by the annulment of the three cutting forces.
In this step no tooth is in contact with matter.
As previously, Figure 10 describes four sets of cutting forces curves in down
cutting configuration. There is a good correlation for low cutting speeds with the
assumption of an undeformable tool. Between 0 and 230 m.min-1 in this case, the
analytical model predict well the cutting forces. Between 0 and 230 m.min-1 in
this case, the analytical model predict well the cutting forces.

23
Fig.10. Qualitative comparison of cutting forces curves in shouldering configuration (down milling) with mill B. (a) rigid case obtained analytically. (b) cutting speed equal to 70 m.min-1. (c) cutting speed equal to 310 m.min-1. (d) cutting speed equal to 590 m.min-1. (ft=0.045mm.tooth-1, dr= 3 mm, da= 1 mm).
Between 0 and 230 m.min-1 in this case, the analytical model predict well the
cutting forces. For higher cutting speeds, some stages are disappeared. For
instance on chart (c) there is no continuous zero value and on (d) the nickpoint has
disappeared, the curves are sinusoidal and the cutting process seems to be
continuous. For instance on chart (c) there is no continuous zero value and the
nickpoint has disappeared. On chart (d) the curves become sinusoidal and the
cutting process seems to be continuous. Then there is still a lack in modelling
about tool dynamic behaviour and ploughing effects. Complementary
experimental investigations as chips, tool wear and cutting forces curves
observation with considering tool run-out permit to enhance this description of the
cutting phenomena in different machining zones. The aim consists in describing
clearly the milling process and putting in evidence process difficulties or
specificities. All experiments presented below have been led on in shoulder

24
milling with up and down cutting configurations (semi radial immersion rd = 3
mm) and with a constant axial depth of cut ( ad = 1 mm).
4.2 Machinability of the 304L stainless steel
This analysis focus on the machinability of 304L stainless steel and its behaviour
for different tools and in a wide range of cutting speeds. The main criterion is the
influence of tools and cutting conditions on the measured cutting forces. In the
following section, the average peak-to-peak amplitude values of transverse forces
xF and feed forces yF are identified in the stabilised zone and are related in
function of cutting speed and feed tested in different cutting configurations as
shown in Figure 4.
4.2.1 Results obtained with mill A
In the experiments with the end mill A, analysis focus on differences observed
between coated and uncoated end mills as related in Figure 11, and following
conclusions appeared:
In both cases (coated and uncoated mill), cutting forces values increase
globally proportionally to the feed.
For the two tools machinability curves are similar, but a difference has to
be noted, particularly for high feed values: the levels of cutting forces for
the coated mills are appeared slightly lower than for the uncoated ones.
The TiN based coatings are well known to significantly reduce the friction
at the tool-material interface [33] and it is particularly sensitive in this case
because of high load associated to high feed rate and of the sticking
behaviour of stainless steels in machining [34].

25
On all curves, three working zones are observed: a first zone for small
cutting speeds where cutting forces are constant or presenting a light
decrease; then a critical second zone where the cutting forces increase
strongly appears; and finally a third zone with high cutting speeds where
cutting forces decrease strongly and reach values lower than in first zone.
On all curves, the secondary zone is less favourable and is more critical
for high feed values.

26
Fig.11. Cutting forces average amplitude evolutions function of cutting speed in up cutting configuration for coated and uncoated end mills A.
4.2.2 Results obtained with mill B
The results obtained with the bull nose end mill B are here analysed. In this case,
the both configurations in shoulder milling have been tested and compared. The
27
curves are related in function of cutting speeds and feeds in up cutting in Figure
12 and in down cutting in Figure 13. The following conclusions appeared:
Classically and as seen before, in both cases cutting forces values increase
proportionally to the feed. But for the both highest feeds, difference is not
significant.
As seen before and in both cases, criticity of the secondary zone directly
depends on feed value.
In down cutting configuration, the lower feeds seem to be unfavourable for
the tool, because the cutting forces in first zone reach the same values than
for the maximal feeds.
On these curves, three working zones are observed: a first zone with quite
low cutting forces; a critical second zone where these forces increase
strongly; and a third zone with high cutting speeds where cutting forces
decrease rapidly. In both cases the critical zone has not been observed for
the transverse forces xF . The critical zone exists for the feed forces yF
only in up cutting configuration. Transverse forces describe in second
machining zone a stable zone slightly decreasing. This effect is probably
due to the bull nose end mill geometry that gives a better resistance to high
loading on teeth. With bull nose end mill the critical machining zone is not
a problem for the transverse forces xF .

28
Fig.12. Cutting forces average amplitude evolutions function of cutting speed in up cutting configuration for end mills B.
In down cutting, the critical zone becomes a stable zone with values
equivalent to the first and third zones. This machining zone is not as
critical as in the other cases. The shoulder milling in down cutting
configuration has showed the best behaviour on the tested cutting speeds
range.

29
Fig.13. Cutting forces average amplitude evolutions function of cutting speed in down cutting configuration for end mills B.
In return, on up cutting curves, the feed force yF is greater than the
transverse force xF in critical zone. The transverse forces are theoretically
upper than the feed forces in end milling for slotting configuration. It is
commonly still the case for semi or even quarter immersion configuration
[32]. Only inferior radial immersion can produce an inverse repartition,
especially in up-cutting mode. This tendency to inverse the cutting forces
repartition in up-cutting is due to two major phenomena: cutting efficiency
of the cutting edge due to its sharpness in regard of the underfomed chip
thickness; and cutting stability due to dynamic tool’s behaviour linked to
its stiffness. In fact, the cutting force generated at the beginning of a new
chip (see figure 7) is amplified when the sharpness of the tool is reduced
(i.e. the cutting edge radius/chip thickness ratio becomes unfavourable),
and during the whole tooth path in the part’s material, the radial

30
component of the generated force tends to grow and the tangential one
tends to decrease. These local modifications of cutting force amplitude and
direction can change the repartition in force value between feed direction
and transverse direction in milling. This observation is particularly evident
in micro-milling where the sharpness of the tool is critical [35]. The
previous results in up-cutting mode (figures 11 & 12) show that mill B
tends to present this behaviour and not the mill A, it can be explained by
the difference in tungsten carbide structure between these two uncoated
mills. The micro grain tungsten carbide structure of the mill A gives to the
tool a better sharpness and a better stiffness, that generate less cutting
force amplitude and a repartition on reference axes closer to the theoretical
rigid and perfectly sharp case, especially for intermediary cutting speeds
(critical zone).
To conclude, three zones seem clearly appear from the experiments: two
favourable machining zones and one unfavourable machining zone. Machining
zones with stable machining conditions and with reduced cutting forces are
described by a conventional machining zone between 0 and 200 m.min-1 and a
high speed machining zones beginning from 550 m.min-1. The critical zone with
severe cutting forces is described by a dead zone between 200 and 500 m.min-1.
Many phenomena have to be noted. Firstly, in up cutting configuration with the
bull nose end mills B the dead zone is wider than for the end mills A. And in
down cutting configuration with the bull nose end mills B the dead zone does not
exist. Nevertheless the high speed machining zone is observed on all the
experimental results.
31
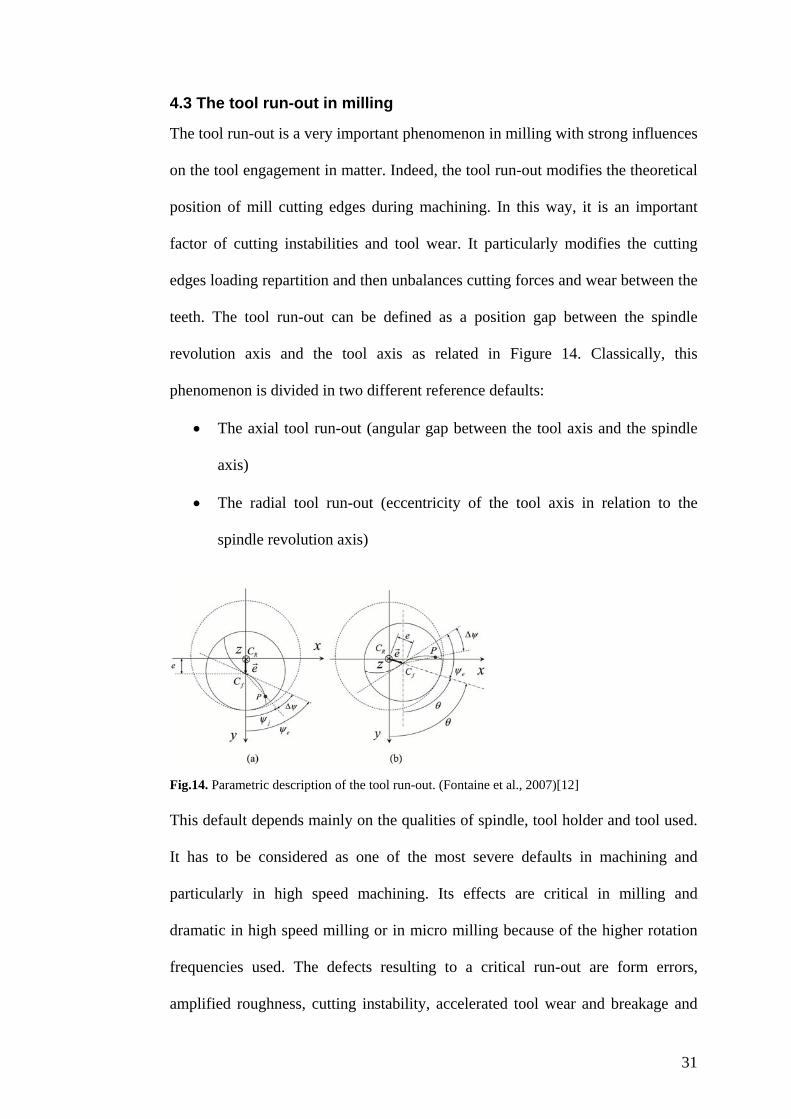
4.3 The tool run-out in milling
The tool run-out is a very important phenomenon in milling with strong influences
on the tool engagement in matter. Indeed, the tool run-out modifies the theoretical
position of mill cutting edges during machining. In this way, it is an important
factor of cutting instabilities and tool wear. It particularly modifies the cutting
edges loading repartition and then unbalances cutting forces and wear between the
teeth. The tool run-out can be defined as a position gap between the spindle
revolution axis and the tool axis as related in Figure 14. Classically, this
phenomenon is divided in two different reference defaults:
The axial tool run-out (angular gap between the tool axis and the spindle
axis)
The radial tool run-out (eccentricity of the tool axis in relation to the
spindle revolution axis)
Fig.14. Parametric description of the tool run-out. (Fontaine et al., 2007)[12] This default depends mainly on the qualities of spindle, tool holder and tool used.
It has to be considered as one of the most severe defaults in machining and
particularly in high speed machining. Its effects are critical in milling and
dramatic in high speed milling or in micro milling because of the higher rotation
frequencies used. The defects resulting to a critical run-out are form errors,
amplified roughness, cutting instability, accelerated tool wear and breakage and
32
accelerated wear of the spindle bearings The radial run-out is most of the time
more pronounced and more difficult to compensate dynamically by the flexibility
of the cutting system (tool + tool-holder) than the axial run-out. For example,
modelling the radial run-out only usually permits to predict accurately the cutting
forces unbalance [12][32][36]. That is the reason why we focus specifically on the
radial default in the following works.
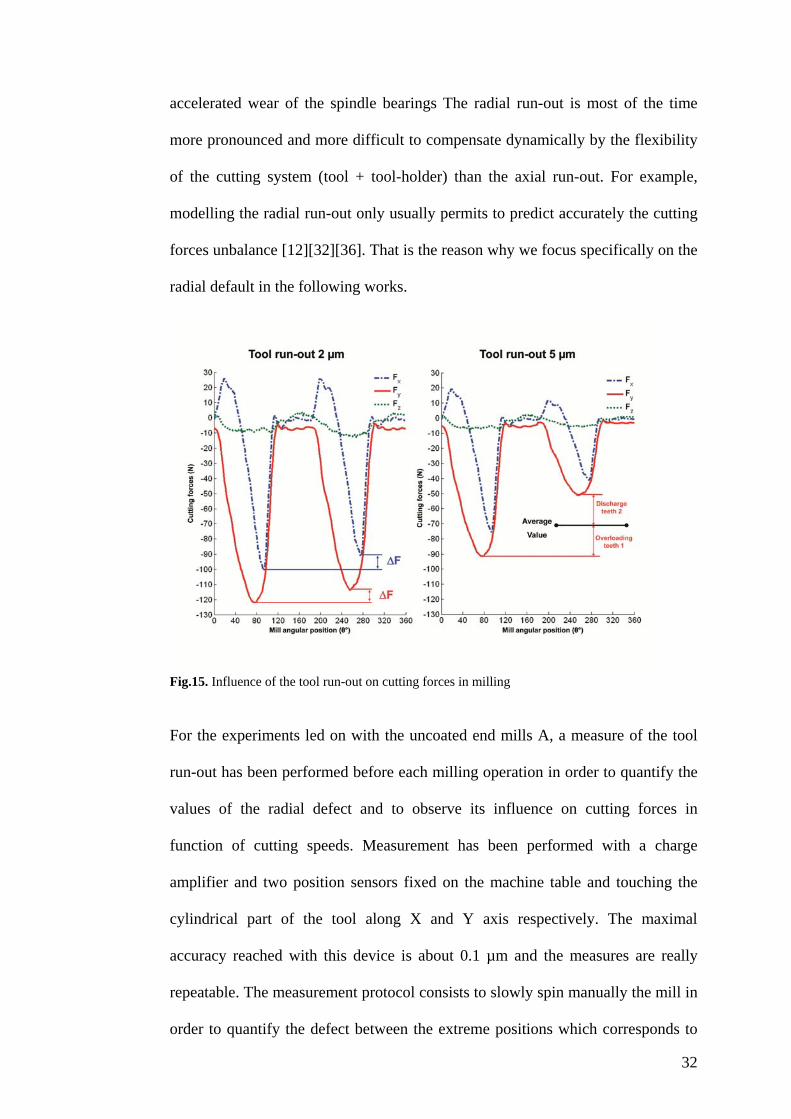
Fig.15. Influence of the tool run-out on cutting forces in milling
For the experiments led on with the uncoated end mills A, a measure of the tool
run-out has been performed before each milling operation in order to quantify the
values of the radial defect and to observe its influence on cutting forces in
function of cutting speeds. Measurement has been performed with a charge
amplifier and two position sensors fixed on the machine table and touching the
cylindrical part of the tool along X and Y axis respectively. The maximal
accuracy reached with this device is about 0.1 µm and the measures are really
repeatable. The measurement protocol consists to slowly spin manually the mill in
order to quantify the defect between the extreme positions which corresponds to

33
two times the value of eccentricity. The setting up is related in Figure 3. The tool
run-out is here located by an eccentricity value e and an angular position of the
maximal defect on the tool cylinder, like on the sketch related in Figure 14. For all
the experimental tests in milling, the measured tool run-out took values between 2
µm and 5 µm.
Fig .16. Additional loading evolution function of tool run-out and cutting speed
In case of conventional milling, this defect represents at maximum 30 % of tested
feed per tooth. The tool run-out is not critical in milling but possesses a real
influence on cutting stability, dynamics phenomena and tool wear. The tool run-
out effect is described with two cutting forces curves and measured with two
different tool run-out values, Figure 15. Each curves represents a mill rotation or
in this case two tooth paths. On these curves, the tool run-out modifies the cutting
forces repartition between each tooth of the mill. The additional loading on a tooth
is a proposed value to quantify tool run-out effect. This value is a percentage of
the cutting forces average value. It is added positively or negatively on each tooth.
So with this definition, overloading and discharge are equal and opposite, and

34
during our experiments the maximal value of measured overloading exceeds 50 %
of the average cutting forces. After experimental analysis, the behaviour of this
additional loading has been observed in function of tool run-out values and cutting
speeds, and the results are related in Figure 16. On these curves, additional
loading increases in an important way with cutting speed, then the tool run-out
effect seems to increase with cutting speed. Moreover the additional loading
increases linearly with the tool run-out values and increases globally with cutting
speed. For high cutting speeds and due to dynamic effects, the tool run-out
phenomenon can become a critical point for tool behaviour, machined surface
quality and tool wear.
4.4 Chip formation
Chips give essential information about milling process. They are the results of the
matter deformation and also the witness zone of the most intense mechanical or
thermal solicitations occurring in cutting. In literature, a very few works focused
on chip observations in up cutting configuration in milling. That is right that it is
very difficult to make a connection between the chip geometry and its way of
formation, because the final shape of a chip can be very different from the
theoretical shape which can be deduced from a rigid and elementary case. In
turning, this difference is reduced, so it is easier to conclude. In this analysis, the
aim not consists to compare a real chip with a chip in a theoretical case, but rather
to observe differences and evolutions in chip morphology in function of
machining parameters. A first qualitative analysis is here proposed, and then
completed in analysing the evolutions of chip length and thickness.

35
Fig .17. Chip evolution function of cutting speed in milling of a 304L steel The qualitative analysis related in Figure 17 shows that the obtained chips inherit
some characteristics of the mill flute, and in particular a striated surface due to the
ploughing of the chip by irregularities of the rake face of the flutes obtained after
tool grinding. The metallic aspect of chips is close to the initial material but for a
cutting speed equal to 450 m.min-1, an important changing appears on the chip
surface. Oxide colours (red, blue, orange) appeared on chip surface, it is probably
due to the thermal effects induced by high cutting and friction speeds.
36
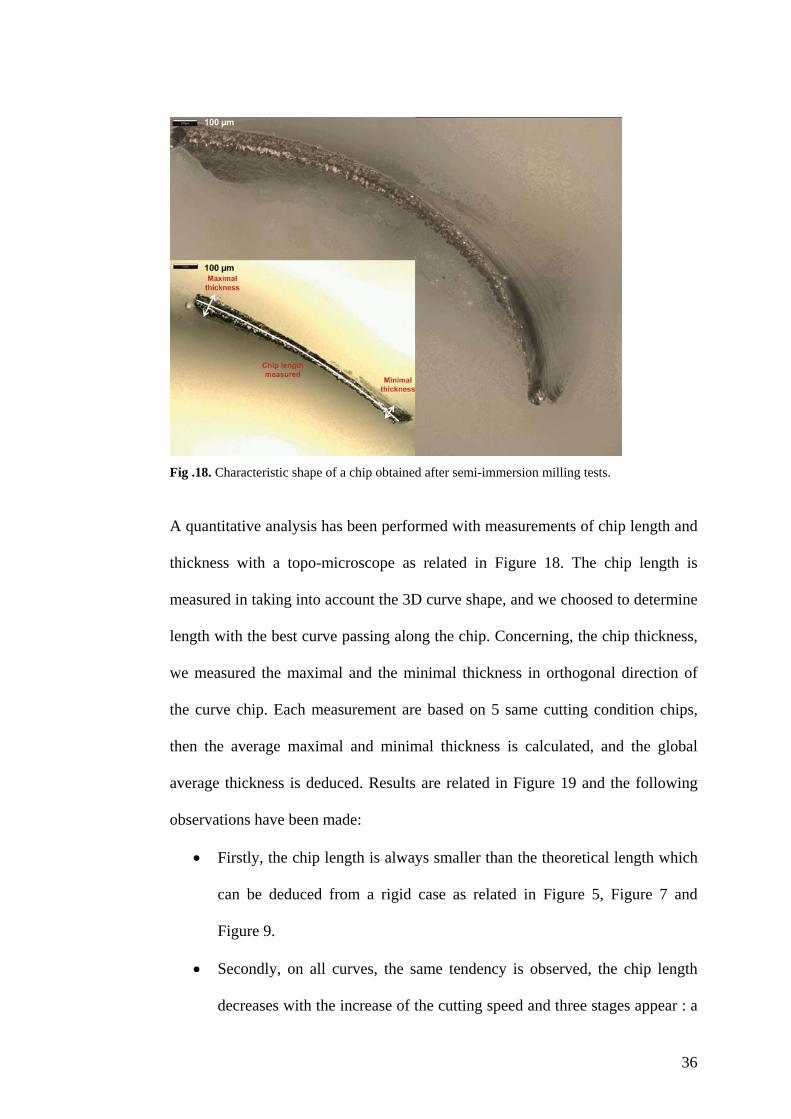
Fig .18. Characteristic shape of a chip obtained after semi-immersion milling tests.
A quantitative analysis has been performed with measurements of chip length and
thickness with a topo-microscope as related in Figure 18. The chip length is
measured in taking into account the 3D curve shape, and we choosed to determine
length with the best curve passing along the chip. Concerning, the chip thickness,
we measured the maximal and the minimal thickness in orthogonal direction of
the curve chip. Each measurement are based on 5 same cutting condition chips,
then the average maximal and minimal thickness is calculated, and the global
average thickness is deduced. Results are related in Figure 19 and the following
observations have been made:
Firstly, the chip length is always smaller than the theoretical length which
can be deduced from a rigid case as related in Figure 5, Figure 7 and
Figure 9.
Secondly, on all curves, the same tendency is observed, the chip length
decreases with the increase of the cutting speed and three stages appear : a
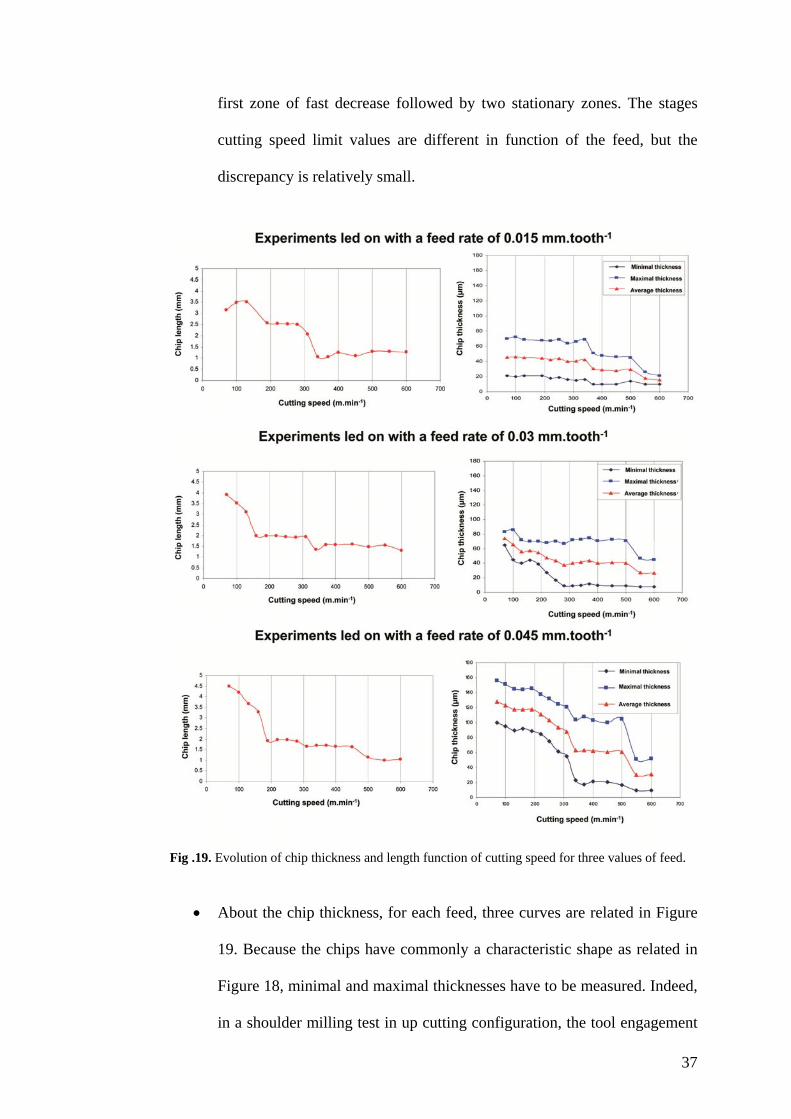
37
first zone of fast decrease followed by two stationary zones. The stages
cutting speed limit values are different in function of the feed, but the
discrepancy is relatively small.
Fig .19. Evolution of chip thickness and length function of cutting speed for three values of feed.
About the chip thickness, for each feed, three curves are related in Figure
19. Because the chips have commonly a characteristic shape as related in
Figure 18, minimal and maximal thicknesses have to be measured. Indeed,
in a shoulder milling test in up cutting configuration, the tool engagement
38
begin with a chip thickness close to 0 mm and finish with a theoretical
chip thickness equal to tf (Figure 7). The real geometry is very far of the
rigid case, because the shearing due to the cutting process induces a lot of
compression in length direction and of spreading in thickness direction.
The average thickness has been calculated and added to describe the
evolution in global way. On these curves, the same behaviour than for the
chip length is observed: a first zone of decrease followed by two stationary
zones.
It is easy to compare these results with the results obtained on machinability
curves. In both cases, three stages are observed with the same limit in terms of
cutting speed values. Moreover this analysis put in evidence a high cutting speed
zone where the chip formation seems to be characterized by low chip length and
thickness and then a high material compression occurring during chip formation.
To conclude, the milling process implies a favourable high speed machining zone
which is characterised by lower cutting forces and a different way of chip
formation. It corresponds to remarks often made in literature but it deserves to be
shown experimentally for milling [37][38].
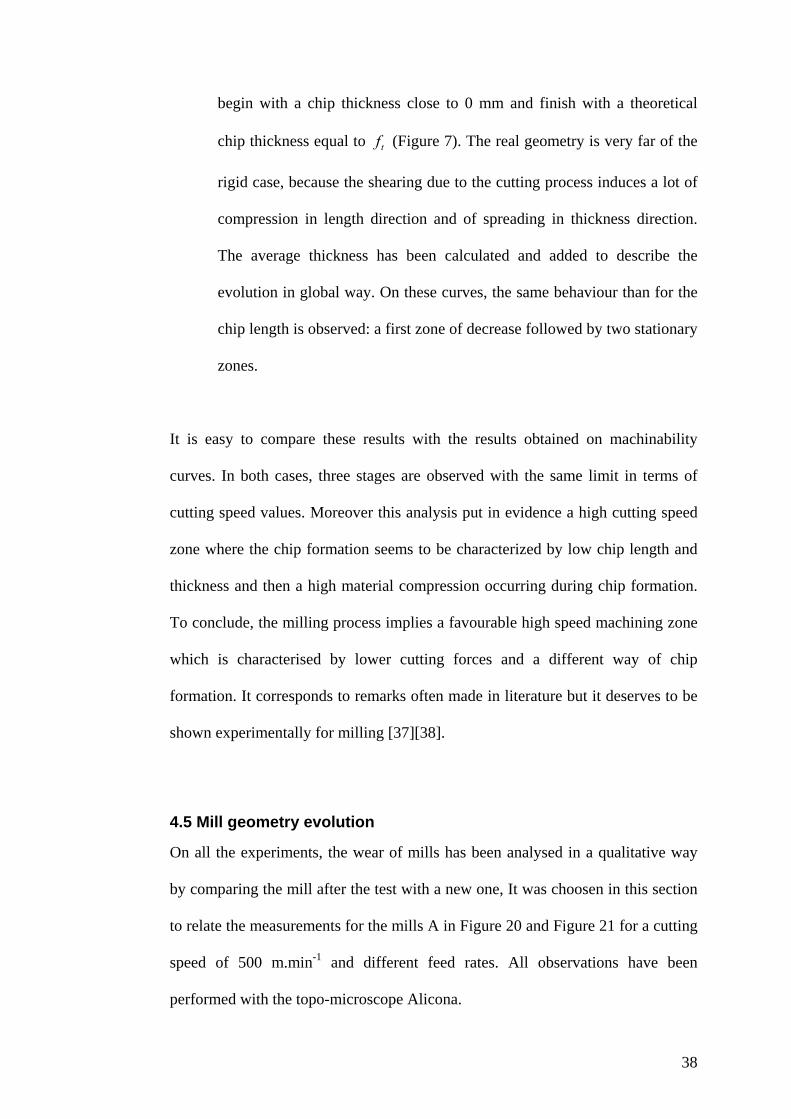
4.5 Mill geometry evolution
On all the experiments, the wear of mills has been analysed in a qualitative way
by comparing the mill after the test with a new one, It was choosen in this section
to relate the measurements for the mills A in Figure 20 and Figure 21 for a cutting
speed of 500 m.min-1 and different feed rates. All observations have been
performed with the topo-microscope Alicona.

39
Fig .20. Characteristic wear of mills for different feed rates.
The results are related in Figure 20 and the following conclusions can be done:
For low feed rates, an important abrasive wear is observed on the relief
face of the mill.
For higher feeds, abrasive wear is reduced but a radius tends to appear at
the extremity of the end mills A for high cutting speeds. Moreover, the
relief face presents an irregular wear with cracks and craters.

40
For the highest feed (i.e 0.06 mm.tooth-1) and moderate cutting speeds,
some teeth of end mills broke suddenly.
For high cutting speeds, the coating of mills is usually fast deteriorated
(abrasion and delamination).
For these experiments which induce a short machining time, the rake faces and
mill flutes do not showed a real wear. Indeed, for high cutting speeds, the
decrease of chip length tends to limit the contact between chips and mill flutes or
rake faces. In these cutting conditions, the chip seems to be ejected. That's why
during our experiments, we have observed unidirectional chip flows with a regular
rate from 500 m.min-1. Then, a more accurate analysis has been performed on
mills used for two different feeds and on a new mill for a set of experiments from
70 m.min-1 to 650 m.min-1. With the topo-microscope Alicona, the teeth of each
tool have been rebuilded in three dimensions, in order to quantify the wear
phenomena and to focus on the evolution of cutting edges geometry. Measures of
tool edge sharpness at different level on tool axis have been carried out with the
optical 3D InfiniteFocus measurement device. Figure 21 (a), (b) and (c) describe
respectively results obtained with a new mill, mills used with a feed of 0.015
mm.tooth-1 and with mills used with a feed of 0.03 mm.tooth-1. The optical
pictures of mills are proposed to locate the measurement sections along the cutting
edges. The local profiles are shown to put in evidence the real shape of cutting
edges in different places. The following results have been obtained:

41
Fig .21. Evolution of cutting edges sharpness for different feed rates.
The new mill is exposed in Figure 21 (a). Different pictures allow
verifying the tool geometry, measuring sharpness and observing the path
of diamond grinding wheel due to the tool manufacturing process. The
perfect reliability of cutting edge is put in evidence. On the other hand,
sharpness of cutting edge has shown interesting results. Three
measurement zones are appeared during analysis. The mill, between a
height of 0 mm and 0.5 mm along the tool axis, has a cutting edge
sharpness equal approximately to 12 µm. Then between a height of 0.5
mm and 1 mm, a linear evolution of sharpness is observed between the
two values 12 µm and 34 µm. For a height superior to 1 mm the sharpness
has a constant value equal approximately to 39 µm. So, the sharpness is
low on a small zone of the tool and becomes quickly higher. The cutting
edge is far away of the perfect sharpness classically used in analytical
models. But these measures are very useful for finite element modelling,
because for a suitable monitoring of the contact mechanisms, the perfect

42
sharp edges are very harmful. Introduction of this radius in tool mesh is
very important to perform milling process simulations [20].
Results obtained with mills used for milling operation with a feed of 0.015
mm.tooth-1 are related in Figure 21 (b). The picture put in evidence the
abrasive wear on the relief face of the tool. The sharpness measures have
been led on the cutting edge zone engaged in matter (height between 0 mm
and 1 mm along tool axis). Results indicate that the wear at the tool
extremity is very important. In this zone, mill has lost 10 µm of sharpness.
In the other hand, low feeds seem to create less wear in height between 0.5
mm and 1 mm where sharpness is about 27 µm in low zone and 32 µm in
high zone. Moreover low feeds seem to create a very important abrasive
wear on the relief face of the tool. The influence of high cutting speed
appeared only on abrasive wear of the relief face in this case.
Results obtained with mills used for milling operations with a feed of 0.03
mm.tooth-1 are related in Figure 21 (c). Measurements show a severe wear
of the cutting edge. The wear seems to be more critical due to the high
value of feed particularly when high cutting speeds are reached. At the
extremity of the tool, sharpness of 49 µm has been measured and in this
zone the cutting edge is chamfered by wear.
Some cracks and craters are generated during machining on the relief face
at tool extremity and this phenomenon becomes very important for high
cutting speeds. Then cutting edge has a sharpness of 45 µm, but at a height
near to 1 mm the value is about 38 µm and in this zone the wear seems to
be still restrained. From these measurements no significant wear is
observed on the rake face of the tool, even for high cutting speeds.

43
These analyses put in evidence different wear phenomena and allow quantifying
the quick reduction of the cutting edges sharpness in many feeds and for the high
speed machining zone. Results have shown that dominant wear phenomena
depend to feeds and cutting speeds values. These investigations can provide a
relevant sharpness value to finite element or analytical model developers.
Fig .22. Representative machinability of the tested 304L stainless steel in milling (feed rate 0.045 mm.tooth-1, end mill A 2 teeth micro grain tungsten carbide, diameter 6 mm, da 1 mm, dr 3 mm) .
5 Conclusions
These works furnish a wide experimental basis in milling and high speed milling
of a 304L stainless steel. These data are proposed to help engineers and
researchers to understand the milling process specificities and key points, but also
to develop or to improve modelling of machining. A wide range of experiments
has been performed with a large panel of cutting conditions, tool geometries or
cutting configurations in slotting and shouldering. The set up acquisition system
allows obtaining a good accuracy and repeatability on cutting forces curves. These
milling curves are used as main data to analyse the cutting edges engagement in
machined material, the appearing of dynamic effects with the increase of cutting
speed, the influence of tool run-out and to identify proper cutting conditions in
44
terms of cutting speed and feed rate. These results were also used for our parallel
works on numerical simulation [20] or identification [31]. The cutting forces data
are completed with information about chips morphology and tools wear.
The experiments led on with mills A and B for different cutting speeds and feeds
have furnished a very important experimental database, and all available data has
been analysed in order to put in evidence the physical phenomena induced by
milling operations. The analysis of cutting forces curves for many cutting speeds
has shown that dynamic phenomena appear during machining particularly in
shoulder milling configuration. With these dynamic effects, the measured cutting
forces curves are far away from the curves obtained analytically in a rigid case or
for low cutting speeds. Until now modelling of milling from analytical or finite
element models used the assumption of undeformable tools. But this assumption
limits drastically the model predictivity until the low conventional cutting speeds
are overpassed. The machinability of the 304L stainless steel with different tools
geometries and configurations in shoulder milling is defined by three working
zones: a conventional zone permitting stable cutting (low cutting speed; under
200-250 m.min-1), a dead zone (unfavourable for cutting forces level and cutting
stability; between 250 and 450 m.min-1), and a high speed machining zone (high
cutting speed; up to 450-500 m.min-1). All the used criteria (cutting forces, chips,
wear) confirm the existence of these different zones and a correlation is proposed
with cutting perturbations as run-out, cutting instability, ploughing and abrasive
wear.
Then the tool run-out influence has been described and measured for many
experiments. With increase of cutting speed, tool run-out accentuates vibrations
and unbalances cutting forces repartition and wear between the teeth. The analysis
led on tool wear has permitted to set up a methodology to measure cutting edges
45
sharpness on mills in order to introduce a real description of the tool geometry in
finite element or analytical modelling. All this conclusions are useful to improve
models predictivity and to extend modelling to high speed machining zone. These
results confirm the assumption of the changing of thermo-mechanical conditions
from the cutting speed equal approximately to 450 m.min-1. It underlines the
difficulty to choose and identify a constitutive law to describe the material
behaviour, because high strain rate and high temperatures corresponding to the
high speed zone are non accessible with classic mechanical tests.
In this context, the choice of cutting coefficients or laws used to model
empirically the milling process needs to consider a tight panel of cutting
conditions to stay representative. In the same way predictive modelling of
machining needs to use constitutive laws to describe material behaviour and
friction conditions, so the huge variations in the process response are a limitation.
For example, in our modelling works a Johnson & Cook constitutive law was
tested and permitted to obtain very good results in the first zone (low to medium
cutting speeds). In the other working zones, this law is not really efficient,
especially when the strain rate and temperature influences for our stainless steel
are identified on classical mechanical test. We have the same considerations when
friction is considered through a constant coefficient. So it is necessary to find an
appropriate constitutive law relevant on a wide range of thermo-mechanical
solicitations. In the same way, the friction conditions and their modelling at the
tool chip interface have to be analysed further. Moreover classical mechanical
characterisation tests are inefficient for extreme strain rates coupling to high
temperatures. As a first step, the development of constitutive laws and
identification by inverse method using measured data obtained directly from
milling tests (as cutting forces curves) seems to be an interesting way to improve

46
milling models as demonstrated in previous work (Maurel-Pantel et al., 2008)
[31]. In analytical or finite element models developed by our team and using rigid
tool assumption have shown their limits to reproduce the cutting forces curves
measured at high cutting speeds. In machining models actually, the dynamics and
thermo-mechanical coupling introduced by high cutting speed are not taken into
account. These detailed experimental data in milling constitute a suitable
experimental basis available to develop predictive machining modelling. Now the
characterisation of cutting dynamics become a major experimental challenge in
high speed milling or in micro milling. And It becomes also a challenge in
modelling to develop predictive analytical of finite element models at high cutting
speeds in milling.
Acknowledgements
The CETIM foundation is greatly acknowledged for providing the PhD grant support to Dr A. Maurel-Pantel in the PGV project. These works were carried out in the context of the working group Manufacturing 21 which including 18 French laboratories. Targeted issues are the modelling and the optimization of manufacturing processes and the innovation in the field of mechanical manufacturing. Thanks to F. Gaillard from DIAGER Industry® for his help in choosing and obtaining tools. References 1. Merchant M (1945) Mechanics of the metal cutting process, i. orthogonal cutting, Journal of Applied Physics 16:267-275. 2. Oxley P (1963) Mechanics of metal cutting. ASME 50-60. 3. Ceretti E, Fallbohmer P, Wu W, Altan T (1996) Application of 2D FEM to chip formation in orthogonal cutting. Journals of Materials Processing Technology 59:169-180. 4. Baker M (2005) Finite element investigation of the flow stress dependence of chip formation. Journals of Materials Processing Technology 167:1-13. 5. Kline WA, DeVor RE, Lindberg JR (1982) The prediction of cutting forces in end milling with application to cornering cuts. International Journal of Machine Tool Design and Research 22-1:7-22. 6. Yellowley I (1985) Observations of the mean values of forces, torque and specific power in peripheral milling process. International Journal of Machine Tool Design and Research 25(4):337-346 7. Yang M, Park H (1991) The prediction of cutting force in ball-end milling. International Journal of Machine Tools and Manufacture 31(1):45-54.

47
8. Altintas Y, Lee P (1996) A general mechanics and dynamics model for helical end mills. CIRP Annals – Manufacturing Technology 1: 59-64 9. Engin S, Altintas Y (2001) Mechanics and dynamics of general milling cutters. Part I: helical end mills. International Journal of Machine Tools and Manufacture 44:2195-2212. 10. Engin S, Altintas Y (2001) Mechanics and dynamics of general milling cutters. Part II: inserted cutters. International Journal of Machine Tools and Manufacture 41:2213-2231. 11. Zhu R, Kapoor SG, DeVor RE (2001) Mechanistic modelling of the ball end milling process for multi-axis machining of free-form surfaces. Transactions of ASME, Journal of Manufacturing Science and Engineering 123:369-379. 12. Fontaine M, Devillez A, Moufki A, Dudzinski D (2006) Predictive force model for ball end milling and experimental validation with a wavelike form machining test. International Journal of Machine Tools and Manufacture 46:367-380. 13. Molinari A, Dudzinski D (1992) Stationnary shear band in high speed machining. C.R. Académie des Sciences de Paris 315:399-405. 14. Dudzinski D, Molinari A (1997) A modelling of cutting for viscoplastic materials. International Journal of Mechanical Science 39:369-389. 15. Moufki A, Devillez A, Dudzinski D, Molinari A (2004) Thermomechanical modelling of oblique cutting and experimental validation. International Journal of Machine Tools & Manufacture 44(9):971-989. 16. Zeroudi N, Fontaine M, Necib K (2010) Prediction of cutting forces in 3-axes milling of sculptured surfaces directly from CAM tool path. Journal of Intelligent Manufacturing, 15:1-15. 17. Zeroudi N, Fontaine M (2012) Prediction of machined surface geometry based on analytical modelling of ball-end milling. Procedia CIRP 1:108-113. 18. Shao H, Liu L, Qu HL (2007) Machinability study on 3%Co-12%Cr stainless steel in milling. Wear 263:736-744. 19. D’Errico GE, Bugliosi S, Guglielmi E (1998) Tool-life reliability of cermet inserts in milling tests. International Journal of Materials Processing Technology 77:337-343. 20. Maurel-Pantel A, Fontaine M, Thibaud S, Gelin JC (2012). 3D FEM simulations of shoulder milling operations on a 304L stainless steel. Simulation Modelling Practice and Theory 22:13-27. 21. Tekiner Z, Yesilyurt S (2004) Investigation of the cutting parameters depending on process sound during turning of AISI 304 austenitic stainless steel. Materials and Design 25:507-513. 22. O’Sullivan D, Cotterell M (2002) Machinability of austenitic stainless steel SS303. International Journal of Materials Processing Technology 124:153-159. 23. Salak A, Vasilko K, Selecka M, Danninger H (2006) New short time face turning method for testing the machinability of PM steels. International Journal of Materials Processing Technology 176:62-69. 24. Senthil Kumar A, Raja Durai A, Sornakumar T (2006) The effect of tool wear on tool life of alumina-based ceramic cutting tools while machining hardened martensistic stainless steel. International Journal of Materials Processing Technology 173:151-156. 25. Akasawa T, Sakurai H, Nakamura M, Tanaka T, Takano K (2003) Effects of free cutting additives on the machinability of austenetic stainless steels. International. Journal of Materials Processing Technology 143-144:66-71.

48
26. Valiorgue F, Rech J, Hamdi H, Bonnet C, Gilles P, Bergheau JM (2008) Modelling of friction phenomena in material removal processes. International Journal of Materials Processing Technology 201:450-453. 27. Valiorgue F, Rech J, Hamdi H, Gilles P, Bergheau JM (2012) 3D modeling of residual stresses induced in finish turning of an AISI304L stainless steel, International Journal of Materials Processing Technology 53:77-90. 28. Bonnet C, Valiorgue F, Rech J, Claudin C, Hamdi H, Bergheau JM, Gilles P (2008) Identification of a friction model-Application to the context of dry cutting of an AISI 316L austenetic stainless steel with a TiN coated carbide tool. International Journal of Machine Tools and Manufacture 48:1211-1223. 29. Johnson GR, Cook JR (1983) Constitutive model and data for metals subjected to large strains, high strain rates, and high temperatures. Proceedings of 7th Symposium On Ballistics, Netherlands. 30. Maurel-Pantel A, Michel G, Thibaud S, Fontaine M, Gelin JC (2008) 3D FEM simulations of milling on a 304L stainless steel. Steel Research International 79(2):726-733. 31. Maurel A, Fontaine M, Thibaud S, Michel G, Gelin, JC (2008) Inverse Method for Identification of Material Parameters Directly from Milling Experiments. International Journal of Material Forming 1:1435-1438. 32. Fontaine M, Devillez A, Dudzinski D (2007) Parametric geometry for modelling of milling operations. International Journal of Machining and Machinability of Materials 2:186-205. 33. More AS, Jiang W, Brown WD, Malshe AP (2006) Tool wear and machining performance of cBN–TiN coated carbide inserts and PCBN compact inserts in turning AISI 4340 hardened steel Journal of Materials Processing Technology 180(1–3):253–262. 34. Chandrasekaran H, Johansson JO (1994) Chip Flow and Notch Wear Mechanisms during the Machining of High Austenitic Stainless Steels CIRP Annals - Manufacturing Technology Volume 43(1):101–105. 35. Gilbin A, Fontaine M, Michel G, Thibaud S, Picard P (2013) Capability of tungsten carbide micro-mills to machine hardened tool steel International Journal of Precision Engineering and Manufacturing 14(1):23-28. 36. Fontaine M, Moufki A, Devillez A, Dudzinski D (2007) Modelling of cutting forces in ball-end milling with tool-surface inclination. Part II: Influence of cutting conditions, run-out, ploughning and inclination angle. Journal of Materials Processing Technology 189:85-96. 37. Abukhshim NA, Mativenga PT, Sheikh MA (2006) Heat generation and temperature prediction in metal cutting: A review and implications for high speed machining International Journal of Machine Tools and Manufacture 46(7–8):782–800 38. Abou-El-Hossein KA, Yahya Z (2005) High-speed end-milling of AISI 304 stainless steels using new geometrically developed carbide inserts Journal of Materials Processing Technology 162–163:596–602.