experimental investigation on the strength, deformability
TRANSCRIPT

ORIGINAL PAPER
Experimental Investigation on the Strength, Deformability,Failure Behavior and Acoustic Emission Locations of RedSandstone Under Triaxial Compression
Sheng-Qi Yang • Hong-Wen Jing • Shan-Yong Wang
Received: 1 June 2011 / Accepted: 18 November 2011
� Springer-Verlag 2012
Abstract Conventional triaxial compression and ‘‘reduc-
ing confining pressure’’ experiments were carried out for red
sandstone by an MTS815 Flex Test GT rock mechanics
experimental system. Our results show that the post-peak
axial deformation characteristics of red sandstone changed
as the confining pressure was increased from 5 to 65 MPa.
Young’s modulus of red sandstone increased nonlinearly
with increasing confining pressure, but Poisson’s ratio
remained unaffected. Using our new data, the compactive
and dilatant behavior, strength and failure characteristics of
sandstone under triaxial compression are further discussed.
For our data, the nonlinear Hoek-Brown criterion better
reflects the peak strength properties than the linear Mohr-
Coulomb criterion. However, the residual strength shows a
clear linear relationship with confining pressure, which can
be best described using the linear Mohr-Coulomb criterion.
The peak and residual strengths were not directly related to
the two different loading paths. The onset of dilatancy (C0),the switch from compaction-dominated to dilatant-domi-
nated behavior (D0) and the stress at zero volumetric strain all
increased linearly with the confining pressure. In our con-
ventional triaxial compression experiments, the failure mode
changed from mixed tension and shear fracture (single shear
fracture) to shear fracture with double slippage planes with
increasing confining pressure. However, the failure mode in
our ‘‘reducing confining pressure’’ experiments was more
complicated and results mainly from the unstable failure
characteristics of the rock during the reduction in confining
pressure. Finally, based on our acoustic emission (AE)
locations, at a confining pressure of 35 MPa, a detailed
analysis of the evolutionary process of internal cracks is
presented for the entire loading process.
Keywords Red sandstone � Triaxial compression �Strength � Deformation behavior � Failure characteristics �AE locations
1 Introduction
Sandstone is a sedimentary rock that is widely used in rock
engineering (such as underground engineering, dam base
rock engineering and high slope rock engineering, etc.).
Furthermore, knowledge of the mechanical behavior of
sandstone is important in geotechnical engineering (e.g.,
the design of waste repositories) and in petroleum geosci-
ence (e.g., the prediction of reservoir deformation and fluid
flow). For this reason, in the last few decades, many
experimental studies have investigated the mechanical
behavior of sandstone, including its strength, deformation
behavior, failure characteristics and time-dependent
behavior (Wong et al. 1997; Baud et al. 2000; Wu et al.
2000; Klein et al. 2001; Jeng et al. 2002; Besuelle et al.
2003; Fortin et al. 2006; Tembe et al. 2008; Tsai et al.
2008; Zorlu et al. 2008; Heap et al. 2009a, b; Tavallali and
Vervoort 2010; Huang et al. 2010; Yang and Jiang 2010;
Yang and Jing 2011; Yang et al. 2011).
Uniaxial compression and uniaxial tension tests (or
Brazilian tests) are conventional methods that are often
S.-Q. Yang (&) � H.-W. Jing
State Key Laboratory for Geomechanics and Deep Underground
Engineering, School of Mechanics and Civil Engineering,
China University of Mining and Technology, 221008 Xuzhou,
People’s Republic of China
e-mail: [email protected]
S.-Y. Wang
Center for Geotechnical and Materials Modelling,
The University of Newcastle, University Drive,
Callaghan, NSW 2238, Australia
123
Rock Mech Rock Eng
DOI 10.1007/s00603-011-0208-8

used to investigate the strength, deformation behavior and
failure characteristics of materials, including rocks.
Sandstones, due to the nature of their formation, can be
inherently anisotropic (Benson et al. 2005). Al-Harthi
(1998) investigated the effect of anisotropy on the uni-
axial compressive strength (UCS) of Ranyah sandstone
(Saudi Arabia) and found that the strength varied tre-
mendously with orientation (a maximum UCS of
225 MPa and a minimum of 125 MPa). A W-shaped
strength anisotropy curve was obtained as a result of
plotting the UCS values against the angle between the
loading direction and the bedding. Tavallali and Vervoort
(2010) conducted indirect uniaxial tension tests on a
layered sandstone. They showed that the variation in
tensile strength and the failure mode are both a function
of the inclination angle between the layer plane and the
loading direction. Dynamic cyclic stressing can lead to
the degradation of rock physical properties. Heap et al.
(2010) performed increasing-amplitude, cyclic-stressing
experiments on both Bentheim and Darley Dale sand-
stone. They found that there is a gradual deterioration in
static elastic moduli after each increasing-amplitude
cycle. Bagde and Petros (2005) also performed dynamic
uniaxial compressive cyclic-stressing experiments on
sandstone. Their experimental results showed that the
fatigue strength of their sandstone decreased with loading
frequency. Nespereira et al. (2010) carried out petro-
graphic analyses and UCS tests on Salamanca sandstone.
They showed that the correlation factor between the
mechanical behavior and the petrographic parameters
revealed that the cement content is not the only factor
governing the UCS, and the composition of the cement
may play an important role in the UCS of clay-bearing
sandstones. Due to the difficulty of direct tensile testing,
Lin et al. (2009) conducted several three-point bending
tests on Berea sandstone to study fracture initiation and
the associated damage zone by using 2D acoustic emis-
sion (AE) locations and electronic speckle pattern inter-
ferometry (ESPI). Their experiments indicated that
specimen failure was initiated by a large fracture with a
localized damage zone.
However, deep underground engineering rock masses,
for example, are usually located within triaxial stress state
conditions; therefore, it is more relevant to investigate the
mechanical characteristics of sandstone under triaxial
compression. Wong et al. (1997) studied the transition
from brittle faulting and cataclastic flow in six different
sandstones. At low confining pressures, shear-induced
dilation and brittle faulting were observed. However, at
higher confining pressures, shear-enhanced compaction and
cataclastic flow were observed. Baud et al. (2000) inves-
tigated water-weakening in the cataclastic flow regime on
Berea, Boise, Darley Dale and Gosford sandstones. They
found that the presence of water reduced the strength of the
sandstones and altered the failure mode at elevated pres-
sures. Heap et al. (2009a) studied time-dependent brittle
deformation in Darley Dale sandstone and found that the
rate of creep deformation during constant stress experi-
ments was heavily dependent on the applied differential
stress. In a later study, Heap et al. (2009b) showed that an
increase in temperature from 20 to 75�C increased the rate
of creep deformation by up to three orders of magnitude in
Darley Dale, Crab Orchard and Bentheim sandstone.
Besuelle et al. (2000) conducted triaxial compression
experiments on Vosges sandstone with two slenderness
ratios and observed a strong positive dilatancy at lower
confining pressures, which decreased and became negative
at higher confining pressures. Furthermore, they also ana-
lyzed the shear band using X-ray computerized tomogra-
phy (CT) and scanning electron microscopy (SEM). Feng
et al. (2004) studied the damage evolution of sandstone
under triaxial compression with chemical corrosion using
real-time X-ray CT. They surmised that the CT value is the
most important parameter describing the damage evolution
process of rock.
AE counts are transient elastic waves generated by the
rapid release of energy within a material, such as the strain
energy released during microcrack propagation. Monitor-
ing AE during deformation has become an increasingly
important diagnostic tool in material science and has pro-
vided a wealth of information regarding the failure process
in brittle materials (e.g., Lockner et al. 1991; Benson et al.
2007; Fortin et al. 2009; Brantut et al. 2011); it can be used
in failure forecasting modeling (e.g., Bell et al. 2011a, b).
For instance, Baud et al. (2004) investigated the phenom-
enon of compaction localization and mechanical defor-
mation of porous sandstone with real-time damage
evolution using AE activity. Townend et al. (2008) studied
the formation of compaction bands in Diemelstadt sand-
stone using 3D AE locations recorded by a Hyperion Giga-
RAM recorder. Their results demonstrated that compaction
bands nucleate at the specimen edge and propagate across
the specimen at a rate of 0.08 mm/s. Fortin et al. (2009)
investigated shear localization, compaction localization
and cataclastic compaction in Bleurswiller sandstone using
3D AE locations. They found that compaction localization
and cataclastic compaction generate similar AE signatures
to shear localization.
Up to now, most triaxial experiments on sandstone
have been performed using the axial displacement rate as
the controlling feedback signal. However, since specimen
failure in the brittle regime is often very rapid under this
mode of control, it is often difficult to obtain reliable
post-peak deformation data. In this study, we will attempt
to improve our knowledge of post-peak behavior in
sandstone using the circumferential displacement rate as
S.-Q. Yang et al.
123

the controlling feedback mechanism. Further, in previous
experimental research on sandstone, the effect of the
loading path on the strength, failure behavior, crack ini-
tiation threshold, crack damage threshold and 3D damage
evolution process under triaxial compression are less
discussed. To this end, we have performed triaxial
experiments on sandstone under two loading paths [i.e.,
conventional triaxial compression experiments and
‘‘reducing confining pressure’’ experiments (to be descri-
bed in detail in the next section)] using the circumfer-
ential displacement rate as the controlling feedback
mechanism. Our research investigates the influence of
confining pressure on the deformation parameters of
sandstone (in particular, volumetric contraction and
dilatancy parameters) to construct a relationship between
confining pressure and strength parameters (including
peak and residual strength, crack initiation threshold,
crack damage threshold and the stress at zero volumetric
strain) of sandstone. We also analyze the evolution of
damage in our sandstone specimens using the spatial and
temporal distribution of AE counts.
2 Experimental Material and Testing Procedures
2.1 Experimental Material
The material used throughout this study was red sandstone
(collected from the Shandong province of China). Red
sandstone (Fig. 1) is a fine- to medium-grained, feld-
spathic sandstone with a connected porosity of 8.8% and a
bulk density of 2,360 kg/m3. The modal composition is
45% feldspar (with a grain radius of 0.15–0.25 mm),
13.5% quartz (with a grain radius of 0.2–0.3 mm), 31.5%
debris (with a grain radius of 0.25–0.4 mm) and 10%
agglutinate (which consisted of gypsum, barite and iron
integument).
2.2 Testing Equipment
All experiments were performed in an MTS815 Flex Test
GT triaxial rock mechanics experimental system (Fig. 2).
The maximum loading capacity of the servo-controlled
system is 4,700 kN, and the maximum confining pressure
is 140 MPa. During experimentation, we measured the
axial force (using a load cell with a loading capacity of
2,600 kN) and the axial deformation with an axial Linear
Variable Differential Transducer (LVDT) with a range of
5 mm (Fig. 2). The circumferential deformation was
measured using an LVDT attached to a chain wrapped
tightly around the specimen (Fig. 2), for which the maxi-
mum displacement capacity was 8 mm. To eliminate the
end friction effects (see Mogi 1966; Hawkes and Mellor
1970), the axial and circumferential LVDT were located in
the central part of the specimen (Fig. 2).
2.3 Testing Procedure
In this study, we performed a series of triaxial compression
experiments using a circumferential displacement rate of
0.06 mm/min. To reiterate, we used the circumferential
displacement as the controlling feedback signal (see also
Amann et al. 2011; Youn and Tonon 2010) rather than the
axial displacement feedback commonly used in rock
deformation experiments (see Paterson and Wong 2005).
For the purpose of this study, we performed two types of
triaxial test: (1) conventional triaxial experiments and (2)
‘‘reducing confining pressure’’ experiments.
The conventional triaxial experiments (Fig. 3a) were
carried out under different confining pressures of 5, 20, 35,
(a) Optical microscopy (×40) (b) SEM (×100)
Fig. 1 Optical microscopy and SEM photomicrographs of red sandstone
Experimental Investigation on the Strength, Deformability
123

50 and 65 MPa, and consisted of the following two steps.
Firstly, the confining pressure was increased to the desired
value at a constant rate of 0.1 MPa/s [to ensure that the
specimen was under uniform hydrostatic stresses (oa)].
Finally, the deviatoric stress (ab ? bc) was applied to the
surface of the specimen at a constant circumferential dis-
placement rate of 0.06 mm/min until failure.
Our ‘‘reducing confining pressure’’ experiments
(Fig. 3b) were conducted using the following three steps.
First, the hydrostatic pressure was applied to the specimen
at a rate of 0.1 MPa/s until the desired value was reached
(oa). The deviatoric stress was applied up to a pre-deter-
mined level [either 70 or 90% of the triaxial compressive
strength (TCS) determined from our conventional triaxial
tests] at a constant circumferential displacement control
rate of 0.06 mm/min (ad). Finally, the major principal
stress (r1) was kept constant, but the confining pressure
was reduced at a rate of 0.1 MPa/s until the specimen
failure occurred (de ? ef).
All triaxial experiments were carried out on cylindrical
specimens 50 mm in diameter and 100 mm in length in
accordance with the ISRM standard (Fairhurst and Hudson
1999). The specimens were all cored from the same large
rectangular block and in the same orientation. All the
experiments were performed on dry specimens at room
temperature.
2.4 AE Measuring Procedure
As is well known, the AE technique is predominantly
related to the release of elastic energy within rock mate-
rials. AE hits and/or energy often monitored to detect the
onset (termed C0, see Wong et al. 1997) and the evolution
of microcracking, and to analyze the spatial and temporal
Axial LVDT
Circumferential LVDT
MTS815 Flex Test GT
Fig. 2 MTS815 Flex Test GT triaxial rock mechanics experimental system and strain measurement
0
1
2= 3
o0
a
1S
o
b
c
Conventional triaxial experiment
2= 3
1
1
2
2
3
31
1
2
2
3
3
Reducing confining pressure experiment
a
de
f
(a) (b)
70%-90% TCS
Fig. 3 The two different loading paths used in this study, presented in the principal stress space (r3, r1). Conventional triaxial experiment:
oa ? ab ? bc; ‘‘reducing confining pressure experiment’’: oa ? ad ? de ? ef
S.-Q. Yang et al.
123

progression of internal cracks (e.g., Lockner et al. 1991).
In this study, the output of AE was recorded by a PCI-2
AE 3D measuring system made by Physical Acoustic
Corp. (PAC) using eight AE sensors with a frequency of
6 kHz. The amplitude threshold of the sensors was set to
33 dB.
3 Triaxial Experimental Results of Red Sandstone
3.1 Deformation Behavior Under Conventional
Triaxial Compression
The triaxial stress-strain curves for red sandstone under a
variety of confining pressures are presented in Figs. 4 and
5. The synopsis plots of Fig. 5 demonstrate that an increase
in confining pressure served to increase the strength (in a
similar manner as observed previously, see Heap et al.
2009a). In all cases, even at the highest confining pressure
of 65 MPa, the failure mode remained brittle (i.e., the
ability of the rock to resist load decreases with permanent
strain, see Rutter 1986). However, there is an observable
change in the post-peak behavior with increasing confining
pressure. Post-peak behavior switched from class I (the
slope of the post-peak stress-strain curve is negative, see
Wawersik and Fairhurst 1970) at a confining pressure of
5 MPa to class II (where the slope is positive) at confining
pressures above 5 MPa. Further, there was a gradual
increase in strain-softening behavior, and the magnitude of
the stress drop was reduced with increasing confining
pressure. The influence of confining pressure on the
deformation parameters is described in more detail in Sect.
3.3.
The stress-strain curve at 5 MPa (Fig. 4a) shows ini-
tially a non-linear (concave) deformation, usually attrib-
uted to the closure of pre-existing microcracks. Our data
suggest that this stage of microcrack closure was dependent
on the confining pressure. At lower confining pressures
(e.g., Fig. 4a, b), the stage of microcrack closure was more
distinct than at higher confining pressures (e.g., Fig. 4d, e).
This is likely to be a result of the confining pressure acting
to close the pre-existing microcracks prior to the start of
deformation. Following the period of microcrack closure
(if present) the specimens deformed elastically (the
pseudo-linear portions of the stress-strain curves). The
departure from pseudo-linear behavior marked the yield
point of the specimens and where they entered a phase of
strain hardening. Once the peak stress was reached there
was a stage of strain softening (that increased with
increasing confining pressure); finally, the specimens
failed.
The evolution of the volumetric strain during a typical
experiment is shown in Fig. 4f. The volumetric strain was
characterized by an initial phase of compaction-dominated
behavior followed by a phase of dilatancy-dominated
behavior. The onset of dilatancy can be identified as the
stress where the volumetric strain departed from pseudo-
linear elastic behavior (this is commonly referred to as C0,see Wong et al. 1997). After point A, compaction was in
direct competition with dilatancy (although the specimen
was still in net compaction). Eventually, the rate of com-
paction and dilatancy became equal, resulting in an
inflection point in the volumetric strain curve (this is
commonly referred to as D0, see Heap et al. 2009a). This is
marked as point B on Fig. 4f and marks the point where the
deformation of the specimen switched from compaction-
dominated to dilatancy-dominated. As the stress was
increased further, more and more microcracking occurred,
and the specimen continued to dilate. The volumetric strain
eventually passed back through zero strain (rv0) before it
continued to increase until specimen failure. Table 1 lists
the axial and circumferential strain of red sandstone at C0,D0 and the stress at zero volumetric strain under conven-
tional triaxial compression.
To investigate the reproducibility of our experimental
setup and our experimental material, we performed a new
experiment at a confining pressure of 35 MPa. Figure 4c
shows the axial stress-strain curves for two red sandstone
specimens, RS-a03# and RS-a07# (after the peak stress,
specimen RS-a07# was unloaded at point F). The stress-
strain curves and the peak stress were nearly identical,
adding to the veracity of our data set.
Figure 6 shows the influence of confining pressure
(Fig. 6a) and specimen variability (Fig. 6b) on the rela-
tionship between the circumferential strain and the axial
strain of red sandstone prior to the peak stress. Firstly, it
can be seen that the circumferential strain increased non-
linearly with the axial strain. At lower stress levels, the
circumferential strain increased slowly with the axial
strain, but at higher stress levels, the rate of circumferential
strain was higher than that of axial strain. The confining
pressure and specimen variability had no obvious influence
on the relationship between the circumferential strain and
the axial strain at the lower stress levels. However, at
higher stress levels, the rate of circumferential strain with
axial strain was smaller at higher confining pressures
(Fig. 6a). This suggests that higher confining pressures
suppressed the circumferential deformation of the speci-
mens. We observed only a small deviation in the circum-
ferential-axial strain curves for two specimens deformed
under the same pressure conditions (Fig. 6b), again adding
to the veracity of our data set.
Figure 6 also indicates that Poisson’s ratio was not a
constant and that it changed with the axial deviatoric
stress. Thus, it was more difficult to determine Poisson’s
ratio because of obvious nonlinearity between the
Experimental Investigation on the Strength, Deformability
123

circumferential strain and the axial strain, even though it
was observed during elastic deformation. Therefore, in this
study, we calculated Poisson’s ratio using the following
method. We used the average of the absolute value of the
ratio of circumferential strain and axial strain in the range
of axial differential stress from 30% to 70% TCS, as shown
0
30
60
90
120
-25 -20 -15 -10 -5 0 50
30
60
90
120
150
180
-20 -15 -10 -5 0 5 10 15
ε1 / 10-3ε3 / 10-3
σ1-σ3 / MPa
ε1 / 10-3 ε3 / 10-3
σ1-σ3 / MPa
ε1
ε3
εv
ε1ε3
εv
(a) σ3 =5 MPa (b) σ3 =20 MPa
0
50
100
150
200
250
-20 -15 -10 -5 0 5 10 150
50
100
150
200
250
300
-20 -15 -10 -5 0 5 10 15
ε1 / 10-3ε3 / 10-3
/ MPa
ε1ε3εv
ε1 / 10-3 ε3 / 10-3
/ MPa
ε1
ε3
εv
(c) σ3 (d)aPM53= σ3 =50 MPa
RS-a07#
RS-a03#
ε1ε3
εv
F
0
50
100
150
200
250
300
-35 -30 -25 -20 -15 -10 -5 0 5 10 15
ε1 / 10-3ε3 / 10-3
/ MPa
ε1ε3
εv
(e) σ3 =65 MPa
0
50
100
150
200
250
-2.0 -1.0 0.0 1.0 2.0 3.0
εv / 10-3
(f)
D’
C’ Compaction
Dilatancy
σ
σ
1-σ3σ1-σ3
σ1-σ3σ1-σ3
/ MPa
A
B
Cv0
Fig. 4 Stress-strain curves for red sandstone from conventional
triaxial compression experiments. e1 and e3 represent the axial and
circumferential strain, respectively. ev refers to the volumetric strain,
which is calculated from the sum of the axial strain and twice the
circumferential strain (i.e., ev = e1 ? 2e3)
S.-Q. Yang et al.
123

in Table 2, which lists Young’s modulus, Poisson’s ratio
and the peak strain of red sandstone from our conventional
triaxial compression experiments. ES and E50 represent the
elastic modulus and the deformation modulus of the
sandstone (Yang and Jiang 2010), respectively. t represents
Poisson’s ratio of rock. e1c, e3c and evc are respectively
defined as the axial, circumferential and volumetric strain
values at the peak stress.
0
50
100
150
200
250
300
0 3 6 9 12 150
50
100
150
200
250
300
-30-25-20-15-10-50
σ3=65MPa
50MPa
35MPa
σσ
1-3
σσ
1-3 /
MP
a
ε1 / 10-3
20MPa 5MPa
σ3=65MPa
50MPa
35MPa
/ M
Pa
ε3 / 10-3
20MPa 5MPa
(a) Axial strain (b) Circumferential strain
Fig. 5 The influence of confining pressure on the relationship between axial deviatoric stress and axial strain, and between axial deviatoric stress
and circumferential strain for red sandstone
Table 1 Axial and circumferential strain of red sandstone at C0, D0 and the stress at zero volumetric strain from conventional triaxial
compression experiments
r3/MPa e1c0/10-3 e3c0/10-3 e1d0/10-3 e3d0/10-3 e1v0/10-3 e3v0/10-3
5 0.51 -0.03 1.65 -0.34 2.79 -1.39
20 0.53 -0.06 1.62 -0.43 3.20 -1.60
35 (RS-a03#) 0.60 -0.09 1.73 -0.49 3.80 -1.90
35 (RS-a07#) 0.58 -0.06 1.98 -0.60 4.04 -2.02
50 0.62 -0.12 2.08 -0.71 4.30 -2.15
65 0.68 -0.12 2.74 -0.94 5.49 -2.74
e1c0 and e3c0 represent the axial and circumferential strain at rc0, respectively. e1d0 and e3d0 represent the axial and circumferential strain at
rd0, respectively. e1v0 and e3v0 represent the axial and circumferential strain at rv0, respectively
0
50
100
150
200
250
300
0.0 1.5 3.0 4.5 6.0 7.5 9.0
-9.0
-7.5
-6.0
-4.5
-3.0
-1.5
0.0
-7.5
-6.0
-4.5
-3.0
-1.5
0.00.0 1.5 3.0 4.5 6.0 7.5 9.0
1-3
/ MP
a
ε1 / 10-3
(a)
3 / 1
0-3
/ 10
-3
ε
ε 3ε
1 / 10-3
(b)
Specimen RS-a03#
Specimen RS-a07#
σ3=65MPa
35MPa
5MPa
ε3
σσ
Fig. 6 Relationship between the circumferential strain and the axial strain of red sandstone prior to the peak stress: a the effect of confining
pressure and b the effect of specimen variability. The filled black circles represent the peak stress of the specimen
Experimental Investigation on the Strength, Deformability
123

3.2 Deformation Behavior in ‘‘Reducing Confining
Pressure’’ Experiments
Reducing the confining pressure during a triaxial compres-
sion experiment can also lead to specimen failure (Yang
et al. 2011), which is different from the path of a conven-
tional triaxial compression experiment (as in Fig. 3).
Figure 7 shows the results from triaxial experiments where
the confining pressure was reduced upon reaching a pre-
determined high percentage of the short-term failure stress
of red sandstone (as determined by conventional triaxial
experiments). For comparison, the stress-strain curves from
these experiments are plotted together with those from
conventional triaxial experiments under the same confining
pressure. It can be seen that, between the point where the
confining pressure reduction was initiated and the failure of
Table 2 Young’s modulus, Poisson’s ratio and peak strain of red sandstone from conventional triaxial compression experiments
r3/MPa ES/GPa E50/GPa t e1c/10-3 e3c/10-3 evc/10-3
5 35.9 27.4 0.28 3.99 -6.77 -9.54
20 44.6 42.0 0.34 5.18 -6.49 -7.77
35 (RS-a03#) 47.3 46.3 0.36 6.10 -6.22 -6.33
35 (RS-a07#) 46.9 45.4 0.34 6.43 -6.16 -5.89
50 51.0 51.6 0.37 6.77 -5.67 -4.57
65 50.1 50.7 0.34 7.75 -5.48 -3.20
0
50
100
150
200
250
300
-20 -15 -10 -5 0 5 10 15
0
50
100
150
200
250
300
-30 -25 -20 -15 -10 -5 0 5 10 15
0
50
100
150
200
250
-20 -15 -10 -5 0 5 10 15
0
50
100
150
200
250
300
-20 -15 -10 -5 0 5 10 15 20 25
ε1 / 10-3ε3 / 10-3
(a) RS-a10#
σ1−σ3
σ1−σ3 σ1−σ3
σ1−σ3 / MPa
σ3 / MPa σ 3 / MPa
Reducing confining pressure
Conventional triaxial compression (σ3 =65MPa)
(b) RS-a08 #
Conventional triaxial compression (σ3 =50MPa)
Reducing confining pressure
/ MPa
(c) RS-a09 # (d) RS-a15 #
ε1 / 10-3 ε3 / 10-3
ε1 / 10-3ε3 / 10-3
/ MPa
σ3 / MPa
Conventional triaxial compression (σ3 =50MPa)
Reducing confining pressure
ε1 / 10-3 ε3 / 10-3
/ MPa
σ3 / MPa
Conventional triaxial compression (σ3 =35MPa)
Reducing confining pressure
Fig. 7 Results from conventional triaxial experiments and ‘‘reducing confining pressure’’ experiments. The filled squares represent the position
where the confining pressure was reduced
S.-Q. Yang et al.
123
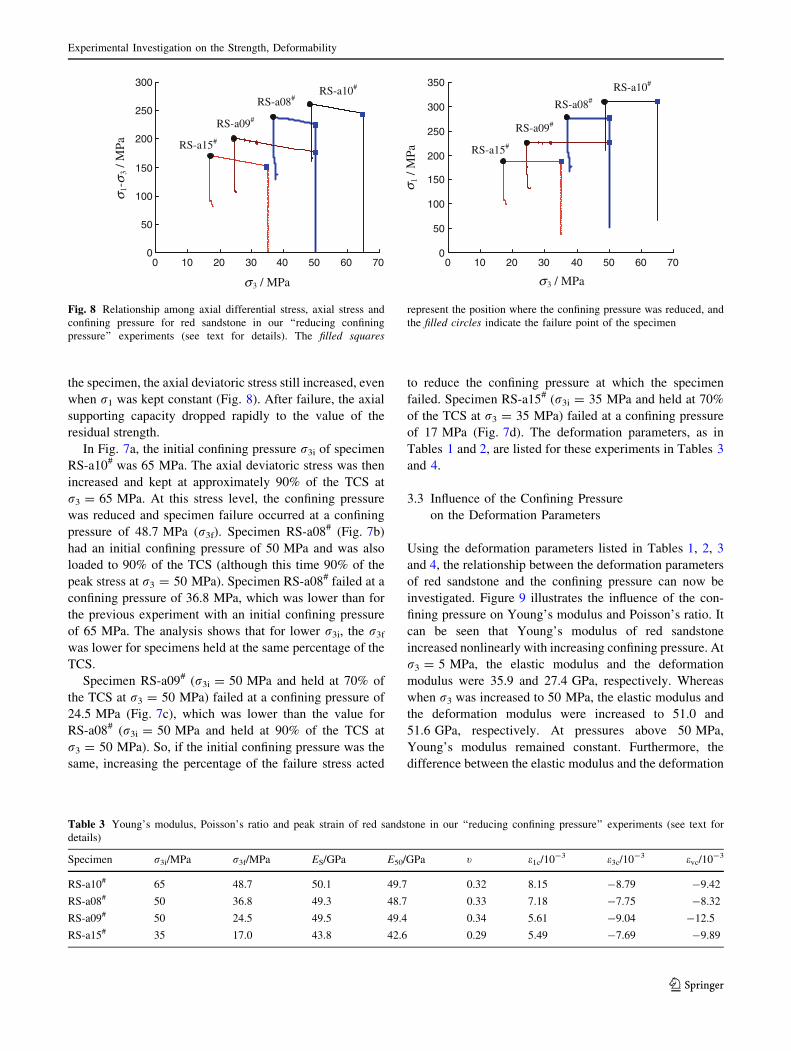
the specimen, the axial deviatoric stress still increased, even
when r1 was kept constant (Fig. 8). After failure, the axial
supporting capacity dropped rapidly to the value of the
residual strength.
In Fig. 7a, the initial confining pressure r3i of specimen
RS-a10# was 65 MPa. The axial deviatoric stress was then
increased and kept at approximately 90% of the TCS at
r3 = 65 MPa. At this stress level, the confining pressure
was reduced and specimen failure occurred at a confining
pressure of 48.7 MPa (r3f). Specimen RS-a08# (Fig. 7b)
had an initial confining pressure of 50 MPa and was also
loaded to 90% of the TCS (although this time 90% of the
peak stress at r3 = 50 MPa). Specimen RS-a08# failed at a
confining pressure of 36.8 MPa, which was lower than for
the previous experiment with an initial confining pressure
of 65 MPa. The analysis shows that for lower r3i, the r3f
was lower for specimens held at the same percentage of the
TCS.
Specimen RS-a09# (r3i = 50 MPa and held at 70% of
the TCS at r3 = 50 MPa) failed at a confining pressure of
24.5 MPa (Fig. 7c), which was lower than the value for
RS-a08# (r3i = 50 MPa and held at 90% of the TCS at
r3 = 50 MPa). So, if the initial confining pressure was the
same, increasing the percentage of the failure stress acted
to reduce the confining pressure at which the specimen
failed. Specimen RS-a15# (r3i = 35 MPa and held at 70%
of the TCS at r3 = 35 MPa) failed at a confining pressure
of 17 MPa (Fig. 7d). The deformation parameters, as in
Tables 1 and 2, are listed for these experiments in Tables 3
and 4.
3.3 Influence of the Confining Pressure
on the Deformation Parameters
Using the deformation parameters listed in Tables 1, 2, 3
and 4, the relationship between the deformation parameters
of red sandstone and the confining pressure can now be
investigated. Figure 9 illustrates the influence of the con-
fining pressure on Young’s modulus and Poisson’s ratio. It
can be seen that Young’s modulus of red sandstone
increased nonlinearly with increasing confining pressure. At
r3 = 5 MPa, the elastic modulus and the deformation
modulus were 35.9 and 27.4 GPa, respectively. Whereas
when r3 was increased to 50 MPa, the elastic modulus and
the deformation modulus were increased to 51.0 and
51.6 GPa, respectively. At pressures above 50 MPa,
Young’s modulus remained constant. Furthermore, the
difference between the elastic modulus and the deformation
0
50
100
150
200
250
300
350
0 10 20 30 40 50 60 700
50
100
150
200
250
300
0 10 20 30 40 50 60 70
1-3
/ MP
a
σ
σ
σσ
3 / MPa
1 / M
Pa
σ3 / MPa
RS-a10# RS-a10#
RS-a08#
RS-a09#
RS-a15#
RS-a08#
RS-a09#
RS-a15#
Fig. 8 Relationship among axial differential stress, axial stress and
confining pressure for red sandstone in our ‘‘reducing confining
pressure’’ experiments (see text for details). The filled squares
represent the position where the confining pressure was reduced, and
the filled circles indicate the failure point of the specimen
Table 3 Young’s modulus, Poisson’s ratio and peak strain of red sandstone in our ‘‘reducing confining pressure’’ experiments (see text for
details)
Specimen r3i/MPa r3f/MPa ES/GPa E50/GPa t e1c/10-3 e3c/10-3 evc/10-3
RS-a10# 65 48.7 50.1 49.7 0.32 8.15 -8.79 -9.42
RS-a08# 50 36.8 49.3 48.7 0.33 7.18 -7.75 -8.32
RS-a09# 50 24.5 49.5 49.4 0.34 5.61 -9.04 -12.5
RS-a15# 35 17.0 43.8 42.6 0.29 5.49 -7.69 -9.89
Experimental Investigation on the Strength, Deformability
123

modulus tended to decrease as r3 was increased, which was
the result of the more pronounced stage of microcrack
closure at lower confining pressures. At r3 = 35 MPa,
Young’s modulus showed a slight variation, the result of
natural specimen variability between specimens cored from
the same block. However, at higher confining pressures of
50 and 65 MPa, the effect of specimen variability on
Young’s modulus was significantly reduced. Poisson’s ratio
of red sandstone was unaffected by confining pressure
(Fig. 9b). In the range of tested r3, Poisson’s ratio varied
from 0.28 to 0.37, and the average of Poisson’s ratio was
approximately 0.33. Thus, the dispersion extent (the ratio of
the D value between the maximum value and the minimum
value to the average value) was approximately 27.3%.
The influence of r3 on the corresponding strains (listed in
Tables 1, 2, 3 and 4) is presented in Fig. 10. We can con-
clude that the peak axial strain of red sandstone increased
linearly, but the peak circumferential strain had a slight
decreasing trend as a function of increasing r3 (Fig. 10a).
Furthermore, the sensitivity of the peak axial strain on r3
was higher than that of the peak circumferential strain.
However, in ‘‘reducing confining pressure’’ experiments,
Table 4 Axial and circumferential strain of red sandstone at C0, D0 and the stress at zero volumetric strain in our ‘‘reducing confining pressure’’
experiments (see text for details)
Specimen r3i/MPa r3f/MPa e1c0/10-3 e3c0/10-3 e1d0/10-3 e3d0/10-3 e1v0/10-3 e3v0/10-3
RS-a10# 65 48.7 0.72 -0.14 2.99 -1.00 5.73 -2.87
RS-a08# 50 36.8 0.63 -0.10 2.59 -0.84 5.01 -2.51
RS-a09# 50 24.5 0.63 -0.11 2.31 -0.74 3.85 -1.93
RS-a15# 35 17.0 0.63 -0.08 2.42 -0.68 3.91 -1.96
y = 29.17 x0.13
R2 = 0.93
20
27
34
41
48
55
0 15 30 45 60
σ3 / MPa σ3 / MPa
You
ng’s
mod
uli /
GP
a
Pois
son’
s ra
tio,
υ
Elastic modulus
Deformation modulus
(a) (b)
0
0.1
0.2
0.3
0.4
0 15 30 45 60
υ = 0.33
Fig. 9 Influence of the confining pressure on Young’s modulus and Poisson’s ratio of red sandstone
y = 0.061 x + 3.911R2 = 0.970
2.0
3.5
5.0
6.5
8.0
0 15 30 45 60 75-8.0
-6.5
-5.0
-3.5
-2.0
0.0
1.5
3.0
4.5
6.0
0 15 30 45 60 75
σ3 / MPa σ3 / MPa
ε 1c / 1
0-3
ε 3c / 1
0-3
ε1c
ε3c
ε 1/ 1
0-3
ε1v0
ε1d’
ε1c’
(a) (b)
Fig. 10 Influence of the confining pressure on the corresponding strains (listed in Tables 1, 2, 3, 4) in red sandstone
S.-Q. Yang et al.
123

the peak strains had no clear linear relationship, especially
for the peak circumferential strain. Also, the peak strain in
our ‘‘reducing confining pressure’’ experiments was higher
than that for our conventional triaxial compression experi-
ments, for the same confining pressure.
Based on the data listed in Tables 1 and 4, the effect of r3
on the axial and circumferential strains at C0, D0 and the stress
at zero volumetric strain will now be discussed (Fig. 10b).
From Fig. 10b, it can be seen that e1c0, e1d0 and e1v0 all
increased nonlinearly with increasing r3, which was differ-
ent from the effect of r3 on the peak axial strain. In detail, the
sensitivity of r3 on e1v0 was higher than that for e1d0, while the
sensitivity of r3 on e1d0 was higher than that for e1c0.
Figure 11 illustrates the relationship between the axial
strain and the circumferential strain at C0, D0 and the stress
of zero volumetric strain. From Fig. 11, we can conclude
that the e3c0, e3d0 and e3v0 of red sandstone increased linearly
with increasing e1c0, e1d0 and e1v0, respectively.
4 Strength and Failure Behavior of Red Sandstone
The linear Mohr-Coulomb criterion can be expressed in
terms of the maximum axial supporting capability rS and
the minimum principal stress r3 (i.e., confining pressure)
(Mohr 1914; Yang et al. 2011):
rs ¼ r0 þ qr3 ð1Þ
where r0 is usually regarded as the UCS of rock material.
The r0 and q are related to the cohesion c and the internal
friction angle u of rock material, which can be expressed in
the following forms, respectively:
r0 ¼ 2c cos u= 1� sin uð Þ ð2Þq ¼ 1þ sin uð Þ= 1� sin uð Þ ð3Þ
The Hoek-Brown criterion is an empirical strength
criterion that has been widely applied in rock mechanics
and engineering. The basic equation describing the peak
triaxial compressive strength of a wide range of isotropic
rock materials can be written as (Hoek and Brown 1980,
1997):
rS ¼ r3 þ ðmrcr3 þ sr2cÞ
0:5 ð4Þ
where rc is the UCS of the intact rock material, and m and
s are all material constants for a specific rock. When the
parameter m is larger, the rock is stronger. The parameter
s reflects the fractured extent, ranging from 0 to 1. When
the parameter s is closer to 1, the rock is more intact.
4.1 Peak Strength and Residual Strength Behavior
Tables 5 and 6 list the peak stress (rp) and the residual
strength (rcr) values for red sandstone from our conven-
tional triaxial compression experiments (obtained from the
stress-strain curves of Figs. 4, 5). Over the entire confining
pressure range, rS increased from 110.1 to 338.6 MPa and
rsr from 57 to 262.6 MPa. These findings are different
from those for Vosges sandstone (Besuelle et al. 2000), i.e.,
the peak strength decreased with increasing confining
pressure within the range 50–60 MPa.
By adopting the linear Mohr-Coulomb criterion (Eq. 1)
and the nonlinear Hoek-Brown criterion (Eq. 4), the
influence of r3 on the peak strength of red sandstone under
triaxial compression can be presented as in Fig. 12. From
Fig. 12, we can see that the peak strength of red sandstone
Axial strain / 10-3
y = -0.493 x + 0.211R2 = 0.842
y = -0.501 x + 0.004R2 = 1.000
y = -0.438 x + 0.291R2 = 0.935
-3.50
-3.00
-2.50
-2.00
-1.50
-1.00
-0.50
0.00
0.0 1.0 2.0 3.0 4.0 5.0 6.0 7.0-0.30
-0.25
-0.20
-0.15
-0.10
-0.05
0.00ε 3
d’
ε 3c’
/ 10-3
, ε3v
0 / 1
0-3
/ 10-3
ε3v0
ε3d’
ε3c’
Fig. 11 Relationship between the axial strain and the circumferential
strain of red sandstone at C0, D0 and the stress of zero volumetric
strain
Table 5 Peak strength and residual strength values for red sandstone in conventional triaxial compression experiments
r3/MPa rcr/MPa rp/MPa rsr/MPa rS/MPa Failure mode
5 52.0 105.1 57.0 110.1 Mixed tension and shear fracture
20 91.3 174.7 111.3 194.7 Mixed tension and shear fracture
35 (RS-a03#) 113.2 216.1 148.2 251.1 Single shear fracture
35 (RS-a07#) – 218.0 – 253.0 –
50 154.3 251.2 204.3 301.2 Shear fracture with local slippage lines
65 197.6 273.6 262.6 338.6 Shear fracture with double slippage planes
rS = rp ? r3; rsr = rcr ? r3
Experimental Investigation on the Strength, Deformability
123

under triaxial compression possessed a distinctly non-linear
behavior with increasing r3, which indicates that the non-
linear Hoek-Brown criterion reflects the peak strength
properties better than the linear Mohr-Coulomb criterion.
With an increase of confining pressure, the failure mode of
red sandstone (Fig. 12) changed from mixed tension and
shear fracture (single shear fracture) to shear fracture with
double slippage planes, which further testified to the fact
that the non-linear Hoek-Brown criterion is more suitable
for use on our data. Moreover, the linear Mohr-Coulomb
criterion predicts the peak strength to be higher than its
measured value at low and high confining pressures, and
lower at intermediate confining pressures (Fig. 12).
It can also be seen that the peak strength of red sand-
stone was not directly dependent on the loading path
(Fig. 12), meaning that our ‘‘reducing confining pressure’’
experiments can also be used to obtain the strength
behavior of the rock. Note that, at a confining pressure of
35 MPa, the difference in the peak strength was only
1.9 MPa for two different curves. Table 7 presents more
details on the peak strength parameters of red sandstone
using the non-linear Hoek-Brown criterion. In Table 7, the
parameters rc and m are back-calculated by assuming
s = 1.000. The parameters rc and m are a little higher for
the ‘‘reducing confining pressure’’ experiments than for the
conventional triaxial compression experiments. However,
the uniaxial compressive strength rc (back-calculated using
the non-linear Hoek-Brown criterion) was distinctly higher
than the measured value of about 70 MPa obtained from a
uniaxial compressive experiment.
The residual strength parameters of red sandstone under
triaxial compression using the linear Mohr-Coulomb cri-
terion are presented in Table 8 and Fig. 13. Good linear
regression coefficients of R = 0.995 and 0.999 were
determined for the conventional triaxial experiments and
the ‘‘reducing confining pressure’’ experiments, respec-
tively. Even though there was an obvious non-linear rela-
tionship between the peak strength and the confining
pressure, the residual strength clearly had a linear relation
with r3 (Fig. 13). Moreover, this relationship was not
dependent on the loading path, which results mainly from
supporting the axial capacity of the sandstone by friction
slippage at the residual strength stage. Thus, the residual
cohesion values for red sandstone, obtained for two dif-
ferent loading paths, were all approximately 10.6 MPa.
Also, the difference in the residual internal friction angle
between our conventional triaxial compression tests and
our ‘‘reducing confining pressure’’ tests was very small
(only 1.3�) and can therefore be ignored in in situ engi-
neering practices.
Table 9 shows the peak strength parameters of red
sandstone obtained using the linear Mohr-Coulomb crite-
rion. Comparing these values with those of Table 8, it is
clear that the peak cohesion of red sandstone was
28.36 MPa for our conventional triaxial compression tests
and 32.63 MPa for our ‘‘reducing confining pressure’’ tests
(which are both considerably higher than residual cohesion
of *10.6 MPa). However, the peak internal friction angle
(which has an average value of 35.7�) obtained from
the two different loading paths was very close to the
residual internal friction angle (which has an average value
of 33.5).
4.2 C0, D0 and the Stress at Zero Volumetric Strain
C0, D0 and the stress at zero volumetric strain for red
sandstone under triaxial compression are listed in Table 10.
It can be seen that, over the whole range of tested pressures
(5–65 MPa), rc0 varied from 10.2 to 37.3 MPa, rd0 from
Table 6 Peak strength and residual strength values for red sandstone in our ‘‘reducing confining pressure’’ experiments (see text for details)
Specimen r3i/MPa r3f/MPa rcr/MPa rp/MPa rsr/MPa rS/MPa Failure mode
RS-a10# 65 48.7 164 261.2 212.7 309.9 Shear fracture with local tension crack
RS-a08# 50 36.8 133 239.2 169.8 276.0 Complicated fracture
RS-a09# 50 24.5 106 201.4 130.5 225.9 Complicated fracture
RS-a15# 35 17.0 81 170.7 98.0 187.7 Complicated fracture
0
50
100
150
200
250
300
350
400
0 10 20 30 40 50 60 70
Under conventional triaxial compression
Under reducing confining pressure
Mohr-Coulomb criterion
Hoek-Brown criterion
σ S=119.5+3.72σ3
R=0.975
S /
MP
a
σ
σ
3 / MPa
Fig. 12 Peak strength analysis of red sandstone under triaxial
compression. The symbols represent the experimental results, and
the lines represent the theoretical values in accordance with the Mohr-
Coulomb or Hoek-Brown criterion. (R is the correlation coefficient of
determination of the regression)
S.-Q. Yang et al.
123

Table 7 Peak strength
parameters of red sandstone
using the non-linear
Hoek-Brown criterion
Loading path UCS/MPa rc/MPa m s a R
Conventional triaxial compression 70 90.8 11.76 1.000 0.5 0.995
‘‘Reducing confining pressure’’ 70 97.4 12.71 1.000 0.5 0.994
United regression for all of the specimens 70 101.7 10.66 1.000 0.5 0.980
Table 8 Residual strength
parameters of red sandstone in
using the linear Mohr-Coulomb
criterion
Loading path r0/MPa q c/MPa u /(�) R
Conventional triaxial compression 39.03 3.36 10.65 32.8 0.995
‘‘Reducing confining pressure’’ 39.94 3.55 10.60 34.1 0.999
0
50
100
150
200
250
300
0 10 20 30 40 50 60 70
Under reducing confining pressure Under conventional triaxial compression
sr /
MP
a
σ
σ
3 / MPa
Mohr-Coulomb criterion
σsr =39.03+3.36σ3
R=0.995
Fig. 13 Residual strength analysis of red sandstone under triaxial
compression. All of the symbols represent the experimental results,
and the lines represent the theoretical values in accordance with
Mohr-Coulomb criterion. (R is the correlation coefficient of determi-
nation of the linear regression)
Table 9 Peak strength
parameters of red sandstone
using the linear Mohr-Coulomb
criterion
Loading path r0/MPa q c/MPa u/(�) R
Conventional triaxial compression 110.0 3.76 28.36 35.4 0.985
‘‘Reducing confining pressure’’ 127.9 3.84 32.63 35.9 0.995
United regression for all the specimens 119.5 3.72 30.98 35.2 0.975
Table 10 C0, D0 and the stress
at zero volumetric strain for red
sandstone under triaxial
compression
rs0 = rv0 ? r3;
rsi = rc0 ? r3; rsd = rd0 ? r3
r3/MPa rc0/MPa rd0/MPa rv0/MPa rsi/MPa rsd/MPa rs0/MPa
5 10.2 43.2 83.5 15.2 48.2 88.5
20 20.3 66.4 133.6 40.3 86.4 153.6
35 (RS-a03#) 26.6 79.5 169.5 61.6 114.5 204.5
35 (RS-a07#) 24.5 89.5 174.4 59.5 124.5 209.4
50 34.0 108.4 202.8 84.0 158.4 252.8
65 36.6 138.7 242.2 101.6 203.7 307.2
65 (RS-a10#) 37.3 147.5 246.5 102.3 212.5 311.5
50 (RS-a08#) 29.9 125.8 222.0 79.9 175.8 272.0
50 (RS-a09#) 31.6 114.5 182.1 81.6 164.5 232.1
35 (RS-a15#) 25.3 102.9 159.2 60.3 137.9 194.2
0
50
100
150
200
250
300
350
0 10 20 30 40 50 60 70σ si /
MP
a, σ
sd /
MP
a, σ
s0 /
MP
a
σ3 / MPa
Peak strength
Stress at zero volumetric strain
D’
C’ σs0=77.22+3.64σ3
R=0.995
σsd=30.74+2.70σ3
R=0.995
RS-a15#
RS-a09#
σsi=10.15+1.43σ3
R=0.998
Fig. 14 The influence of the confining pressure on C0, D0 and the
stress at zero volumetric strain under triaxial compression. The
symbols represent the experimental results, and the curves represent
the theoretical values found using the Mohr-Coulomb criterion
Experimental Investigation on the Strength, Deformability
123

43.2 to 147.5 MPa and rv0 from 83.5 to 246.5 MPa.
Figure 14 presents the influence of r3 on C0, D0 and the stress
at zero volumetric strain, together with the relationship
between rS and r3. It can be seen that rsi, rsd and rs0 all
increased linearly (with good linear regression coefficients
of R = 0.995–0.998) with the confining pressure. Notably,
however, the rs0 of two specimens (i.e., RS-a09# and
RS-a15#) were both lower than other specimens at the same
confining pressure. This is a result of reducing the confining
pressure before the point of zero volumetric strain.
The sensitivity of the stress at zero volumetric strain on
r3 was clearly higher than that for D0, while the sensitivity
of D0 on r3 was clearly higher than that for C0. Table 11
lists the strength parameters of red sandstone obtained
using the stress at zero volumetric strain and D0 and the
linear Mohr-Coulomb criterion. The r0 had values of 77.22
and 30.74 MPa, and q was 3.64 and 2.70 for the regression
analysis using the stress at zero volumetric strain and D0,respectively. Using Eqs. 2 and 3, the values of c and uwere calculated using the regression analysis for the stress
at zero volumetric strain to be 20.24 MPa and 34.7�,
respectively. These values were higher than the values of
c and u (9.35 MPa and 27.4�) calculated using the
regression analysis for D0.Figure 15 shows the relationship between the peak
strength and C0, D0 and the stress at zero volumetric
strain (from the conventional triaxial compression tests).
From Fig. 15, it can be seen that with the increase of
peak strength, C0, D0 and the stress at zero volumetric
strain for red sandstone all increased nonlinearly. A
logarithmic equation is proposed to describe the nonlin-
ear relationship between the peak strength and the stress
at zero volumetric strain, C0 and D0 (all of which have
good nonlinear regression coefficients). By using Fig. 15,
we can approximately predict the position of C0, D0 and
the stress at zero volumetric strain using the peak
strength of rock, even without measuring the circumfer-
ential strain curve.
4.3 Failure Behavior Under Conventional Triaxial
Compression and Reducing Confining Pressure
Figures 16, 17, 18, 19 and 20 show the failure modes of red
sandstone specimens from our conventional triaxial com-
pression experiments. The confining pressure had exerted a
significant influence on the failure mode.
At confining pressures between 5 and 20 MPa, our
sandstone specimens all demonstrated a mixed tension and
shear fracture mode of failure (Figs. 16, 17). Axial and
lateral tensile cracks were observed at r3 = 5 and 20 MPa
(Figs. 16, 17). Furthermore, the widths of the tensile cracks
in specimen at r3 = 5 MPa were bigger than those at
r3 = 20 MPa. Our post-mortem specimens also indicated
that it was easier for tension failure to occur at lower
confining pressures. In Fig. 16, frictional sliding was also
observed along the direction of the shear fracture plane.
The angle of the shear fracture plane at r3 = 5 MPa was
approximately 74�, higher than for r3 = 20 MPa
(approximately 68�).
At an intermediate confining pressure of 35 MPa, red
sandstone specimens failed by the typical shear failure
mode with a single fracture surface. The fracture surface
was found to be very smooth and flat, which is the result of
frictional sliding of the macroscopic fracture surfaces along
the direction of the shear fracture plane (Fig. 18). The
angle of the shear fracture plane at r3 = 35 MPa was
approximately 62�, approximately equal to that predicted
using the linear Mohr-Coulomb criterion [i.e., 63�(45� ? u/2)].
However, at higher confining pressures of 50 and
65 MPa, the failure modes of red sandstone were different.
At r3 = 50 MPa, the sandstone exhibited a shear failure
mode, with several closed shear bands (Fig. 19) and a shear
fracture angle of approximately 57�. The shear frictional
Table 11 Strength parameters
of red sandstone obtained using
C0, D0 and the stress at zero
volumetric strain by the linear
Mohr-Coulomb criterion
Different regression analysis r0/MPa q c/MPa u/(�) R
Using the stress at zero volumetric strain 77.22 3.64 20.24 34.7 0.995
Using D0 30.74 2.70 9.35 27.4 0.995
Using C0 10.15 1.43 4.24 10.2 0.998
y = 160.24Ln(x) - 513.84R2 = 0.9962
y = 183.97Ln(x) - 722.63R2 = 0.9903
y = 117.4Ln(x) - 221.83R2 = 0.9716
0
80
160
240
320
400
0 50 100 150 200 250 300 350
Stress at zero volumetric strain
D’
C’
σS / MPa
σ si /
MP
a, σ
sd /
MP
a, σ
s0 /
MP
a
Fig. 15 Relation between the peak strength and C0, D0 and the stress
at zero volumetric strain for the conventional triaxial compression
tests. The symbols represent the experimental results
S.-Q. Yang et al.
123

sliding was distinct, and the direction of sliding was along
the shear fracture plane. At r3 = 65 MPa, the sandstone
exhibited a shear failure mode with double slippage planes
(Fig. 20), and the angle of the shear fracture plane was
approximately 55�. It should be noted that the shear frac-
ture surfaces under higher confining pressures of 50 and
65 MPa were not as smooth as for r3 = 35 MPa. A closed
shear band and an open shear fracture were both observed
for r3 = 65 MPa. A considerable amount of fault gouge, a
result of the frictional sliding along the shear fracture
planes, was also observed (the direction of frictional sliding
was also along the shear fracture plane). The angle of the
shear fracture plane at r3 = 50 and 65 MPa was lower than
63� (i.e., 45� ? u/2), as predicted using the linear Mohr-
Coulomb criterion.
For our ‘‘reducing confining pressure’’ experiments, the
failure mode of red sandstone (Fig. 21) was significantly
different from that obtained in our conventional triaxial
1σ
1σ
Friction slippage Lateral tensile crack
Axial tensile crack
σ3 = 5 MPa
Fig. 16 Mixed tension and shear fracture mode of red sandstone from a conventional triaxial compression experiment at a confining pressure of
5 MPa
Experimental Investigation on the Strength, Deformability
123

compression experiments; it was much more complex.
Further, the width of the fracture surfaces appeared to be
greatly increased.
At r3i = 65 MPa and r3f = 48.7 MPa, the sandstone
exhibited a shear fracture failure mode with local tensile
cracks. The angle of the shear fracture plane was approx-
imately 57�. At r3i = 50 MPa and r3f = 36.8 MPa, a
more complicated failure mode was observed (Fig. 21b).
The main failure mode of specimen RS-a08# was by a
shear fracture (e.g., 1–3 on Fig. 21b). Shear fracture plane
1 was the reverse of shear fracture plane 2, while shear
fracture plane 2 was linked with shear fracture plane 3.
Furthermore, in specimen RS-a08#, some axial and lateral
tensile cracks were also observed, perhaps due to
decreasing the confinement on the specimen.
We also saw a complicated failure mode at r3i = 50 MPa
and r3f = 24.5 MPa (Fig. 21c). From Fig. 21c, the main
failure mode of specimen RS-a09# was also by means of a
shear fracture. Shear fracture plane 1 was the reverse of shear
fracture plane 3, while shear fracture plane 2 was linked with
shear fracture plane 1. Tensile cracks were again observed
(see a and b in Fig. 22). The initial confining pressure of two
specimens, RS-a08# and RS-a09#, was the same, but the final
confining pressure upon failure for specimen RS-a09# was
1σ
1σ
Lateral tensile crack
Axial tensile crack
Shear fracture Shear fracture
σ 3 = 20 MPa
Fig. 17 Mixed tension and shear fracture mode of red sandstone from a conventional triaxial compression experiment at a confining pressure of
20 MPa
S.-Q. Yang et al.
123

lower. Therefore, in specimen RS-a09#, more small ten-
sile cracks were required to initiate the process of final
failure.
At r3i = 35 MPa and r3f = 17 MPa, the sandstone
primarily took on a shear failure mode with a single shear
fracture plane. However, at the point of localization, there
were some axial and lateral tensile cracks (see C and D in
Fig. 22). Again, these are likely to be the result of the
specimen failing by reducing the confining pressure; they
were not observed in the specimens from the conventional
triaxial compression experiments.
5 Spatial AE Locations Behavior
Figure 23 shows the relationship between axial deviatoric
stress, AE counts and the strain of red sandstone at a
confining pressure of 35 MPa. Figure 24 shows the
spatial AE locations behavior for the same experiment;
the letters shown in Fig. 24 correspond to the time slices
of Fig. 23.
Using Figs. 23 and 24, we can analyze the coalescence
process of internal cracks in red sandstone during triaxial
compression. When the axial deviatoric stress was loaded
to points a and b, the AE counts in the specimen were very
rare, and they resulted from small micro-failure occur-
rences during elastic deformation. With increasing cir-
cumferential deformation, the axial deviatoric stress-strain
curve began to depart from the domain of elastic defor-
mation. When the axial deviatoric stress reached point c
(r1–r3 = 189.4 MPa = 87.6%rp, e1 = 4.41 9 10-3), the
AE counts in the specimen reached 80, which meant that
the specimen contained a small amount of internal damage.
When the specimen was loaded to point d (r1–
r3 = 208.2 MPa = 96.3%rp, e1 = 5.21 9 10-3), the AE
counts within the specimen reached 149, indicating that
more microcracking took place within the specimen.
Before point d, the AE counts were located in the top and
Shear fracture
Friction slippage
1σ
1σ
Friction slippage
σ3 = 35 MPa
Fig. 18 Single shear fracture
mode of red sandstone from a
conventional triaxial
compression experiment at a
confining pressure of 35 MPa
Experimental Investigation on the Strength, Deformability
123

bottom regions of the specimen, and there were almost no
AE counts in the central region of the specimen.
When the axial deviatoric stress was loaded to point e
(r1–r3 = 214.7 MPa = 99.4%rp, e1 = 5.75 9 10-3), the
AE counts reached 207 in the specimen. There were also
some AE counts in the central region of the specimen.
Once the specimen had reached point f (r1–
r3 = 216.1 MPa = 100%rp, e1 = 6.10 9 10-3), the AE
counts in the specimen totaled 267. The AE counts were
now accumulating throughout the entire specimen. How-
ever, the specimen was still macroscopically coherent,
even though it had some internal damage failure. After the
peak strength, from point f to j, the axial deviatoric stress
on the specimen slowly dropped from 216.1 to 207.9 MPa
as the circumferential strain increased from 6.22 9 10-3 to
10.27 9 10-3 (Fig. 23), but the axial strain of the speci-
men only increased to 7.17 9 10-3 from 6.10 9 10-3.
During the reduction of axial deviatoric stress from point f
to j, even though it involved a small stress drop, the cir-
cumferential deformation of the specimen was increasing
faster than the axial deformation (indicating that there was
a large amount of dilatancy). The AE counts increased to
926 at point j, and more AE events were observed
throughout the specimen (Fig. 24j).
Between point j and point k, the axial deviatoric stress
significantly decreased from 207.9 to 196.4 MPa, and the
axial strain slightly increased from 7.17 9 10-3 to
7.39 9 10-3. However, the accumulated AE counts in the
specimen increased rapidly to 1,883. At this moment, the
specimen experienced a serious damage failure. The axial
stress dropped rapidly to 140.2 from 196.4 MPa upon
reaching point l, and the AE counts increased to 3,056. The
main failure mode with the single shear fracture plane
could be seen from the elliptical region in Fig. 24l. The
axial deviatoric stress was then loaded to point m (r1–
r3 = 113.2 MPa, e1 = 11.15 9 10-3), and the specimen
was located at the stage of residual strength. At this time,
the AE counts from the specimen reached 3,843, and the
macroscopic shear fracture plane was initiated, which
could be observed from Fig. 24m. The failure mode of the
specimen formed by AE location analysis showed good
agreement with the experimental failure mode.
6 Conclusions
We have presented an experimental investigation of the
strength, deformation behavior, failure characteristics and
1σ
1σ
Friction slippage
Closed shear band Shear fracture
Shear fracture
σ3 = 50 MPa
No fracture region
Fig. 19 Shear fracture mode with local slippage lines of red sandstone from a conventional triaxial compression experiment at a confining
pressure of 35 MPa
S.-Q. Yang et al.
123

spatial AE locations of red sandstone under triaxial com-
pression. In our study, we used the circumferential dis-
placement as the controlling feedback signal (as opposed to
the more usual axial displacement feedback) to obtain
better triaxial compression experimental results for red
sandstone. Based on our data, the following conclusions
can be drawn.
1. Our results show that the post-peak axial deformation
of red sandstone was changed as the confining pressure
was increased from 5 to 65 MPa. Young’s modulus
increased nonlinearly with confining pressure, but
Poisson’s ratio remained unchanged. In the range of
tested r3 (from 5 to 65 MPa), Poisson’s ratio ranged
from 0.28 to 0.37, and the average Poisson’s ratio was
approximately 0.33.
2. According to the observed compactive and dilatancy
behavior, the influence of the confining pressure on the
corresponding deformation parameters of red sand-
stone can be discussed further. The peak axial strain
increased linearly with the confining pressure, but the
peak circumferential strain only showed a modest
increase. However, during our ‘‘reducing confining
pressure’’ experiments, the peak strain showed no clear
linear relation, especially for the peak circumferential
strain. In addition, the peak strain during our ‘‘reducing
confining pressure’’ experiments was higher than that
for our conventional triaxial compression experiments
for the same confining pressure. The axial and
circumferential strain at C0, D0 and the stress at zero
volumetric strain all increased nonlinearly with the
1σ
1σ
Friction slippage
σ3 = 65 MPa
Friction slippage
Closed shear band
Shear fracture
Fig. 20 Shear fracture mode
with double slippage planes of
red sandstone from a
conventional triaxial
compression experiment at a
confining pressure of 65 MPa
Experimental Investigation on the Strength, Deformability
123

confining pressure. However, the e3c0, e3d0 and e3v0
increased linearly with increasing e1c0, e1d0 and e1v0,
respectively.
3. The strength and failure behavior of red sandstone
under triaxial compression can also be analyzed. The
nonlinear Hoek-Brown criterion better reflected the
(b) Specimen RS-a08#
(σ3i =50 MPa and σ3f =36.8 MPa)
(a) Specimen RS-a10#
(σ3i =65 MPa and σ3f =48.7 MPa)
Tensile crack
Shear fracture 1
Shear fracture 2
Shear fracture 3 Tensile crack
Lateral tensile crack
Axial tensile crack
(c) Specimen RS-a09#
(σ3i =50 MPa and σ3f =24.5 MPa)
(d) Specimen RS-a15#
(σ3i =35 MPa and σ3f =17 MPa)
Shear fracture 1
Shear fracture 2
Shear fracture 3
More tensile cracksA
B
C
D
Fig. 21 Failure mode of red sandstone deformed in ‘‘reducing confining pressure’’ experiments with different initial conditions
S.-Q. Yang et al.
123

peak strength properties than the linear Mohr-Coulomb
criterion. However, even though there was an obvious
non-linear relationship between the peak strength and
the confining pressure, the residual strength of red
sandstone exhibited a clear linear relationship with the
confining pressure (best described using the linear
Mohr-Coulomb criterion). The peak and residual
strengths were not directly related to two different
loading paths. C0, D0 and the stress at zero volumetric
strain all increased linearly with confining pressure.
The strength parameters obtained using C0 and D0 were
obviously lower than those obtained by the peak
strength.
4. In our conventional triaxial compression experiments,
with increasing confining pressure, the failure mode
of red sandstone changed from mixed tension and
shear fracture (single shear fracture) to shear fracture
with double slippage planes. However, the failure
mode in our ‘‘reducing confining pressure’’ experi-
ments was found to be more complicated, which
results mainly from the unstable failure characteris-
tics of the rock during the reduction in confining
pressure.
5. Finally, based on the obtained spatial AE locations at a
confining pressure of 35 MPa, a detailed analysis of
the evolutionary process of internal cracks in red
Tensile crack
Tensile crack
Specimen RS-a09#
Specimen RS-a15#
Axial tensile crack
1σ
1σ
Axial tensile crack
Lateral tensile crack
AB
C D
Fig. 22 Local magnification of tensile cracks in red sandstone from ‘‘reducing confining pressure’’ experiments. The denoted letters
a–d correspond to those in Fig. 21
0
50
100
150
200
250
-15 -12 -9 -6 -3 0 3 6 9 12-300
500
1300
2100
2900
3700
4500
σ3=35MPa
1-
3 / M
Pa
ε1 / 10-3ε3 / 10-3
a
b
cd
e f g h ijk
l
m
a
b
c
defgh i j
k
l
m
AE
cou
nts
σσ
Fig. 23 Relationship between
axial differential stress, AE
counts and strain for red
sandstone at a confining
pressure of 35 MPa
Experimental Investigation on the Strength, Deformability
123

sandstone was established for the entire loading
process. These results may be significant for predicting
and forecasting failure processes in the field of deep
underground rock mass engineering.
Acknowledgments This research was supported by the National
Natural Science Foundation of China (grant no. 51179189,
51074162), a China Postdoctoral Science Foundation specially funded
project (grant no. 201104585) and a Qing Lan Project of Jiangsu
Province (2010). We also would like to express our sincere gratitude
(a) (b) (c) (d) (e)
(f) (g) (h) (i) (j)
(k) (l) (m) Experimental failure mode
Fig. 24 Spatial AE locations behavior for red sandstone at a confining pressure of 35 MPa. The denoted letters shown in the figure correspond to
those on the stress-strain curve in Fig. 23
S.-Q. Yang et al.
123

to the editor, two anonymous reviewers and Mike Heap for their
valuable comments, which have greatly improved this paper.
References
Al-Harthi AA (1998) Effect of planar structures on the anisotropy of
Ranyah sandstone Saudi Arabia. Eng Geol 50(1/2):49–57
Alkan H, Cinar Y, Pusch G (2007) Rock salt dilatancy boundary from
combined acoustic emission and triaxial compression tests. Int J
Rock Mech Min Sci 44(1):108–119
Amann F, Button EA, Evans KF, Gischig VS, Blumel M (2011)
Experimental study of the brittle behavior of clay shale in rapid
unconfined compression. Rock Mech Rock Eng 44(4):415–430
Bagde MN, Petros V (2005) Fatigue properties of intact sandstone
specimens subjected to dynamic uniaxial cyclical loading. Int J
Rock Mech Min Sci 42(2):237–250
Bell AF, Greenough J, Heap MJ, Main IG (2011a) Challenges for
forecasting based on accelerating rates of earthquakes at
volcanoes and laboratory analogues. Geophys J Int 185(2):
718–723
Bell AF, Naylor M, Heap MJ, Main IG (2011b) Forecasting volcanic
eruptions and other material failure phenomena: an evaluation of
the failure forecast method. Geophys Res Lett. doi:10.1029/
2011GL048155
Besuelle P, Desrues J, Raynaud S (2000) Experimental characteriza-
tion of the localisation phenomenon inside a Vosges sandstone in
a triaxial cell. Int J Rock Mech Min Sci 37(8):1223–1237
Besuelle P, Baud P, Wong TF (2003) Failure mode and spatial
distribution of damage in Rothbach sandstone in the brittle–
ductile transition. Pure Appl Geophys 160(5/6):851–868
Baud P, Zhu W, Wong TF (2000) Failure mode and weakening effect
of water on sandstone. J Geophys Res 105((B7)):16371–16389
Baud P, Klein E, Wong TF (2004) Compaction localization in porous
sandstones: spatial evolution of damage and acoustic emission
activity. J Struct Geol 26(4):603–624
Benson PM, Meredith PG, Platzman ES, White RE (2005) Pore fabric
shape anisotropy in porous sandstones and its relation to elastic
wave velocity and permeability anisotropy under hydrostatic
pressure. Int J Rock Mech Min Sci 42(7/8):890–899
Benson PM, Thompson AB, Meredith PG, Vinciguerra S, Young RP
(2007) Imaging slow failure in triaxially deformed Etna basalt
using 3D acoustic-emission location and X-ray computed
tomography. Geophys Res Lett. doi:10.1029/2006GL028721
Brantut N, Schubnel A, Gueguen Y (2011) Damage and rupture
dynamics at the brittle-ductile transition: the case of gypsum.
J Geophys Res 116:B01404. doi:10.1029/2010JB007675
Chang SH, Cl Lee (2004) Estimation of cracking and damage
mechanisms in rock under triaxial compression by moment
tensor analysis of acoustic emission. Int J Rock Mech Min Sci
41(7):1069–1086
Fairhurst CE, Hudson JA (1999) Draft ISRM suggested method for
the complete stress–strain curve for the intact rock in uniaxial
compression. Int J Rock Mech Min Sci 36(3):279–289
Feng XT, Chen SL, Zhou H (2004) Real-time computerized
tomography (CT) experiments on sandstone damage evolution
during triaxial compression with chemical corrosion. Int J Rock
Mech Min Sci 41(2):181–192
Fortin J, Stanchits S, Dresen G, Gueguen Y (2006) Acoustic emission
and velocities associated with the formation of compaction
bands in sandstone, J Geophys Res. doi:10.1029/2005JB003854
Fortin J, Stanchits S, Dresen G, Gueguen Y (2009) Acoustic
emissions monitoring during inelastic deformation of porous
sandstone: comparison of three modes of deformation. Pure Appl
Geophys 166(5–7):823–841
Hawkes I, Mellor M (1970) Uniaxial testing in rock mechanics
laboratories. Eng Geol 4:177–285
Heap MJ, Baud P, Meredith PG, Bell AF, Main IG (2009a). Time-
dependent brittle creep in Darley Dale sandstone. J Geophys Res.
doi:10.1029/2008JB006212
Heap MJ, Baud P, Meredith PG (2009b) The influence of temperature
on brittle creep in sandstones. Geophys Res Lett. doi:10.1029/
2009GL039373
Heap MJ, Faulkner DR, Meredith PG, Vinciguerra S (2010) Elastic
moduli evolution and accompanying stress changes with
increasing crack damage: implications for stress changes around
fault zones and volcanoes during deformation. Geophys J Int
183:225–236
Hoek E, Brown ET (1980) Underground excavation in rock.
Institution of Mining and Metallurgy, London
Hoek E, Brown ET (1997) Practical estimates of rock mass strength.
Int J Rock Mech Min Sci 34(8):1165–1186
Huang S, Xia KW, Yang F, Feng XT (2010) An experimental study of
the rate dependence of tensile strength softening of Longyou
sandstone. Rock Mech Rock Eng 43(6):677–683
Jeng FS, Weng MC, Huang TH, Lin ML (2002) Deformational
characteristics of weak sandstone and impact to tunnel defor-
mation. Tunnel Undergr Space Technol 17(3):263–274
Klein E, Baud P, Reuschle T, Wong TF (2001) Mechanical behaviour
and failure mode of Bentheim sandstone under triaxial com-
pression. Phys Chem Earth (A) 26:21–25
Lin Q, Fakhimi A, Haggerty M, Labuz JF (2009) Initiation of tensile
and mixed-mode fracture in sandstone. Int J Rock Mech Min Sci
46(3):489–497
Lockner D, Byerlee J, Kuksenko V, Ponomarev A, Sidorin A (1991)
Quasi-static fault growth and shear fracture energy in granite.
Nature 350:39–42
Mogi K (1966) Some precise measurements of fracture strength of
rocks under uniform compressive stress. Rock Mech Eng Geol
4:41–55
Mohr O (1914) Abhandlungen aus dem Gebiete der Technischen
Mechanik, second edn. Ernst, Berlin
Nespereira J, Blanco JA, Yenes M, Pereira D (2010) Irregular silica
cementation in sandstones and its implication on the usability as
building stone. Eng Geol 115(3/4):167–174
Paterson MS, Wong TF (2005) Experimental rock deformation—the
Brittle field. Springer, New York
Pestman BJ, Van Munster JG (1996) An acoustic emission study of
damage development and stress-memory effects in sandstone. Int
J Rock Mech Min Sci Geomech Abstr 33(6):585–593
Rutter E (1986) On the nomenclature of mode of failure transitions in
rocks. Tectonophysics 122:381–387
Tembe S, Baud P, Wong TF (2008) Stress conditions for the
propagation of discrete compaction bands in porous sandstone.
J Geophys Res. doi:10.1029/2007JB005439
Townend E, Thompson BD, Benson PM, Meredith PG, Baud P,
Young RP (2008) Imaging compaction band propagation in
Diemelstadt sandstone using acoustic emission locations. Geo-
phys Res Lett. doi:10.1029/2008GL034723
Tsai LS, Hsieh YM, Weng MC, Huang TH, Jeng FS (2008) Time-
dependent deformation behaviors of weak sandstones. Int J Rock
Mech Min Sci 45(2):144–154
Tavallali A, Vervoort A (2010) Effect of layer orientation on the
failure of layered sandstone under Brazilian test conditions. Int J
Rock Mech Min Sci 47(2):313–322
Wawersik WR, Fairhurst C (1970) A study of brittle rock fracture in
laboratory compression experiments. Int J Rock Mech Min Sci
7:561–575
Wong TF, David C, Zhu W (1997) The transition from brittle faulting
to cataclastic flow in porous sandstones: Mechanical deforma-
tion. J Geophys Res 102((B2)):3009–3025
Experimental Investigation on the Strength, Deformability
123

Wu XY, Baud P, Wong TF (2000) Micromechanics of compressive
failure and spatial evolution of anisotropic damage in Darley
Dale sandstone. Int J Rock Mech Min Sci 37(1/2):143–160
Yang SQ, Jiang YZ (2010) Triaxial mechanical creep behavior of
sandstone. Min Sci Technol 20(3):339–349
Yang SQ, Jing HW (2011) Strength failure and crack coalescence
behavior of brittle sandstone samples containing a single fissure
under uniaxial compression. Int J Fract 168(2):227–250
Yang SQ, Jing HW, Li YS, Han LJ (2011) Experimental investigation
on mechanical behavior of coarse marble under six different
loading paths. Exp Mech 51(3):315–334
Youn H, Tonon F (2010) Multi-stage triaxial test on brittle rock. Int J
Rock Mech Min Sci 47(4):678–684
Zorlu K, Gokceoglu C, Ocakoglu F, Nefelioglu HA, Acikalin S
(2008) Prediction of uniaxial compression strength of sandstones
using petrography-based models. Eng Geol 96(3/4):141–158
S.-Q. Yang et al.
123