experimental investigation of css assisted by gas
TRANSCRIPT

Copyright © IJCESEN
International Journal of Computational and
Experimental Science and Engineering
(IJCESEN) Vol. 5-No.1 (2019) pp. 1-9
http://dergipark.gov.tr/ijcesen ISSN: 2149-9144
Research Article
Experimental Investigation of CSS Assisted by Gas-viscosity Reducer Co-
Injection with Different Types of Wells and Heavy Oil
Wei ZHAO1,2*
, Huiqing LIU1,2
, Chuan LU3,Jing WANG
1,2, Lin MENG
4and Ruihong
ZHONG1,2
1 State Key Laboratory of Petroleum Resources and Engineering in China University of Petroleum, Beijing, China;
2 MOE Key Laboratory of Petroleum Engineering in China University of Petroleum, Beijing, China;
3 Research Institute of China National Offshore Oil Corporation, Beijing, China;
4 Department of Chemical & Petroleum Engineering, University of Calgary, Calgary, AB, Canada T2N1N4
* Corresponding Author : [email protected]
ORCID: 0000-0001-7439-4258
Article Info:
DOI: 10.22399/ijcesen.485188
Received : 19 November 2018
Accepted : 12 December 2018
Keywords
Cyclic steam stimulation
EOR
Viscosity reducer
Non-condensable gas
Abstract:
The efficiency of conventional thermal recovery methods is limited due to heat
loss, steam overlapping and other factors. Steam injection assisted by various
additives, such as no-condensable gas, solvent and surfactant, has proved to be
an effective and beneficial method to improve thermal oil recovery. However,
based on previous studies, systematic and comprehensive investigation of the
compound system of gas-chemical agent and the application criteria is lacking.
In this paper, a 3D physical model with different types of wells and heavy oil
were designed. The additives consist of nitrogen and viscosity reducer (VR).
Different injection fluid combinations (single gas, single VR and gas-VR co-
injection), fluid injection configurations (gas-steam and gas+steam, VR-steam
and VR+steam,) were applied to investigate the effects of the compound system
on oil recovery, oil-steam ratio and oil production rate.
The results indicated that steam injection assisted by gas-VR performs
effectively in enhancing the thermal recovery. The conclusions are drawn
according to the variation curves of characteristic parameters. The effects of the
compound system kept increasing the oil recovery after different injection
patterns. Meanwhile, the cumulative SOR decreased after the corresponding
processes sequentially. The distribution of temperature showed that gas-VR co-
injection not only inhibited steam overlapping, which promoted the horizontal
expansion of the steam chamber but also reduced the viscosity of heavy oil
significantly. More oil was produced due to the gas expansion. In summary, this
work provides a practical understanding of CSS assisted by gas-VR co-injection
and optimization of the injection schemes for different types of reservoirs.
1. Introduction With the decrease of conventional oil reserves and
increase of the oil demand, heavy oil resources
attract more attention of petroleum engineers. A
series of thermal recovery techniques, such as
cyclic steam stimulation (CSS), steam flooding,
steam assisted gravity drainage (SAGD) are
developed to enhance the heavy oil recovery
[1,11,18]. However, the efficiency of conventional
thermal recovery methods is limited due to heat
loss, steam overlapping and other factors. Steam
injection assisted by various additives, such as no-
condensable gas, solvent and surfactant, has proved
to be an effective and beneficial method to improve
thermal oil recovery.
Non-condensate gas, such as nitrogen and CO2,
were always used as a heat insulation agent
[2,9,17]. It turned out to be beneficial for the EOR
process. The mechanisms of steam injection
assisted by no-condensate gas mainly include
higher swelling effect, lower heat conductivity

Wei ZHAO, Huiqing LIU, Chuan LU, Jing WANG, Lin MENG and Ruihong ZHONG/ IJCESEN 5-1(2019)1-9
2
coefficient and interfacial-tension reduction
[6,9,15] by using 2-D visualized model. The
microscopic pictures displayed the oil
displacement.
The chemical agents such as surfactant and solvent
have also been used to assist the steam injection
[4,8,14]. Due to low cost and stable properties,
surfactant was applied to the process of thermal
recovery, especially for viscosity reduction [7]. It
has been shown that solvent additives can improve
oil production rates with reduced steam injection
[5,10]. However, most studies just showed the
mechanism of gas and chemical agent separately
[3,12]. Few systematic and comprehensive
explanations were given to state the mechanism of
the compound system of gas-chemical agent and
the application conditions.
In this paper, a series of experiments were
conducted to study the effect of gas and viscosity-
reducer injected with steam during the CSS stage.
Different injection fluids, injection orders and
injection patterns were investagated to study the
effects of the compound system on oil recovery,
oil-steam ratio and oil production rate.
2. Experimental apparatus and procedures
2. 1 Experimental apparatus
As shown in Figure 1, the setup for the experiments
consisted of five subsystems: injection system,
energy-supply system, temperature-pressure
monitoring system, 3D physical simulation system,
and fluid-data acquisition system. The injection
system consisted of an ISCO pump, a steam
generator, a nitrogen tank, a gas mass flow
controller, a heating belt and a cylindrical tank. The
3D reservoir model was a stainless-steel container,
with the dimensions of 36cm in length, 36cm in
width and 21cm in depth. The maximum tolerance
pressure of the model was 3Mpa. The 3D model
could be used to simulate development with
different types of the reservoirs and wells, different
injection patterns and different injection fluids. The
whole model was in the thermotank to maintain the
constant temperature. The monitoring system
included 36 temperature transducers and 8 pressure
transducers. In the process of experiment, all these
transducers were placed evenly in the model to
detect the variation of the temperature and pressure
with time. The data was recorded by the acquisition
system. The energy-supply system was a cylindrical
vessel filled with oil and compressed gas to provide
energy for the physical model. A hand pump and a
back-pressure regulator were installed in the outlet
ensuring the stable production of the oil wells under
reservoir pressure.
Comparing with the actual reservoir scale, the 3D
physical model is relatively small. For the accuracy
and reliability of experiments, the similarity criteria
were established. Here, Pujol-Boberg’s similarity
criteria were used to calculate the designed
parameters [13]. Table 1 shows the similarity
criterion numbers of cyclic steam stimulation for
heavy oil reservoir.
Table 1 Similarity criterion numbers of cyclic steam
stimulation for heavy oil reservoir Parameters Similarity Criterion Physical Meaning
Vertical well spacing
or horizontal well
length
L Geometric similarity
Permeability
1o
wc or o
K gt
S S L
Darcy’s law
Production time 2
t
L
Dimensionless time
Production pressure
difference o
P
gL
Ratio of pressure and
gravity
Steam injection rate
31s
wc or w
i t
S S L
Ratio of flow volume
and storage volume
In Table 1, L is vertical well spacing or horizontal
well length, m. K is permeability of prototype or
simulation model, 10-3
µm2. o is the oil density,
g/cm3. g is the gravitational acceleration, m/s
2. t is
time, s. ϕ is the porosity of prototype or simulation
model. Swc is the irreducible water saturation. Sor is
the residual oil saturation. µo is the oil viscosity,
mPa·s. α is the thermal diffusion coefficient, m2/s.
△P is the differential pressure of production, MPa.
is is the steam injection rate. w is the water density,
g/cm3.
According to the similarity criteria, we can get the
physical simulation parameters table based on the
actual parameters of reservoir and internal
parameters of 3D physical model, as shown in
Table 2.
2. 2 Experimental procedures
In this study, 3D physical model which included
CSS in vertical well model with extra-heavy oil and
CSS in horizontal well model with ultra-heavy oil
were conducted. We named Set 1 and Set 2 for the
3D experiments, respectively. The processes were
as follows:
Set 1:(1) The washed quartz sand and oil sample
were prepared firstly. (2) The oil and the sand were
mixed according to the designed proportion
(volume ratio=7:13). The clay was used to simulate
the capping bed covering the oil layer. The vertical
well was installed in the middle of the model. It
was covered by the 300 meshes filter to prevent
sand production.

Wei ZHAO, Huiqing LIU, Chuan LU, Jing WANG, Lin MENG and Ruihong ZHONG/ IJCESEN 5-1(2019)1-9
3
Table 2. Experimental parameters during different CSS
stages.
VERTICAL
WELL
HORIZONTA
L WELL
Parameter
Prot
otyp
e
Model
Prot
otyp
e
Mode
l
Basic parameters
Length of horizontal
well (m, cm) - - 150 30
Reservoir thickness
(m, cm) 16 10.24 3 6
Porosity (%) 31 35 27 35
Absolute permeability
(10-3μm
2)
1250 146000 1120 70500
Oil density (g/cm3)
0.97
09 0.9362
0.97
94
0.988
8
Initial oil saturation
(%) 70 100 65 100
Reservoir temperature
(°C) 25 25 25 25
Oil viscosity at 25°C
(mPa·s)
1671
5 10688
5240
5 50910
Steam temperature
(°C) 250 250 250 250
Steam quality 0.7 0.7 0.7 0.7
CSS stage
Steam injection rate
(t/d, ml/min) 80 401 170 28
Steam injection time
(d, min) 10 0.59 10 10
Soaking time (d, min) 4 0.24 3 1.73
Cycle increase rate
(%) 15 15 10 10
Production time (a,
min) 1 21.53 1/6 35.04
CSS
assisted
by gas
stage
single
injection
Gas injection rate (t/d,
ml/min) 2000 200 7000 700
Gas injection time (d,
min) 1 1 2 2
mixed
injection
Gas injection rate (t/d,
ml/min) 400 40 1400 140
Gas injection time (d,
min) 5 5 10 10
CSS
assisted
by VR
stage
single
injection
Liquid injection rate
(t/d, ml/min) 4.69 8.7 3.15 5.83
VR concentration
(wt.%) 0.5 0.5 0.4 0.4
mixed
injection
Liquid injection rate
(t/d, ml/min) 0.94 1.74 0.63 1.17
VR concentration
(wt.%) 0.5 0.5 0.4 0.4
VR concentration
(wt.%) 0.5 0.5 0.4 0.4
CSS assisted by gas-
VR co-injection stage
Gas injection rate (t/d,
ml/min) 400 40 1400 140
Liquid injection rate
(t/d, ml/min) 0.94 1.74 0.63 1.17
VR concentration
(wt.%) 0.5 0.5 0.4 0.4
Figure 1. Schematic diagram of the experimental setup
for the 3D experiments
During the process of filling the model with oil
sands, all the temperature and pressure transducers
were placed in the designed locations. After the
reservoir thickness reached the designed value
(10.24cm), the clay was used to fill the top capping
bed (3) Check the tightness of the model to prevent
oil leakage. The sealed model was pressurized by
nitrogen under 3MPa for 12h. The leakage of the
model was estimated based on the pressure
variation. (4) According to the designed
parameters, four displacement schemes were
carried out. The produced fluid was collected by the
measuring cylinder. When the oil-steam ratio is 0.1,
stop the experiments. Figure 2 shows the section
diagram of the vertical model. It displays the
Figure 2 Section diagram of vertical-well model in extra
heavy oil reservoir
Figure 3. The preparation process of vertical-well model
in extra heavy oil reservoir
internal situation of the model. Figure 3 shows the
preparation process of vertical-well model in extra
heavy oil reservoir.
Set 2:(1) The experimental preparation process
was exactly the same with Set 1 except the oil
samples and the well type. The oil was ultra-heavy
oil and the well was horizontal well with the length
of 30cm. (2) In this section, the reservoir thickness
was 6cm. The filling and sealing process were also
the same with Set 1. (3) There were also four
patterns to be used as the designed parameters
table. Figure 4 shows the section diagram of
horizontal-well model. Figure 5 shows the
preparation process of horizontal-well model in
ultra-heavy oil reservoir. The location of the
temperature measuring points was displayed
visually.
Figure 4. Section diagram of horizontal-well model in
ultra-heavy oil reservoir
Figure 5. The preparation process of horizontal-well
model in ultra-heavy oil reservoir
3. Results and discussion
3. 1 Experimental Results of Set 1

Wei ZHAO, Huiqing LIU, Chuan LU, Jing WANG, Lin MENG and Ruihong ZHONG/ IJCESEN 5-1(2019)1-9
4
CSS using vertical well in extra-heavy oil model
was conducted in Set 1, different injection fluids,
injection orders and injection patterns were applied
to study the effect of EOR. The results were as
follows:
(1) CSS Stage
As show in Figure 6, in the stage of CSS, the steam
expanded and moved upwards under the action of
gravity segregation which resulted in higher
temperature at the top of the reservoir and lower
temperature at the bottom of the reservoir. Figure
4a and 4b showed the direction of the section area.
Both of these represented the same situation of CSS
stage at the same time, just in different directions.
With the increase of CSS cycles, the steam
overlapping became more severe, leading to the
stronger heterogeneity of vertical and horizontal
expansion. At the end of CSS, the temperature of
top, middle and bottom layer were 68.1°C, 50.5°C
and 44.5°C, respectively. It can be seen that the
temperature difference was obvious.
(a)the direction of section A (b)the direction of section B
(c)section A (d)section B
Figure 6. Vertical distribution of temperature at the end
of CSS stage
Figure 7 shows the variation curves of
characteristic parameters including oil production
rate and cumulative oil-steam ratio during CSS
stage. At the initial stage of CSS, the oil saturation
around the well was high. Under the condition of
high-temperature steam, the heavy oil volume
expanded, and the viscosity reduced which led to a
high production rate. However, with the increase of
CSS cycles, the oil production rate decreased and
then remained stable. According to Figure 5, it can
be seen that the stable cumulative oil-steam ratio
was 0.16.
(a) Oil production rate curve (b) Cumulative oil-steam ratio curve
Figure 7. Variation curves of characteristic parameters
during CSS stage
(2) CSS Assisted by Gas Stage
Single injection process: according to the designed
scheme, single injection was first applied with
nitrogen injection first and then steam injection.
The fluid-acquisition-data indicated that the
incremental oil recovery factor was 6.19%. Figure
6(a) showed that the temperature of top, middle and
bottom layer were 64.9°C, 53.5°C and 46.5°C,
respectively. Compared with the temperature of
CSS stage, it can be seen that the temperature of
middle and bottom layers increased, on the
contrary, the top layer temperature decreased. It
indicated that nitrogen injection inhibited the steam
overlapping phenomenon because the gas reached
the top layer firstly and pushed the steam down
which promoted the vertical expansion of the steam
chamber. However, the effect on the horizontal
expansion of steam chamber was not significant.
Mixed injection process: after the single injection
process was finished, the mixed injection process
was conducted. The total recovery was 26.85%,
increased by 5.39% than last process. As show in
Figure 7(b), the heating area in horizontal direction
increased obviously and the steam overlapping was
further restrained compared with Figure 7(a). The
reason was that the mixture of N2 and steam
accelerated the process of heating, which was easier
for N2 and steam to migrate in the porous media
resulting in migration distance increased. Finally,
the mixed injection process promoted the horizontal
expansion of the steam chamber.
Figure 8 shows the variation curves of
characteristic parameters during CCS assisted by
N2. For the single injection process, the average oil
production rate was 1.61ml/min and the cumulative
oil-steam ratio reached 0.35. Also, the average oil
production rate decreased to 1.32ml/min but was
also high and the cumulative oil-steam ratio
remained stable. The results indicated that single
injection was more beneficial to the vertical
expansion of the steam chamber and had a stronger
effect on the drainage of N2. Besides, mixed
injection reduced the heat loss around the well and
increased the lateral expansion distance and sweep
area.
(a) single injection process
(b) mixed injection process
Figure 8. Vertical distribution of temperature at the end
of CSS assisted by gas

Wei ZHAO, Huiqing LIU, Chuan LU, Jing WANG, Lin MENG and Ruihong ZHONG/ IJCESEN 5-1(2019)1-9
5
(a) Oil production rate curve (b) Cumulative oil-steam ratio curve
Figure 9. Variation curves of characteristic parameters
during CSS assisted by N2 stage
(3) CSS Assisted by VR stage
Single injection process: in this process, VR was
injected before steam injection. At the end of single
injection process, the final recovery reached
31.98% which was 5.13% higher than the process
with gas stage. Figure 8(a) showed that, compared
with the N2 stage, the total sweep area decreased
especially at the bottom and middle layers. The
main reason was that the VR solution increased the
water storage around the well and prevented the
steam contacting with heavy oil directly which
resulted in higher condensing rate of steam and
heating loss.
Mixed injection process: in this process, the
mixture of steam and VR was injected. As shown in
Figure10(b), the temperature of the top, middle and
bottom layer were 69.6°C, 54.6°C and 44.8°C,
respectively. The total average temperature and
heating area were larger than that of single injection
process which indicated the heating loss was lower
than the single injection process.
Figure 11 shows the variation curves of
characteristic parameters during CCS assisted by
VR. The oil rates of two injection patterns were
1.46ml/min and 1.52ml/min, respectively, both of
which were higher than that of mixed injection of
N2-Steam. Meanwhile, the cumulative oil-steam
ratio remained stable at 0.3. Under the combined
effect of VR and high-temperature steam, the
viscosity of extra-heavy oil was notably decreased
leading to higher mobility. At the same time, the
emulsification of VR was significant, which
resulted in a higher oil production rate.
(4) CSS Assisted by Gas-VR co-injection stage
In this stage, the N2-VR co-injection with steam
was conducted.
(a) single injection process
(b) mixed injection process
Figure 10. Vertical distribution of temperature at the
end process of CSS assisted by VR
(a) Oil production rate curve (b) Cumulative oil-steam ratio curve
Figure 11. Variation curves of characteristic parameters
during the process of CSS assisted by VR stage
The final recovery was 40.89%, increased by
4.29% over the last stage. According to Figure 12,
the temperature of the top layer was lower than that
of VR injection stage. In addition, the emulsion
phenomenon was obvious in the photomicrograph
of production liquid which illustrated the effect of
VR still played a role. Also, the oil production rate
and cumulative oil-steam ratio showed a stable
trend, further explaining that more oil was
produced under the combined effect of gas and VR
even after many cycles.
Figure 12 Vertical distribution of temperature at the end
process of CSS assisted by Gas-VR co-injection stage
(a) Oil production rate curve (b) Cumulative oil-steam ratio curve
Figure 13. Variation curves of characteristic parameters
during CSS assisted by Gas-VR co-injection stage
Figure 14 displays the variation curves of
characteristic parameters of different liquid
injection for Set 1. It can be seen that the additive
of gas and VR can obviously increase the oil
production rate. The oil recovery was improved
significantly after the CSS process, the oil recovery
of which was just 15.26%. The incremental oil
recovery was 11.58%, 9.76%, 4.29% after gas
injection, VR injection and gas-VR co-injection in
turn and the final recovery was 40.89%. All of this
shows that gas-VR co-injection not only inhibited
steam overlapping, which promoted the horizontal
expansion of the steam chamber but also reduced
the viscosity of heavy oil significantly. More oil
was produced due to the gas expansion energy.
3.2 Experimental Results of Set 2
CSS using horizontal well in ultra-heavy oil model
Wei ZHAO, Huiqing LIU, Chuan LU, Jing WANG, Lin MENG and Ruihong ZHONG/ IJCESEN 5-1(2019)1-9
6
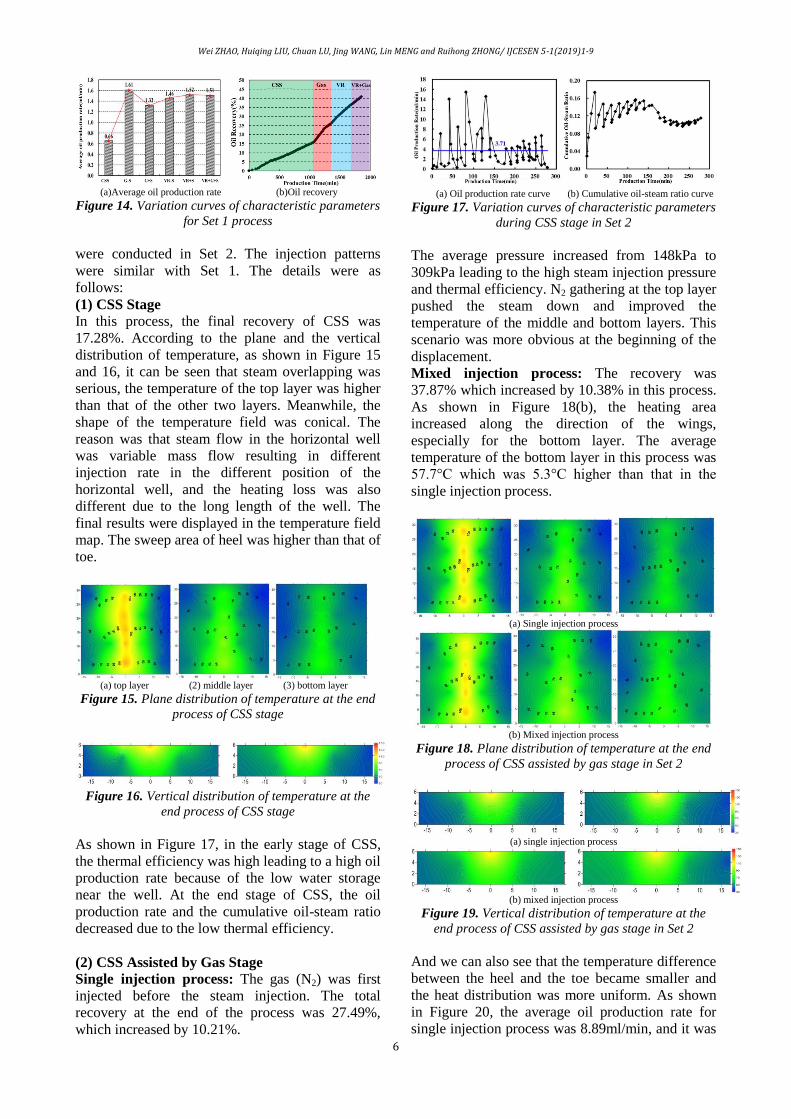
(a)Average oil production rate (b)Oil recovery
Figure 14. Variation curves of characteristic parameters
for Set 1 process
were conducted in Set 2. The injection patterns
were similar with Set 1. The details were as
follows:
(1) CSS Stage
In this process, the final recovery of CSS was
17.28%. According to the plane and the vertical
distribution of temperature, as shown in Figure 15
and 16, it can be seen that steam overlapping was
serious, the temperature of the top layer was higher
than that of the other two layers. Meanwhile, the
shape of the temperature field was conical. The
reason was that steam flow in the horizontal well
was variable mass flow resulting in different
injection rate in the different position of the
horizontal well, and the heating loss was also
different due to the long length of the well. The
final results were displayed in the temperature field
map. The sweep area of heel was higher than that of
toe.
(a) top layer (2) middle layer (3) bottom layer
Figure 15. Plane distribution of temperature at the end
process of CSS stage
Figure 16. Vertical distribution of temperature at the
end process of CSS stage
As shown in Figure 17, in the early stage of CSS,
the thermal efficiency was high leading to a high oil
production rate because of the low water storage
near the well. At the end stage of CSS, the oil
production rate and the cumulative oil-steam ratio
decreased due to the low thermal efficiency.
(2) CSS Assisted by Gas Stage
Single injection process: The gas (N2) was first
injected before the steam injection. The total
recovery at the end of the process was 27.49%,
which increased by 10.21%.
(a) Oil production rate curve (b) Cumulative oil-steam ratio curve
Figure 17. Variation curves of characteristic parameters
during CSS stage in Set 2
The average pressure increased from 148kPa to
309kPa leading to the high steam injection pressure
and thermal efficiency. N2 gathering at the top layer
pushed the steam down and improved the
temperature of the middle and bottom layers. This
scenario was more obvious at the beginning of the
displacement.
Mixed injection process: The recovery was
37.87% which increased by 10.38% in this process.
As shown in Figure 18(b), the heating area
increased along the direction of the wings,
especially for the bottom layer. The average
temperature of the bottom layer in this process was
57.7°C which was 5.3°C higher than that in the
single injection process.
(a) Single injection process
(b) Mixed injection process
Figure 18. Plane distribution of temperature at the end
process of CSS assisted by gas stage in Set 2
(a) single injection process
(b) mixed injection process
Figure 19. Vertical distribution of temperature at the
end process of CSS assisted by gas stage in Set 2
And we can also see that the temperature difference
between the heel and the toe became smaller and
the heat distribution was more uniform. As shown
in Figure 20, the average oil production rate for
single injection process was 8.89ml/min, and it was

Wei ZHAO, Huiqing LIU, Chuan LU, Jing WANG, Lin MENG and Ruihong ZHONG/ IJCESEN 5-1(2019)1-9
7
5.05ml/min for mixed injection process, both of
which were higher than that of CSS process. The
cumulative oil-steam ratio remained as 0.25 at the
end of the stage. It demonstrated that the addition
of nitrogen was an effective way to improve the
energy of the reservoir and oil displacement, which
was similar to the result of Set 1.
(a) Oil production rate curve (b) Cumulative oil-steam ratio curve
Figure 20. Variation curves of characteristic parameters
during CSS assisted by gas stage in Set 2
(3) CSS Assisted by VR stage
Single injection process: VR was first injected
before the steam injection. The recovery was
42.87%, which increased by 5.00% compared to the
previous stage. As shown in Figure 21(a),
compared with the previous stage of N2, the
temperature and the steam chamber decreased. The
reason is that the injection volume of VR was
smaller than that of N2, so the pressurizing effect
was not obvious. In addition, the water storage
around the well increased leading to a higher
heating loss. Thus, the thermal efficiency was
affected.
Mixed injection process: the final recovery was
46.45% at the end of this process. Compared with
the previous process, the average temperature of the
top, middle and bottom layer were 67.6°C, 61.7°C
and 58.2°C, respectively, which increased
dramatically. It indicated that the mixed injection
process reduced the heating loss. The horizontal
expansion was more effective and uniform
according to Figure 22. As shown in Figure 23, the
oil production rate of single injection was
5.29ml/min, slightly higher than that of mixed
injection. Considering the difference of heating
area, it indicated that the degree of reaction
between VR and heavy oil for single injection
process increased, and it was important for the large
water storage situation around the well after many
cycles of CSS. In the mixed injection process, the
sweep area did not increase but the oil production
rate maintained as a high value which indicated that
VR improved the displacement efficiency of near
wellbore area.
(4) CSS Assisted by Gas-VR Co-injection Stage
In this process, N2, VR and steam were injected
into the model simultaneously. At the end of the
stage, the recovery was 59.29%, which increased
(a) single injection process
(b) mixed injection process
Figure 21. Plane distribution of temperature at the end
process of CSS assisted by VR stage in Set 2
(a) single injection process
(b) mixed injection process
Figure 22. Vertical distribution of temperature at the
end process of CSS assisted by VR stage in Set 2
(a) Oil production rate curve (b) Cumulative oil-steam ratio curve
Figure 23 Variation curves of characteristic parameters
during CSS assisted by VR stage in Set 2
by 9.42%. At the end of this process, according to
the distribution of temperature, the average
temperature was high and the sweep area expanded
to the sides of the model. The conical shape caused
by the heating loss and variable mass flow was not
obvious, especially for the top and middle layers.
This phenomenon was more clearly in the vertical
distribution of temperature, as shown in Figure 25.
It indicated that gas-VR co-injection inhibited
steam overlap, promoting the horizontal expansion
of the steam chamber, and reduced the viscosity of
heavy oil significantly. The gas expansion pushed
more oil out of the reservoir. Both the effect of VR
and N2 were fully-developed. Figure 26 shows the
variation curves of characteristic parameters of
different liquid injection for Set 2. It indicated the
average oil production rate and oil recovery of
different injection stage. It can be seen that the
additive of gas can improve the oil production rate
significantly which was contributed to the supplied-
energy effect of the injection gas.

Wei ZHAO, Huiqing LIU, Chuan LU, Jing WANG, Lin MENG and Ruihong ZHONG/ IJCESEN 5-1(2019)1-9
8
Figure 24. Plane distribution of temperature at the end
process of CSS assisted by N2-VR Co-injection stage in
Set 2
Figure 25. Vertical distribution of temperature at the
end process of CSS assisted by N2-VR Co-injection stage
in Set 2
For the thin reservoirs of heavy oil with horizontal
well, the horizontal expansion of the steam
chamber was the main contradiction affecting the
development effect. The added gas helped the
horizontal expansion of steam. Based on the
produced liquid, oil-in-water (O/W) emulsions
generated under the combined-effect of gas and VR
were more dispersive, compared with the single
injection. According to Figure 26(b), the oil
recovery of CSS was 17.28%, the incremental oil
recoveries were 20.59%, 8.57%, 8.8% after gas
injection, VR injection and gas-VR co-injection in
turn above and the final recovery was 55.29%. The
effects of the compound system still worked and
increased the oil recovery after different injection
patterns.
(a) Average oil production rate (b)Oil recovery
Figure 26. Variation curves of characteristic parameters
for Set 1 process
4. Conclusions
A series of experiments were conducted to
investigate the effect of gas and VR injected with
steam during the CSS stage. The conclusions are as
follows:
The compressibility of nitrogen can improve
the reservoir energy. Due to the gravity
segregation, the nitrogen can occupy the upper
section which inhibits the steam overlapping.
Also, it can promote the vertical expansion of
the steam chamber and increase the swept area.
The injected VR solution can reduce the
viscosity of heavy oil and change the scenario
of the trapped oil near wellbore area
especially. O/W emulsion is produced when
the mobility gets stronger.
It is proved that steam injection assisted by
gas-VR is more beneficial to enhance the
thermal recovery.
Different injection orders have an impact on
the recovery and sweep situation.
Acknowledgement
This work was financially supported by the
National Science and Technology Major Project of
China(2016ZX05031003004)
Nomenclature
CSS cyclic steam simulation,
EOR enhanced oil recovery,
SOR steam-oil ratio,
VR viscosity reducer,
ISCO the type of pump used in the experiments.
References
[1] C.A. Connally, Jr., J.E. Marberry. Steam Flood Pilot,
Nacatoch Sand-Troy Field, Arkansas. SPE-4758-
MS presented at Improved Oil Recovery
Symposium of the Society of Petroleum Engineers
of AIME: 22–24 April, (1974) Tulsa, Okla, USA.
DOI: http://dx.doi.org/10.2118/4758-MS
[2] Cai, Y. C., et al. A study on the technology of steam -
hot water - nitrogen compound drive after steam
channeling in steam flooding. Applied Mechanics
& Materials, 316-317, 854-859. (2013) DOI:
10.4028/www.scientific.net/AMM.316-317.854.
[3] Decker, A. M., & Flock, D. L. Thermal stability and
application of emulsion composed blocking agents
for steamflooding. Journal of Canadian Petroleum
Technology, 27(4), 69-78.
[4] Erincik, M. Z., Qi, P., Balhoff, M. T., & Pope, G. A.
(2017, October 9). New Method to Reduce Residual
Oil Saturation by Polymer Flooding. Society of
Petroleum Engineers. DOI:10.2118/187230-MS
[5] Gates, I. D., & Chakrabarty, N. Design of the steam
and solvent injection strategy in expanding-solvent
steam-assisted gravity drainage. Journal of
Canadian Petroleum Technology, 47(9), (2008), 12-
20. DOI: https://doi.org/10.2118/08-09-12-CS
[6] Jha, K. N. (1986). A laboratory study of heavy oil
recovery with carbon dioxide. Journal of Canadian
Petroleum Technology, 25(2), 54-63. (1988) DOI:
https://doi.org/10.2118/SS-85-04.
[7] Liu, Q., Dong, M., & Ma, S. Alkaline surfactant
flood potential in western Canadian heavy oil
reservoirs. SPE/doe Symposium on Improved Oil
Recovery. (2006) DOI:
https://doi.org/10.2118/99791-MS

Wei ZHAO, Huiqing LIU, Chuan LU, Jing WANG, Lin MENG and Ruihong ZHONG/ IJCESEN 5-1(2019)1-9
9
[8] Lu, C., Liu, H., Liu, Q., Lu, K., & Wang, L. Research
on the Effect of Non-Condensable Gas and
Viscosity Reducer for Better SAGD Performance.
(2014) DOI: https://doi.org/10.2118/170026-MS.
[9] Lu, C., Liu, H., & Zhao, W. Visualized study of
displacement mechanisms by injecting viscosity
reducer and non-condensable gas to assist steam
injection. Journal of the Energy Institute, 90(1).
(2015) DOI:
https://doi.org/10.1016/j.joei.2015.10.005
[10] Lu, C., Liu, H., Zhao, W., Lu, K., Liu, Y., & Tian,
J., et al. Experimental investigation of in-situ
emulsion formation to improve viscous-oil recovery
in steam-injection process assisted by viscosity
reducer. Spe Journal, 22(1). (2017) DOI:
https://doi.org/10.2118/181759-PA.
[11] Lyu, X., et al., "Visualized study of
thermochemistry assisted steam flooding to
improve oil recovery in heavy oil reservoir with
glass micromodels." Fuel 218: 118-126. DOI:
https://doi.org/10.1016/j.fuel.2018.01.007
[12] Miller, J. S., & Jones, R. A. A Laboratory Study to
Determine Physical Characteristics of Heavy Oil
After CO2 Saturation. SPE/DOE Enhanced Oil
Recovery Symposium. Society of Petroleum
Engineers. (1981) DOI:
https://doi.org/10.2118/9789-MS
[13] Pujol L and Boberg T C. Scaling accuracy of
laboratory steam flooding models. Paper SPE 4191
Presented at the SPE California Regional Meeting,
Bakersfield, California. (1972) DOI:
https://doi.org/10.2118/4191-MS
[14] Qi, P., Ehrenfried, D. H., Koh, H., & Balhoff, M. T.
Reduction of Residual Oil Saturation in Sandstone
Cores by Use of Viscoelastic Polymers. Society of
Petroleum Engineers (2017). DOI:10.2118/179689-
PA
[15] Rojas, G. A. Dynamics of subcritical co2/brine
floods for heavy-oil recovery. SPE Reservoir
Engineering, 3(1), (1988) 35-44. DOI:
https://doi.org/10.2118/13598-PA.
[16] S.R. Upreti, A. Lohi, R.A. Kapadia, et al., Vapor
extraction of heavy oil and bitumen: a review,
Energy Fuels 21 (3) (2007) 1562-1574. DOI:
10.1021/ef060341j
[17] Wang, Y., Ge, J. J., Jiang, P., Zhang, G. C., & Du,
Y. Mechanism and Feasibility Study of Nitrogen
Assisted Cyclic Steam Stimulation for Ultra-Heavy
Oil Reservoir. (2013) DOI:
https://doi.org/10.2118/165212-MS
[18] Zhang Xia, Zhang Xialin. Optimization Study of
Production-Injection Ratio for Steam Flooding.
IPTC-16458-MS presented at International
Petroleum Technology Conference, (2013)26-28
March, Beijing, China. DOI:
http://dx.doi.org/10.2523/16458-MS