experimental determination of the pull-out strength of
TRANSCRIPT

Marquette Universitye-Publications@Marquette
Master's Theses (2009 -) Dissertations, Theses, and Professional Projects
Experimental Determination Of The Pull-OutStrength Of Cast-In Lifting Inserts In PrecastHollow-Core PlankSalvador MurraMarquette University
Recommended CitationMurra, Salvador, "Experimental Determination Of The Pull-Out Strength Of Cast-In Lifting Inserts In Precast Hollow-Core Plank"(2013). Master's Theses (2009 -). Paper 195.http://epublications.marquette.edu/theses_open/195

EXPERIMENTAL DETERMINATION OF THE PULL-OUT STRENGTH OF CAST-IN LIFTING INSERTS IN PRECAST
HOLLOW-CORE PLANK
by
Salvador Murra
A Thesis submitted to the Faculty of the Graduate School, Marquette University,
In Partial Fulfillment of the Requirements for The Degree of Master of Science
Milwaukee, Wisconsin
May 2013

i
ABSTRACT EXPERIMENTAL DETERMINATION OF THE PULL OUT STRENGTH
OF CAST-IN LIFTING INSERTS IN PRECAST HOLLOW-CORE PLANK
Salvador Murra
Marquette University, 2013
Hollow-Core precast plank is a commonly used building component. The common method to lift and erect these planks is through the use of slings. This method has several drawbacks and has spurred on the current effort to investigate and determine the capacity of lifting inserts post-installed into the top of precast hollow-core planks. The insert that was studied is the P-52 “Swift Lift” Insert supplied by Dayton-Superior.
Physical testing of 16 inserts was done to aid in determining the tensile capacity of the insert. The insert was a 3/4" diameter steel insert by 5 1/2" long and it was post installed using non-shrink grout into the top of a hollowcore plank shortly after it was extruded. A literature review was also performed to further analyze the insert and to formulate analytical expressions capable of reliably predicting this tensile (pull-out) capacity of the insert.
The testing resulted in an average measured tensile capacity of 13.8 kips with a standard deviation of 1.85 kips. Our predictive model gave us a capacity of 12.33 kips which is within one standard deviation from the average measured capacity. A factor of safety of 2.2 was also calculated and developed. When we apply our factor of safety to our measured tensile capacity we obtain a recommended capacity of 6.2 kips.

ii
TABLE OF CONTENTS
ABSTRACT.......…………………………………………………………………………..i
TABLE OF CONTENTS……….………………………………………………………...ii
CHAPTERS
I. INTRODUCTION………………………………………………………….......1
II. LITERATURE REVIEW & SYNTHESIS……………………………………6
III. EXPERIMENTAL TESTING………………………………………………21
IV. EXPERIMENTAL RESULTS & DISCUSSION…………………………...34
V. CONCLUSIONS & RECOMMENDATIONS FOR FUTURE WORK…….49
BIBLIOGRAPHY……………………………………..………………………………....53
APPENDIX
A. SPANCRETE PLANK DESIGN TABLE…………………………………...54
B. DAYTON-SUPERIOR PRODUCT HANDBOOK [PAGE 26]……………..55
C. DAYTON-SUPERIOR PRODUCT HANDBOOK [PAGE 28]……………..56

1
CHAPTER 1
INTRODUCTION
1.1 Background Information
Hollow-Core precast plank is a versatile and commonly used building component. Its
uses range from floor systems in office buildings, to speed-ramps in parking structures, to
roof systems in stair towers. They are either four-feet or eight-feet wide and can span in
length to greater than thirty feet. Photos of the precast planks product are shown in
Figure 1.1.
As the name implies, the plank cross-section contains cores or voids normally at
four inches on center that run the entire length of the member. These voids are a great
weight-saver, but they also make it extremely difficult to cast any inserts into the
member. In some building applications, the voids are used for electrical and mechanical
runs, or are insulated to reduce sound transmission or heat loss.
Figure 1.1 Yarded Precast Hollow-core Plank Figure 1.2 Hollow-core Plank Sling-lifted in Yard
Traditionally, the precast planks are reinforced, extruded and left to cure
overnight. The next morning, the plank is saw-cut in the form desired, vacuum-lifted

2
onto a trailer, then sling-lifted into the storage yard. During the erection process, the
erector will sling the plank off of the truck, lift it as close as possible to its final position,
and remove the slings. The erector must then “muscle” the plank into place using
crowbars. The slinging process is shown in Figure 1.2. This process becomes extremely
difficult for the last few planks in a floor system and becomes even more time consuming
as the plank grows in length and width. The erection of precast hollow core plank in this
way can lead to danger on the job site with the resulting increased potential for injury.
There is significant opportunity and need to develop a more efficient and safer
method to lift and set hollow-core concrete planks that do not require the use of slings or
crowbars to install the precast hollow-core plank members. At present, the most viable
option and the focus of this thesis is the use of P-52 “Swift-Lift” Inserts by Dayton
Superior installed into the plank using non-shrink grout after casting (i.e. post-installed).
“Swift-Lift” inserts are currently an industry-wide method to lift, tilt and erect precast
concrete wall panels, spandrels and solid concrete labs. The inserts are small, extremely
easy to install, and have excellent tension and shear capacities when installed in solid
concrete components. Their use in hollow-core precast planks remains uncertain, relative
to their use in solid panels, due to the uncertainty with respect to the capacity of the
inserts cast into the top of the cells of the hollow-core plank. Examples of the Dayton
Superior product and the lifting mechanism are given in Figures 1.3 through 1.5.
The Dayton Superior inserts have several advantages. All of the inserts use the
same universal attachment clasp (Figure 1.5) which allows erectors to use four to eight
picking clasps to connect their rigging lines to erect all of the precast panels in a project,
making the use of this insert extremely economical. After installation, the insert head can

3
be easily covered up or hidden if required. Using this insert to lift hollow-core planks
would have additional benefits, since the inserts would be installed on the top face of the
member and there would be no straps to get in the way. The plank can then be dropped
into its final position, released from the rigging and connected to the supporting structure.
This reduces the effort and time required to install each plank. Since the inserts are
installed on the top face of the plank, the picking head can often be covered up by the
topping, flooring or roofing material installed on top of the plank taking minimal effort
during construction.
Figure 1.3 Swift-Lift Anchor Figure 1.4 Picking head of installed Swift-Lift Anchor
Figure 1.5 Insert with engaged picking clasp

4
1.2 Objectives of Thesis
The first objective of this thesis is to experimentally evaluate the tensile (pull-out)
capacity of a 3/4 inch diameter by 5 1/2 inch long “Swift-Lift” headed stud insert, post-
installed into precast hollow core planks using non-shrink grout. The second objective is
to formulate analytical expressions capable of reliably predicting this tensile (pull-out)
capacity of the inserts.
The present research effort includes the design of experimental fixtures which
were fabricated and installed in the Marquette University Engineering Materials and
Structural Testing Laboratory (EMSTL) along with an MTS actuator mounted to a steel
frame to pull the insert out of the plank. The recorded failure load and deflection test data
collected is subjected to a statistical evaluation and compared to the predictive equations
developed from a review of the existing literature. A recommended capacity will then be
derived along with an adequate safety factor for use in the field.
1.3 Outline of Thesis
To achieve the objectives set forth in the previous section, we begin with a literature
review and synthesis in Chapter 2. A discussion of the capacities from the handbook and
limitations of the Dayton-Superior Product handbook is presented, along with a summary
of the design assumptions and procedures present in several versions of the Precast
Concrete Institute Design Manual. Finally, the development of predictive equations for
pull-out strength is discussed in detail.
Chapter 3 focuses on experimental testing. The insert installation procedure is
presented followed by a description of all of the testing equipment and a design check of

5
all of the testing equipment components. The chapter ends with an explanation of the
experimental testing procedure used to perform this research.
Chapter 4 presents the experimental results and a description of the failure
mechanisms that were observed during testing. A summary of the measured tensile
capacities of all of the inserts tested is provided along with the measured concrete and
grout strengths. Finally, a discussion of a statistical analysis performed on the relevant
data is presented.
The final chapter presents the findings and conclusions resulting from the
research. An outline of the recommendations for any potential future research finishes
off the chapter to allow for the potential expansion of the current effort to extend or fine-
tune the findings described herein.

6
Chapter 2
Literature Review and Synthesis
2.0 Introduction
This chapter discusses the research, data and design material that is available to precast
concrete manufacturers to size, install and use P-52 inserts in precast members. It also
includes a discussion of the assumptions made to analyze the insert and the development
of existing equations to predict the tensile capacity of the insert in hollow-core planks.
The literature review will discuss the recommendations presented in the Dayton-
Superior Product Handbook and how they apply to the situation currently under
consideration. A review of the research efforts used as the basis for PCI design methods
will follow along with a discussion of the design procedure presented in several editions
of the PCI design manual. A detailed discussion and development of the predictive
equation for pull-out strength will follow and conclude the chapter.
2.1 Literature Review
We will begin the literature review by exploring the descriptions and design
recommendations presented in the manufacturer’s product handbook regarding the design
and sizing of inserts cast in concrete. All of the capacities provided in the handbook for
these inserts were developed from testing done by an independent company contracted by
Dayton-Superior. While no research has been done with inserts post-installed in hollow-
core concrete planks, some insight might be obtained from the capacities, illustrations,
and data presented in the manual.

7
Dayton-Superior Product Handbook (Dayton 2011)
Dayton-Superior, along with other insert manufacturers, provide precast suppliers with a
handbook describing their available inserts as well as their applications, installation
procedure and insert capacities. As mentioned above, the capacities are determined
through testing done by an independent testing laboratory and have a safety factor
applied to them. The prescribed minimum concrete strength and minimum edge distance
used during testing is presented as are any other reduction factors to be applied when
sizing the necessary insert.
The P-52 insert is part of the “Swift-Lift” line of lifting inserts offered by Dayton-
Superior. The shape of the insert and the fact that there are no coils and no welds
necessary to use it, allows industry erectors to attach to and release from any precast
piece quickly and efficiently. The attachment hardware can be re-used multiple times and
the carbon steel insert complies with all of OSHA’s safety requirements to achieve a
safety factor of four.
From the chart presented in the product handbook (see Appendix B), the exact
dimensions of the insert are as follows. Figure 2.1 is a schematic of the insert. The overall
length of the insert is 5 1/2 inches. Once it is installed, the insert is set down from the top
of the plank 1/2 inch, making the overall embedment of the insert approximately six
inches. This is achieved by installing the insert with its round plastic recess plug flush
with the top of the plank.
Following the recommendations contained in the charts and descriptions
presented in the handbook, the expected tensile capacity of the insert is 7,400 lbs, which
after removing the 4 to 1 safety factor gives you an ultimate capacity of 29,600 lbs. The

8
minimum edge distance required to achieve this load is 17 inches. In the case considered
in this effort, the maximum edge distance (de1) is around 8 inches and the minimum (de2)
is 2 7/8 inches. Figure 2.2b is a schematic of the insert with relation to its edge distances.
Figure 2.1 P-51 Insert sketch & dimensions
Comparing the edge distances discussed above, it is obvious that the ultimate
capacity presented in the handbook likely would not apply. If an insert has a smaller
edge distance than what is required, the insert has much less concrete to help resist any
load applied to it; therefore the ultimate capacity of the insert is much less. If this insert
were a coil insert, Dayton-Superior provides a chart with reduction factors to apply to the
base capacity when sizing the insert to account for small edge distances. Unfortunately,
no factors are provided for the P-52 inserts considered in the present study. The
handbook does provide a chart with the effective tensile capacity of inserts cast at the top

9
of thin solid concrete walls. This case could be applicable to the insert embedded in
hollow-core plank, but again, no data is provided for an insert of similar size. Due to the
lack of sizing information in the Handbook (Dayton 2011), additional research and
testing is necessary to safely use these inserts in precast hollow-core planks.
All of the schematics and technical information provided in the manual refer to an
expected failure in the form of a shear cone normally seen in headed anchor studs cast in
solid concrete. Taking into account the shape of the insert, the insert material and the
application, a very important assumption is be made in developing design/predictive
equations: the inserts act as headed anchor studs (HAS) embedded in concrete; therefore,
HAS design equations can be used to model the behavior and estimate the tensile
capacity of these inserts. A shear cone is going to be used to analytically estimate the
pull-out strength of the insert. Developing a shear-cone analysis procedure and then
experimentally evaluating predictive equations for strength based upon these procedures
is the goal of the present thesis effort.
2.2.1 PCI Design Handbook
To better understand how to develop an analytical procedure consistent with the common
shear-cone model, the Precast/Prestressed Concrete Institute (PCI) Design Handbook was
consulted. The handbook is currently in its seventh edition, but focus will be placed on
the fourth edition and on the sixth edition for reasons that will be explained in what
follows. At the time the fourth edition was published in 1992, very little research had
been done in the area of headed anchor stud (HAS) tensile and shear strength. The PCI
presented at that time an article with a design procedure for welded-headed studs cast in
unconfined concrete (Shaikh and Yi 1985). The authors of the article tested several

10
headed studs in tension and in shear. Forces directed toward the edge and parallel to the
edge of the concrete it was cast in were considered. They also noted the different effects
that groups of studs had on both the tensile and shear capacities of the studs. As
mentioned before, the design equations presented in the fourth edition were taken exactly
from this article without any changes made to them. For purposes of this study, the only
equation used is the one pertaining to the tensile capacity of a single headed anchor stud.
Between the fourth and fifth editions, additional research was done and the PCI
decided to make some changes to the design equations presented in the fourth edition.
While no problems, failures or any other issues had been reported, PCI decided to reduce
the shear capacity equations from previous editions, and the equation for the tensile
capacity of a group of HAS was reduced by about a third to better represent the findings
in the research. Further discussion of these changes can be found in (PCI 1999). The
tensile capacity equations for a single headed anchor stud were left unchanged; therefore
for the purposes of this effort, the fourth and fifth editions are the same.
By the time of the printing of the sixth edition in 2004, a great deal of research
had been done on the subject, and a completely new and much more conservative set of
equations were presented. While the PCI emphasizes that there have been no reported
incidences of structural failures using any of the previous recommended design
equations, they decided to make changes so that their designs would comply with the
ACI code requirements (ACI 2005). Therefore, the tensile equations in the sixth edition
are based on the equations and recommendations of ACI 318-05 Appendix D. As a result,
the calculated design capacity now includes several parameters that were not included in
previous design equations. These will be discussed in detail later in the chapter. The

11
shear capacities for this edition of the PCI manual do not follow the equations of the ACI;
instead they are developed using results from testing based on the 5% fractile of the
individual anchor strength. Our effort only focuses on the tensile strength, therefore, the
shear capacity and the basis of this testing will not be discussed. The headed anchor stud
design calculations for both shear and tensile capacity were left unchanged in the 7th
edition.
The design equations from the fourth edition and the sixth edition will be
discussed and explained in detail in the following sections.
Fourth and Fifth Edition (PCI 1992)
In the fourth and fifth editions of the PCI Design Handbook the design equations are
based on the assumption that tensile failure of the headed anchor stud will be based on
the shape of a truncated failure cone with a forty-five degree shear plane starting at the
outer edge of the foot of the stud. See figure 2.2a for a picture of this failure cone. The
design methodology for all PCI equations is to have (whenever possible) a failure mode
in which yielding precedes total failure. The reason for this is to have a “warning” of
impending failure to minimize any potential loss of life and allowing for the possibility of
the removal of any excessive loads to maintain the stability of the structure. In the design
of headed anchor studs, the element that should be designed to yield is the steel stud.
Unfortunately, due to the limitations of concrete, the limited embedment length, and the
ever-increasing need for smaller edge distances, the design of headed anchor studs is
more often than not governed by concrete shear failure.

12
Figure 2.2(a) Concrete surface area of failure cone. (PCI 1992)
Figure 2.2(b) Plan View of Plank
Using the equations from the fourth edition, the design tensile strength of a
headed anchor stud with the same dimensions as the insert we are testing would be
determined as follows. First, the surface area of the failure surface needs to be
calculated. Using the equation presented in Figure 2.2(a), the surface area of the
truncated cone is given by:

13
√2 ∗ ∗ ∗ (2.1)
where le equals the effective embedment length and dh equals the foot diameter.
The next step is to calculate the edge reduction factors. In our case we will have
to calculate two different factors, one for the 8 inch effective edge distance (de1) and one
for an effective edge distance (de2) equaling 2 7/8 inches. The reduction factor is a ratio
of the effective edge distance over the effective embedment length of the insert and
cannot be greater than one:
1 (2.2)
1 (2.2a)
Finally, the third step is to calculate the tensile capacity.
∗ ∗ ∗ 2.8 ∗ ∗ ′ (2.3)
where is a light weight concrete factor, and f’c is the concrete unconfined compression
strength in pounds per square inch (psi).
Filling in all of the equations for the insert considered results in the following:
√2 ∗ 6" ∗ ∗ 6" 1.875" 209.93
8"/6" 1.3333 1 ∴ 1
2.875"/6" 0.48
1 ∗ 0.48 ∗ 209.93 ∗ 2.8 ∗ 1 ∗ √3000 15,454
It is important to note that in normal designs, the tensile capacity is multiplied by
an additional factor (Ø = 0.85) to give the design capacity. The failure load (strength
limit state) is being computed, so the phi factor does not need to be applied.

14
Sixth Edition (PCI 2004)
The goal of the design methodology in the sixth and seventh edition is the same as the
fourth edition, but the assumptions and equations used to achieve this are now completely
different. In this edition, the design of the tensile strength of headed anchor studs is
divided into three failure modes; breakout [Ø Ncb ], pullout [Ø Npn] and side-face blowout
[Ø Nsb]. The smallest of these three modes will control the capacity of the anchor.
Additional discussion of the failure modes, beyond of what is discussed below, is
available in (PCI 2004) and the resources therein.
The concrete breakout strength [Ncb] is usually the most critical and is very
similar to the failure mode that is discussed in the fourth edition. One critical difference
though, is the fact that the assumed failure angle is 35 degrees from the horizontal. The
equation for the concrete breakout strength is as follows:
∗ ∗ ∗ Ψ , (2.4)
Where the breakout strength coefficient is equal to:
3.33 ∗ ∗ (2.5)
λ is the light weight concrete factor, f’c is the concrete strength and hef is the effective
embedment depth of the stud. If the maximum edge distance of the anchor is less than hef
divided by 1.5, then the effective embedment depth will be limited to hef divided by 1.5.
An is the projected surface area for the stud. Ccrb is the concrete cracking factor, usually
1.0 and Ψed,N is the edge distance factor. The equation for Ψed,N is;
Ψ , 0.7 0.3 ,
. 1.0 (2.6)

15
The concrete pullout strength [Npn] is a measure of the behavior of the bearing of
the stud head against the concrete. The equation used to predict this strength is,
11.2 ∗ ∗ ′ ∗ (2.7)
Abrg is the bearing area of the stud head that is in contact with the concrete while tension
is applied, and Ccrp is the concrete cracking factor, usually 1.0.
There are two considerations for the side-face blowout strength [Nsb]. If the
smallest edge distance is less than forty-percent of the effective embedment depth
(de1<0.4hef), then
160 ∗ ∗ √ ∗ √ ′ (2.8)
If the stud is located at a perpendicular distance (de2) that is less than three times the
smallest edge distance (de1), then the above equation is multiplied by: 1 /4, where
the ratio of de2 to de1 is between 1 and 3.
Evaluating the three limit states for the inserts and configuration considered in
this research effort results in the following:
-Concrete Breakout Strength:
6"8"1.5
5.33" ∴ 5.33"
3.33 ∗ 1.0 ∗3,0005.33"
79.0
2.875" 2.875" ∗ 8" 8" 92
Ψ , 0.7 0.32.875"
1.5 ∗ 5.33"0.808
79.0 ∗ 92 ∗ 1 ∗ 0.808 5,873lbs

16
-Concrete Pullout Strength:
11.2 ∗ ∗ 1.875" 0.75" ∗ 3,000 ∗ 1.0 118,752
-Side-Face Blowout Strength:
In the case we are studying, de1 equals 2.875” and de2 equals 8”.
160 ∗ 2.875 ∗ ∗ 1.875" 0.75" ∗ √3000 ∗1 8
2.8754
44,765
As previously discussed, the controlling tensile capacity of the headed anchor stud
is the minimum value of the three calculated failure modes that are discussed in the sixth
and seventh edition of the PCI manual. The minimum of these gives us a tensile capacity
of the stud of 5.9 kips governed by the breakout strength of the stud. As in the 4th edition
of the PCI, this value would be multiplied by a phi factor, in this case equaling 0.75, but
since we require the failure capacity of the HAS, the safety factor will be omitted.
2.2 Predictive Equation for Pull-Out Strength
Comparing the results from the fourth edition (PCI 1992) and sixth edition (PCI 2004),
several observations can be made. First and more importantly, there is a 260% difference
in the capacities obtained from these two design methodologies. The 5,900 lb capacity
obtained from the sixth edition seems very low compared to the 15,000 lb capacity from
the fourth edition. Comparing these two numbers to the unreduced capacity of over
29,000 lbs obtained from the Dayton Superior manual, it will be assumed that the results
obtained following the design methodology of the 4th edition are more accurate than the
6th edition for obtaining the true capacity of the inserts.
One can compare results to some values provided by the Dayton Superior manual.
Figure 2.4 (Dayton 2011) illustrates the capacity of a 4-ton by 9 1/2” long insert cast into

17
the top edge of thin precast walls at various distances from the corner. The actual
minimum edge distance of the insert tested in this study is 2 7/8”. For the purposes of this
discussion, we will use de equal to 3”. Using the smallest corner distance of 10”, a
concrete strength of 4500 psi and a 6” effective wall thickness, the safe tensile capacity
equals 4,000 pounds. Taking away the four-to-one safety factor and ignoring the
difference in concrete strengths, the insert capacity equals:
4,000 ∗ 4 16,000
Repeating the same procedure for the 15” corner distance, we get a capacity of
nineteen thousand pounds [4 * 4,800 lbs = 19,200 lbs]. Comparing these capacities to the
capacity calculated using the fourth edition (Eq. 2.3), it can be seen that the previous
assumptions of treating the insert as a headed anchor stud are correct. The insert in the
plank, is cast into a 16” long section of grout, 16” away from the edge of the plank;
therefore, the actual corner edge distance could be argued to be between 8” and 16”.
Figure 2.3 Illustration, P-52 Insert Cast into top of thin walls. [Dayton 2011, p.31]

18
Figure 2.4 Tensile Safe Working Load for Anchors Cast in Thin Walls (f’c= 4.5 ksi) [Dayton 2011, p.32]
To create a predictive equation, the equations from the fourth edition of the PCI
HAS design (PCI 1992) will be adopted. The same design methodology is being used
here with an exception. Instead of using 45 degrees as the assumed angle of the pullout
cone, we will run the calculations using 30, 35, 40, 45, 50, 55 and 60 degrees. The fourth
edition uses a ratio of the edge distance to the effective length (Eq. 2-2) to reduce the area
of the assumed failure surface in each edge direction. Three-dimensional modeling
software (in our case Google Sketchup) is used to model the area of the failure surface at
each of the above mentioned angles. The area consists of three different sections. The
first section is full height section of the cone between the cores. The second section is the
smaller section of cone cut by the cores on either side of the insert. The third section is
the area between the top of the core and the top of the plank. Figure 2.5a and Figure 2.5b
show two section views of the plank and insert to better visualize the three areas
described above.

19
Figure 2.5a Failure cone area section 1
Figure 2.5b Failure cone area sections 2 & 3
Once these areas are calculated, they will then be plugged into Eq. 2.3, and Ce1
and Ce2 are set equal to 1. The concrete strength will be taken as 3,000 psi and adjusted
if necessary to account for the concrete and grout strengths determined during testing.
Summarizing these calculations:

20
Table 2.1 Predictive equation calculation summary.
Angle (θ)
(Deg.)
Ao
[in^2]
Pc 1 (PCI 1992)
[lb.]
30 80.09 12,283
35 80.43 12,334
40 73.95 11,341
45 69.30 10,628
50 66.89 10,258
55 68.45 10,498
60 72.046 11,049

21
Chapter 3
Experimental Testing
3.0 Introduction
Sixteen P-52 “Swift-Lift” Inserts by Dayton-Superior installed in four precast hollow-
core concrete planks were tested to failure in this research. Four inserts were installed in
each eleven foot long plank, and a total of four planks were used to conduct and complete
this research. This chapter discusses in detail the procedure and materials that were used
to create all four specimens, along with the experimental testing method used throughout
this research.
3.1 Precast Hollow-Core Plank and Insert Installation
This section describes the production procedure of the Hollow-Core Plank performed at
the Spancrete Inc. precast plant in Valders Wisconsin, and the method used to cast the
inserts into the precast hollow-core plank.
The precast planks used in this research effort used twenty-four (24) 7/16” dia.
270 ksi low-relaxation prestressing strands stressed at 75% of the fpu, and placed 0.75”
from the bottom of the plank. They were fabricated using concrete with a target 28-day
unconfined compression strength of 6,000 psi and an unconfined compression strength at
release targeted to be 3,500 psi.
During the production process, the strands are first laid out across the casting bed
and stressed. The extruding machine then runs along the casting bed and places the
concrete. As part of the placing process, the dry-pack concrete is automatically
compacted and formed in the shape of the plank with hollow voids. As soon as the
extruding machine goes past a location where an insert was to be installed, the extruder

22
operator cuts out a 4” by 16” opening centered over a core as shown in Figure 3.1. Since
the concrete is still “wet”, this process takes minimal effort and the tool required to do the
job is analogous to a large putty knife. This is one of the main reasons this is done as
soon as the extruder goes by. If this process is delayed, cutting the opening could not
only cause extensive damage to the plank, but would require concrete sawing equipment.
Another good reason to cut and install the insert while the concrete is still “wet” is to
avoid forming a cold joint between the concrete and the grout around the insert. This
allows for better adhesion between the two materials and potentially a higher insert
capacity. An appreciation of scale can be seen in Figures 3.1 and 3.2 where the headed
insert is shown adjacent to the slot made in the plank.
Figure 3.1 Opening in Precast Hollow-Core Plank Figure 3.2 Opening & Insert prior to Installation
Non-shrink grout with 28-day target unconfined compression strength of 3,000
psi is then poured in the opening and leveled off at the top of the plank with the insert.
The process is schematically shown in Figures 3.3 and 3.4. The insert and its plastic
spherical cap are then pushed into the center of the opening. This process is then
repeated until all inserts were installed. It is important to note that once the plastic cap is
removed, the five and a half inch long insert ends up set down one half inch (1/2”) from

23
the top of the plank and gives the insert a total embedment of six inches, thus placing the
bottom of the insert directly at the bottom of the core in the plank.
Figure 3.3 Grout Installation Figure 3.4 Insert Installation
The next morning, the planks are cut with a concrete saw to the correct length.
The planks were then placed on a trailer using a vacuum picker and taken to the yard for
storage. No more than 5 days later the planks were shipped to Marquette University for
testing.
3.2 Experimental Fixturing and Testing Protocol
This section describes the experimental fixturing (inscluding design of the testing
fixtures) and testing protocols used for this research.
Experimental Fixture
The testing fixture used at Marquette University in the Engineering Materials and
Structural Testing Laboratory (EMSTL) consists of an eleven and a half foot long
W12x72 beam supported by two ten foot long W12x72 columns. The configuration of
this structural steel fixture is shown in Figure 3.5. The ends of the beam are welded to a
half inch thick end plate using quarter inch weld. The end plates are bolted to the flange
of the W12x72 column, using six (6) five-eighths inch diameter bolts. The base of the

24
column is also welded to a half inch thick base plate using quarter inch weld, which is
then attached to the concrete strong-floor using one inch diameter threaded rods (through
the strong-floor). An MTS single ended hydraulic actuator with a tensile capacity of
thirty-six kips is bolted to the beam along with the angles and swift-lift attachment that
were used to pull on the insert during testing. The actuator is connected to a computer
which controls the actuator & records the tensile force and deflection of the insert at
failure using software written in MTS Testworks Software.
Figure 3.5 Plank and Testing Equipment
Figure 3.6 Plank and Testing Equipment Figure 3.7 Plank and Testing Equipment (Side view)

25
The precast plank specimens were stored in the Marquette University EMSTL
until testing and are moved using slings attached to the laboratory’s overhead crane.
During testing, the plank is placed on two pairs of four foot long two-by-fours and is
centered within the testing frame with the P-52 insert directly underneath the actuator.
Shims are located at fifty-two inches from the testing end and thirteen-foot three inches
from the testing end in order to minimize the upward force on the tie-down beam closest
to the testing end. Two “hold-down” beams are placed on the plank. One is placed three
feet away from the insert and is the only beam that will hold down the plank during
testing. The second tie-down beam is not needed for testing, but was added to keep the
plank from shifting or sliding during testing. The “hold-down” beams consisted of a ten-
foot long HSS 5x5x1/2. The beams are held down by a single one inch diameter threaded
rod at each end, thru-bolted to the floor.
Testing Protocol
The testing procedure for this effort was very straight forward, but in an effort to limit
having to move the actuator only once, the inserts were not tested in order. Two inserts in
each plank were tested, at opposite corners, then the actuator was moved. After the move,
the other half of the inserts were tested.
As mentioned above, each plank was moved into place using two slings and the
over-head crane. In an effort to reduce any eccentric or angled load on the insert, a
plumb-bob was used to place the plank so that the insert was directly below the actuator.
Once the plank was in place, the “hold-down” beams were installed and attached to the
strong floor. The lifting clasp was engaged on the insert and attached to the actuator. The
actuator is then engaged and the insert was then loaded to four-hundred pounds to take

26
the “slack” out of the system. A new data file in the actuator program was created and
labeled to match the insert being tested.
Several important parameters were set for each trial; the rate of loading
application; how to apply and record the load on the system, the data sampling rate and
the test termination criterion. The load was applied to the insert by enforcing a set
displacement for the actuator head and recording the load measured in the actuator to
achieve the displacement. The rate used to run the first half of the tests was 0.05 inches
per minute. This means that the actuator head moved vertically 0.05 inches every
minute, and the load was recorded five times every second. After half the inserts were
tested, the rate was tripled to 0.15” in order to shorten the testing time, but the load was
still recorded five times every second. The loading rate was still very slow, and none of
the results seemed to be affected by the rate change. In order to avoid a catastrophic or
very destructive failure in the lab, the test was set to stop once the recorded load dropped
below ninety percent of the maximum recorded load. Since the plank was over-designed
to resist any flexural loads and the steel tensile capacity of the insert is much higher than
the expected insert capacity, the system failure was expected to be brittle. Therefore a ten
percent drop in recorded load would be enough of a buffer to record the maximum load,
the small decrease in load that normally happens just prior to failure and the sudden drop
in load at failure.
Once the parameters were set, the actuator was activated and the tensile force was
slowly increased on the system until the insert or the plank failed. After failure, the
failure mode seen in the specimen was determined and recorded along with the ultimate

27
deflection and maximum experienced tensile force. The equipment was then un-hooked
and the plank was removed. This procedure was repeated until all inserts were tested.
The test results were then summarized and analyzed in Excel. Following a
statistical analysis, the results were then compared to the predictive equations derived in
Chapter two and a recommended insert capacity was determined. A detailed discussion
of the analysis of the test results and recommendations can be found in Chapters Four and
Five respectively.
3.2 Experimental Fixture Design
This section outlines the procedure that was used to verify the adequacy of the testing
equipment and the design of the precast plank specimen that was used during the
experimental testing. The insert capacity stated in the Dayton Superior Product Handbook
(Dayton 2011) is 7,400 pounds (Appendix C). After removing the safety factor of four,
the capacity is 30 kips. As it was previously stated in chapter two, the edge distances
around the insert are smaller than the edge distances presented in the handbook; therefore
this number does not apply directly. Knowing that the load will not reach its maximum
load, we can conservatively take the handbook capacity as the ultimate load and not
apply any amplification factor (load factor) to this load giving,
30
This will be the maximum applied load [T] used for all of the following
calculations. It should be noted the experimental fixtures were previously sized to be
used at the testing laboratory in several different applications beyond the requirements of
this particular effort. The calculations done in this chapter are done to verify the
adequacy of such equipment for use in this testing program.

28
Concrete Precast Hollow-Core Plank Design
The present section will outline the design of the precast plank test specimen to be used
as the basis for the present research effort.
Using Figure 3.8, one can analyze the loads on the plank and find the maximum
moment as:
30 ∗ 3.0 90
Spancrete Inc. has plank design charts (see Appendix A) to aid engineers in
designing planks with simple loadings. All of their plank charts are for four-foot wide
planks, but when an eight foot wide plank is required the strand pattern is doubled in the
design. Plank design 0.75F-8712 has a moment capacity of 42.64 Kip-ft per foot. The
maximum moment occurs at the tie-down spot (four foot-four inches from the end).
Since the strand requires about seven feet to fully develop, the moment capacity can be
reduced by the ratio of the distance to the spot of maximum load to the distance the
strand requires to develop. Assuming half the plank width (four feet of plank) takes the
load and reducing the moment capacity by the above mentioned ratio, the capacity of the
plank is:
∅ 42.64 ∗ 4 0" 170.6 ∗ 4.5′/7′ 109.6
Figure 3.8 Plank Layout Sketch
R 1’‐4”
4’‐4” 8’‐11”
13’‐3” 3”
T

29
To summarize, the selected plank is an eight-foot wide [H series], eight inch thick
plank with twenty-four, seven-sixteenth inch diameter, two-hundred seventy kip-per-
square inch Low-Lax (relaxation) steel strands with three quarters of inch concrete cover.
[0.75H-8724]. It is expected that the insert will pull out prior to flexural failure of the
plank.
Tie-Down Beam and Anchor Design
The maximum hold-down force [R] as a result of the insert loading can be computed
using the free body diagram in Figure 3.8. Summing moments gives the hold down
force:
30 ∗ 8.917 3.0'8.917′
40.1
The free body diagram shown in Figure 3.9 can be used to determine the
necessary dimensions and size for the fixture tie-down beam. In order to model the fact
that the insert is located closer to the side of the plank and as such, when the tensile force
is applied, the load on the tie-down beam will not be symmetrical; it was assumed that
2/3 of the tensile force was applied to one side of the plank, and 1/3 was applied to the
other side.
Figure 3.9 Tie-Down Beam Layout
The maximum uplift force [Tu1] and the maximum moment on the beam [Mu] can
be determined with reference to Figure 3.9 as follows:
8’‐0”1’‐6” 6”
(2/3)R
Tu1
(1/3)R
Tu2

30
23 ∗ 40.1 ∗ 8.5′ 1
3 ∗ 40.1 ∗ 0.5
10′23.4
23.4 ∗ 1.5′ 35.1 421.1
The tie-down beam can be selected using the target bending moment and it was
determined that a steel HSS 5x5x1/2 and 10-ft long with an expected yield strength of 46
ksi would likely be adequate. The preliminary member can now be checked to evaluate
its adequacy in shear and bending moment.
Moment Check:
421.10.9 ∗ 46
10.2 13.1
Shear Check: [kv = 5]
1.1 ∗5 ∗ 29000
4661.76 7.75 1
∅ 0.9 ∗ 0.6 ∗ 46 ∗ 2.75" ∗ 2 ∗ 0.465" 63.53 23.4
Finally, we can check the anchor rods attaching the tie-down beam to the floor.
Using the AISC Steel Construction manual (AISC 2010), the tensile capacity of a one
inch diameter rod made out of an assumed grade of A325 steel is 53 kips which is also
greater than the 23 kips calculated above.
Actuator Anchorage Design
The steel frame used to support the actuator consisted of two columns and one beam, all
made up of W12x72 steel shapes. Using Figure 3.10 we can compute the maximum
moment, expected deflection and shear on the W12x72 shape found in the experimental
fixture. The worst case scenario for deflection is considered by placing the load at

31
midspan. However, the fixture was checked with the actuator positioned 4’-0” from the
column centerline.
Figure 3.10 Steel Frame, Beam Layout
30 ∗7.5 ∗ 411.5
78.3
78.3 ∗ 12
0.9 ∗ 5020.9 108
∆30 ∗ 11.5 ∗ 12
48 ∗ 29000 ∗ 5970.095
30 ∅ 0.75 ∗ 0.6 ∗ 50 ∗ 0.43 ∗ 9.125
88.3
1 30 ∗7.511.5
19.57
The maximum reaction at the end of the beam (R1) can now be used to check the
beam to column connection and the column itsef.
Beam to Column Connection
The W12x72 steel beams are attached to the columns using welds from the beam to the
end plate and bolts from the end plate to the column. The shear check for the two
connection components are as follows:
-Weld from beam to end-plate: [1/4” weld @ beam]
7’‐6” 4’‐0”
11’ – 6”30k
R1 W12 x 72

32
∅ 9.125 ∗ 2 ∗ 5.54 101
19.57
-Bolts from end-plate to column:
19.576
3.3
∅ 11.0 6 3255/8" .
3.3
Column Check
The last major component to check is the column. The base of the column is welded to
the end bearing plate and bolted to the floor.
-Axial Compressive Strength: [W12x72]
12
∅ 807 19.57
K = 1.0 was used and is conservative due to mid-height bracing on vertical columns.
-Axial Tensile Capacity:
∅ 949 19.57
-End-Plate Check:
-Column to End-Plate: Weld Capacity [1/4” weld]
∅ 9.125" ∗ 2 ∗ 5.54 / . 101.1
19.57
-Bolt check: [(4)5/8”Dia. Bolts]
19.574
3.3 ∅ 20.7

33
-End-Plate Bending: [PL. ¾” x 15” x 15”]
15"/2 * √2 * 0.754
1.49
∅0.9 ∗ 36 ∗ 1.49
3.25 .14.85 ∗ 4 59.42
19.57
Finally, the connection to the actuator is checked,
- Bolt Check: [(4)1” Dia. Bolts]
7.5 ∅ 53
-Weld from PL. ¾”x10 ¼”x10 ¼” to PL. ¾”x3 ½”x4” w/ hole:
∅ 8" ∗ 5.54 / 44.32 30
-Bearing on 3/4” Dia. Hole on PL. ¾”x3 ½”x4”: [Tbl. 7-6]
∅ 3/4"∅ 44
[le (actual)= 1 ½” ; le (design)= 1 ¼” ] [OK]
-Shear capacity of 3/4” Dia. Bolt: [Tbl. 7-1]
∅ 3/4"∅ 24.5
The capacity of the bolt is not larger than the factored maximum load [Tu =30
Kips], but if you remove the twenty-five percent reduction, the shear capacity of the bolt
is 32.7 Kips. Knowing that the tensile capacity of the insert is well below the thirty kips
used in the calculations, the minimal numerical safety factor for this element of the
system should suffice for the purposes of this effort.

34
Chapter 4
Experimental Results and Discussion
4.0 Introduction
This chapter presents the results and failure descriptions of each insert tested. A
summary of all of the measured capacities along with a mean is presented at the end of
the chapter. Each insert that was tested was labeled with two numbers. The first number
represents one of the four planks we tested which were numbered one through four. The
second number represents each insert within each of those planks which was also
numbered one through four. [e.g. Insert 2 in plank 1 is Insert 1-2.]
It should be noted that to prevent a complete insert pullout, the tensile test was set
to stop once the load reached a ten percent reduction of the maximum recorded load. This
parameter was set to prevent damage to the system if load was continued to be applied
once the initial failure occurred. Once the maximum load was reached, the load in the
system would never be higher than the peak load already recorded.
It should also be noted, in setting up planks one and two, a longitudinal crack
running the length of the plank along the top developed once the two hold-down beams
were placed and tightened. The crack occurred one core over from the center core and ran
vertically from the top of the plank to a spot near the top of the core. See Figure 4.1 for a
picture of this crack. To avoid this from reoccurring, two-by-fours were placed between
the hold-down beam and the top of the plank to distribute the tie-down force more evenly
across the width of the plank instead of near the edge. See Figures 4.2 and 4.3 for the two
setups used for testing.
4.1 Experimental Failure Modes

35
As expected from all of the predictive equations, none of the tested inserts failed due to
steel yielding or fracturing. All of the failures were concrete failures. Three main types
of concrete failures were observed and are labeled as Type A, Type B & Type C. Each of
these are discussed below.
Figure 4.1 Longitudinal crack in Hollow-Core Plank Figure 4.2 Initial setup: Hold-down beam on plank
Figure 4.3 Adjusted setup: Hold-down beam on two by four
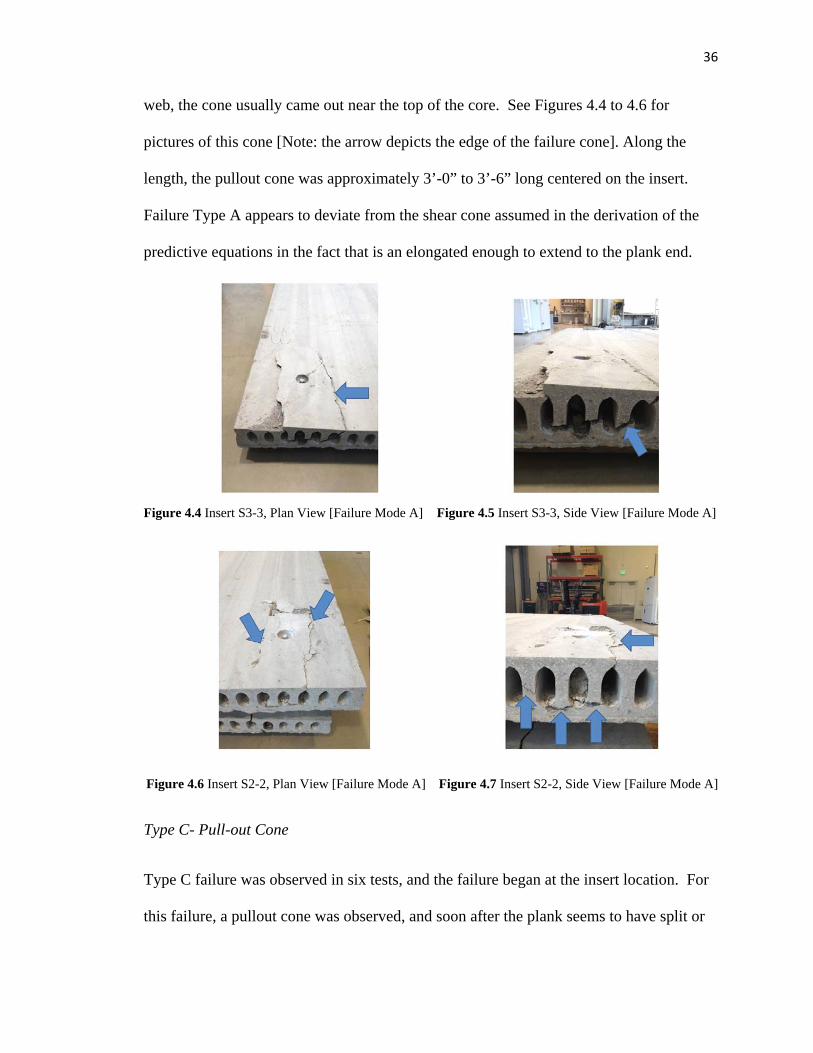
Type A- Pullout Cone Extending to Plank End
The four tests observed with Type A failure showed a pullout cone typically crossing at
least two cores, one on either side of the core where the insert was cast. The bottom of
the cone started at the bottom of the core with the insert. It crossed the web on each side
of the core and crossed one more pair of webs also at about the same angle. Beyond that
36
web, the cone usually came out near the top of the core. See Figures 4.4 to 4.6 for
pictures of this cone [Note: the arrow depicts the edge of the failure cone]. Along the
length, the pullout cone was approximately 3’-0” to 3’-6” long centered on the insert.
Failure Type A appears to deviate from the shear cone assumed in the derivation of the
predictive equations in the fact that is an elongated enough to extend to the plank end.
Figure 4.4 Insert S3-3, Plan View [Failure Mode A] Figure 4.5 Insert S3-3, Side View [Failure Mode A]
Figure 4.6 Insert S2-2, Plan View [Failure Mode A] Figure 4.7 Insert S2-2, Side View [Failure Mode A]
Type C- Pull-out Cone
Type C failure was observed in six tests, and the failure began at the insert location. For
this failure, a pullout cone was observed, and soon after the plank seems to have split or

37
separated right at the insert location. In most cases, the crack that was formed ran along
the length of the plank, typically splitting around the top of the core where the insert was
cast. In a few instances, transverse crack also formed starting at the insert location. See
Figures 4.8 and 4.9 for pictures of this failure. Failure mode C appeared to have the
closest resemblance to a shear cone failure in the immediate vicinity of the insert
assumed in the derivation of the predictive equation for pull-out capacity.
Figure 4.8 Insert S1-3 [Failure Mode C] Figure 4.9 Insert S2-4 [Failure Mode C]
Type B- Flat Pullout Cone Splitting at Insert
Type B failure is a combination of Types A and C and is shown in Figures 4.10 and 4.11.
Failure Type B is close to Type C with regard to shear cone formation, but in these three
observed cases, a very flat pullout cone developed at the bottom of the core where the
insert was cast, and it extended across three webs. As the cone was failing, it then seems
to have split near the insert causing more damage than in the other two failure types.

38
Figure 4.10 Insert S1-1, Plan View [Failure Mode B] Figure 4.11 Insert S1-1, Side View [Failure Mode B]
Other Failures
Types A, B and C encompass thirteen of the sixteen tests completed. The remaining
three tests have additional circumstances which require explanation. Failure Types D and
E apply to inserts S3-4 and S4-4, respectively. The concrete around both of these inserts
had been damaged by a continuous longitudinal crack that had developed when testing
the insert at the opposite end of the plank (S3-1 and S4-1). Insert S3-4 was tested to
failure despite the damage and the failure seen is shown in Figures 4.12 and 4.13. The
capacity for these was much lower than all of the other inserts, and the damage to the
plank was very severe. The test culminated with a section of the plank breaking in half.
To avoid another severely damaged plank and knowing that the insert was already
compromised, insert S4-4 was not tested.
The final insert failure to be discussed is failure Type F, applying to insert S4-2.
Failure for this insert began as a shear failure of the plank one core over from the insert.
A vertical crack developed above and below the center of the core and spread along the
length of the plank to the hold-down beam. At that point the plank then began to bend
failed in flexure at the beam, which triggered the end of the test. No other damage was

39
observed around the insert. Pictures of the vertical shear cracks and the flexure cracks
are shown in Figures 4.14 and 4.15 respectively.
Figure 4.12 Insert S3-4, Plan View [Failure Mode D] Figure 4.13 Insert S3-4, Side View [Failure Mode D]
Figure 4.14 Insert S4-2, Shear failure [Mode F] Figure 4.15 Insert S4-2, Flexural failure [Mode F]
4.2 Discussion of Experimental Results
Table 4.1 shows a summary of the testing results presenting the maximum load carried by
each insert along with the failure mode observed. The failure mode is represented by a
letter in the table.
Table 4.2 provides the concrete and grout unconfined compression strengths at the
time of testing (two days after production), at seven days after production, and at thirty-
one days after production. In total, nine cylinder specimens were cast for the concrete

40
and non-shrink grout. It is important to note that the concrete and grout cylinders were
not very well consolidated. The evidence of this can be seen in the large variability in the
cylinder data in Table 4.2.
Table 4.1 Test Results, Max. Applied Load & Failure Mode
Insert Maximum Load (lb.)
Failure Mode
S 1-1 16,148 B S 1-2 11,710 C S 1-3 12,747 C S 1-4 13,515 A S 2-1 11,486 B S 2-2 17,673 A S 2-3 13,225 A S 2-4 13,404 C S 3-1 12,406 C S 3-2 12,346 C S 3-3 13,451 A S 3-4 9,560 D S 4-1 15,075 C S 4-2 16,787 F S 4-3 15,694 B S 4-4 NOT TESTED E
Table 4.2 Concrete and Grout Strengths
Cyl. 1 Cyl. 2 Cyl. 3 Avg. (psi) Concrete 2,527 3,836 4,282 3,548
2 Day Grout 2,992 2,917 2,898 2,936
Concrete 5,738 3,900 3,960 4,533 7 Day
Grout 3,429 3,047 3,015 3,164 Concrete 5,207 5,119 6,506 5,611
31 Day Grout 3,308 3,314 3,463 3,362
Prior to discussing the results of the testing, the removal of two inserts (S3-4 and
S4-4) with failures modes D & E should be noted. These inserts were damaged prior to
testing as a result of testing of adjacent inserts, and therefore, the capacity obtained when
testing insert S3-4 is not applicable. In addition, failure type F (Insert S4-2) unfortunately

41
was a plank shear failure which eventually led to plank flexural failure. This insert and
the concrete around it was still in good condition when the test was stopped, therefore
this was not an insert failure and is something that will have to be taken into
consideration within the plank design. For the purposes of this research, this result will
also be ignored as insert failures were the objective of the study. The thirteen other
inserts that were tested are significant. Failure modes A, B and C are significant due to
the fact that all of the inserts were intact at the beginning of the test and failure involved a
shear cone similar the assumptions made both by the Dayton-Superior Product Handbook
and by the PCI when treating the insert as a headed anchor stud.
A simple approach was considered to analyze the experimental data. A simple
average of all thirteen capacities gives us a mean insert failure capacity of 13.76 kips, and
a standard deviation of 1.85 kips. To obtain a safe maximum design capacity with 95%
confidence we can take the average insert failure capacity and subtract two standard
deviations to give us a capacity of 10.1 kips. If we separate the results per significant
failure modes and analyze each mode individually we get the results given in Table 4.3.
If we look at the results more closely by failure mode, several observations can be
made. For failure mode A, three out of the four results are in the neighborhood of
thirteen kips, but the average is being influenced heavily by the 17.7 kip test data point.
In a similar fashion, the average for mode B is being heavily influenced by the one low
entry of 11.5 kips. Mode C has a greater number of data points (relatively speaking) and,
as a result, a much smaller standard deviation. All of the data points seem to be fairly
close together so an average of thirteen kips seems appropriate and no big adjustment
seems necessary.

42
Table 4.3 Test Results, Max. Applied Load & Failure Mode
If we look at the results more closely by failure mode, several observations can be
made. For failure mode A, three out of the four results are in the neighborhood of
thirteen kips, but the average is being influenced heavily by the 17.7 kip test data point.
In a similar fashion, the average for mode B is being heavily influenced by the one low
entry of 11.5 kips. Mode C has a greater number of data points (relatively speaking) and,
as a result, a much smaller standard deviation. All of the data points seem to be fairly
close together so an average of thirteen kips seems appropriate and no big adjustment
seems necessary.
4.3 Reliability-Based Evaluation of Predictive Equation
In this section, a reliability-based evaluation of the predictive equation will be performed
to begin to obtain a better understanding of the relationship between the predictive
Insert Maximum Load (lb.)
Failure Mode
Avg. Load (lb.)
Std. Dev. (lb.)
Avg. – Std. Dev.
(lb.)
Avg. – 2*(Std.
Dev.) (lb.) S 1-4 13,515
A 14,466 2,142 12,324 10,182 S 2-2 17,673 S 2-3 13,225 S 3-3 13,451
S 1-1 16,148
B 14,442 2,571 11,871 9,300 S 2-1 11,486 S 4-3 15,694
S 1-2 11,710
C 13,068 1,278 11,790 10,512
S 1-3 12,747 S 2-4 13,404 S 3-1 12,406 S 3-2 12,346 S 4-1 15,075

43
equation and the results obtained during testing. This evaluation will form the basis of a
future LRFD procedure to be developed once additional testing is done, and a clearer
picture is created between the predictive equation and all of the failure modes seen during
testing.
It is important to note, the average grout compressive strength on the day of
testing found in Table 4.2 is 2,936 psi, and the concrete compressive strength on testing
day is approximately 3,500 psi. The controlling component is the grout and its capacity
along with the capacity of the system will be taken as 3,000 psi. Interestingly, the grout
compressive strength does not increase significantly from the time of testing to the 31st
day strength test; therefore the capacity of the system should remain fairly close to the
capacities presented in this effort. In Chapter 2, calculations were run for failure cone
angles ranging from sixty degrees to thirty degrees in five degree increments. All of these
calculations were run using a concrete strength of 3,000 psi, therefore none of these
calculations need to be altered.
The average measured capacity from the tests was 13.76 kips. Comparing this
value to the predicted values with failure cones at thirty degrees and at thirty-five
degrees, the calculated capacities of 12.28 kips and 12.33 kips respectively are very close
to this average capacity, in fact, both of these calculated values are within one standard
deviation of the average measured value.
It is very useful to evaluate the capability and reliability of the equations used to
predict the insert capacity. We can define a bias factor as the insert capacity predicted
divided by the experimental capacity measured. This is given by,
1/ (4.1)

44
where: Pc1 is the capacity predicted using equation (2.3); and Pexp is the experimental
insert capacity measured during testing. Table 4.4 illustrates the bias factors, their mean,
and their coefficients of variation for various angles and failure modes.
If we look at the mean and coefficient of variation (COV) in this ratio, the mean
closest to one with the lowest coefficient of variation would suggest the most accurate
prediction of strength. The bias factors (Pc1/Pexp) range from 0.861 to 0.996 when
angles from 30-35 degrees are used. Angles greater than 35 degrees need not be used as
the accuracy decreases as the angle increases. The coefficients of variation with 30-35
degrees are also relatively low with failure mode C predictions having the least
variability. The 35 degree angle does the best overall job at predicting insert strengths for
all three failure modes and does the best job at predicting the strength of failure mode C
having a mean ratio of 0.959 and a COV of 0.085.
The predictive equations assume a failure shear cone with regular conic
dimensions. Failure mode C follows this model quite well, but failure modes A & B seen
in the experiments do not follow this assumption as closely. Evidence of this can be seen
in the bias factor and COV calculations. Failure mode C at an angle of 35 degrees
contains a bias factor of nearly 1.0 and the COV near zero. The other two failure modes
have fairly good bias factors and a low COV but they are not as accurate as the results
when failure mode C is seen in the test.
The data in Table 4.4 suggests that a 35 degree angle be used for all calculations
and a bias factor of 0.865 and the COV of 0.129 can conservatively be used for modeling
variability in the prediction. However, the results also suggest that predictive equations

45
may need to be created to model failure modes A & B. Simple adjustments to the
equation for mode C may also be appropriate.
Table 4.4 Predictive Equation Results & Comparison with Experimental Results
The data in Table 4.4 forms the basis of a load and resistance factor (LRFD) approach for
designing the headed anchors used in this study. However, the limited numbers of tests
conducted and the resulting inability to confidently define the statistical model describing
the variability/uncertainty in the predictive equation’s accuracy suggests that more testing
is needed before pursuing LRFD-type design methods. As a result, traditional (historic)
factor of safety methods are explored.
30 Degrees 35 Degrees 40 Degrees 45 Degrees
Ao (in2) 80.09
Ao (in2) 80.43
Ao (in2) 73.95
Ao (in2) 69.3
Pc1 (lbs) 12,283
Pc1 (lbs) 12,334
Pc1 (lbs) 11,341
Pc1 (lbs) 10,628
Failure Mode Specimen
Pexp (lbs) Pc1/Pexp Pc1/Pexp Pc1/Pexp Pc1/Pexp
A
S1‐4 13,515 0.909 0.913 0.839 0.786
S2‐2 17,673 0.695 0.698 0.642 0.601
S2‐3 13,225 0.929 0.933 0.858 0.804
S3‐3 13,451 0.913 0.917 0.843 0.790
Mean 14,466 0.861 0.865 0.795 0.745
COV 0.148 0.129
B
S1‐1 16,148 0.761 0.764 0.702 0.658
S2‐1 11,486 1.069 1.074 0.987 0.925
S4‐3 15,694 0.783 0.786 0.723 0.677
Mean 14,442 0.871 0.875 0.804 0.754
COV 0.178 0.198
C
S1‐2 11,710 1.049 1.053 0.968 0.908
S1‐3 12,747 0.964 0.968 0.890 0.834
S2‐4 13,404 0.916 0.920 0.846 0.793
S3‐1 12,406 0.990 0.994 0.914 0.857
S3‐2 12,346 0.995 0.999 0.919 0.861
S4‐1 15,075 0.815 0.818 0.752 0.705
Mean 13,068 0.955 0.959 0.882 0.826
COV 0.091 0.085

46
4.4 Factor of Safety Formulation
A second approach for making a reasonable recommendation for the insert
capacity is to formulate a factor of safety. A classical rule of thumb safety factor
approach will be used to develop a recommended safety factor that may be used for
design. The technique presented in this chapter is developed from the process presented
in The Mechanical Design Process (Ullman 1997).
This approach presented uses contributions from five different measures when
developing the factor of safety. Each measure has several parameters or rules spelled out
and a factor of safety has been attached to each. To develop the safety factor, a
parameter is selected from each measure and then all of the factors are multiplied
together to obtain the safety factor for the system in question.
The first factor to be estimated is the contribution by the materials in the system.
If the material properties of the system are well known through experiments and are
known to be identical to those of the component being designed, then the factor of safety
(FSmaterial) is equal to 1. If the material properties are not well known, then the FSmaterial
ranges from 1.2 to 1.4.
The second factor to be estimated is the contribution for the loading demand. If
the loads applied to the system are well defined as static loads, or fluctuating loads with
no anticipated overloads, then the factor of safety (FSdemand) ranges from 1 to 1.1. If the
load is expected to have potential overloads of 20 to 50 percent, then the FSdemand ranges
from 1.2 to 1.3. And finally if the load range is not well known, then the FSdemand ranges
from 1.4 to 1.7.

47
The third factor is the contribution for geometry (FSgeometry). If the manufacturing
tolerances are closely held, then the factor of safety equals 1, but if manufacturing
tolerances tend to be more relaxed, a range from 1.1 to 1.2 has been suggested.
The fourth factor is the contribution for failure limit state (FSlimit). If the failure
limit state is derived from a uniaxial or multiaxial static stress or load, then the safety
factor ranges from 1 to 1.2. If the failure limit state is not well developed and caused by
cumulative damage or fatigue stresses, then a range from 1.3 to 1.5 has been suggested.
The final factor is the contribution for reliability of prediction. If the prediction
reliability needs to be greater than 90 percent, then the factor of safety (FSreliability) equals
1.1. If the prediction reliability needs to exceed 92 percent then it has been suggested that
this factor range be takes as 1.2 to 1.3. Finally, if the reliability needs to exceed 99
percent, then a factor of safety range from 1.4 to 1.6 is recommended.
Applying this technique to the scenario considered in the present study, the
material properties for the insert and plank are well known, therefore, FSmaterial =1.0.
Since the insert is being used to erect the precast plank, a possible overload due to lifting
the plank, wind, suction or any other possible factors is to be expected, therefore FSdemand
= 1.2. The tolerances during the manufacturing and installation process for this insert are
relatively tight since the work will be done at a PCI rated plant therefore FSgeometry = 1.0.
The load applied to this insert is a multi-axial temporary static load so the factor of safety
for the failure theory could be argued to be 1.1, but since the expected failure is concrete
controlled therefore a brittle failure, a higher factor of safety should be selected. We will
take FSlimit = 1.3. Finally, the reliability in capacity prediction of the insert is high since

48
it will be required to lift precast plank during the erection process, therefore FSreliability =
1.4. Combining all of these factors together a suggested factor of safety is:
1.0 ∗ 1.2 ∗ 1.0 ∗ 1.3 ∗ 1.4 2.2
The data in Table 4.3 suggests the following capacity of the insert using the factor
of safety derived. Using all three failure modes, the average experimental load
magnitude seen is 13.76 kips with a standard deviation of 1.85. Using the factor of safety
derived gives:
13,760 /2.2 6,250
4.5 Recommendation
The experimental testing conducted supports two approaches for insert design.
The first is a reliability-based method using predictive equations based on PCI (1992).
The second is a traditional (historical) factor of safety approach.
Using the limited amount of test data generated in the present study, the mean
predicted value to experimental value ratio and coefficient of variation in this ratio
depends upon the failure mode. A conservative mean bias factor and coefficient of
variation for 35 degree failure angle is 0.865 and 0.129, respectively. These values can
serve as the basis for a proposed LRFD procedure. More testing is needed however to
complete this process.
A factor of safety approach suggests that the capacity of an insert can be taken as
6.2 kips for the configuration tested with a factor of safety of 2.2. The experimental
results indicate that predictive equations in PCI (1992) are appropriate for evaluating
headed studs in hollow-core plank inserted using the present procedure.

49
Chapter 5
Conclusions & Recommendations for Future Work
5.0 Introduction
This chapter summarizes the procedure and significant results previously presented in
this report. The insert capacity recommendations and safety factors are restated, and
several suggestions for future work are presented to further the research and findings
presented in this effort.
5.1 Summary and Conclusions
Fifteen P-52 inserts were post-installed into the cells of four precast hollowcore planks
and tested to failure in an effort to evaluate their tensile capacity and compare these
results to those obtained with predictive equations. The inserts were 0.75” in diameter by
five-and-a half inches long, made by Dayton-Superior. The precast hollowcore planks
were made by Spancrete Inc at their Valders Wisconsin precast plant and tested in the
Marquette University Engineering Material and Structural Testing Laboratory
In chapter two, a summary of previous research was presented including the
manufacturer’s recommendations for capacity and the Precast Concrete Institute manual
design procedures when treating the insert as a headed anchor stud in solid CIP concrete.
The manufacturer’s recommendations produce a recommended capacity of 29,600
pounds, but this does not include any reductions due to small edge distances. The
manufacturer’s handbook does not include recommendations for the case considered in
this research, which leads to the need to research additional methods for design.
Following common recommendations (PCI 1992), a capacity of 15,400 pounds is

50
computed and if more recent recommendations (PCI 2007) are used, the predicted
capacity is 5,900 pounds. A procedure to develop a predictive equation for the tensile
capacity of the insert was presented to address these discrepancies, and the expected
insert capacity was calculated failure cone models with failure angles ranging from 30
degrees to 60 degrees.
Chapter three presented the insert installation procedure along with the testing
protocol used during this effort. Pictures and descriptions of the testing equipment are
presented along with a step by step procedure validating its use in the testing. It should
be noted that all of the testing equipment was previously sized to accommodate several
tests above and beyond the requirements of this effort; therefore the design presented in
chapter three was more of an adequacy check for the equipment.
Chapter four presents the results from all of the tests performed and provides a
thorough description and discussion of the six failure modes observed. It should be noted
that most of the inserts failed in one of three failure modes; either by forming a pullout
concrete cone or by having the plank split adjacent to the insert location. A statistical
analysis of all of the relevant test data is presented in the chapter. From the statistical
analysis, the recommended ultimate insert capacity is 13.75 kips. The predictive capacity
at thirty-five degrees is 12.3 kips, this capacity is within one standard deviation from the
mean experimental capacity. The process to develop a safety factor is presented in
detail in chapter four, and the recommended safety factor is 2.2. Therefore, the
recommended service insert capacity is obtained by dividing the ultimate capacity for the
insert of 13.75 kips and dividing it by the safety factor resulting in a capacity of 6.2 kips.

51
5.2 Recommendations of Future Work
There are several sections of this effort that could be further expanded to increase the
accuracy and reliability of the results and proposed capacity of the P-52 insert cast into
the voids of precast hollowcore planks. First and foremost, any additional research
should include additional experimental testing. This will not only provide additional data
points but hopefully provide a clearer picture of the major failure modes that were
observed during this testing. Another potential benefit of the additional testing would be
to average the results in a less conservative manner and possibly developing predictive
equations and LRFD methodologies for each limit state seen in the tests. In chapter four,
the data analysis showed that after separating the results by failure mode, most of the data
points were clustered. Since there are a limited number of data points and the future use
of this insert is for erection purposes, a more conservative approach needed to be taken. If
additional data is collected in the future, the gap between the few high points and the
cluster of points may be filled in or potentially the results could show that the high points
are more common than what our data shows. Either way additional data points will allow
us to get a better picture of each failure mode and potentially raise the insert capacity. In
addition, LRFD procedures could be developed using mean, coefficient of variation
(COV) and bias factors to safely size the insert in the future.
Additionally, a procedure following more closely to the ACI recommended 5%
fractile capacity of the insert could be performed which would allow 5% of the inserts to
fail when recommending an ultimate capacity. This would potentially raise the insert
capacity but needs to be performed when the number of data points is fairly high, and a
clearer picture can be derived from all of the data. The future purpose of the insert

52
should be kept in mind when determining the higher capacity and an appropriate safety
factor should be recalculated at the time to allow for any unforeseen loads that may be
applied to the insert during its service life.
Finally, another section that would benefit from additional research would be to
focus on the failure modes seen in the testing. The main assumption in all of the design
equations presented in this effort is that the insert failure will come by the formation of a
concrete pullout cone centered at the insert. Some failure modes seen suggest modified
forms of the shear cone procedure. Additional research would be beneficial to determine
if any alterations to the current predictive equation is needed or a second predictive
equation needs to be developed to effectively predict the behavior under this failure
mode.

53
BIBLIOGRAPHY
Dayton (2011), Precast Product Handbook. Dayton Superior Corporate Headquarters. Miamisburg, OH.
PCI (1992), PCI Design Handbook 4th Edition. Precast Concrete Institute. Chicago, IL. PCI (1999), PCI Design Handbook 5th Edition. Precast Concrete Institute. Chicago, IL. PCI (2004), PCI Design Handbook 6th Edition. Precast Concrete Institute. Chicago, IL. Shaikh and Yi (1985), “In-Place Strength of Welded Headed Studs”, PCI Journal, Vol.
30, No. 2, March-April Ullman (1997), The Mechanical Design Process. 2nd Ed. New York: The McGraw-Hill
Companies, Inc. 314-317.

54
APPENDIX A
Appendix A Spancrete Plank Design Table
55
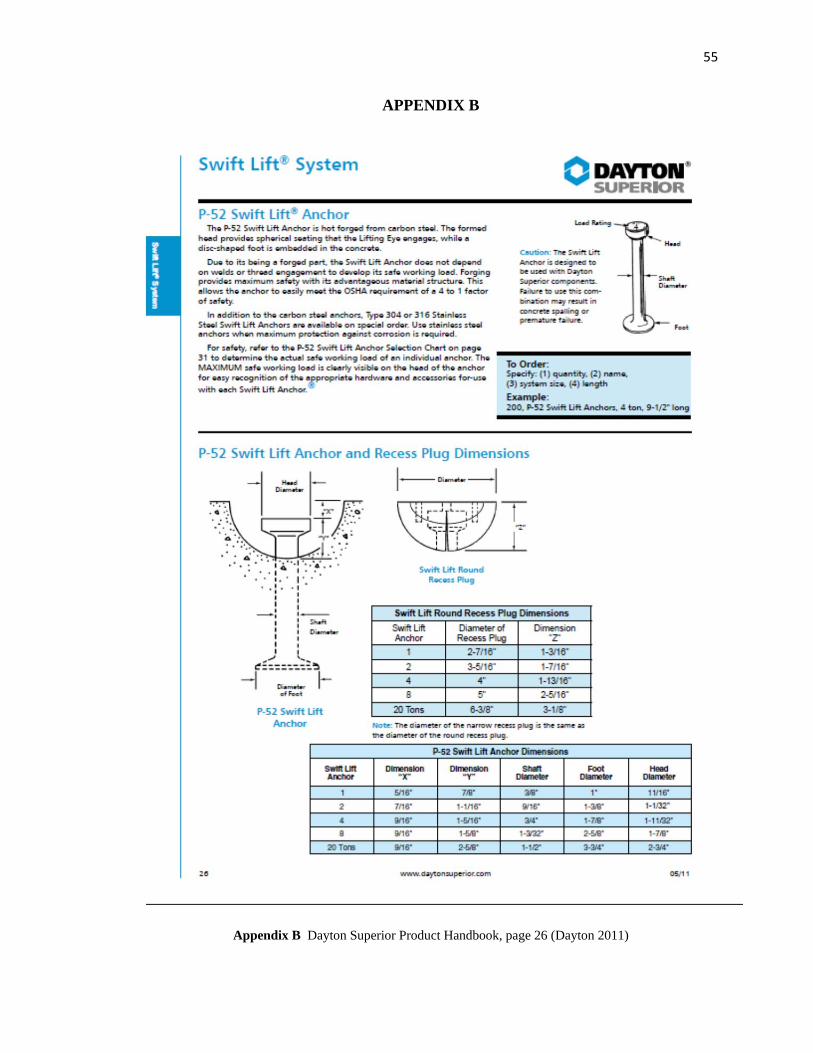
APPENDIX B
Appendix B Dayton Superior Product Handbook, page 26 (Dayton 2011)

56
APPENDIX C
Appendix C Dayton Superior Product Handbook, page 28 (Dayton 2011)