experimental design – (the scientific method) with a little metric system review and graphing...
TRANSCRIPT

Experimental design – (The Scientific Method)
With a little Metric System review and Graphing
Strategies thrown in too…

Warm-up Questions1. What is Experimental Design (the ‘Scientific Method’)
and what is it used to accomplish?2. What system is used to take measurements in all
science classes?3. What is the Base unit used to measure:
• Length• Mass • Volume
4. Name 3 prefixes used in this measurement system and what the number associated with each.
5. What Type of graph compares the relationship of two numbers - a line, bar or pie chart graph?
6. What type of graph compares the relationship of a number to a word - a line, bar or pie chart graph?

And the answers are…1. The Scientific Method is a logical, consistent
process for stating and solving problems in the natural world.
2. The METRIC SYSTEM3. Length = meter (m), Mass = gram (g), volume
= liter (l)4. Kilo=1000 (103)
Hecto=100 (102)Deka=10 (101)deci=1/10 (10-1)centi=1/100 (10-2)milli=1/1000 (10-3)
5. Line Graph6. Bar Graph

Warm-up Questions
1. Can you list 3 components or rules for writing a great scientific procedure?
2. If you wanted to know how high a superball would bounce if dropped at different heights, list one variable being tested.
3. List one variable you would hold constant in the superball experiment.

Warm-up Questions
1. What are 3 important parts or components of a graph?
2. Which axis is the dependent variable?
3. Which axis is the independent variable?
4. What happens if your hypothesis is incorrect?

Warm-up QuestionsVitamin C Lab!!!

Warm-up Questions
What is Experimental design - the Scientific
Method?• Experimental
Design is a logical, consistent process for stating and solving problems in the natural world.

What are the steps to follow?

Generally- 1. Observe 2. Formulate a Question…
Problem Statement3. Research or Infer to
formulate a Hypothesis4. Design a Procedure to test
this hypothesis5. Experiment and record data6. Analyze the Results 7. Draw a Conclusion and
communicate the results

The Observation starts it all…
An observation is a visible or provable fact or occurrence
VS.An inference is, “the act of reasoning from factual knowledge or evidence.” This is your opinion drawn on the observations you have made.


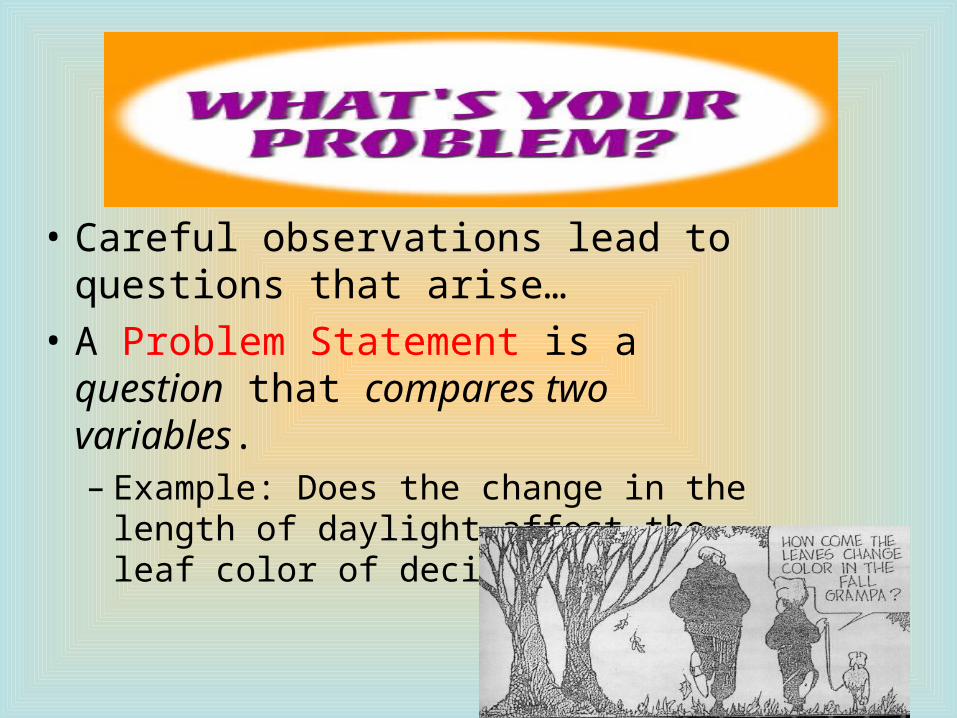
• Careful observations lead to questions that arise…
• A Problem Statement is a question that compares two variables.– Example: Does the change in the
length of daylight affect the leaf color of deciduous trees?

What are Variables?
A Variable is anything that changes.
The variables compared in the problem statement are the INDEPENDENT & DEPENDENT variables….
*Remember, the dependent variable DEPENDS on the independent variable!!!

VariablesIndependent variable
•A variable WE MANIPULATE, or change, in the experiment.
VS.Dependent variable
•The Variable that changes as a result of the independent variable.•The variable that is measured and recorded.

What is the difference between a constant and a control?
• A constant is a variable that does not change through the entire experiment…a value that remains the same.
VS.• The CONTROL is the group or condition
that is used as the basis for comparison for the results of the changes in the independent variable

What is a Controlled Experiment ?
• A Controlled Experiment means that only ONE independent Variable is being tested at a time!!!
• This allows the scientists to evaluate the results of the one thing being tested!!!

Hypothesis Statement
• A hypothesis is the stated outcome predicted to the problem statement that will be evaluated by the experiment…
• This is your expected results or your “educated guess” to the problem at hand.
Example: If a superball is dropped from increasing heights, then the bounce height will also increase because....

Formatting your Hypothesis
1. If blah blah blah, then blah blah blah because…
OR
2. As a statement (3rd person always!!!)
Example: The bounce height of the superball will increase in direct proportion (this means the graph of the results will be a straight line with a constant slope) with the increase in drop height.

Writing a great PROCEDURE!
1. Written in outline or list form (step #1 is NEVER ‘Gather all materials’!!!)
2. This should always be written in the third person…no personal pronouns!
3. IT MUST BE REPEATABLE! A Clear, Concise List of each step to follow…this includes tools used, measurements taken, location, etc…anything necessary to exactly replicate your procedure.
4. This should include directions to follow for making and taking observations over time!

Collecting DATA
QUALITATIVE• This is a WORD or
“quality” – a subjective measure other than an number…Examples: An odor, color,
texture, taste, etc.
QUANTITATIVE• This is a NUMBER or
“quantity” – an objective measure or observation…Examples: Distance,
mass, volume, density
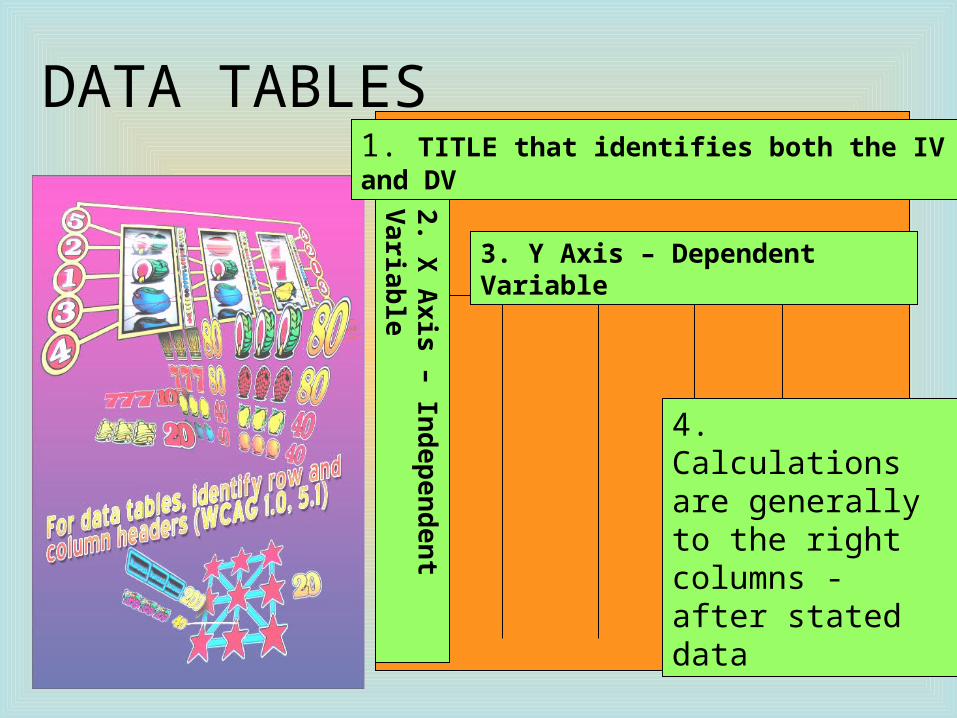
DATA TABLES1. TITLE that identifies both the IV and DV
3. Y Axis – Dependent Variable
2. X
Axis
– Ind
ep
en
den
t V
aria
ble
4. Calculations are generally to the right columns - after stated data

Ahh, to GRAPH or not to GRAPH• Graphs help to communicate and
visualize quantitative (numeric) data.
• The most common forms we will use include:
1. LINE GRAPH2. BAR GRAPH3. PIE CHART (rare)
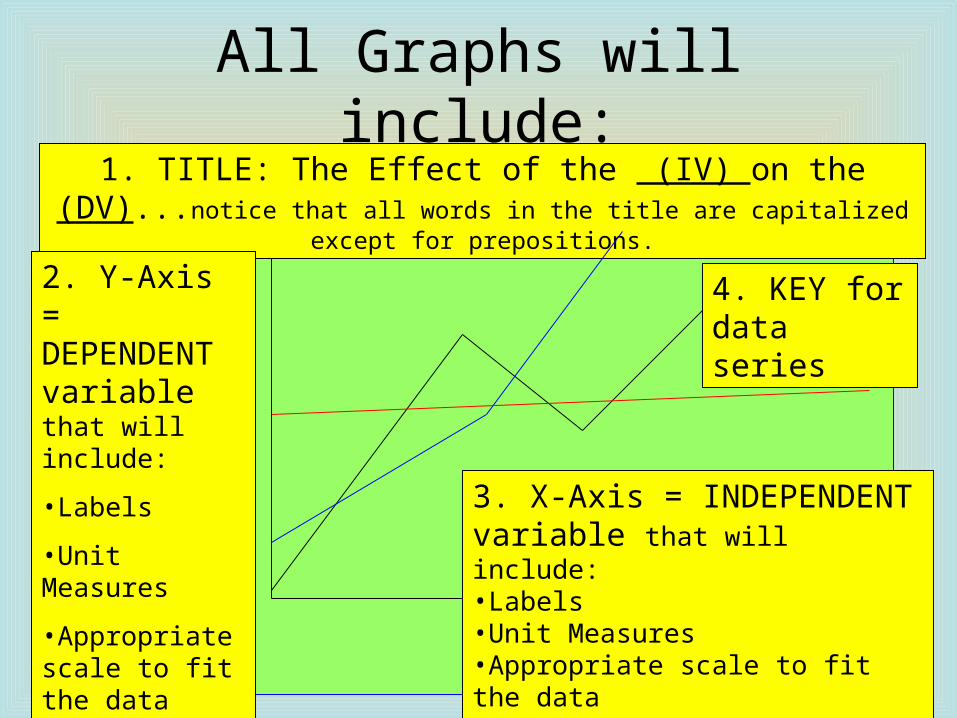
All Graphs will include:1. TITLE: The Effect of the (IV) on the (DV)...notice that
all words in the title are capitalized except for prepositions.
2. Y-Axis = DEPENDENT variable that will include:
•Labels
•Unit Measures
•Appropriate scale to fit the data
•Consistent increments
3. X-Axis = INDEPENDENT variable that will include:•Labels•Unit Measures•Appropriate scale to fit the data•Consistent increments
4. KEY for data series
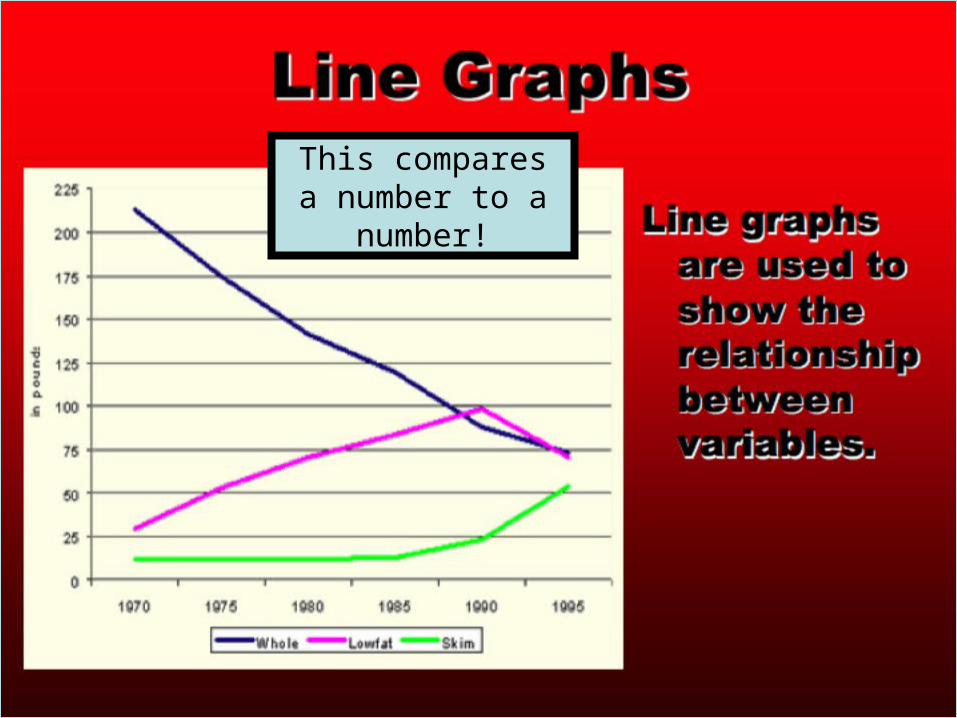
This compares a number to a
number!

This compares a number to a
WORD!

This displays percentages or parts of a
whole!


And the CONCLUSION!
The concluding paragraph (5-8 sentences) should include the
following:1. Restate the problem statement.
2. Restate the hypothesis.
3. Accept or reject the hypothesis using the analysis of your data. Be specific, proving your point with specific data points and trends.
4. Include a discussion of the validity of your results.
5. How might this experiment be improved or modified to further test the problem statement.
6. Summarize or restate you conclusion to finish up!
***This must be written in the third person!***

31
CommunicationCommunication- - Sharing of Sharing of information information is essential to scientific
process
Copyright Cmassengale
Theory•Supported by considerable considerable evidence-never yet evidence-never yet disprovendisproven
•Ties together related hypotheses
Scientific Law•A Statement of Statement of factfact that concisely explains an action or group of actionse.g. Law of Gravity•Accepted to be Accepted to be truetrue•UniversalUniversal