experimental and numerical study on ultimate strength of
TRANSCRIPT
Experimental and Numerical Study on Ultimate Strength of Steel Tubular
Members with Pitting Corrosion Damage Renhua Wang1.*, R Ajit Shenoi2.
[email protected] 1. Department of Civil Engineering, Jiangsu University of Science of Technology, Zhenjiang
212003, China 2. Southampton Marine and Maritime Institute, University of Southampton, Boldrewood
Innovation Campus, Southampton SO16 7QF, UK
Abstract
Pitting corrosion can cause stress concentration and early onset of plasticity in the metallic
structural components. This paper presents a comprehensive experimental and numerical study on
the effect of pitting features such as pit shape and depth, pitting distribution and intensity on the
structural performance of steel tubular members. The experimental investigations were carried out
on tubular members with mechanically drilled pitting damage under axially loaded compression
condition. The test results were applied to validate finite element (FE) models by comparing the
load-shortening curves, ultimate loads and failure modes. The validated FE models were then used
to simulate the random nature of pitting damage in terms of stochastic simulation. The results from
the stochastic analyses show that random natures associated with pit shape, pit depth and pitting
distribution can result in a great reduction and variation of ultimate strength, likely causing the
transition of collapse mode. The experiments provide a modelling benchmark to validate FE models
of the tubular structures with random pitting corrosion for the ultimate strength assessment. The
developed FE models are shown to be capable of replicating the pitted tubular members.
Keywords: steel tubular member; pitting corrosion; compressive column test; ultimate load; FE
modelling; stochastic simulation

1 Introduction
Tubular members are widely used in structures in oil, nuclear, hydroelectric, and petrochemical
industries [1-3]. These structural members can be subject to localised pitting corrosion, which is the
cause of a potentially destructive damage in metallic structures [4, 5]. Pitting corrosion is a form of
extremely localized attack to the mass of metal due to the corrosive medium, leading to the creation
of small pits or holes in the metal. The resulting pits become wide and shallow or narrow and deep
which can potentially perforate the wall thickness of a metal. It is essential to assess the impact of
such pitting corrosion damage accurately for monitoring, damage mitigation and life extension of
such members [6-8]. A comprehensive review in this area [9] indicated that the structural behaviour
due to pitting features such as pit depth, pit density and interfacial distances between pits is still not
fully understood.
Experimental and numerical studies were performed to understand the behaviour of tubular
members with artificially introduced localized pitting or patch-type corrosion, which are applied in
steel lined pipes [10, 11] and tubular members for offshore structures [12, 13]. Recent experimental
research into the effect of pitting corrosion artificially drilled on the local region of tubular
members for offshore platforms [14] showed that aside from the compressive strength, pitting
corrosion affects the structural failure mode in the pattern of local buckling. Studies on stiffened
plated structures showed that pitting damage has an impact on failure patterns and leads to a
decrease in structural strength [15, 16]. Many studies have been performed on the degradation of
material property of steel tensile specimens [17, 18] and the strength reduction of plate structures
[19-22]. It is still however challenging to model pitting damage [5], using the less precise inspection
data of corrosion that comes from the representative regions of aged structures. As a result,
assessing the current fitness of the structures with pitting damage can only be based on simplified
methods of equivalent thickness or elastic modulus. Yielding of cross-section and global buckling
of an entire member may occur if only simplified methods are used [23]. Importantly, information

about pitting effect on the overall strength of tubular members remains insufficient as is evident
from some recent literature [24-26].
In this paper, compressive loading tests on the tubular members with artificial pitting damage
were carried out to study the effect of diverse pitting features on the structural strength and
deformation, presenting a benchmark experiment used to validate numerical studies. FE models,
validated against test results, were used to replicate the tested members subject to artificial pitting
damage. This was followed by modelling random pitting for structural ultimate strength assessment,
involving generation of pseudo random pitting damages. The variation of ultimate strength and the
mechanism of structural failure, which are derived from the localized and widespread random
pitting damages, were explored through comparing the FE results between various pitting damages,
based on stochastic simulation.
2 Experimental method
An experimental programme was devised to investigate the structural strength and behaviour of
tubular members subjected to simulated pitting corrosion. The tested members were made from a
seamless circular steel tubular member with an external diameter of 54 mm, thickness of 6.9 mm
(D/t ratio of 7.83), and length of 460 mm. Pitting was artificially introduced into the members by
mechanical drilling, with variations in pit shape, pit depth, pitting intensity and distribution pattern.
Overall, the experimental programme included two material tensile coupon tests and 14 member
tests under compressive loads.
2.1 Tested members
All pits in the tested members were formed mechanically as circular or pyramidal cavities. This
was achieved by using two kinds of drill bits, both of a diameter of 6 mm, but one with a flat crown
and the other with a 1 mm high pyramidal crown. Two types of pitting patterns mechanically
simulated as shown in Figure 1 were introduced into the test members. Details of the pitting
patterns in the different tubular test specimens are reported in Table 1. The degree of pitting

intensity (DOP) is used to represent the lost area in the members due to pitting corrosion in
comparison with an intact member and is defined as:
)1((%)100(%)1000
1
2
0
×=×=∑=
A
r
AADOP
N
ii
cπ
The degree of volume loss (DOV) of lost, corroded material is defined as:
)2((%)100(%)1000
1
2
0
×=×=∑=
V
dr
VVDOV
N
iii
cπ
where A0 and V0 are the area and volume of the intact member respectively, and Ac and Vc denote
the lost area and volume due to pitting corrosion respectively. N is the number of pits, and ri and di
are respectively the radius and depth of the ith pit.
Every member was labelled, based on its pitting condition. A label of INTACT stands for the
basic tubular member without pitting and is regarded as a reference for strength reduction of the
pitted members. The first letter “U” or “I” in the member label indicates pitting distribution
scattered in uniform or interleaved pattern. The second letter of “C” or “P” indicates whether a pit is
circular or pyramidal in its shape. The four numbers following the two front letters stand for the
number of pits in the length and hoop directions, and the numbers following “d” for pit depth. For
example, IC2010d4.9 means that 200 circular pits (20 in the length direction and 10 in the hoop
direction) with a depth of 4.9 mm are distributed on the member surface, where pits are staggered.
Similarly, UP2410d5.1 represents 240 pyramidal pits (24 in the length direction and 10 in the hoop
direction) with a depth of 5.1 mm; the pits are uniformly distributed on the member and the pits in
two contiguous lines are completely aligned. The DOP of every member was estimated, depending
on the mean value of radius and depth of the measured pits. The dimensions of 12 pits, situated
radially and along the member length, were measured by a Vernier calliper. The diameters of all the
drilled pits were equal to the diameter of the drill bit, 6 mm. Figure 2 reports the measured depths of
all the artificial pits for each tested member, showing the maximum, minimum and mean values.

All the tested members were made from the same steel pipe of grade China GB8162-2008 20
carbon steel. The material property of the tested members was determined by tensile coupon tests,
using a CMT5105 testing machine. An extensometer mounted on the coupon was used to determine
the elongation of each coupon over a 50 mm gauge length. The stress-strain characteristics of the
two tensile specimen tests are shown in Figure 3. Young’s modulus, E, was 125 GPa, as derived
from the stress-strain curve in the elastic deformation region. Yield stress, σy and ultimate stress, σu
were 311 MPa and 463 MPa, respectively. Possion’s ratio was assumed to be 0.3.
2.2 Test setup and procedure
Compressive loading tests were conducted, using a YNS-1000 kN servo electro-hydraulic
universal testing machine with circular rigid platens at both ends. Figure 4 shows a photograph and
schematic representation of loading test setup. The bottom end platen was used as a fixed support
platform for the tested member, while the top end platen served as a loading actuator. Every tested
member was welded to 10 mm thick endplates at both ends and then was bolted to two flat plates of
12 mm thickness, termed in Figure 4, as wedge connectors, before being mounted on the testing
machine between the two end platens.
A small alignment load of 5 kN was applied before the compressive loading test started. This
was done to ensure full contact between the end platens, wedge connectors and tested member. The
loading test was then performed through a displacement control method at a constant speed of 1.5
mm/min. The loading process progressed until the tested member collapsed, with the maximum
loading displacement of 30 mm. Due to the difficulty in forecasting the deforming direction of the
tested member under compression, only the axial deformation was measured. Real-time load-
displacement curve of the tested member was recorded in the testing system.

3 Experimental analysis
3.1 Effect of pitting features
Table 2 reports the key experimental results including ultimate load, Fu, and the corresponding
axial displacement, △u. Two reference values, Fref and △ref, are the load and corresponding axial
displacement of the intact member at ultimate state respectively. These two latter values are used to
calculate the percentage of degradation of the ultimate load and deforming resistance of the pitted
members. Typical collapse modes of the tested members are shown in Figure 5. Some typical
experimental results of load shortening curves are shown in Figure 6.
In order to study the effect of a pitting feature under various circumstances, every basic group
was reclassified into two or three subgroups. Comparison of the effect of the pitting feature was
conducted between the reclassified tested members within each basic group, and the compared
results are reported in Table 3.
3.1.1 Effect of pit shape
In the basic group of SHAPE in Table 3, strength reductions caused by circular and pyramidal
pits were compared under different pit depths for the same level of pitting intensity, DOP 9.97%,
resulting from 240 uniformly distributed pits. The pyramidal pit was drilled using a drilling bit with
a 1 mm high pyramidal crown while the drill bit used to form the circular pit had a flat crown. For
the same drill bit height in both pyramidal and circular cases, it is clear that volume loss in the
pyramidal drill bit case is less than that in the circular drill bit case. This decrement in the volume
loss for the pyramidal case is approximated to a 1 mm discount in pit depth. Therefore, in subgroup
SHAPE-A, the tubular member with pyramidal pit (UP2410d3.6) has a higher compressive strength
than that with circular pit (UC2410d3.8), since the pyramidal pit results in a smaller pit depth of
about 2.6 mm. However, in subgroup SHAPE-B, the tubular members with pyramidal and circular
pits have nearly equal compressive loads because of almost the same volume loss of material in

UP2410d5.1 and UC2410d3.9. Pit shape thus has negligible influence on the strength decrease of
the pitted tubular member, when pitting damage causes the same volume loss of material.
3.1.2 Effect of pit depth
Comparison of pit depth on strength reduction was performed under three levels of pitting
intensities, DOPs 6.65% (DEPTH-A), 8.31% (DEPTH-B) and 9.97% (DEPTH-C), in Table 3. It is
seen that strength decreases with increase in the pit depth at the same level of pitting intensity.
However, the magnitude of strength reduction is different under different pitting intensities. Deeper
pits in the subgroups of DEPTH-A, with the minimum DOP 6.65%, and DEPTH-C, with the
maximum DOP 9.97%, result in a larger magnitude of strength decreases than that in DEPTH-B
with a medium DOP 8.31%. Thus, pit depth plays a vital role to reduce the ultimate strength of the
pitted tubular member as concerned in the regulations for fitness assessment [5].
3.1.3 Effect of pitting intensity
The effect of pitting intensity on the compressive strength of the pitted tubular member was
investigated under various pit depths, as reported in Table 3. In subgroup DOP-A, under the same
pit depth of 2.8 mm, a higher DOP 8.31% in UC2010d2.8 leads to a larger strength reduction than
the lower DOP 6.65% in UC2008d2.8. However, in DOP-B, a higher DOP 8.31% in UC2010d4.8
causes a lower strength reduction than that in the lower DOP 6.65% in UC2008d5.3. Additionally,
in DOP-C, a higher DOP 12.46% in UC3010d3.4 results in the almost same strength reduction as in
the case of the lower DOP 9.97% in UC2410d3.8. The disparities in the effect of pitting intensity
show that the higher DOP does not always result in a larger strength reduction than the lower one.
In those cases with the higher DOP but smaller pit depth, such as DOP-B and C, the effect of higher
DOP may be counterbalanced by a smaller pit depth as its effect is less impactful on the strength
reduction than the pit depth.

3.1.4 Effect of pitting distribution pattern
Comparison of the effect of pitting distribution pattern on the strength reduction was performed
between interleaved and uniform pitting patterns under different pit depths and pitting intensities in
the basic group PATTERN, as shown in Table 3. A slight variation of 0.1 mm due to the machining
error arises in the measured pit depths of the compared members within each subgroup. However,
this is considered to be of little importance as it did not cause obvious variance in the test strength.
In PATTERN-A with DOP 8.31%, the strength reduction derived from the interleaved pitting
pattern in IC2010d2.9 is quite close to that caused by the uniform pattern in UC2010d2.8. A similar
trend is also shown in PATTERN-B. However, in PATTERN-C with a relatively higher DOP
12.46%, the strength reduction for the interleaved pattern is more than that for the uniform one. The
effect of pitting distribution pattern on the strength reduction thus appears to be associated with the
pitting intensity.
3.2 Result summary
Comparisons between the pitted member and intact member in Table 2 clearly show that more
the pitting corrosion, and thus material loss, the greater structural strength reduction. The impact of
pitting on the ultimate axial deformation is, however, more complex. The deforming resistances in
most of the tested members exhibit a decreasing trend in strength as the pitting damage becomes
more severe, except for UC3010d3.4, UC2410d3.9 and UP2410d5.1 which show slightly improved
deforming resistances. This disparity in the ultimate deformation arises under higher level of pitting
intensities. This latter set of results needs further study both through experimental confirmation as
well as through numerical modelling.
With respect to the load shortening curves, Figure 6 shows an almost coincident tendency in
members UC2010d4.8, UC3010d3.4 and UP2410d5.1 despite the reduction in the overall structural
stiffness. This means that pit depth is more detrimental to ultimate strength and can offset the effect
of pitting intensity. One striking example is that a lower DOP 9.97% in UC2410d6.9 rather than the

higher DOP 12.46% in UC3010d3.4 results in the lowest compressive strength. This also suggests
that pitting damage is best characterized by the maximum pit depth albeit in consideration with the
material area, in a Level 1 Assessment [5]. ASTM G46-96 [27] elaborates the methods often used in
situ for measuring the pit depth in terms of visual and other non-destructive inspection techniques
using pit gauge, ultrasonic and radiographic techniques etc. However, the determination of pit depth
remains a great challenge because none of these non-destructive techniques can provide satisfactory
detailed information about pitting damage [9]. Notably, even if more precise measures are available
to detect pit depth, it seems impractical to simulate pitting damage precisely as in-situ pitting. This
is due to the difficulties in modelling random nature of pitting damage and trans-scale between the
small pit and large structure. It is desirable if to overcome the difficulties through addressing pitting
details with fine finite element meshes. But it most likely result in a new problem that the fine mesh
model might lead to an unacceptable consumption of computing resource. Therefore, modelling the
probabilistic feature of the measured pit depth is vital for the structural integrity assessment [28].
Pitting corrosion can be commonly represented by the density, size and depth of corrosion pits.
The measure of pitting damage is performed in terms of a visual comparison between the actual
pitting of a component and the standard pit charts in the API Specification [5]. This can identify a
pit chart to indicate the degree of pitting intensity (DOP) that approximately rates the density of the
corrosion pits of the metal component in need of inspection. Statistical information is then derived
from a typical region chosen by the inspector to represent the actual damage condition of the entire
pitted component. This information derived includes the pit number, the mean and maximum depths
and diameters of the measured pits. However, these datum are not exact but statistical for depicting
the actual pitting corrosion, expressing a descriptive statistic of pit depths likely subject to a normal,
lognormal or any other probability distribution [29]. One of those probabilistic models well fit to
the statistical feature of the measured pit depths can be used, in conjunction with these statistical
datum, to define the degree of volume loss (DOV) of corroded material in terms of a stochastic

simulation [30]. In fact, the DOV is increasingly accepted for ultimate strength assessment of the
pitted structure because it can involve the integrated effect of pitting features associated with the pit
depth and pitting intensity on the strength decrease [31, 32]. Meanwhile, pit shape, on its own, has
little influence in the strength reduction. The volume loss is then employed to describe the law of
strength reduction in the tubular member due to the pitting corrosion, as shown in Figure 7. A high
correlation between the DOV and strength reduction shows the suitability of the method based on
the volume loss to predict the strength decrease in some extent.
It is worth noting that the artificial pitting in the experimental studies has one major limitation
to depict the real pitting damage. This relates to the pitting intensities involved in the test where
only limited levels of pitting intensities and limited forms of pitting patterns were considered [5]. In
particular, both the interleaved and uniform pitting patterns are in essence two forms of regularly
distributed pitting damages. Actual pitting corrosion has more randomness in the pit shape, pit
depth and pitting distribution, as well as a larger variation in the pitting intensity. The combined
effect on the strength reduction of these can be explored by numerical modelling.
4 Numerical analysis
A numerical modelling programme was carried out using the nonlinear FE analysis package
ANSYS. The FE models were firstly validated against the reported experimental results, and then
utilized to expand the numerical study onto the effect of random pitting damage on the structural
performance of the tubular member. The FE model validation focused on the ultimate loads, load-
deformation curves and failure modes derived from the numerical analysis and experiments. The
random natures of the pitting damage were incorporated into the developed FE models by random
variables concerning pit shape and depth, as well as pitting distribution.
Previous studies into the structural behaviour of tubular member show that although initial
global geometric imperfection was measured using a theodolite, a global deflection of one
thousandth member length can provide better agreement for the numerical analysis against the

experimental results [33]. For the member welded by manual welding, residual stress is altered by
various factors [34], inevitably causing extra initial deflection besides that resulting from the
manufacturing process of the seamless pipe. One thousandth of the effective member length was
thereby used for the initial deflections of all the tested members throughout the numerical studies.
The initial imperfection was related to the factors such as: the residual stress derived from the hand
welding; local distortions owing to test sample manufacture; and the difficulty to measure the
geometric deflection on the uneven pitted surface.
4.1 Modelling information
Modelling the tubular members with pitting damage employed a four-node shell element with
reduced integration, SHELL181 in ANSYS package, with quadrilateral meshes. A uniform mesh of
size t×t was applied in the regions of the member surface without pits, but more intensive meshes
were used for modelling pitting detail. All the pits were modelled as cylindrical holes regardless of
the difference of pit shape. The depth of a pyramidal pit was 1 mm lesser than that of a cylindrical
one on the basis that it approximated the lesser volume lost in the former case under the same
drilled depth. Meshing pattern for the detailed pit involved two schemes, namely a fine mesh with
16 shell elements and a coarse mesh with 8 shell elements surrounding one pit, as shown in Figure
9. With respect to the fine mesh scheme, one pit was described by 48 quadrilateral shell elements;
in the coarse mesh case, one pit was described by only 12 shell elements. The meshes in the regions
away from the pits were altered correspondingly with the variation of the mesh density in the pitting
region for the fine and coarse meshes, due to their shared boundaries.
In consideration of the random nature of pitting damage, structural symmetry was discarded in
all FE models. All degrees of freedom of nodes on the loaded end of the member were coupled to a
concentric node in the centroid of cross section, which served as a reference node for applying
compressive load and was only allowed to move along the longitudinal axis of the member. All the
nodes at the support end were constrained to simulate the fixed-ended boundary condition. A

loading displacement of 30 mm was gradually applied to the reference node to implement loading
process resembling the compressive loading test.
The measured engineering material stress and strain were converted into the true stress and
logarithmic strain for input into ANSYS, according to Eqs. (3) and (4),
)3()1( εσσ +=ture
)4()1ln(ln εε +=
where σ and ε are the measured stress and strain obtained from tensile coupon tests respectively,
while σtrue and εln are the true stress and logarithmic strain respectively.
The applied material curves input in the numerical modelling is shown in Figure 8. In terms of
initial geometric imperfection, a cosine wave shape was employed [23], defined as:
)5(12cos)(
−
= x
Lwxw m
π
where wm is the maximum deflection at the mid-length of member with 1/1000 of the effective
length, L, of member, and x is the location of a certain section in longitudinal direction of the
member. Geometrical and material nonlinearities were considered in the FE analysis.
4.2 Validation of numerical models
Validation of the numerical models, with coarse and fine meshes, was carried out by
benchmarking the FEA results against the experimental ones. Figure 9 displays the comparisons of
the ultimate loads obtained by the FE analyses and experimental tests as well as their relative errors.
The results show that fine mesh models provide more accurate ultimate load, without consuming
too much extra computing resource. The fine mesh model was thereby adopted for the remainder
sensitivity studies. Figure 10 shows the full load shortening curves of the typical numerical results
and their experimental counterparts, showing very good matches. The failure modes of the FE
models show excellent agreement with those derived from the tests s, as shown in Figure 11. The
developed FE model is therefore able to predict the ultimate loads, load-deformation behaviours,
and failure modes of the tubular members subject to pitting corrosion.

4.3 Structural performance under pseudo random pitting damages
Actual pitting corrosion has a more complex randomness in contrast to the artificial pitting
damage that was mechanically drilled in the tested members. The tested member was further used to
explore the effect of the randomness in pitting corrosion. The measured pit depth and diameter in
the tested member of UC3010d3.4 with a relatively higher pitting intensity were adapted into
pseudo random pitting damages in the form of localized pitting or widespread pitting. A simple
random number method was applied to model the random nature, related to the pit shape, pit depth
and pitting distribution, in the random pitting corrosion. The pit depths of 300 simulated pits
randomly varied in the range of [0.8, 6.8] mm resulting in an average depth of 3.4 mm, equal to the
measured mean depths. The diameters of the simulated pits varied in the range of [1.8, 13.2] mm
with a uniform distribution, resulting in a mean diameter of 6 mm equal to the size of the drilled
pits. Three random variables were applied to reflect all the random natures in pitting damage. The
simulated pit depths in the FE models were considered close to the corrosion data collected from
mild steel specimens with pit depths that follows a normal distribution with mean value of 3 mm
and standard deviation of 0.5 mm [29]. The pit shapes reflected by the randomly variant diameters
were also consistent with the ratio of pit diameter to depth in the range of [8:1, 10:1] as recorded for
marine structure [35].
A series of FE analyses were carried out to clarify statistical characteristics of the ultimate
strength and adverse impact of the random pitting damage on the structural behaviour.
4.3.1 Localized pitting corrosion
Figure 12 illustrates the results of the intact member and locally pitted members, showing the
load shortening curves and collapse mode at ultimate state. In the pitted member, all 300 pits had
constant shape and depth with 6 mm diameter and 3.4 mm depth, respectively, randomly scattered
on the local region in the middle or one end of the member. The localized pitting damage results in
an obvious discrepancy in the load shortening curves in the post-collapse stage due to the change in

the location of pitting distribution, as shown in Figure 12. The ultimate load for the intact member
is 354 kN; ultimate load for the member with pitting concentrated in the middle part is 321 kN; and
ultimate load for the member with pitting concentrated in one end is 311 kN. The simulated pitting
situated close to the support end thereby leads to a strength reduction, of about 12.1% compared
with the intact member, larger than that located in the middle part.
4.3.2 Measured pitting corrosion
Recalling the measured data of the pit depths in UC3010d3.4 showed maximum, minimum and
mean values of 3.9 mm, 3.1 mm and 3.4 m, respectively, as shown in Figure 2. The random nature
of the measured pit depth was simulated, ranging from 0.8 mm to 6.8 mm through a simple random
number method, which resulted in an average pit depth of 3.4 mm, i.e. equal to the mean value of
the measured pit depth. The diameters of those random pits were a constant of 6 mm, resulting in
pitting degradation of DOV 6.18%. All the pits were randomly allocated on the member surface in
numerical models. Stochastic analysis was performed on 200 FE models, each of which represented
a different pitting distribution pattern. This was done to explore the statistical characteristics of the
compressive strengths of the pitted member.
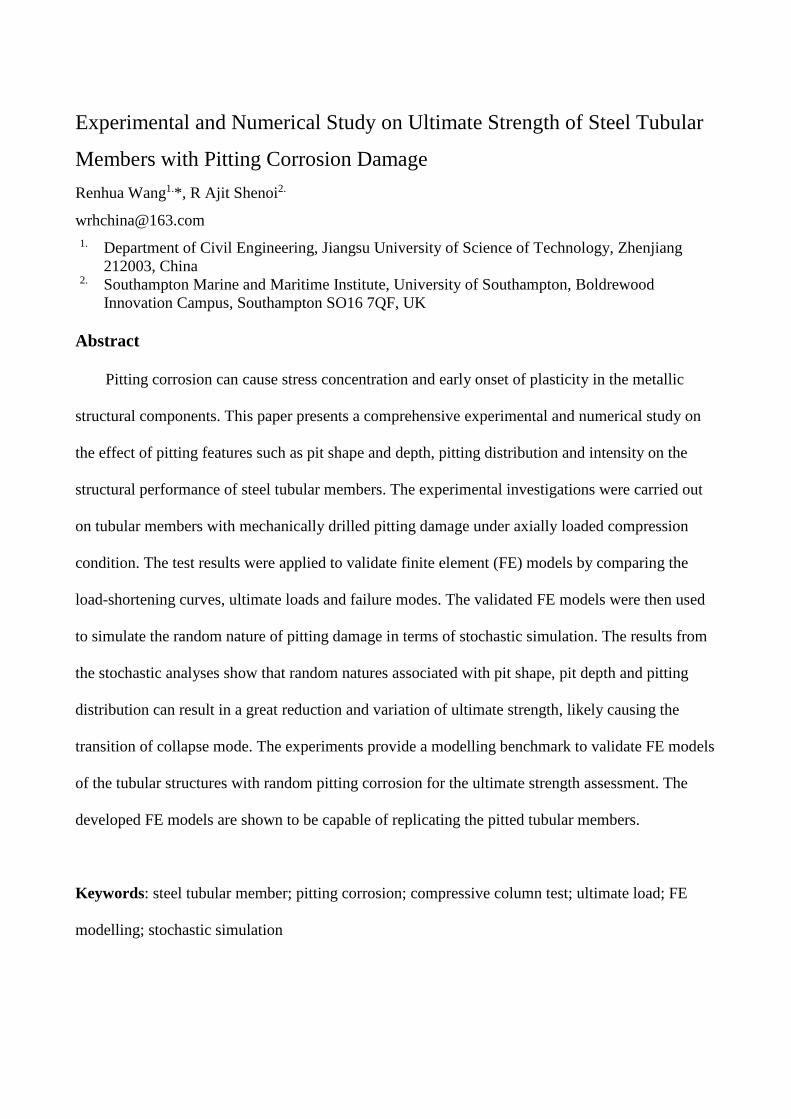
Figure 13 reports the statistical properties of ultimate loads for 200 FE models. The ultimate
strength of the tubular member under DOV 6.18% has a mean value of 323 kN and a standard
deviation (Stdev) of 2.046 kN, due to the change in the pitting distribution of the measured pitting.
While the ultimate strength seemingly complies with a normal distribution. The relative error of the
mean value against the tested result (327 kN) is about 1.2%. The worst pitting scenario leading to
the lowest strength results in a strength degradation about 3.3% more than the corresponding test
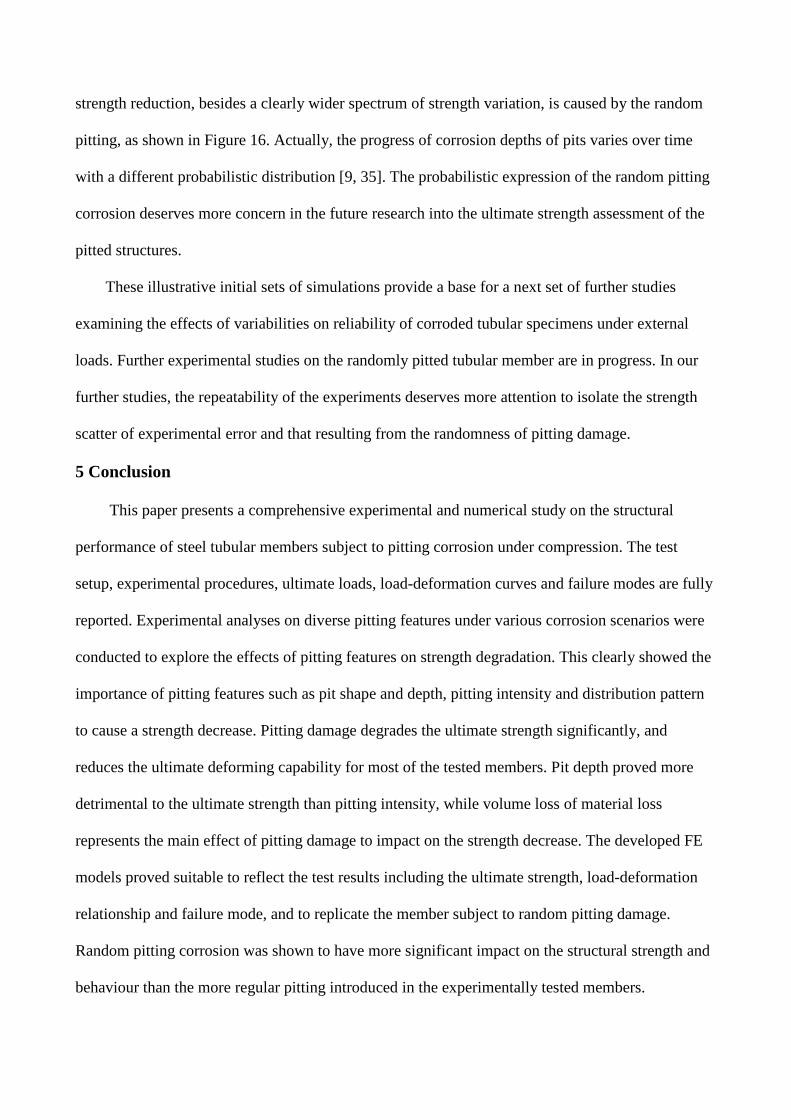
result. In respect to collapse mode, the FE models with the measured (limited random) pitting and
regular (uniform) pitting duplicating the tested member achieve a similar collapse mode, as shown
in Figure 14(a), which is featured by a global buckling same as that for the tested member shown in

Figure 5(right). Hence the limited random nature of pitting damage due to the mechanical drilling
has a minimal impact on the ultimate strength and does not affect the structural failure mode.
4.3.3 Random pitting corrosion
A pseudo random pitting was employed to explore the effect of the random nature in the pitting
corrosion damage. The random number method was applied in the construction of FE model. The
random pitting features involving the pit shape, pit depth and pitting distribution were all taken into
account. The statistical properties of the pit diameter and depth of the pseudo random pitting were
consistent with the measured data in the tested member. The simulated randomness were reflected
by the pit diameter ranging from 1.8 mm to 13.2 mm, equal to the average diameter of 6 mm, and
the pit depth ranging from 0.8 mm to 6.8 mm, equal to the average depth of 3.4 mm. The pitting
corrosion with such statistical features leaded to the degree of pitting degradation of DOV 7.59%.
Stochastic analysis accounting for the variation of pitting distribution was also carried out on the
200 FE models.
Figure 15 illustrates the statistical properties of the ultimate strength of the member with the
random pitting damage. The mean (310 kN) and minimum (260 kN) values of the ultimate strength
are respectively less than the test strength (327 kN) with about 5.2% and 20.5%. It is evident that
the random pitting results in a larger strength reduction compared with the measured more regular
pitting in the experiment. It also causes more significant variation in the ultimate strength. Notably,
in the worst case, an adverse pitting distribution of the random pitting leads to the structural failure
due to a local buckling but not the global buckling, as shown in Figure 14(b). Figure 14(c) shows
that the material yielding prior to the local buckling arises from the high stress concentration due to
two pits with relatively larger diameters situated on the side of the maximum compressive fiber of
the member. This results in the failure mode transition as found in the plated structures [15]. The
adverse impact of the random pitting damage deserves further exploration under different corrosion
scenarios.

4.3.4 Various levels of pitting intensities
Stochastic analysis was performed on 1000 FE models for variant pitting situations, which
covered a larger range of levels of pitting degradations within DOVs [0, 9]%, in order to study the
correlation of the reduction of ultimate strength with the level of pitting degradation thoroughly.
Figure 16 displays the results of these stochastic analyses together with the results of the 14 tested
members and 400 models simulated in the previous two Sections 4.3.2 and 4.3.3, showing the
relationship of ultimate loads of the pitted members with the volume loss of material. The variation
of the ultimate load, besides a significant decrease, becomes more serious with increase of the level
of pitting degradation.
Due to the simplification in the pitting morphology, treating the random pitting as that with a
regular shape, depth and distribution, the member tests tend to provide unduly optimistic results of
the ultimate strengths, as shown in Figure 16. In contrast, the prediction in terms of the FE models
can cover all the results of the member tests with regular pitting damage, except for that with
perforated pits due to its unconventionality for the in-service structures [5]. Hence, the developed
FE model herein is able to take the place of the expensive member test with artificial regular pitting.
On the other hand, since modelling random pitting as a regular one underestimates the reduction of
ultimate strength as reported in the experiments, which only concern a specified regular or irregular
pitting distribution, and the same pitting shape and depth, it may lead to a high risk in the structural
safety.
Comparisons of the collected results between the measured pitting and the random pitting in
Figure 16 show that the effect of pitting damage on the structural strength is highly related to the
expression of pitting corrosion model. The different expression results in a great disparity in the
volume loss of corroded material even if under the same statistical properties. For example, the
measured pitting and random pitting lead to DOV 6.18% and DOV 7.59% respectively, although
both models have the same mean values of pitting size and depth. Consequently, a more serious
strength reduction, besides a clearly wider spectrum of strength variation, is caused by the random
pitting, as shown in Figure 16. Actually, the progress of corrosion depths of pits varies over time
with a different probabilistic distribution [9, 35]. The probabilistic expression of the random pitting
corrosion deserves more concern in the future research into the ultimate strength assessment of the
pitted structures.
These illustrative initial sets of simulations provide a base for a next set of further studies
examining the effects of variabilities on reliability of corroded tubular specimens under external
loads. Further experimental studies on the randomly pitted tubular member are in progress. In our
further studies, the repeatability of the experiments deserves more attention to isolate the strength
scatter of experimental error and that resulting from the randomness of pitting damage.
5 Conclusion
This paper presents a comprehensive experimental and numerical study on the structural
performance of steel tubular members subject to pitting corrosion under compression. The test
setup, experimental procedures, ultimate loads, load-deformation curves and failure modes are fully
reported. Experimental analyses on diverse pitting features under various corrosion scenarios were
conducted to explore the effects of pitting features on strength degradation. This clearly showed the
importance of pitting features such as pit shape and depth, pitting intensity and distribution pattern
to cause a strength decrease. Pitting damage degrades the ultimate strength significantly, and
reduces the ultimate deforming capability for most of the tested members. Pit depth proved more
detrimental to the ultimate strength than pitting intensity, while volume loss of material loss
represents the main effect of pitting damage to impact on the strength decrease. The developed FE
models proved suitable to reflect the test results including the ultimate strength, load-deformation
relationship and failure mode, and to replicate the member subject to random pitting damage.
Random pitting corrosion was shown to have more significant impact on the structural strength and
behaviour than the more regular pitting introduced in the experimentally tested members.

Acknowledgements
This work was supported by Natural Science Foundation of Jiangsu Province of China [grant
number BK20151326], Natural Science Foundation of China [grant number 51879124], and the
sponsorship of Jiangsu Overseas Research & Training Program for University Prominent Young &
Middle-aged Teachers and Presidents (2016). The first author gratefully appreciated these supports.
Reference
[1] Khedmati MR, Nazari M. A numerical investigation into strength and deformation characteristics of preloaded
tubular members under lateral impact loads. Marine Structures. 2012;25:33-57.
[2] Monsalve-Giraldo JS, Giraldo-Londoño O, Colorado-Urrea GJ, Dantas CMS, Aristizabal-Ochoa JD. Second-order
analysis of an imperfect corroded tubular member on a two-parameter elastic foundation. Eng Struct. 2017;137:223-35.
[3] Wang X, Melchers RE. Long-term under-deposit pitting corrosion of carbon steel pipes. Ocean Eng. 2017;133:231-
43.
[4] Caines S, Khan F, Shirokoff J. Analysis of pitting corrosion on steel under insulation in marine environments. J Loss
Prevent Proc. 2013;26:1466-83.
[5] API/ASME. API 579-1/ASME FFS-1 Fitness-For-Service. 2016.
[6] Tan C, Lu Y, Zhang X. Life extension and repair decision-making of ageing offshore platforms based on DHGF
method. Ocean Eng. 2016;117:238-45.
[7] Zeinoddini M, Ranjbar P, Khalili H, Ranaei A, Golpour H, Fakheri J. Remaining fatigue life assessment of aging
fixed steel offshore jacket platforms. Structure and Infrastructure Engineering. 2016;12:223-38.
[8] Vanaei HR, Eslami A, Egbewande A. A review on pipeline corrosion, in-line inspection (ILI), and corrosion growth
rate models. Int J Pres Ves Pip. 2017;149:43-54.
[9] Bhandari J, Khan F, Abbassi R, Garaniya V, Ojeda R. Modelling of pitting corrosion in marine and offshore steel
structures – A technical review. J Loss Prevent Proc. 2015;37:39-62.
[10] Dewanbabee H, Das S. Structural behavior of corroded steel pipes subject to axial compression and internal
pressure: Experimental study. J Struct Eng. 2013;139:57-65.
[11] Mohd MH, Lee BJ, Cui Y, Paik JK. Residual strength of corroded subsea pipelines subject to combined internal
pressure and bending moment. Ships and Offshore Structures. 2015;10:554-64.
[12] Hebor ME, Rieles JM. Local buckling strength of patch corrosion damaged steel tubular bracing. International
Journal of Steel Structures. 2002;2:59-70.
[13] Nazaria M, Khedmati MR, Khalaj AF. A numerical investigation into ultimate strength and buckling behavior of
locally corroded steel tubular members. Latin American Journal of Solids and Structures. 2014;11:1063-76.
[14] Ahn J-H, Choi WR, Jeon SH, Kim S-H, Kim I-T. Residual compressive strength of inclined steel tubular members
with local corrosion. Appl Ocean Res. 2016;59:498-509.
[15] Amlashi HKK, Moan T. On the strength assessment of pitted stiffened plates under biaxial compression loading.
ASME 24th International Conference on Offshore Mechanics and Arctic Engineering. Halkidiki, Greece2005. p. 83-92.

[16] Sultana S, Wang Y, Sobey AJ, Wharton JA, Shenoi RA. Influence of corrosion on the ultimate compressive
strength of steel plates and stiffened panels. Thin Wall Struct. 2015;96:95-104.
[17] Nakai T, Matsushita H, Yamamoto N, Arai H. Effect of pitting corrosion on local strength of hold frames of bulk
carriers (1st report). Marine Structures. 2004;17:403-32.
[18] Sheng J, Xia J. Effect of simulated pitting corrosion on the tensile properties of steel. Constr Build Mater.
2017;131:90-100.
[19] Paik JK, Lee JM, Ko MJ. Ultimate compressive strength of plate elements with pit corrosion wastage. Journal of
Engineering for the Maritime Environment. 2003;217:185-200.
[20] Nakai T, Matsushita H, Yamamoto N. Effect of pitting corrosion on local strength of hold frames of bulk carriers
(2nd Report) – Lateral-distortional buckling and local face buckling. Marine Structures. 2004;17:612-41.
[21] Nakai T, Matsushita H, Yamamoto N. Effect of pitting corrosion on strength of web plates subjected to patch
loading. Thin Wall Struct. 2006;44:10-9.
[22] Zhang Y, Huang Y, Wei Y. Ultimate strength experiment of hull structural plate with pitting corrosion damage
under unaxial compression. Ocean Eng. 2017;130:103-14.
[23] Lutes LD, Kohutek TL, Ellison BK, Konen KF. Assessing the compressive strength of corroded tubular members.
Appl Ocean Res. 2001;23:263-8.
[24] Yamane M, Tanaka K, Matsuda B, Fujikubo M, Yanagihara D, Iwao N. Residual strength evaluation of corroded
steel members in marine environments. 16th International Offshore and Polar Engineering Conference. San Francisco,
California, USA: International Society of Offshore and Polar Engineers; 2006.
[25] ISO19902. Petroleum and natural gas industries – Fixed steel offshore structures. 2007.
[26] Wang Y, Wharton JA, Shenoi RA. Ultimate strength analysis of aged steel-plated structures exposed to marine
corrosion damage: A review. Corros Sci. 2014;86:42-60.
[27] ASTM G46-94. Standard guide for examination and evaluation of pitting corrosion. 2013.
[28] Wang R, Ajit Shenoi R, Sobey A. Ultimate strength assessment of plated steel structures with random pitting
corrosion damage. J Constr Steel Res. 2018;143:331-42.
[29] Melchers RE. Statistical characterization of pitting corrosion - Part 2: Probabilistic modeling for maximum pit
depth. Corrosion. 2005;61:766-77.
[30] Daidola JC, Parente J, Orisamolu IR, Ma KT. Residual strength assessment of pitted plate panels. Washington,
D.C.: U.S. Coast Guard (G-MMS/SSC); 1997.
[31] Jiang X, Guedes Soares C. Ultimate capacity of rectangular plates with partial depth pits under uniaxial loads.
Marine Structures. 2012;26:27-41.
[32] Zhang Y, Huang Y, Zhang Q, Liu G. Ultimate strength of hull structural plate with pitting corrosion damnification
under combined loading. Ocean Eng. 2016;116:273-85.
[33] Zhao O, Gardner L, Young B. Testing and numerical modelling of austenitic stainless steel CHS beam–columns.
Eng Struct. 2016;111:263-74.
[34] Silva CC, Farias JP. Non-uniformity of residual stress profiles in butt-welded pipes in manual arc welding. J Mater
Process Tech. 2008;199:452-5.
[35] Yamamoto N. Probabilistic model of pitting corrosion and the simulation of pitted corroded condition. ASME
27th International Conference on Offshore Mechanics and Arctic Engineering. Estoril, Portugal2008. p. 527-34.


List of Figures and Tables
Figure 1 Typical tested steel tubular members with uniformly and crosswise distributed pits
Figure 2 Measured pit depths of tested members
Figure 3 Stress-strain relation of tested members
Figure 4 Schematic diagram of experimental setup
Figure 5 Failure modes of typical tested members
Figure 6 Load shortening curves of typical tested members
Figure 7 Ultimate strength reduction versus corroded volume loss
Figure 8 Stress-strain relationship of tested members applied in numerical analysis
Figure 9 Comparison between numerical and experimental results
Figure 10 Load shortening curves of typical experimental and corresponding numerical results
Figure 11 Failure mode of typical experimental and numerical results
Figure 12 Load shortening curves and collapse modes of tubular members with localized pitting
damage
Figure 13 Frequency of ultimate strengths of tubular members subject to measured pitting damage
Figure 14 Collapse modes of tubular members subject to pitting damage
Figure 15 Frequency of ultimate strengths of tubular members subject to random pitting damage
Figure 16 Comparison of ultimate loads between experimental and FE results
Table 1 Pitting damage in tested members
Table 2 Summary of experimental results of pitted members
Table 3 Comparison of pitting effect on strength reduction

Figures
Figure 1 Typical tested steel tubular members with uniformly and crosswise distributed pits
Figure 2 Measured pit depths of tested members
460
54
Length: 460 mm Diameter: 54 mm Shell thickness: 6.9 mm Pit diameter: 6 mm
Ф6 mm
46, 5
6 or
59
uniform pits
interleaved pits

Figure 3 Stress-strain relations of tensile specimens of tested members
Figure 4 Schematic diagram of experimental setup
Loading actuator
Support platform
Wedge connector
Endplate
Rigid platen
Rigid platen

Figure 5 Failure modes of typical tested members
Figure 6 Load shortening curves of typical tested members
IC2010d4.8 UC3010d3.4

Figure 7 Ultimate strength reduction versus corroded volume loss
Figure 8 Stress-strain relationship of tested members applied in numerical analysis

Figure 9 Comparison between numerical and experimental results
Figure 10 Load shortening curves of typical experimental and corresponding numerical results
pitting vicinity pitting cavity
Coarse mesh
Fine mesh

Figure 11 Failure mode of typical experimental and numerical results
Figure 12 Load shortening curves and collapse modes of tubular members with localized pitting
damage
UC2008d2.8 UC2410d3.8 UC2410d6.9
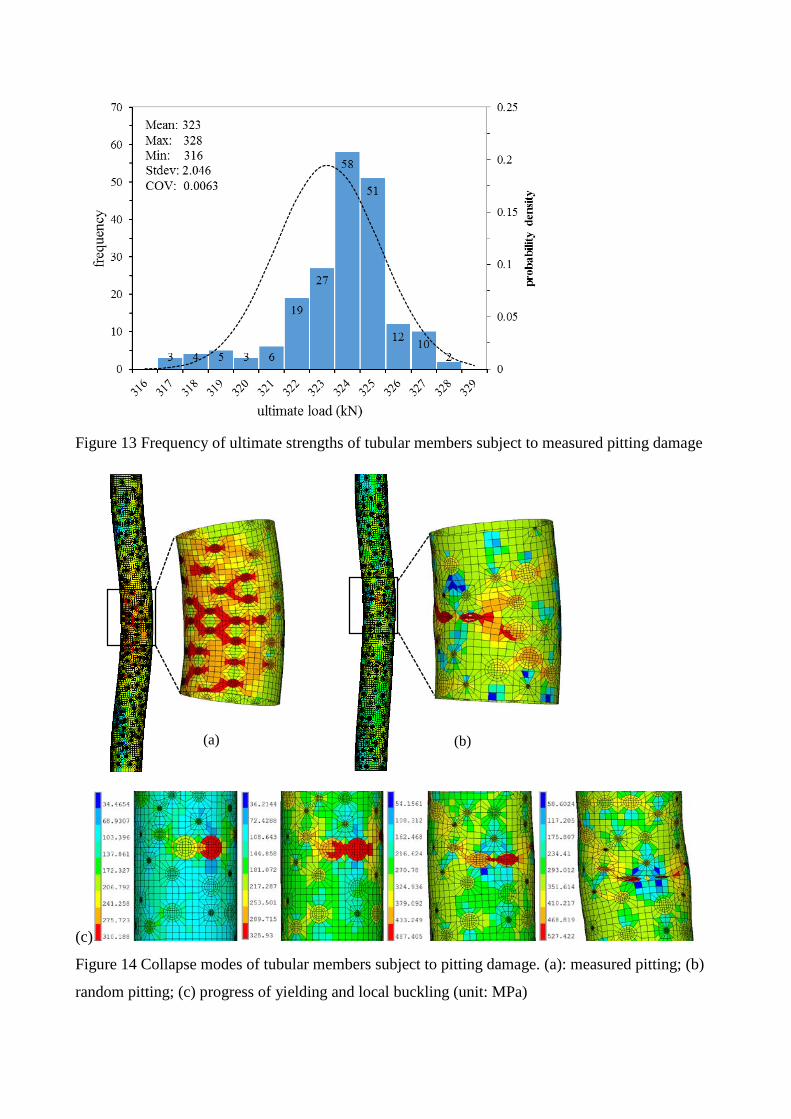
Figure 13 Frequency of ultimate strengths of tubular members subject to measured pitting damage
(c)
Figure 14 Collapse modes of tubular members subject to pitting damage. (a): measured pitting; (b)
random pitting; (c) progress of yielding and local buckling (unit: MPa)
(a) (b)

Figure 15 Frequency of ultimate strengths of tubular members subject to random pitting damage
Figure 16 Comparison of ultimate loads between experimental and FE results

Tables Table 1 Pitting damage in tested members
No. Specimen ID pit number distribution pit shape pit depth (mm)
DOP (%)
DOV (%)
1 INATCT - - - - -
2 IC2010d4.9 20×10 interleaved circular 4.9 8.31 5.90
3 UC2010d4.8 20×10 uniform circular 4.8 8.31 5.78 4 UC2008d5.3 20×8 uniform circular 5.3 6.65 5.11
5 IC2010d2.9 20×10 interleaved circular 2.9 8.31 3.49 6 UC2010d2.8 20×10 uniform circular 2.8 8.31 3.37
7 UC2008d2.8 20×8 uniform circular 2.8 6.65 2.70 8 IC3010d3.3 30×10 interleaved circular 3.3 12.46 5.96
9 UC3010d3.4 30×10 uniform circular 3.4 12.46 6.14 10 UC2410d6.9 24×10 uniform circular 6.9 9.97 9.97
11 UC2410d3.9 24×10 uniform circular 3.9 9.97 5.63 12 UC2410d3.8 24×10 uniform circular 3.8 9.97 5.49
13 UP2410d3.6 24×10 uniform pyramidal 3.6 9.97 3.76 14 UP2410d5.1 24×10 uniform pyramidal 5.1 9.97 5.92
Table 2 Summary of experimental results of pitted members
No. Specimen ID DOP (%) DOV (%) Ultimate load Axial deformation
Fu (kN) δF (%) △u (mm) δ△(%)
1 INTACT - - 377 - 16.378 - 2 IC2010d4.9 8.31 5.90 323 14.4 15.385 6.1
3 UC2010d4.8 8.31 5.78 325 13.7 15.726 4.0 4 UC2008d5.3 6.65 5.11 320 15.2 16.039 2.1
5 IC2010d2.9 8.31 3.49 329 12.8 15.553 5.0 6 UC2010d2.8 8.31 3.37 328 13.1 15.758 3.8
7 UC2008d2.8 6.65 2.70 340 9.8 14.455 11.7 8 IC3010d3.3 12.46 5.96 313 16.9 15.83 3.3
9 UC3010d3.4 12.46 6.14 327 13.3 16.504 -0.8 10 UC2410d6.9 9.97 9.97 290 23.2 16.102 1.7
11 UC2410d3.9 9.97 5.63 323 14.3 16.794 -2.5 12 UC2410d3.8 9.97 5.49 327 13.2 14.895 9.1
13 UP2410d3.6 9.97 3.76 345 8.4 15.47 5.5 14 UP2410d5.1 9.97 5.92 325 13.7 17.174 -4.9
Notes: the degradation of ultimate load, δF = (Fref -Fu)/Fref ×100 (%); and the degradation of deformation, δ△ = (△ref -△u)/△ref ×100 (%)

Table 3 Comparison of pitting effect on strength reduction Pitting feature Subgroup Specimen ID Fu (kN) δF (%)
SHAPE A UP2410d3.6 345 8.37
UC2410d3.8 327 13.17
B UC2410d3.9 323 14.34 UP2410d5.1 325 13.69
DEPTH A UC2008d2.8 340 9.78 UC2008d5.3 320 15.22
B UC2010d2.8 328 13.06 UC2010d4.8 325 13.67
C UC2410d3.9 323 14.34 UC2410d6.9 290 23.17
DOP A UC2008d2.8 340 9.78 UC2010d2.8 328 13.06
B UC2008d5.3 320 15.22 UC2010d4.8 325 13.67
C UC2410d3.8 327 13.17 UC3010d3.4 327 13.26
PATTERN A UC2010d2.8 328 13.06 IC2010d2.9 329 12.79
B UC2010d4.8 325 13.67 IC2010d4.9 323 14.45
C IC3010d3.3 313 16.90 UC3010d3.4 327 13.26
Notes: the degradation of ultimate load, δF = (Fref -Fu)/Fref ×100 (%)