experimental and numerical study of methane-air … · experimental and numerical study of...
TRANSCRIPT

Experimental and Numerical Study of Methane-air Deflagrations in a Vented Enclosure
C. REGIS BAUWENS, JEFF CHAFFEE and SERGEY DOROFEEV FM Global, Engineering and Research 1151 Boston-Providence Turnpike Norwood, Massachusetts 02062 USA
ABSTRACT
Results of a series of tests on the deflagration of methane-air mixtures in a large vented enclosure are presented. Experiments were made in FM Global’s 63.7 m3 chamber. The chamber was 4.6 x 4.6 x 3.0 m with a vent opening on one side. Vent areas of either 2.7 or 5.4 m2 were used. Tests were performed with ignition either at the center of the chamber or at the center of the wall opposite the vent. Methane-air mixtures with methane concentrations close to 9.5% vol. were used in the tests. Pressure data, as function of time, and flame time-of-arrival data were obtained both inside and outside the chamber near the vent. Detailed experimental data is used in the paper to test a three-dimensional gasdynamic model for the simulation of gaseous combustion in vented enclosures. The model is based on a Large Eddy Simulation (LES) solver created using the OpenFOAM CFD toolbox using sub-grid turbulence and flame wrinkling models. Results from the calculations are compared with the experimental data. The capabilities and deficiencies of the model are discussed.
KEYWORDS: explosion, venting, CFD, modeling, LES
NOMENCLATURE LISTING
a model parameter Greekb combustion regress variable δ Flame thickness (m) D diffusion coefficient (m2/s) Ξ flame surface wrinkling factor G sub-grid wrinkling generation rate ρ density (kg/m3) LT integral turbulent length scale (m) σs Resolved strain rate (1/s) R sub-grid wrinkling removal rate σt Surface filtered strain rate (1/s) SL laminar burning velocity (m/s) τη Kolmogorov timescale (s) t time (s) φ equivalence ratio T temperature (K) subscriptsu' turbulent intensity (m/s) u unburned US local flame front velocity (m/s) eq equilibrium value
INTRODUCTION
A deflagration contained by a closed volume filled with a fuel-air mixture can produce maximum internal pressures of up to 6 to 10 times its initial pressure. Most structures however, will fail at a far lower pressure, in the range of tenths of bars. Venting can be used to prevent or minimize damage to an enclosure by relieving the pressure within the volume. Experimentally, the subject of vented explosions has been extensively studied with research performed over a wide range of scales, including laboratory scale tests (see, e.g., [1]) and large scale tests (see e.g., [2, 3, 4]). Factors, contributing to the pressure build-up in vented explosions, were found to include Helmholz oscillations [1, 4], the external explosion [1, 5], flame instabilities [1, 3, 6], flame-acoustic interactions [1, 2, 3], and turbulence generation [3, 4, 7, 8].
Analytical models and empirical correlations have also been developed (see, e.g., [8, 9, 10, 11]), with some of the correlations being included in engineering guidelines [12, 13]. These correlations however, can often have conflicting recommendations. This is because of the complex nature of the process itself, as mentioned above, and the influence of other factors that can affect the peak overpressure, such as size and shape of the enclosure, the mixture being burned, the type of vent and vent deployment pressure, congestion or obstacles inside the chamber and ignition location.
1043FIRE SAFETY SCIENCE–PROCEEDINGS OF THE NINTH INTERNATIONAL SYMPOSIUM, pp. 1043-1054
COPYRIGHT © 2008 INTERNATIONAL ASSOCIATION FOR FIRE SAFETY SCIENCE / DOI:10.3801/IAFSS.FSS.9-1043
Computational Fluid Dynamics (CFD) simulations of vented explosions, and the comparison of these simulations with experimental data [4, 14, 15], have shown that it is a challenge to adequately model the major physical phenomena involved. Although there are a few examples of successful CFD applications for several selected tests, such as [15], it is not unusual to find CFD prediction that are off the test results by orders of magnitude.
Because of the limited reliability of the current methods for prediction of pressure generation during vented explosions, a research project was initiated at FM Global with the goal of generating a set of experimental data focusing on the effects of mixture composition, ignition location, vent size, obstacles and scale on vented explosion overpressures. The set of data will be used to develop and validate a computational code that will be further extended to assist in the development of new models and engineering tools.
The objectives of the present work are to (i) summarize the test data obtained for low reactivity mixtures (represented by a methane-air mixture), low explosion pressures (below 0.1 of the ambient pressure), in a room-size enclosure without obstacles; (ii) identify the main physical factors responsible for the pressure generation under this range of initial conditions; (iii) test a numerical CFD model and identify its capabilities and deficiencies to describe the physics responsible for the pressure build-up. Two parameters, vent size and ignition location, were varied in the series of tests presented here.
EXPERIMENTS
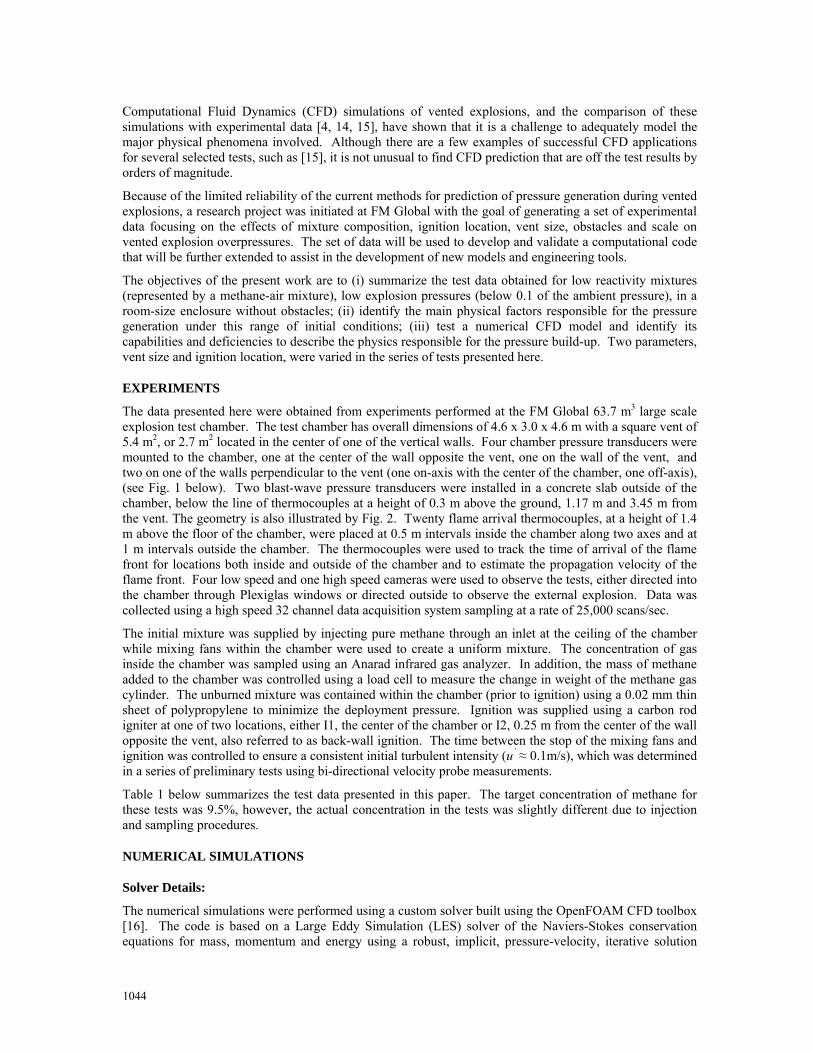
The data presented here were obtained from experiments performed at the FM Global 63.7 m3 large scale explosion test chamber. The test chamber has overall dimensions of 4.6 x 3.0 x 4.6 m with a square vent of 5.4 m2, or 2.7 m2 located in the center of one of the vertical walls. Four chamber pressure transducers were mounted to the chamber, one at the center of the wall opposite the vent, one on the wall of the vent, and two on one of the walls perpendicular to the vent (one on-axis with the center of the chamber, one off-axis), (see Fig. 1 below). Two blast-wave pressure transducers were installed in a concrete slab outside of the chamber, below the line of thermocouples at a height of 0.3 m above the ground, 1.17 m and 3.45 m from the vent. The geometry is also illustrated by Fig. 2. Twenty flame arrival thermocouples, at a height of 1.4 m above the floor of the chamber, were placed at 0.5 m intervals inside the chamber along two axes and at 1 m intervals outside the chamber. The thermocouples were used to track the time of arrival of the flame front for locations both inside and outside of the chamber and to estimate the propagation velocity of the flame front. Four low speed and one high speed cameras were used to observe the tests, either directed into the chamber through Plexiglas windows or directed outside to observe the external explosion. Data was collected using a high speed 32 channel data acquisition system sampling at a rate of 25,000 scans/sec.
The initial mixture was supplied by injecting pure methane through an inlet at the ceiling of the chamber while mixing fans within the chamber were used to create a uniform mixture. The concentration of gas inside the chamber was sampled using an Anarad infrared gas analyzer. In addition, the mass of methane added to the chamber was controlled using a load cell to measure the change in weight of the methane gas cylinder. The unburned mixture was contained within the chamber (prior to ignition) using a 0.02 mm thin sheet of polypropylene to minimize the deployment pressure. Ignition was supplied using a carbon rod igniter at one of two locations, either I1, the center of the chamber or I2, 0.25 m from the center of the wall opposite the vent, also referred to as back-wall ignition. The time between the stop of the mixing fans and ignition was controlled to ensure a consistent initial turbulent intensity (u’ ≈ 0.1m/s), which was determined in a series of preliminary tests using bi-directional velocity probe measurements.
Table 1 below summarizes the test data presented in this paper. The target concentration of methane for these tests was 9.5%, however, the actual concentration in the tests was slightly different due to injection and sampling procedures.
NUMERICAL SIMULATIONS
Solver Details:
The numerical simulations were performed using a custom solver built using the OpenFOAM CFD toolbox [16]. The code is based on a Large Eddy Simulation (LES) solver of the Naviers-Stokes conservation equations for mass, momentum and energy using a robust, implicit, pressure-velocity, iterative solution
1044
framework, with a fully compressible Pressure-Implicit Split Operator (PISO) solution method [17]. The sub-grid scale turbulence model used was a one equation eddy viscosity model [18].
Fig. 1. Plan view of test configuration showing locations of the chamber pressure transducers (rectangles), five groups of flame arrival thermocouples (circles), blast wave pressure transducers (triangles), and the
ignition locations I1 and I2.
Table 1. Summary of Explosion Tests.
Test # Concentration (% Vol.) Ignition Location Vent Size (m2) 1 9.0 ± 0.3 Center 5.4 2 10.3 ± 0.3 Center 5.4 3 9.8 ± 0.3 Back-wall 5.4 4 9.5 ± 0.3 Back-wall 5.4 5 9.2 ± 0.3 Center 2.7 6 9.2 ± 0.3 Back-wall 2.7
The solver uses finite volume numerics to solve systems of partial differential equations built on 3D unstructured meshes of polyhedral cells. However, for the current study a structured grid was used. Second order schemes were used in space and time, central differencing for velocity, a bounded NVD scheme for scalars, and second order backward differencing in time.
The combustion model used was a modified form of the Weller flamelet combustion model [19], which is based on a transport equation for a regress combustion variable b, a normalized unburned mixture fraction given by b = 0 as burned and b = 1 as unburned, given by Eq. 1.
( ) ( ) bΞSbbtb
Lu~~~~~
∇−=∇⋅∇−⋅∇=∂∂ ρρρρ
DU , (1)
where, ρ is density, D is a diffusion coefficient, SL is the laminar burning velocity and Ξ is the flame surface wrinkling factor.
Flame burning velocity was modeled as a product of laminar burning velocity SL and a flame surface wrinkling factor Ξ. SL was assumed to be a power function of unburned temperature and pressure with
0.5 m
4.6 m
4.6
m P3
P2 P1
P4
1 m
I1 I2
1045

empirical values of exponents [20]. The surface wrinkling factor Ξ was computed using a transport equation taking into account the generation and removal of Ξ, given by Eq. 2 below [19]:
( ) ( )ΞΞRΞGΞtΞ
tss σσ −+−−=∇⋅+∂∂ 1U , (2)
where, Us is the local instantaneous velocity of the flame front, σt and σs are the resolved and surface filtered resolved strain rates respectively, and G and R are sub-grid wrinkling generation and removal rates given by,
( )( ) ( )( )[ ] 1** 1121112 −−−+⋅−−= eqeq ΞbΞbRG , (3)
( ) 1*1* 128.0 −− −= eqeq ΞΞR ητ , (4)
where, τη is the Kolmogorov timescale and *eqΞ is the equilibrium Ξ given by the following turbulent
burning velocity correlation:
( ) ( ) ⎥⎦
⎤⎢⎣
⎡= 6
121
'* //48.1,1max δTLeq LSuaΞ , (5)
where, u’ is the turbulent intensity, LT is the integral turbulent length scale and δ is the flame thickness.
The second term in Eq. 5 is a turbulent burning velocity correlation proposed by Bradley [21] with an additional scaling factor, a. The scaling factor was necessary because the absolute value of the burning velocity predicted by Bradley’s correlation is only estimated within a factor of 2. The value of a, was the only unknown parameter in the model. A value of a = 0.7 was used for all simulations, which provided a good agreement for initial flame propagation velocity with the experimental results. Mixing of the vented unburned mixture with air was taken into account with an additional scalar transport equation for mixture fraction [16].
It should be noted that a more general version of this model can account for the hydrodynamic flame instability. At the sub-grid scale this requires an additional wrinkling generation term and an increased equilibrium flame wrinkling value. This instability was not modeled on the sub-grid scale in this study because the initial conditions of the tests were characterized by pre-existing turbulence, and the effect of the instability for the mixture tested was found to be weak. This is supported by the fact that the initial flame velocity (at a flame radius of about 0.3 m) was about 1.2 times the laminar values, which is close to that which is expected for flames with a u’/SL ≈ 0.25. Further flame evolution was considered to be based on the resolved flame surface growth, and on the sub-grid flame wrinkling model described above.
Mesh Geometry, Initial and Boundary Conditions:
The computational mesh generated for the geometry of the 63.7 m3 explosion test chamber was created matching the significant features of the experimental setup. An external volume of 10.0 x 6.0 x 7.6 m was also meshed to capture the external explosion and chamber venting. A cell size of 7.5 cm was used creating a computational mesh of approximately 106 cells, the limit for a reasonable study. Finer and coarser meshes with cell sizes of 6 and 10 cm were also tested. Flame speeds and maximum overpressures appeared to be within ±8% for all the meshes, and the grid convergence was found to be acceptable. The geometry of the computational domain is illustrated below by Fig. 2.
1046

Fig. 2. The geometry of the computational domain used in the numerical simulations.
The boundary conditions applied to the geometry were non-slip adiabatic walls for the chamber walls and the ground, and a total pressure boundary condition was used for the free boundaries to minimize reflections. An unrestricted open vent was used for all simulations.
The initial level of turbulence was chosen to match the experimental results. To generate the initial velocity field, large scale velocity perturbations were created and allowed to decay in the computational domain to create a quasi-uniform turbulent velocity field with u’ ≈ 0.1 m/s.
RESULTS
Physical Phenomena Observed in the Tests:
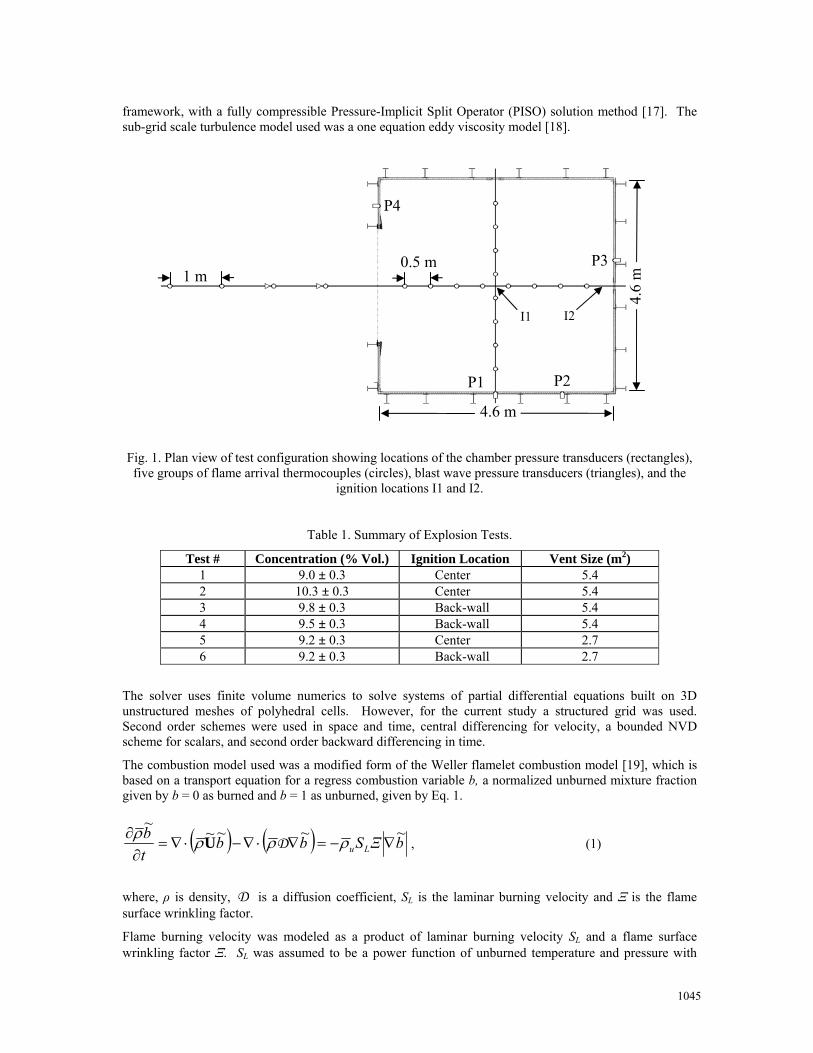
Test #1 is used here as an example to describe the main physical effects responsible for the development of pressure build-up for the range of initial conditions used in the current series of tests. A filtered and unfiltered pressure time history of this test is shown in Fig. 3. An 80 Hz low pass filter was used to remove the higher frequency component of the pressure signal and isolate the overpressures acting at a low enough frequency to present a potentially damaging pressure load on a structure. The general shape of the pressure time history is similar to that observed for natural gas deflagrations in a smaller 2.5 m3 chamber [1].
Multiple pressure peaks and various oscillations are clearly visible in Fig. 3. The first minor peak(s) occurring between t ≈ 0.2 - 0.3 s correspond to the deployment, i.e. destruction, of the polypropylene sheet. This is followed by a more distinctive peak occurring at t ≈ 0.4 s, which is caused by burned gas exiting the vent. When the burned gas reaches the vent the volumetric flow of gas exiting the chamber is greatly increased due to the decrease in density of the vented gas. This increase in venting temporarily results in a decrease in the chamber’s internal pressure as the venting outpaces the volume expansion due to combustion. However, due to inertia of the outflow, the burned gas is over-vented. This triggers a ≈30 Hz Helmholtz oscillation, which causes the internal chamber pressure to oscillate about the equilibrium pressure.
It is important to note that the Helmholtz oscillation is greatly amplified by a Taylor instability introduced when the less dense burned gas is accelerated into the denser unburned mixture. When the flame front interface is accelerated toward the unburned mixture, the Taylor instability creates a large increase in flame surface area. This can be seen in the high speed photographs shown in Fig. 4. The left image in Fig. 4 shows the flame surface as the front is accelerated out of the chamber during the initial venting of burned
Chamber
Vent
1047
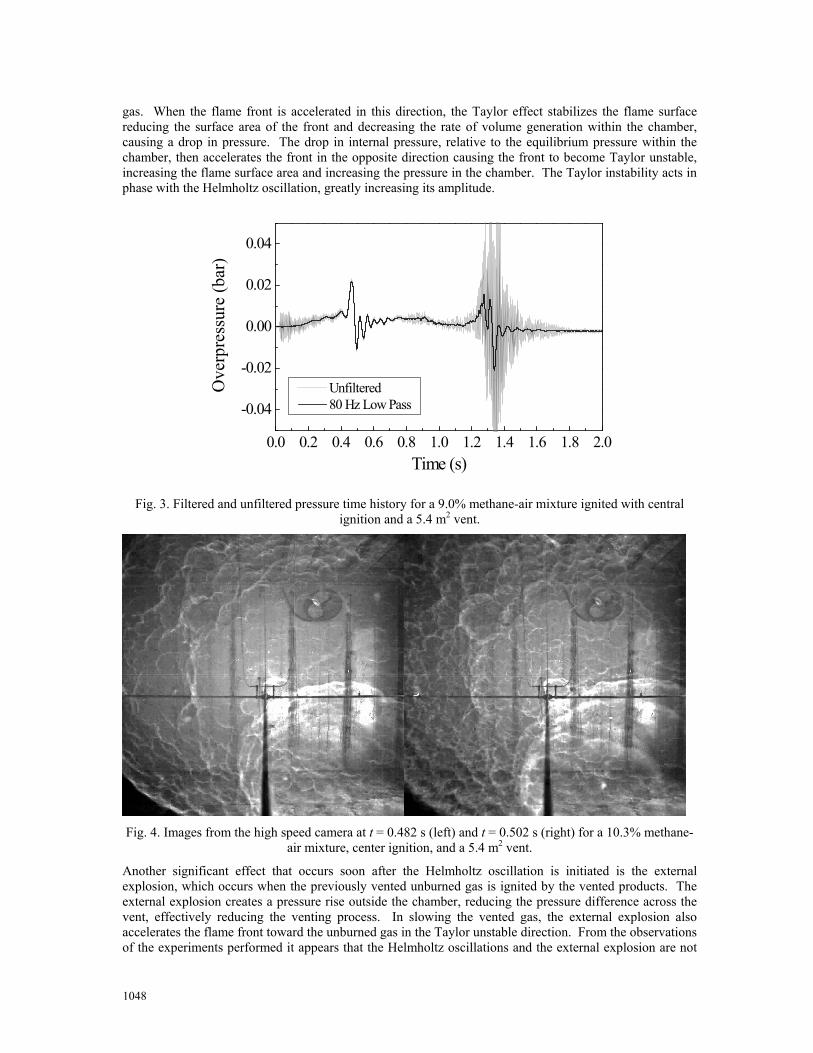
gas. When the flame front is accelerated in this direction, the Taylor effect stabilizes the flame surface reducing the surface area of the front and decreasing the rate of volume generation within the chamber, causing a drop in pressure. The drop in internal pressure, relative to the equilibrium pressure within the chamber, then accelerates the front in the opposite direction causing the front to become Taylor unstable, increasing the flame surface area and increasing the pressure in the chamber. The Taylor instability acts in phase with the Helmholtz oscillation, greatly increasing its amplitude.
0.0 0.2 0.4 0.6 0.8 1.0 1.2 1.4 1.6 1.8 2.0
-0.04
-0.02
0.00
0.02
0.04O
verp
ress
ure
(bar
)
Time (s)
Unfiltered 80 Hz Low Pass
Fig. 3. Filtered and unfiltered pressure time history for a 9.0% methane-air mixture ignited with central ignition and a 5.4 m2 vent.
Fig. 4. Images from the high speed camera at t = 0.482 s (left) and t = 0.502 s (right) for a 10.3% methane-
air mixture, center ignition, and a 5.4 m2 vent. Another significant effect that occurs soon after the Helmholtz oscillation is initiated is the external explosion, which occurs when the previously vented unburned gas is ignited by the vented products. The external explosion creates a pressure rise outside the chamber, reducing the pressure difference across the vent, effectively reducing the venting process. In slowing the vented gas, the external explosion also accelerates the flame front toward the unburned gas in the Taylor unstable direction. From the observations of the experiments performed it appears that the Helmholtz oscillations and the external explosion are not
1048
necessarily in phase with one another. The interaction between the external explosion and the Helmholtz oscillations likely depends on such factors as flame propagation speed, ignition location and chamber geometry. When the two phenomena are in phase, the associated pressure peak is relatively strong (as in Figs. 6 and 7), while if they are out of phase the associated peak is attenuated (see Fig. 8).
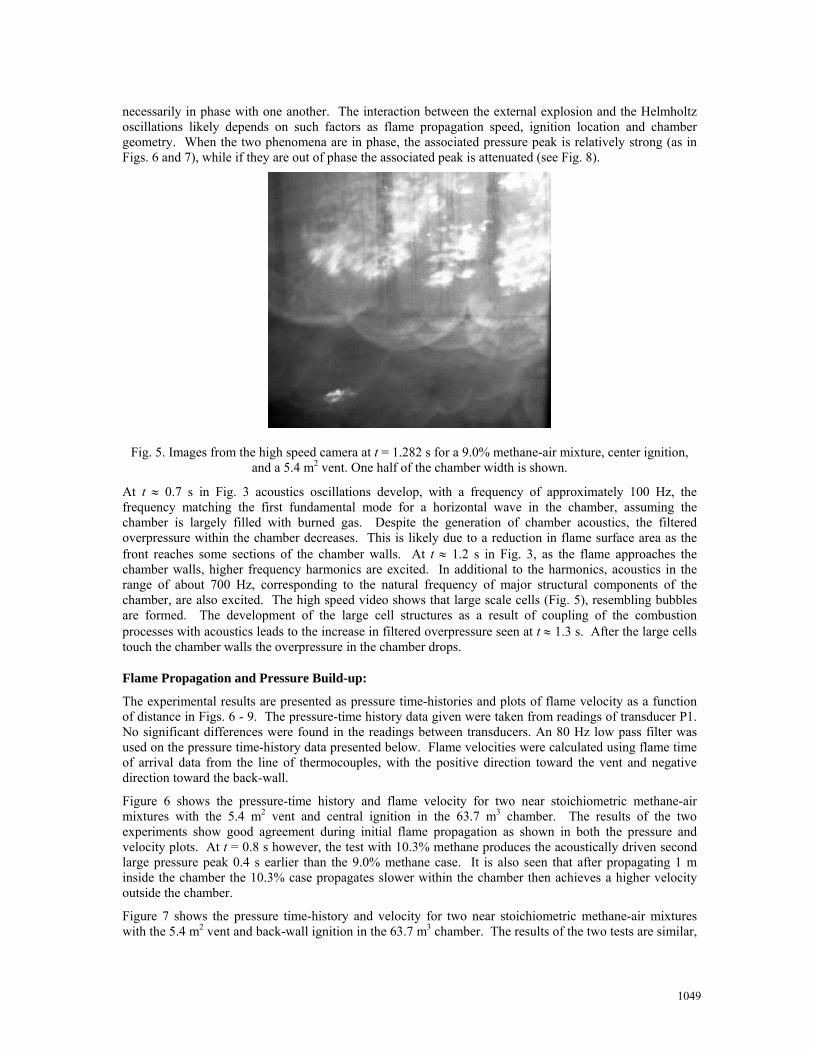
Fig. 5. Images from the high speed camera at t = 1.282 s for a 9.0% methane-air mixture, center ignition, and a 5.4 m2 vent. One half of the chamber width is shown.
At t ≈ 0.7 s in Fig. 3 acoustics oscillations develop, with a frequency of approximately 100 Hz, the frequency matching the first fundamental mode for a horizontal wave in the chamber, assuming the chamber is largely filled with burned gas. Despite the generation of chamber acoustics, the filtered overpressure within the chamber decreases. This is likely due to a reduction in flame surface area as the front reaches some sections of the chamber walls. At t ≈ 1.2 s in Fig. 3, as the flame approaches the chamber walls, higher frequency harmonics are excited. In additional to the harmonics, acoustics in the range of about 700 Hz, corresponding to the natural frequency of major structural components of the chamber, are also excited. The high speed video shows that large scale cells (Fig. 5), resembling bubbles are formed. The development of the large cell structures as a result of coupling of the combustion processes with acoustics leads to the increase in filtered overpressure seen at t ≈ 1.3 s. After the large cells touch the chamber walls the overpressure in the chamber drops.
Flame Propagation and Pressure Build-up:
The experimental results are presented as pressure time-histories and plots of flame velocity as a function of distance in Figs. 6 - 9. The pressure-time history data given were taken from readings of transducer P1. No significant differences were found in the readings between transducers. An 80 Hz low pass filter was used on the pressure time-history data presented below. Flame velocities were calculated using flame time of arrival data from the line of thermocouples, with the positive direction toward the vent and negative direction toward the back-wall.
Figure 6 shows the pressure-time history and flame velocity for two near stoichiometric methane-air mixtures with the 5.4 m2 vent and central ignition in the 63.7 m3 chamber. The results of the two experiments show good agreement during initial flame propagation as shown in both the pressure and velocity plots. At t = 0.8 s however, the test with 10.3% methane produces the acoustically driven second large pressure peak 0.4 s earlier than the 9.0% methane case. It is also seen that after propagating 1 m inside the chamber the 10.3% case propagates slower within the chamber then achieves a higher velocity outside the chamber.
Figure 7 shows the pressure time-history and velocity for two near stoichiometric methane-air mixtures with the 5.4 m2 vent and back-wall ignition in the 63.7 m3 chamber. The results of the two tests are similar,
1049
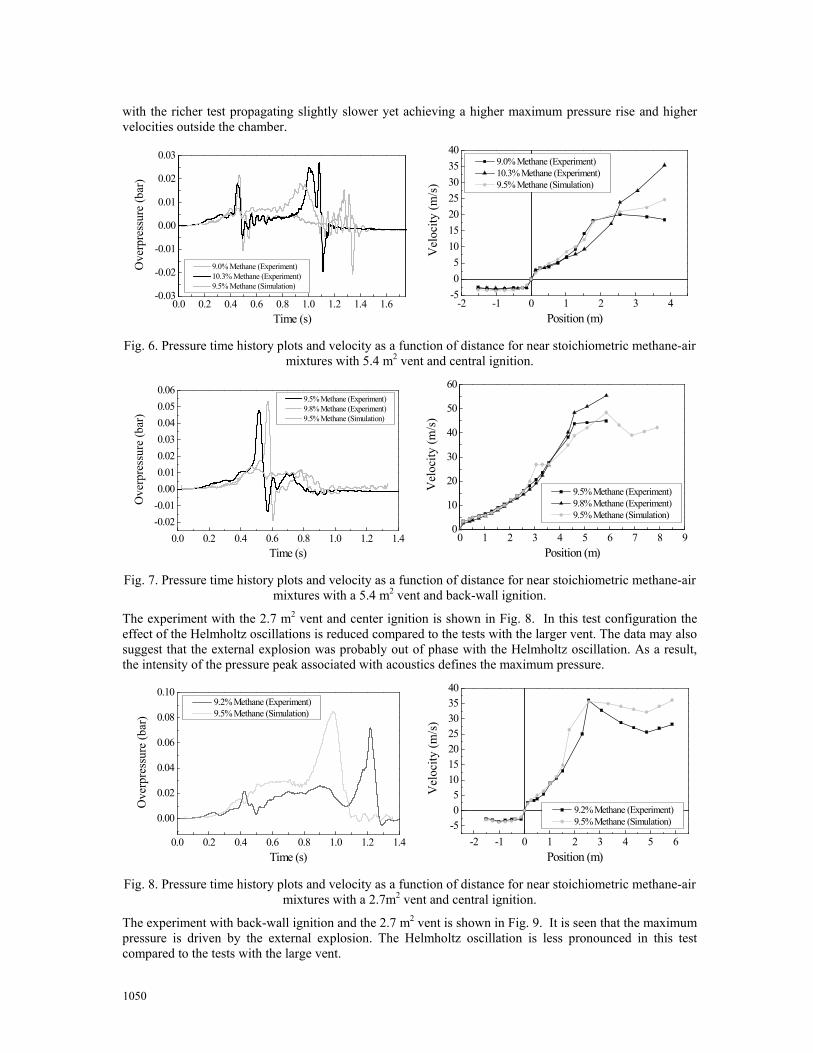
with the richer test propagating slightly slower yet achieving a higher maximum pressure rise and higher velocities outside the chamber.
0.0 0.2 0.4 0.6 0.8 1.0 1.2 1.4 1.6-0.03
-0.02
-0.01
0.00
0.01
0.02
0.03O
verp
ress
ure
(bar
)
Time (s)
9.0% Methane (Experiment) 10.3% Methane (Experiment) 9.5% Methane (Simulation)
-2 -1 0 1 2 3 4-505
10152025303540
Vel
ocity
(m/s
)
Position (m)
9.0% Methane (Experiment) 10.3% Methane (Experiment) 9.5% Methane (Simulation)
Fig. 6. Pressure time history plots and velocity as a function of distance for near stoichiometric methane-air
mixtures with 5.4 m2 vent and central ignition.
0.0 0.2 0.4 0.6 0.8 1.0 1.2 1.4-0.02-0.010.000.010.020.030.040.050.06
Ove
rpre
ssur
e (b
ar)
Time (s)
9.5% Methane (Experiment) 9.8% Methane (Experiment) 9.5% Methane (Simulation)
0 1 2 3 4 5 6 7 8 90
10
20
30
40
50
60
Vel
ocity
(m/s
)
Position (m)
9.5% Methane (Experiment) 9.8% Methane (Experiment) 9.5% Methane (Simulation)
Fig. 7. Pressure time history plots and velocity as a function of distance for near stoichiometric methane-air
mixtures with a 5.4 m2 vent and back-wall ignition.
The experiment with the 2.7 m2 vent and center ignition is shown in Fig. 8. In this test configuration the effect of the Helmholtz oscillations is reduced compared to the tests with the larger vent. The data may also suggest that the external explosion was probably out of phase with the Helmholtz oscillation. As a result, the intensity of the pressure peak associated with acoustics defines the maximum pressure.
0.0 0.2 0.4 0.6 0.8 1.0 1.2 1.4
0.00
0.02
0.04
0.06
0.08
0.10
Ove
rpre
ssur
e (b
ar)
Time (s)
9.2% Methane (Experiment) 9.5% Methane (Simulation)
-2 -1 0 1 2 3 4 5 6-505
10152025303540
Vel
ocity
(m/s
)
Position (m)
9.2% Methane (Experiment) 9.5% Methane (Simulation)
Fig. 8. Pressure time history plots and velocity as a function of distance for near stoichiometric methane-air
mixtures with a 2.7m2 vent and central ignition.
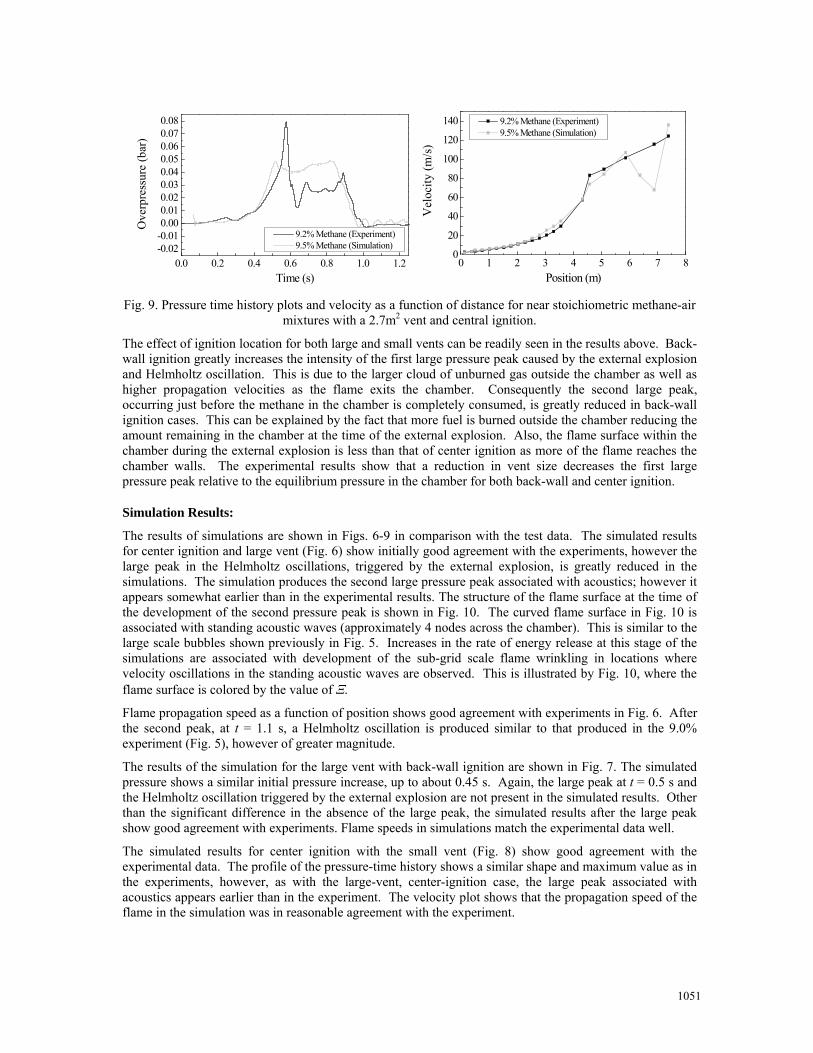
The experiment with back-wall ignition and the 2.7 m2 vent is shown in Fig. 9. It is seen that the maximum pressure is driven by the external explosion. The Helmholtz oscillation is less pronounced in this test compared to the tests with the large vent.
1050
0.0 0.2 0.4 0.6 0.8 1.0 1.2-0.02-0.010.000.010.020.030.040.050.060.070.08
Ove
rpre
ssur
e (b
ar)
Time (s)
9.2% Methane (Experiment) 9.5% Methane (Simulation)
0 1 2 3 4 5 6 7 80
20
40
60
80
100
120
140
Vel
ocity
(m/s
)
Position (m)
9.2% Methane (Experiment) 9.5% Methane (Simulation)
Fig. 9. Pressure time history plots and velocity as a function of distance for near stoichiometric methane-air
mixtures with a 2.7m2 vent and central ignition.
The effect of ignition location for both large and small vents can be readily seen in the results above. Back-wall ignition greatly increases the intensity of the first large pressure peak caused by the external explosion and Helmholtz oscillation. This is due to the larger cloud of unburned gas outside the chamber as well as higher propagation velocities as the flame exits the chamber. Consequently the second large peak, occurring just before the methane in the chamber is completely consumed, is greatly reduced in back-wall ignition cases. This can be explained by the fact that more fuel is burned outside the chamber reducing the amount remaining in the chamber at the time of the external explosion. Also, the flame surface within the chamber during the external explosion is less than that of center ignition as more of the flame reaches the chamber walls. The experimental results show that a reduction in vent size decreases the first large pressure peak relative to the equilibrium pressure in the chamber for both back-wall and center ignition.
Simulation Results:
The results of simulations are shown in Figs. 6-9 in comparison with the test data. The simulated results for center ignition and large vent (Fig. 6) show initially good agreement with the experiments, however the large peak in the Helmholtz oscillations, triggered by the external explosion, is greatly reduced in the simulations. The simulation produces the second large pressure peak associated with acoustics; however it appears somewhat earlier than in the experimental results. The structure of the flame surface at the time of the development of the second pressure peak is shown in Fig. 10. The curved flame surface in Fig. 10 is associated with standing acoustic waves (approximately 4 nodes across the chamber). This is similar to the large scale bubbles shown previously in Fig. 5. Increases in the rate of energy release at this stage of the simulations are associated with development of the sub-grid scale flame wrinkling in locations where velocity oscillations in the standing acoustic waves are observed. This is illustrated by Fig. 10, where the flame surface is colored by the value of Ξ.
Flame propagation speed as a function of position shows good agreement with experiments in Fig. 6. After the second peak, at t = 1.1 s, a Helmholtz oscillation is produced similar to that produced in the 9.0% experiment (Fig. 5), however of greater magnitude.
The results of the simulation for the large vent with back-wall ignition are shown in Fig. 7. The simulated pressure shows a similar initial pressure increase, up to about 0.45 s. Again, the large peak at t = 0.5 s and the Helmholtz oscillation triggered by the external explosion are not present in the simulated results. Other than the significant difference in the absence of the large peak, the simulated results after the large peak show good agreement with experiments. Flame speeds in simulations match the experimental data well.
The simulated results for center ignition with the small vent (Fig. 8) show good agreement with the experimental data. The profile of the pressure-time history shows a similar shape and maximum value as in the experiments, however, as with the large-vent, center-ignition case, the large peak associated with acoustics appears earlier than in the experiment. The velocity plot shows that the propagation speed of the flame in the simulation was in reasonable agreement with the experiment.
1051
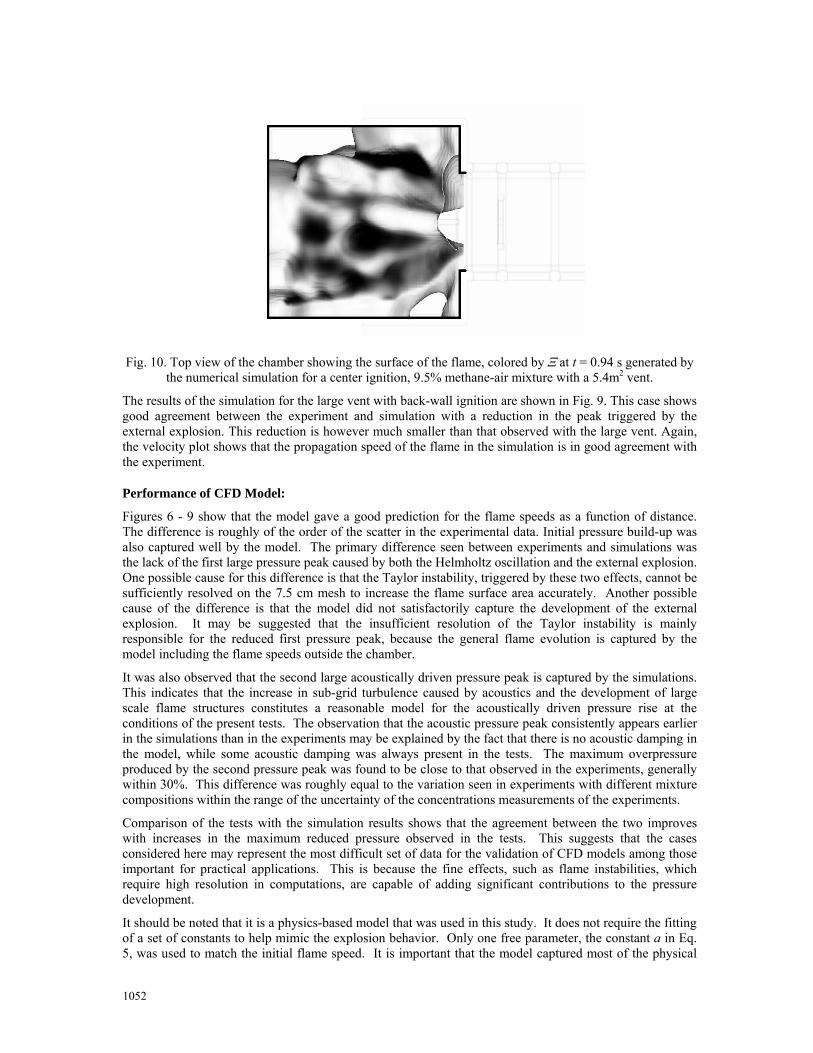
Fig. 10. Top view of the chamber showing the surface of the flame, colored by Ξ at t = 0.94 s generated by the numerical simulation for a center ignition, 9.5% methane-air mixture with a 5.4m2 vent.
The results of the simulation for the large vent with back-wall ignition are shown in Fig. 9. This case shows good agreement between the experiment and simulation with a reduction in the peak triggered by the external explosion. This reduction is however much smaller than that observed with the large vent. Again, the velocity plot shows that the propagation speed of the flame in the simulation is in good agreement with the experiment.
Performance of CFD Model:
Figures 6 - 9 show that the model gave a good prediction for the flame speeds as a function of distance. The difference is roughly of the order of the scatter in the experimental data. Initial pressure build-up was also captured well by the model. The primary difference seen between experiments and simulations was the lack of the first large pressure peak caused by both the Helmholtz oscillation and the external explosion. One possible cause for this difference is that the Taylor instability, triggered by these two effects, cannot be sufficiently resolved on the 7.5 cm mesh to increase the flame surface area accurately. Another possible cause of the difference is that the model did not satisfactorily capture the development of the external explosion. It may be suggested that the insufficient resolution of the Taylor instability is mainly responsible for the reduced first pressure peak, because the general flame evolution is captured by the model including the flame speeds outside the chamber.
It was also observed that the second large acoustically driven pressure peak is captured by the simulations. This indicates that the increase in sub-grid turbulence caused by acoustics and the development of large scale flame structures constitutes a reasonable model for the acoustically driven pressure rise at the conditions of the present tests. The observation that the acoustic pressure peak consistently appears earlier in the simulations than in the experiments may be explained by the fact that there is no acoustic damping in the model, while some acoustic damping was always present in the tests. The maximum overpressure produced by the second pressure peak was found to be close to that observed in the experiments, generally within 30%. This difference was roughly equal to the variation seen in experiments with different mixture compositions within the range of the uncertainty of the concentrations measurements of the experiments.
Comparison of the tests with the simulation results shows that the agreement between the two improves with increases in the maximum reduced pressure observed in the tests. This suggests that the cases considered here may represent the most difficult set of data for the validation of CFD models among those important for practical applications. This is because the fine effects, such as flame instabilities, which require high resolution in computations, are capable of adding significant contributions to the pressure development.
It should be noted that it is a physics-based model that was used in this study. It does not require the fitting of a set of constants to help mimic the explosion behavior. Only one free parameter, the constant a in Eq. 5, was used to match the initial flame speed. It is important that the model captured most of the physical
1052

phenomena involved except for one significant feature. This deficiency shows an area for further improvement of the model.
SUMMARY AND CONCLUSIONS
Results of tests on vented explosion obtained in a room-size enclosure without obstacles for low reactive methane-air mixtures and relatively low explosion pressures (below 0.1 of the ambient pressure) have been presented. The main physical phenomena responsible for pressure generation under this range of initial conditions were identified. Using the results of these experiments, a numerical CFD model was tested and its capabilities and deficiencies were identified.
It was shown that for the geometry and mixture properties present in this study, two physical phenomena are mainly responsible for the pressure rise in a vented enclosure. The first is a pressure transient that occurs due to a combination of Helmholtz oscillations, the external explosion, and the Taylor instability. These effects result in the first major pressure peak observed in the tests. The second major pressure peak is a pressure transient, driven by feedback between acoustics within the chamber and the combustion process. It was found that back-wall ignition increases the strength of the first peak, while reducing that of the second. It was also found that a smaller vent reduces the relative strength of the first pressure peak.
Results of the simulations show good agreement with the experimental results for flame velocities as a function of position and satisfactory agreement for pressure transients, except for the reduced first large pressure peak triggered by the external explosion and Helmholtz oscillations. It is believed that this difference was likely due to insufficient resolution of the Taylor instability triggered by these effects. It was also observed that the second large acoustically driven pressure peak is captured well by the simulations. The agreement between the tests and simulation was shown to improve with the level of maximum pressure generated in the enclosure, indicating that the present set of data with relatively low reactive mixture and large venting is in the most challenging range to model. Further studies are necessary to explore improvements of the model and to validate the model over a wide representative range of test conditions.
ACKNOWLEDGMENTS
The work presented in this paper was funded by FM Global and performed within the framework of the FM Global Strategic Research Program on Explosions and Material Reactivity. The authors are thankful to Franco Tamanini for many helpful discussions of the measurement techniques and test results. The technical assistance of Mike Gravel and Kevin Mullins in preparing and conducting the tests is greatly appreciated.
REFERENCES
[1] Cooper, M. G., Fairweather, M. and Tite, J. P., (1986) On the Mechanisms of Pressure Generation
in Vented Explosions, Combustion and Flame, 65: 1-14, doi:10.1016/0010-2180(86)90067-2
[2] Zalosh, R. G., “Gas Explosion Tests in Room-Size Vented Enclosures”, Proceedings of the 13th Loss Prevention Symposium, Houston, 1979, pp. 98-108
[3] van Wingerden, C. J. M., “On the venting of large-scale methane-air explosions”, 6th International Symposium of Loss Prevention and Safety Promotion in the Process Industries, Oslo, 19-22, June 1989
[4] Bimson, S. J., Bull, D. C., Cresswell, T. M., Marks, P. R., Masters, A. P., Prothero, A., Puttock, J. S., Rowson, J. J. and Samuels, B., “An Experimental Study of the Physics of Gaseous Deflagration in a Very Large Enclosure”, Fourteenth International Colloquium on the Dynamics of Exlposions and Reactive Systems, Coimbra, Portugal, August 1st – 6th, 1993
[5] Harrison, A. J. and Eyre, J. A., (1987) “External Explosions” as a Result of Explosion Venting, Combust. Sci. and Tech. 52: pp 91-106, doi:10.1080/00102208708952570
1053
[6] Solberg, D. M., Papas, J.A. and Skramstadt, E., “Observations of flame instabilities in large scale
vented gas explosions”, Proceedings of the Eighteenth Combustion Symposium, The Combustion Institute, 1980, pp. 1607-1614
[7] Tamanini, F. and Chaffee, J. L. “Combined turbulence and flame instability effects in vented explosions” Seventh International Symposium on Loss Prevention and Safety Promotion in the Process Industries, 1992, pp. 38-11/38-19, 1992
[8] Tamanini, F., “Characterization of Mixture Reactivity in Vented Explosions”, Fourteenth International Colloquium on the Dynamics of Exlposions and Reactive Systems, Coimbra, Portugal, August 1st – 6th, 1993
[9] Bradley, D. and Mitcheson, A., (1978) The Venting of Gaseous Explosions in Spherical Vessels, Combust. Flame 32: 221-255, doi:10.1016/0010-2180(78)90098-6
[10] Molkov, V. V., “Innovative Vent Sizing Technology for Gaseous Deflagrations”, Sixth International Symposium on Fire Safety Science, France, July, 1999
[11] Molkov, V. V., Dobashi, R., Suzuki, M. and Hirano, T., (1999) Modeling of vented hydrogen-air deflagrations and correlations for vent sizing, Journal of Loss Prevention in the Process Industries 12: 147-156, doi:10.1016/S0950-4230(98)00049-7
[12] VDI 3673. Pressure venting of dust explosions. Verein Deutcher Ingenieure, 1995
[13] NFPA 68, Standard on Explosion Protection by Deflagration Venting, 2007 Edition, National Fire Protection Association, Quincy, MA 02269, 2007
[14] Watterson, J.K., Connel, I.J., Savill, A.M. and Dawes, W.N., (1998) A solution adaptive mesh procedure for predicting confined explosions, International Journal for Numerical Methods in Fluids 26: 235–247, http://dx.doi.org/10.1002/(SICI)1097-0363(19980130)26:2<235::AID-FLD639>3.0.CO;2-E
[15] Molkov, V., Makarov, D. and Puttock, J., (2006) The nature and large eddy simulation of coherent deflagrations in a vented enclosure-atmosphere system, Journal of Loss Prevention in the Process Industries, 19: 121-129, doi:10.1016/j.jlp.2005.05.006
[16] Weller, H. G. and Tabor, G., (1998) A Tensorial Approach to Computational Continuum Mechanics Using Object-Oriented Techniques, Computers in Physics 12 (6): 620-631, http://dx.doi.org/10.1063/1.168744
[17] Issa, R. I., (1986) Solution of the Implicitly Discretised Fluid Flow Equations by Operator-Splitting, Journal of Computational Physics 62: 40-65, http://dx.doi.org/10.1016/0021-9991(86)90099-9
[18] Fureby, C., Tabor, G., Weller, H. G. and Gosman, A. D., (1997) A Comparative Study of Subgrid Scale Models in Homogeneous Isotropic Turbulence, Phys. Fluids 9 (5): 1416-1429, doi:10.1063/1.869254
[19] Weller, H. G., Tabor, G., Gosman, A.D. and Fureby, C., “Application of a Flame-Wrinkling LES Combustion Model to a Turbulent Mixing Layer”, Proceedings of the Twenty-Seventh Combustion Symposium, The Combustion Institute, 1998, pp. 899-907
[20] Gülder Ö, (1984) Correlations of laminar combustion data for alternative SI engine fuels, SAE Paper no. 841000, pp. 1–23.
[21] Bradley, D., Lau, A. K. C. and Lawes, M., (1992) Flame Stretch Rate as a Determinant of Turbulent Burning Velocity, Phyl. Trans. Proc. R. Soc. Lond. A 338: 359-387, doi:10.1098/rsta.1992.0012
1054