experimental and modelling approach of biogas production ... dumitrel 6 17.pdf · experimental and...
TRANSCRIPT

http://www.revistadechimie.ro REV.CHIM.(Bucharest)♦ 68♦ No.6♦ 2017
* email: [email protected]
Experimental and Modelling Approach of Biogas Productionby Anaerobic Digestion of Agricultural Resources
GABRIELA ALINA DUMITREL1, ADRIAN EUGEN CIOABLA2*, IOANA IONEL2, LUCIA ANA VARGA2
1Politehnica University of Timisoara, Faculty of Industrial Chemistry and Environmental Engineering, 6 Vasile Parvan Blvd.,300223, Timisoara, Romania,2 Politehnica University of Timisoara, Faculty for Mechnical Engineering,1 Mihai Viteazu Blvd., 300222, Timisoara, Romania
Anaerobic digestion processes of agricultural resources, as single substrates (wheat bran and barley) or ascombination of substrates (75 % corn & 25% corn cob – named MIX1 and 40 % corn & 40 % wheat & 20 %sunflower husks – named MIX2), were performed, at a mesophilic temperature in a batch reactor, at pilotscale. The results proved that the higher quantity of biogas yield was achieved for barley, followed by MIX1,and finally MIX2. The same order was obtained when the total methane production was evaluated. Theperformances of digesters were mathematically evaluated by using the modified Gompertz equation. Thekinetic parameters, such as the methane production potential (MP), the maximum methane production rate(Rm) and the extent of lag phase (λ) were calculated, for each experimental case. The values of theperformance indicators confirmed that all the models fitted well with the experimental data.
Keywords: agricultural resources, anaerobic digestion, biogas, modified Gompertz model
the treatment of agricultural wastes, food wastes, andwastewater sludge, due to its capability of reducingchemical oxygen demand (COD) and biological oxygendemand (BOD) from waste streams and producingrenewable energy [11,12].
In order to understand and control the complexbiochemical processes that take place during the anaerobicdigestion of various biomass types, different mathematicalmodels have been developed over the years. The pioneerswere Graef and Andrews [13-14] in the late 1960’s. Sincethen, kinetic models have been reported in the literaturefor the simulation of anaerobic biodegradation process. By2002, the International Water Association (IWA) groupdeveloped the Anaerobic Digestion Model No.1 (ADM1)[15]. The main advantage of ADM1 model is its capabilityof simulating the anaerobic digestion of differentbiomasses. The disadvantage is represented by thecomplexity of the model, that needs many inputparameters. This aspect is for sure time consuming andexpensive from experimental point of view. In order toeliminate such inconveniences, statistical linear and non-linear regression models (modified Gompertz model,Logistic function, Transference function – Reaction curvetype model, etc.) were developed to describe and predictthe anaerobe digestion performances [16-20].
The present study investigates the anaerobic digestionperformances (in terms of biogas and methane production)of different agricultural biomasses, used as single substrateor in combination. Also a simplified mathematical modelwas used to reach edifying simulations and predictions.
Experimental partSubstrates
Four different agricultural degraded biomasses: wheatbran (WB), barley (B), mix of 75 % corn and 25% corn cob(Mix1) and a cereal mix (40 % corn, 40 % wheat and 20 %sunflower husks) (Mix2) were used as substrates in ananaerobic digestion process. The substrates werepreviously stored at room temperature, until further use.All % compositions were expressed by volume.
Nowadays, one of the most important issues worldwiderepresents the usage of renewable sources of energy inorder to obtain clean fuels and secure the sustainabledevelopment. Biomass, for example, is widely available,under different forms, and its utilization for energyproduction has a great potential to reduce carbon dioxide(CO2) emissions and consequently to prevent globalwarming [1]. In 2014, the share of renewable energy infinal gross energy consumption in the EU was 16 %,representing 80 % of the 20 % target set in the EU for 2020.63.1 % of renewable energy produced in 2014 came frombiomass and wastes [2].
In this context, one of the feasible processes ofgenerating renewable energy (fuel), using biomass as abase substrate is the biogas production, by using anaerobicfermentation processes. Biogas technology offers a veryattractive route to use certain categories of biomass forsatisfying partial energy needs [3-5].
Biogas represents a versatile renewable energy source,entering the chain for the replacement of fossil fuels inpower and heat production; it can be used also as gaseousvehicle fuel [6]. The biogas production process is complexand sensitive, since several groups of microorganisms areinvolved. The important processes in anaerobic digestionare hydrolysis, fermentation, acetogenesis, andmethanogenesis, where hydrolysis is subject to thefermentation process, while acetogenesis andmethanogenesis are linked [7]. Biogas is a mixture ofcombustible gases produced during the digestion of organicmatter, composed mainly by 60–65 % by volume methane(CH4) and 35–40 % by volume carbon dioxide (CO2),hydrogen sulfide (H2S), nitrogen (N2), hydrogen (H2) andtraces of oxygen (O2), carbon monoxide (CO), ammonia(NH3), argon (Ar2) and other volatile organic compounds(VOC) or trace gases [8].
The composition of biogas depends on the type andconcentration of organic matter to be digested, on thephysicochemical conditions in the digester (pH, alkalinity,temperature) and on the presence of other anions such assulfates and nitrates [9-10].
This technology has been successfully implemented in
1294
REV.CHIM.(Bucharest)♦ 68♦ No.6♦ 2017 http://www.revistadechimie.ro 1295
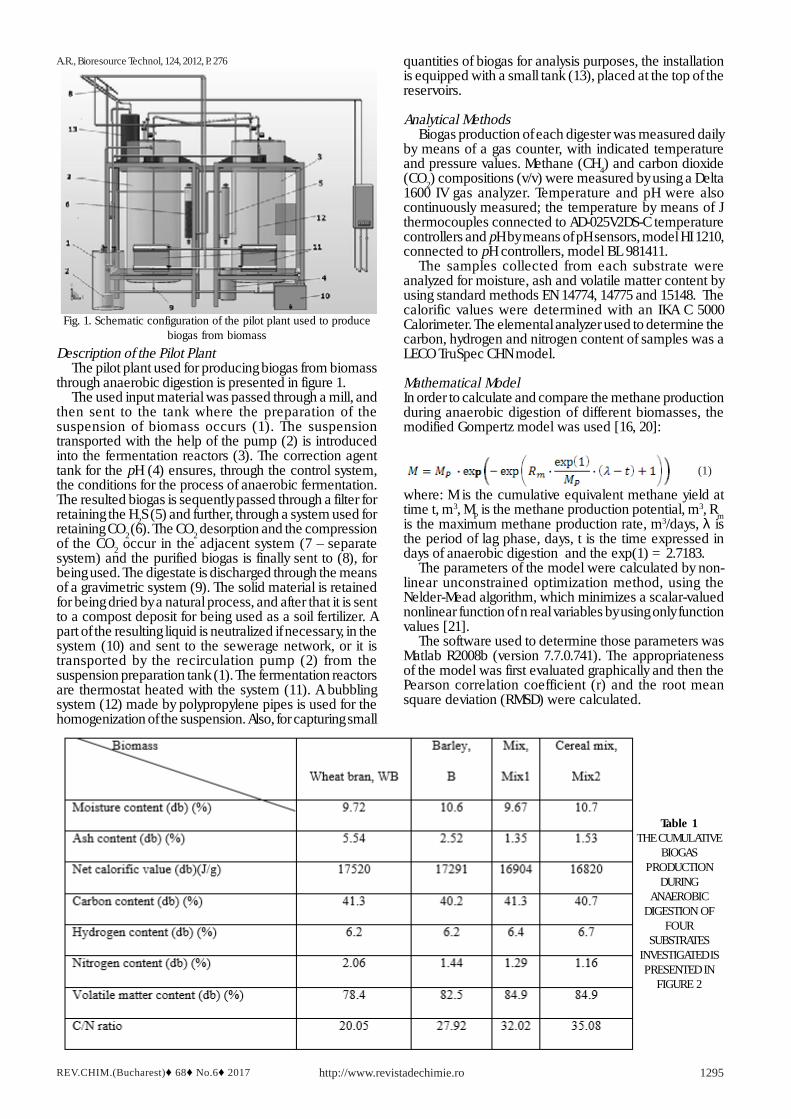
Description of the Pilot PlantThe pilot plant used for producing biogas from biomass
through anaerobic digestion is presented in figure 1.The used input material was passed through a mill, and
then sent to the tank where the preparation of thesuspension of biomass occurs (1). The suspensiontransported with the help of the pump (2) is introducedinto the fermentation reactors (3). The correction agenttank for the pH (4) ensures, through the control system,the conditions for the process of anaerobic fermentation.The resulted biogas is sequently passed through a filter forretaining the H2S (5) and further, through a system used forretaining CO2 (6). The CO2 desorption and the compressionof the CO2 occur in the adjacent system (7 – separatesystem) and the purified biogas is finally sent to (8), forbeing used. The digestate is discharged through the meansof a gravimetric system (9). The solid material is retainedfor being dried by a natural process, and after that it is sentto a compost deposit for being used as a soil fertilizer. Apart of the resulting liquid is neutralized if necessary, in thesystem (10) and sent to the sewerage network, or it istransported by the recirculation pump (2) from thesuspension preparation tank (1). The fermentation reactorsare thermostat heated with the system (11). A bubblingsystem (12) made by polypropylene pipes is used for thehomogenization of the suspension. Also, for capturing small
Table 1THE CUMULATIVE
BIOGASPRODUCTION
DURINGANAEROBIC
DIGESTION OFFOUR
SUBSTRATESINVESTIGATED ISPRESENTED IN
FIGURE 2
Fig. 1. Schematic configuration of the pilot plant used to producebiogas from biomass
A.R., Bioresource Technol, 124, 2012, P. 276 quantities of biogas for analysis purposes, the installationis equipped with a small tank (13), placed at the top of thereservoirs.
Analytical MethodsBiogas production of each digester was measured daily
by means of a gas counter, with indicated temperatureand pressure values. Methane (CH4) and carbon dioxide(CO2) compositions (v/v) were measured by using a Delta1600 IV gas analyzer. Temperature and pH were alsocontinuously measured; the temperature by means of Jthermocouples connected to AD-025V2DS-C temperaturecontrollers and pH by means of pH sensors, model HI 1210,connected to pH controllers, model BL 981411.
The samples collected from each substrate wereanalyzed for moisture, ash and volatile matter content byusing standard methods EN 14774, 14775 and 15148. Thecalorific values were determined with an IKA C 5000Calorimeter. The elemental analyzer used to determine thecarbon, hydrogen and nitrogen content of samples was aLECO TruSpec CHN model.
Mathematical ModelIn order to calculate and compare the methane productionduring anaerobic digestion of different biomasses, themodified Gompertz model was used [16, 20]:
where: M is the cumulative equivalent methane yield attime t, m3, MP is the methane production potential, m3, Rmis the maximum methane production rate, m3/days, λ isthe period of lag phase, days, t is the time expressed indays of anaerobic digestion and the exp(1) = 2.7183.
The parameters of the model were calculated by non-linear unconstrained optimization method, using theNelder-Mead algorithm, which minimizes a scalar-valuednonlinear function of n real variables by using only functionvalues [21].
The software used to determine those parameters wasMatlab R2008b (version 7.7.0.741). The appropriatenessof the model was first evaluated graphically and then thePearson correlation coefficient (r) and the root meansquare deviation (RMSD) were calculated.
(1)

http://www.revistadechimie.ro REV.CHIM.(Bucharest)♦ 68♦ No.6♦ 20171296
from Mix2 digester increases slowly and reaches 11.9 m3
of biogas on day 80. Even if barley and wheat bran behavedsimilarly at the beginning of the experiment, after 17 daysof digestion they showed different biogas productionpattern. The increase of cumulative biogas production wassignificantly higher in the barley digester. At the end ofdigestion period, the amount of biogas generated byanaerobic digestion was 21.2 m3 for wheat bran and 32.6m3 for barley. As concerns the Mix1 digester, the cumulativegas production at the end of anaerobic digestion was 27m3. The order of investigated substrates, in terms of totalamount of biogas generated during anaerobic digestionprocess was: B > Mix1 > WB > Mix2.
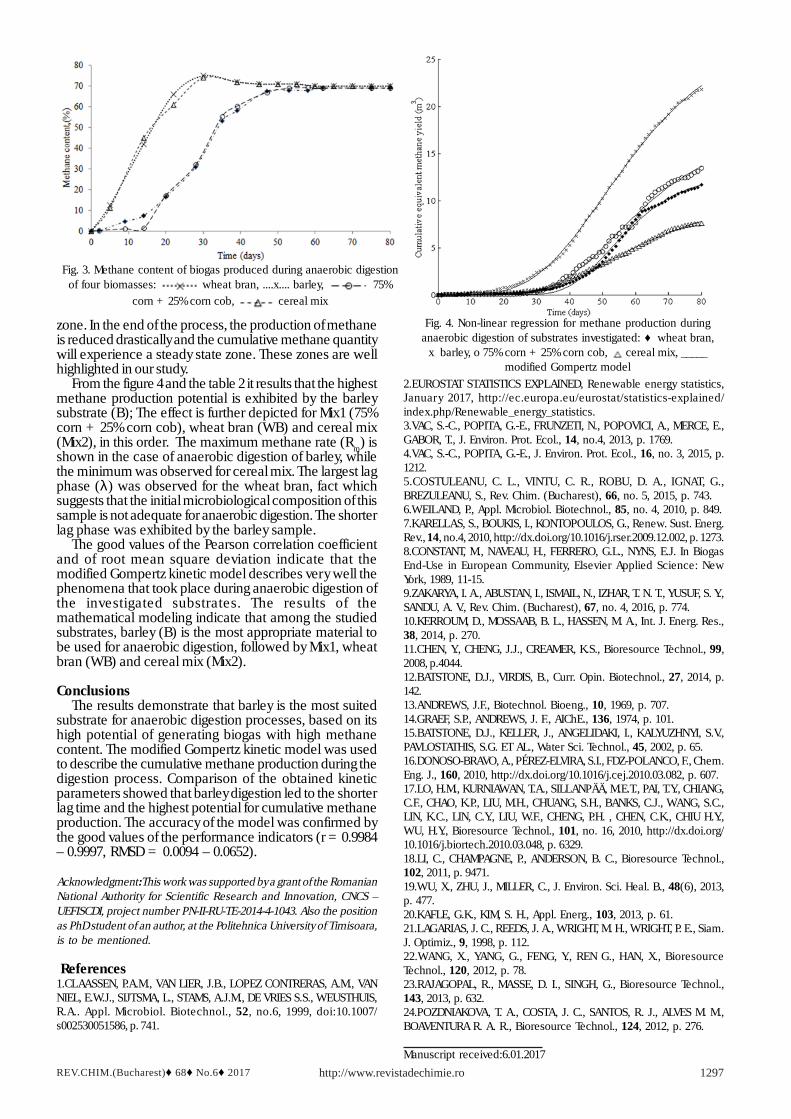
The methane content of biogas produced duringanaerobic digestion of investigated substrates is presentedin figure 3. The methane content of biogas formed duringanaerobic digestion process proved the same evolutionfor barley and cereal mix substrates. The values of methaneconcentration in biogas increased rapidly until day 30,reaching a value of 75% by volume and then decreaseslowly till a constant value of 70 %.
As concern the other two substrates, the methanecontent in the biogas had a different behavior. The biogasfrom Mix1 started to present a methane content only after22 days of digestion. Then the methane concentration inbiogas increased continuously till 69% in day 60 andremained constant for the rest of digestion process. Themethane content in the biogas generated by wheat bran(WB) digester showed the same progress. The differencewas at the beginning of the process, the biogas from wheatbran having 0.15 % methane after 5 days.
The experimental data about the biogas yield and itsmethane content were used to calculate the cumulativeequivalent methane for each of the four substratessubjected to anaerobic digestion.
The modified Gompertz equation is the basic for themathematical model used to estimate the performanceof the digestion process. Figure 4 illustrates theexperimental data (markers) and the results of themathematical model (solid lines).
The values of mathematical model parameters arepresented in the table 2.
Previous studies reported the existence of threecharacteristic zones during cumulative methaneproduction process as a result of different biomassesanaerobic digestion [24]. A lag zone corresponding to theperiod before gas generation started can be noticed at thebeginning of the digestion process. This zone is followedby a rapid methane production phase, named exponential
Fig. 2. Cumulative biogas production during anaerobic digestion offour biomasses: wheat bran, ....x.... barley, -o- 75% corn +
25% corn cob, cereal mix
Table 2PARAMETERS OF THE CONSIDERED
MATHEMATICAL MODEL
Results and discussionsThe general characteristics of substrates used in the
anaerobic digestion process are given in the table 1. Amongthe substrates used, the Mix1 had the lowest content ofash, while the ash content of WB was four times higher.The ash content is important to be determined, in order todetermine the potential possibilities of using the residualsludge in co-firing processes. Of course, high ash contentsare not generally suitable for this type of applications.
The carbon to nitrogen ratio (C/N) for WB and B werewithin the optimal range (20 – 30) for anaerobic digestion.The Mix1 and Mix2 had higher C/N ratio. A higher valueindicates a rapid consumption of nitrogen by methanogensand results in lower gas production. A lower C/N ratiogenerates accumulation of ammonia in the digester, whichmay lead to the inhibition of methanogenic bacteria [22-23].
The cumulative biogas production during anaerobicdigestion of four substrates investigated is presented infigure 2.
In the case of barley (B) and cereal mix (Mix2), thebiogas production started after 5 days of digestion, while,for wheat bran (WB) and 75% corn + 25% corn cob (Mix1)the gas production began in the second day of the digesteroperation.
The cereal mix (Mix2) digester process had a very lowbiogas production, until day 32 when it reaches acumulative biogas production of 2 m3. This amount ofbiogas was generated after 17 days of digestion for wheatbran and barley substrates and after 6 days based on theMix1 digester process. After day 32, the biogas production
REV.CHIM.(Bucharest)♦ 68♦ No.6♦ 2017 http://www.revistadechimie.ro 1297
Fig. 3. Methane content of biogas produced during anaerobic digestionof four biomasses: wheat bran, ....x.... barley, 75%
corn + 25% corn cob, cereal mix
Fig. 4. Non-linear regression for methane production duringanaerobic digestion of substrates investigated: ♦ wheat bran,
x barley, o 75% corn + 25% corn cob, cereal mix, _____modified Gompertz model
zone. In the end of the process, the production of methaneis reduced drastically and the cumulative methane quantitywill experience a steady state zone. These zones are wellhighlighted in our study.
From the figure 4 and the table 2 it results that the highestmethane production potential is exhibited by the barleysubstrate (B); The effect is further depicted for Mix1 (75%corn + 25% corn cob), wheat bran (WB) and cereal mix(Mix2), in this order. The maximum methane rate (Rm) isshown in the case of anaerobic digestion of barley, whilethe minimum was observed for cereal mix. The largest lagphase (λ) was observed for the wheat bran, fact whichsuggests that the initial microbiological composition of thissample is not adequate for anaerobic digestion. The shorterlag phase was exhibited by the barley sample.
The good values of the Pearson correlation coefficientand of root mean square deviation indicate that themodified Gompertz kinetic model describes very well thephenomena that took place during anaerobic digestion ofthe investigated substrates. The results of themathematical modeling indicate that among the studiedsubstrates, barley (B) is the most appropriate material tobe used for anaerobic digestion, followed by Mix1, wheatbran (WB) and cereal mix (Mix2).
ConclusionsThe results demonstrate that barley is the most suited
substrate for anaerobic digestion processes, based on itshigh potential of generating biogas with high methanecontent. The modified Gompertz kinetic model was usedto describe the cumulative methane production during thedigestion process. Comparison of the obtained kineticparameters showed that barley digestion led to the shorterlag time and the highest potential for cumulative methaneproduction. The accuracy of the model was confirmed bythe good values of the performance indicators (r = 0.9984– 0.9997, RMSD = 0.0094 – 0.0652).
Acknowledgment:This work was supported by a grant of the RomanianNational Authority for Scientific Research and Innovation, CNCS –UEFISCDI, project number PN-II-RU-TE-2014-4-1043. Also the positionas PhD student of an author, at the Politehnica University of Timisoara,is to be mentioned.
References1.CLAASSEN, P.A.M., VAN LIER, J.B., LOPEZ CONTRERAS, A.M., VANNIEL, E.W.J., SIJTSMA, L., STAMS, A.J.M., DE VRIES S.S., WEUSTHUIS,R.A.. Appl. Microbiol. Biotechnol., 52, no.6, 1999, doi:10.1007/s002530051586, p. 741.
2.EUROSTAT STATISTICS EXPLAINED, Renewable energy statistics,January 2017, http://ec.europa.eu/eurostat/statistics-explained/index.php/Renewable_energy_statistics.3.VAC, S.-C., POPITA, G.-E., FRUNZETI, N., POPOVICI, A., MERCE, E.,GABOR, T., J. Environ. Prot. Ecol., 14, no.4, 2013, p. 1769.4.VAC, S.-C., POPITA, G.-E., J. Environ. Prot. Ecol., 16, no. 3, 2015, p.1212.5.COSTULEANU, C. L., VINTU, C. R., ROBU, D. A., IGNAT, G.,BREZULEANU, S., Rev. Chim. (Bucharest), 66, no. 5, 2015, p. 743.6.WEILAND, P., Appl. Microbiol. Biotechnol., 85, no. 4, 2010, p. 849.7.KARELLAS, S., BOUKIS, I., KONTOPOULOS, G., Renew. Sust. Energ.Rev., 14, no.4, 2010, http://dx.doi.org/10.1016/j.rser.2009.12.002, p. 1273.8.CONSTANT, M., NAVEAU, H., FERRERO, G.L., NYNS, E.J. In BiogasEnd-Use in European Community, Elsevier Applied Science: NewYork, 1989, 11-15.9.ZAKARYA, I. A., ABUSTAN, I., ISMAIL, N., IZHAR, T. N. T., YUSUF, S. Y.,SANDU, A. V., Rev. Chim. (Bucharest), 67, no. 4, 2016, p. 774.10.KERROUM, D., MOSSAAB, B. L., HASSEN, M. A., Int. J. Energ. Res.,38, 2014, p. 270.11.CHEN, Y., CHENG, J.J., CREAMER, K.S., Bioresource Technol., 99,2008, p.4044.12.BATSTONE, D.J., VIRDIS, B., Curr. Opin. Biotechnol., 27, 2014, p.142.13.ANDREWS, J.F., Biotechnol. Bioeng., 10, 1969, p. 707.14.GRAEF, S.P., ANDREWS, J. F., AIChE., 136, 1974, p. 101.15.BATSTONE, D.J., KELLER, J., ANGELIDAKI, I., KALYUZHNYI, S.V.,PAVLOSTATHIS, S.G. ET AL., Water Sci. Technol., 45, 2002, p. 65.16.DONOSO-BRAVO, A., PÉREZ-ELVIRA, S.I., FDZ-POLANCO, F., Chem.Eng. J., 160, 2010, http://dx.doi.org/10.1016/j.cej.2010.03.082, p. 607.17.LO, H.M., KURNIAWAN, T.A., SILLANPÄÄ, M.E.T., PAI, T.Y., CHIANG,C.F., CHAO, K.P., LIU, M.H., CHUANG, S.H., BANKS, C.J., WANG, S.C.,LIN, K.C., LIN, C.Y., LIU, W.F., CHENG, P.H. , CHEN, C.K., CHIU H.Y.,WU, H.Y., Bioresource Technol., 101, no. 16, 2010, http://dx.doi.org/10.1016/j.biortech.2010.03.048, p. 6329.18.LI, C., CHAMPAGNE, P., ANDERSON, B. C., Bioresource Technol.,102, 2011, p. 9471.19.WU, X., ZHU, J., MILLER, C., J. Environ. Sci. Heal. B., 48(6), 2013,p. 477.20.KAFLE, G.K., KIM, S. H., Appl. Energ., 103, 2013, p. 61.21.LAGARIAS, J. C., REEDS, J. A., WRIGHT, M. H., WRIGHT, P. E., Siam.J. Optimiz., 9, 1998, p. 112.22.WANG, X., YANG, G., FENG, Y., REN G., HAN, X., BioresourceTechnol., 120, 2012, p. 78.23.RAJAGOPAL, R., MASSE, D. I., SINGH, G., Bioresource Technol.,143, 2013, p. 632.24.POZDNIAKOVA, T. A., COSTA, J. C., SANTOS, R. J., ALVES M. M.,BOAVENTURA R. A. R., Bioresource Technol., 124, 2012, p. 276.
Manuscript received:6.01.2017