experiment to study flow through a venturimeter
DESCRIPTION
ExperimentTRANSCRIPT

EXPERIMENT TO STUDY FLOW THROUGH A VENTURI METER
FLUIDS MECHANICS1 1
HYDRAULICS PRACTICALS
FLUIDS MECHANICS LABORATORY
MODULE: FLUIDS MECHANICS1
REPORT OF EXPERIMENT:
EXPERIMENT TO STUDY FLOW THROUGH A VENTURI METER

EXPERIMENT TO STUDY FLOW THROUGH A VENTURI METER
FLUIDS MECHANICS1 2
Table of Content
Introduction
Objectives
Apparatus
Description of apparatus & Experimental Procedures
Tabulation of results
v Calculation of area of the different cross sections of the Venturimeter Result and Analysis
v Calculating the ideal pressure at each section of the Venturimeter
v A graph of ‘Ideal Pressure,’ against ‘Section of Venturimeter, an’
v Calculating the actual pressure at each section of the Venturimeter
v A graph of ‘Actual pressure’ against ‘Sections of Venturimeter’ for Flow rate No 1.
v A graph of ‘Actual pressure’ against ‘Sections of Venturimeter’ for Flow rate No 4.
v Calculation of the coefficient of discharge, Cd, of the Venturimeter, for each flow rate.
v A graph of √h1-h2 against Q.
v Calculation of the value of coefficient of discharge, Cd for each value of volumetric flow rate, Q.
v A graph of Cd against Q
Conclusions
References

EXPERIMENT TO STUDY FLOW THROUGH A VENTURI METER
FLUIDS MECHANICS1 3
Introduction In this experiment, we will investigate how the pressure varies at different positions along a tube
of varying cross-sectional area (the convergent-divergent Venturimeter), for different volumetric
flow rates.
A Venturimeter (fig 1.1) consists of a short converging conical tube leading to a cylindrical
portion, called the throat, of smaller diameter of that of the pipeline, which is followed by a
diverging section in which the diameter increases again to that of the main pipeline.
Convergent-Divergent Venturi meter
Piezometers
Fig 1.1 Venturi Meter Diagram

EXPERIMENT TO STUDY FLOW THROUGH A VENTURI METER
FLUIDS MECHANICS1 4
The Venturimeter is used to measure the flow rate of compressible and incompressible fluid,
through a pipeline. The change in pressure in the fluid as it passes through the meter can be used
to determine the flow rate. The meter, in its simplest form, consists of a short length of pipe,
tapering to a narrow throat in the middle. At a number of points along the length of the
convergent-divergent passage of the Venturi, piezometer tubes are drilled into the wall and
connections are made from each of these to vertical manometer tubes, which are mounted in front
of a scale marked in millimeters. The manometer tubes are connected at their top ends to a
common manifold in which the amount of air may be controlled by a small air valve at one end.
The procedure, of theoretically quantifying the discharge for a Venturimeter, lies basically in the
combined aid of the Bernoulli and Continuity equations, assessing both the coefficient of
discharge, (Cd) and the flow coefficients. The coefficient of discharge is the ratio of the actual
flow rate to the theoretical flow rate. It is the fraction of the theoretical flow rate which gives the
actual flow rate.
The discharge, Q is given by
Q = Cd a2 √[2g (h1 - h2)]
√1 – (a2/a1)2

EXPERIMENT TO STUDY FLOW THROUGH A VENTURI METER
FLUIDS MECHANICS1 5
Where Cd is the coefficient of discharge of the meter and that
The ideal pressure is equal to
hn – h1 = (a2)2 - (a2)2
u2 2/2g (a1)2 (an)2
Where,
hn: the actual piezometer reading at a particular position
h1: the actual piezometer reading at position A
u2: the velocity of flow in Venturimeter at piezometer position D
g: the acceleration due to gravity = 9.810 ms-2
an: the cross sectional area of the particular piezometer
a1: the cross sectional area of Venturimeter at piezometer position A = 0.053093 m2
a2: the cross sectional area of Venturimeter at piezometer position D = 0.020106 m2
an: the cross sectional area of the Venturimeter at piezometer position where ideal pressure is to be
determined
Where, hn: the actual piezometer reading at a particular position
h1: the actual piezometer reading at position A
u2: the velocity of flow in Venturimeter at piezometer position D
g: the acceleration due to gravity = 9.810 ms-2
u22/2g : head loss at piezometer position D
Actual pressure = hn - h1
u22/2g

EXPERIMENT TO STUDY FLOW THROUGH A VENTURI METER
FLUIDS MECHANICS1 6
Bernoulli’s equation relates the pressure, velocity, and elevation between any two points in the
flow field of a flow that is steady, not rotational, non-viscous, and incompressible. This implies
that, the equation links pressure energy, kinetic energy and potential energy per unit weight from
point to point in the fluid. It also states that they obey the law of conservation of energy.
In this experiment, the axis of the Venturimeter is kept horizontal, with the help of the adjusting
screws, to avoid any change in elevation of the fluid flow. Thus, there is no change in the potential
energy per unit weight, as the fluid does not lose elevation during flow. The horizontal plane is
taken as the datum which reduces the potential energy variable in the equation to zero. Thus the
equation alters as follows:
Pressure energy + Kinetic energy = Total energy = A constant
per unit weight per unit weight per unit weight
Continuity equation involves flow streams having a uniform velocity across the flow section of
a steady, incompressible, and one-dimensional flow.
Where,
P/ρg: Pressure Energy
V2/2g: Kinetic Energy
A*V = flow rate of a fluid passing through a passage of cross sectional area A with velocity V (Q)
A1: Cross Sectional Area of Venturimeter at point 1
A2: Cross Sectional Area of Venturimeter at point 2
V1: Velocity of fluid at point 1
V2: Velocity of fluid at point 2
Pressure energy per unit weight
Potential energy per unit weight
Total energy per unit weight
a constant Kinetic energy per unit weight
+ + = =
Bernoulli’s equation: P1/ρg + V12/2g = P2/ρg + V2
2/2g
Continuity Equation: A1V1 =
A2V2

EXPERIMENT TO STUDY FLOW THROUGH A VENTURI METER
FLUIDS MECHANICS1 7
Objectives
The aims of this experiment:
1. To determine the coefficient of discharge of meter and its variation with discharge.
2. To determine the variation of energy loss through the meter as a function of discharge and main pipe velocity.
Apparatus Apparatus needed: Venturi meter apparatus (Fig 1.2), stop watch, mass (2.5 Kg)
Piezometer position
Diameter (mm)
A 26.00 B 23.20 C 18.40 D 16.00 E 16.80 F 18.47 G 20.16 H 21.84 J 23.53 K 25.24 L 26.00
Mass hanger
piezometers
A B C D E F G H J K L
26.00 mm 16.00 mm
Table I: Diameter of cross-section of venture metre at
different piezometer stations
Fig 1.2
Convergent-Divergent Venturi meter

EXPERIMENT TO STUDY FLOW THROUGH A VENTURI METER
FLUIDS MECHANICS1 8
Description of apparatus & Experimental Procedures
The apparatus consist of a flow bench that allows water to flow to the Venturimeter. Inside the
flow bench there is a weighing tank connected to one end of a lever arm. The end of the lever arm
protrudes from the side of the flow bench so that the amount of weight on this end of the lever
arm may be adjusted (as shown in the photo below).
The purpose of the lever arm is to measure the actual mass flow rate of water flowing through the
measuring devices. When using the hydraulic bench, placing weight on the lever arm closes the
trip valve of the inner tank. When water entering the tank is sufficiently heavy enough to
counterbalance the weight on the arm, the arm will rise and the trip valve will open. Dividing, the
mass of water contained in the tank, by the amount of time it takes for the internal tank to fill, will
yield the actual mass flow rate.
Since the adjustable weight end of the lever arm has a three-to-one advantage over the water tank
end, the mass of the water in the tank will equal three times the mass added to the lever arm. The
weight of the hanger is accounted for in the design of the equipment; therefore, do not add the
weight of the hanger to weights placed on the hanger.
The manometer scale is levelled by first opening both the control valve downstream of the meter
and bench supply valve so as to flow for a few seconds to clean air pockets from the supply
system. The control valve is adjusted to obtain a proper value on the lowest piezometer reading.
The control valve is kept in positions so that the flow is constant and therefore the readings on the
piezometer are noted.
Having levelled the scales, measurements of a series of values of (h1-h2) and Q may be made, where (h1-h2) is the difference in the levels in manometer limbs A and D, and Q is the flow rate.
The first reading may be taken at the maximum available value of (h2-h1), i.e. with h1 close to the
top of the scale and h2 close to bottom, where h2 is noted as the lowest value and the other
piezometer readings as h1.
To measure the flow rate, water is collected in the weighing tank; the ratio of the weight of water
in the tank to the load placed on the other edge of the pivoted beam is 3:1. The beam initially
points downwards but when it becomes in equilibrium state (horizontal), the time (measured using
a stop watch) is started and a 2.5 Kg load is placed on the hanger found on the edge of the beam.

EXPERIMENT TO STUDY FLOW THROUGH A VENTURI METER
FLUIDS MECHANICS1 9
The time, t, for which the beam becomes back again to equilibrium is recorded. For the 2.5 Kg
load, 7.5 Kg of water collected on the other side of the beam in a laps of time, t seconds.
The control valve is adjusted to obtain different flows and piezometer readings. The ideal pressure
and the actual pressure at each piezometer position, for two values of Q, are calculated.
Tables are tabulated as follows:
1. Table 1: The values of diameter and area of cross sections of venturimeter
2. Table 2: Flow rate in each manometer in millimeters(convert in meters)
3. Table 3: The values of an and ideal pressure for each section of the Venturimeter
4. Table 4: The values of Time, Volume Flow rate and u22/2g
5. Table 5: For Flow rate No 1, the values of hn, h1 and hn - h1 , for each section of the
Venturimeter.
6. Table 6: For Flow rate No 4, the values of hn, h1 and hn - h1 , for each section of the
Venturimeter.
7. Table 6: The values of h1, h2, √h1-h2 and Q.
8. Table 8: The values of Volumetric Flow rate, Q, h1, h2, and Coefficient of
discharge, Cd.
Plot graph of y-axis against x-axis and draw the line/curve of best fit:
1. A graph of ‘Ideal Pressure’ is plotted against ‘Sections of Venturimeter’
2. A graph of ‘Actual pressure’ is plotted against ‘Sections of Venturimeter’ for Flow rate No 1.
3. A graph of ‘Actual pressure’ is plotted against ‘Sections of Venturimeter’ for Flow rate No 4.
4. A graph of √h1-h2 is plotted against Q.
5. A graph of Cd is plotted against Q.
hn - h1
u22/2g
hn - h1
u22/2g

EXPERIMENT TO STUDY FLOW THROUGH A VENTURI METER
FLUIDS MECHANICS1 10
Tabulation of results
v Calculation of area of the different cross sections of the Venturimeter Area = ╥ x (diameter of the cross section of the venturimeter/2)2
Where ╥ = 22/7
The values of diameter and area of cross sections of venturimeter are tabulated below. Table 1 v Theory of Venturimeter
The discharge Q is given by
Q = Cd a2 √ [2g (h1 - h2)] √1 – (a2/a1)2 Where Cd is the coefficient of discharge of the meter and that The ideal pressure is equal to hn – h1 = (a2)2 - (a2)2
u2 2/2g (a1)2 (an)2
Piezometer position Diameter (m) Area (m2)x 10-4
A 0.02600 5.3093 B 0.02320 4.2273 C 0.01840 2.6590 D 0.01600 2.0106 E 0.01680 2.2167 F 0.01847 2.6793 G 0.02016 3.1921 H 0.02184 3.7462 J 0.02353 4.3484 K 0.02524 5.0034 L 0.02600 5.3093

EXPERIMENT TO STUDY FLOW THROUGH A VENTURI METER
FLUIDS MECHANICS1 11
Result and Analysis Table 2: Flow rate in each manometer in millimetres (convert in meters)
v Calculating the ideal pressure at each section of the Venturimeter
Using the equation,
Manometer scale readings in millimetres Flow rate
No 1
2
3
4
5
6
7
8
9
10 Piezometer
Position A(h1) 219 224 225 230 235 237 241 243 246 249
B 218 220 220 225 226 228 232 234 237 238 C 210 205 200 195 188 185 180 176 173 169
D(h2) 192 180 168 148 132 120 105 94 81 67 E 196 195 174 154 172 134 121 112 103 93 F 198 204 189 179 188 168 159 154 150 142 G 208 204 199 193 188 187 184 179 176 173 H 205 205 202 200 199 196 196 195 194 192 J 210 204 207 201 205 205 206 204 205 204 K 214 212 211 202 210 214 203 213 213 214 L 212 219 203 214 204 216 217 218 218 219
EXPERIMENT TO STUDY FLOW THROUGH A VENTURI METER
FLUIDS MECHANICS1 12
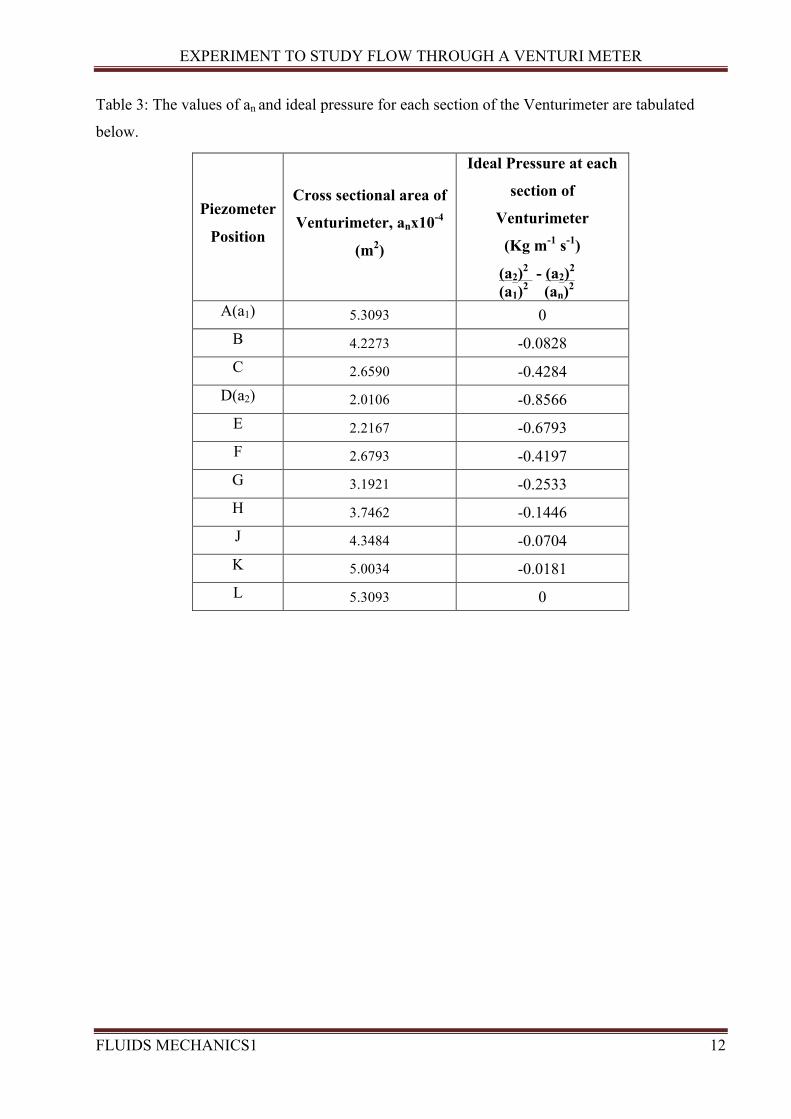
Table 3: The values of an and ideal pressure for each section of the Venturimeter are tabulated
below.
Piezometer
Position
Cross sectional area of
Venturimeter, anx10-4
(m2)
Ideal Pressure at each
section of
Venturimeter
(Kg m-1 s-1)
(a2)2 - (a2)2 (a1)2 (an)2
A(a1) 5.3093 0 B 4.2273 -0.0828 C 2.6590 -0.4284
D(a2) 2.0106 -0.8566 E 2.2167 -0.6793 F 2.6793 -0.4197 G 3.1921 -0.2533 H 3.7462 -0.1446 J 4.3484 -0.0704 K 5.0034 -0.0181 L 5.3093 0

EXPERIMENT TO STUDY FLOW THROUGH A VENTURI METER
FLUIDS MECHANICS1 13
A graph of ‘Ideal Pressure,’ is plotted against ‘Section of Venturimeter, an’

EXPERIMENT TO STUDY FLOW THROUGH A VENTURI METER
FLUIDS MECHANICS1 14
v Calculating the actual pressure at each section of the Venturimeter
For the sake of accuracy near the maximum flow, we will be using the set of values for flow rate
No 1 and flow rate No 4, to calculate the actual pressure at each section of the Venturimeter.
Using the equation,
Calculation of u2
2/2g:
U2 = Volume Flow rate /Area of cross sections of the Venturimeter at piezometer position D
Volume Flow rate = Volume of water collected/Time taken to collect that volume
Note: The volume of water collected is equal for all flow rate and is equal to
7.5 kg/1000 kgm-3 = 0.0075 m3
Volume Flow rate = 0.0075 /Time taken to collect 0.0075m3 of water
Therefore,
u2 = (0.0075/Time taken to collect 0.0075m3 of water) / 2.0106 x 10⁻⁴
Thus,
u22/2g = [ (0.0075/Time taken to collect 0.0075m3 of water) / 2.0106 x 10⁻⁴]2 ÷ (2 x 9.810)
Unit: m
Actual pressure = hn - h1
u22/2g
Density of water = 1000kg/m3
Q=AV

EXPERIMENT TO STUDY FLOW THROUGH A VENTURI METER
FLUIDS MECHANICS1 15
Table 4: The values of Time, Volume Flowrate and u22/2g are tabulated below.
Flow rate No Time, t(s) Volume Flow rate,
Q*10-4 (m3/s) (u22/2g) m
1 47.13 1.5913431 0.031928
2 37.41 2.0048115 0.050675
3 33.25 2.2556391 0.064149
4 27.38 2.7392257 0.094603
5 26.17 2.8658769 0.103553
6 23.70 3.1645569 0.126263
7 21.79 3.4419458 0.149368
8 20.66 3.6302033 0.166154
9 19.35 3.8759689 0.189413
10 19.55 3.8363171 0.185558
Table 5: For Flow rate No 1, the values of hn, h1 and hn - h1 , for each section of the Venturimeter
Note: For flow rate No 1, the value of u22/2g = 0.031928 m
Piezometer
Position h1 (m) hn (m)
Actual Pressure
hn – h1
U22/2g
A 0.219 0.219 0
B 0.219 0.218 -0.0313
C 0.219 0.210 -0.2819
D 0.219 0.192 -0.8457
E 0.219 0.196 -0.7204
F 0.219 0.198 -0.6577
G 0.219 0.208 -0.3445
H 0.219 0.205 -0.4385
J 0.219 0.210 -0.2819
K 0.219 0.214 -0.1566
L 0.219 0.212 -0.2192
Table 5
hn - h1
u22/2g

EXPERIMENT TO STUDY FLOW THROUGH A VENTURI METER
FLUIDS MECHANICS1 16
A graph of ‘Actual pressure’ is plotted against ‘Sections of Venturimeter’ for Flow rate No 1.

EXPERIMENT TO STUDY FLOW THROUGH A VENTURI METER
FLUIDS MECHANICS1 17
Table 6: For Flow rate No 4, the values of hn, h1 and hn - h1 , for each section of the Venturimeter.
Note: For flow rate No 4, the value of u22/2g = 0.094603 m
Piezometer
Position h1 (m) hn (m)
Actual Pressure
hn – h1
U22/2g
A 0.230 0.230 0
B 0.230 0.225 -0.0529
C 0.230 0.195 -0.3700
D 0.230 0.148 -0.8668
E 0.230 0.154 -0.8034
F 0.230 0.179 -0.5391
G 0.230 0.193 -0.3911
H 0.230 0.200 -0.3171
J 0.230 0.201 -0.3065
K 0.230 0.202 -0.2960
L 0.230 0.214 -0.1691
hn - h1
u22/2g

EXPERIMENT TO STUDY FLOW THROUGH A VENTURI METER
FLUIDS MECHANICS1 18
A graph of ‘Actual pressure’ is plotted against ‘Sections of Venturimeter’ for Flow rate No 4.

EXPERIMENT TO STUDY FLOW THROUGH A VENTURI METER
FLUIDS MECHANICS1 19
v Calculation of the coefficient of discharge, Cd, of the Venturimeter, for each flowrate.
The above equation is put in the form of Y = mX
Where,
Y = √h1-h2
X = Q
m = 1 √1-( a2 / a1)2 = gradient
Cd a2 √ 2g
The values of h1, h2, √h1-h2 and Q are tabulated below.
Note: h1 is the actual piezometer reading at position A
h2 is the actual piezometer reading at position D
Table 7
Flow rate No h1 (m) h2 (m) √h1-h2
Volume flow rate, Q*10-4 (m3/s)
1 0.219 0.192 0.1643 1.591
2 0.224 0.180 0.2098 2.005
3 0.225 0.168 0.2387 2.256
4 0.230 0.148 0.2864 2.739
5 0.235 0.132 0.3209 2.866
6 0.237 0.120 0.3421 3.164
7 0.241 0.105 0.3688 3.442
8 0.243 0.094 0.3860 3.630
9 0.246 0.081 0.4062 3.876
10 0.249 0.067 0.4266 3.836

EXPERIMENT TO STUDY FLOW THROUGH A VENTURI METER
FLUIDS MECHANICS1 20
A graph of √h1-h2 is plotted against Q

EXPERIMENT TO STUDY FLOW THROUGH A VENTURI METER
FLUIDS MECHANICS1 21
Using the graph, the gradient of the plotted line is calculated.
CALCULATION
From the equation,
(X2, Y2) - (4.00 x 10 -4, 0.424)
(X1, Y1) - (1.5x10⁻⁴, 0.152)
M = (0.424 - 0.152) / (4.00 x 10 -4 - 1.5x10⁻⁴)
= 1088
1 √1-( a2 / a1)2 = gradient of plotted line
Cd a2 √ 2g
Then,
1 √1-( a2 / a1)2 = 1088 Cd a2 √ 2g
Where,
Cd is the coefficient of discharge
a1 is the cross sectional area of Venturimeter at piezometer position A = 5.3093 x 10⁻⁴ m2
a2 is the cross sectional area of Venturimeter at piezometer position D = 2.0106 x 10⁻⁴ m2
g is the acceleration due to gravity = 9.81ms-2
1 x 1039.235 = 1088
Cd
Cd = 0.95518
Cd ≈ 0.96 (2 S.F)

EXPERIMENT TO STUDY FLOW THROUGH A VENTURI METER
FLUIDS MECHANICS1 22
v Calculation of the value of coefficient of discharge, Cd for each value of volumetric flow
rate, Q
Q = Cd a2 √ 2g (h1-‐h2)
√1-‐( a2 / a1)2
Therefore,
Cd = Q x √1-‐( a2 / a1)2
a2 √ 2g (h1-‐h2)
Where,
a1 is the cross sectional area of Venturimeter at piezometer position A = 5.3093 x 10⁻⁴ m2
a2 is the cross sectional area of Venturimeter at piezometer position D = 2.0106 x 10⁻⁴ m2
h1 is the actual piezometer reading at position A
h2 is the actual piezometer reading at position D
Table 8: The values of Volumetric Flow rate, Q; h1; h2; and Coefficient of discharge, Cd are tabulated below.
Flow rate No
Volumetric Flow rate, Q x 10-4 (m3/s) h1 (m) h2 (m) Coefficient of
discharge, Cd 1 1.591 0.219 0.192 1.006
2 2.005 0.224 0.180 0.993
3 2.256 0.225 0.168 0.982
4 2.739 0.230 0.148 0.994
5 2.866 0.235 0.132 0.928
6 3.164 0.237 0.120 0.961
7 3.442 0.241 0.105 0.969
8 3.630 0.243 0.094 0.981
9 3.876 0.246 0.081 0.992
10 3.836 0.249 0.067 0.935

EXPERIMENT TO STUDY FLOW THROUGH A VENTURI METER
FLUIDS MECHANICS1 23
A graph of Cd is plotted against Q

EXPERIMENT TO STUDY FLOW THROUGH A VENTURI METER
FLUIDS MECHANICS1 24
Conclusions
The shapes of the graphs of ideal and actual pressures are not similar. There is a large difference
between the values of ideal pressure and actual pressure. One possible reason for that difference is
that in practice there are head losses which are partly due to friction and partly due to shock
caused by a change of section. Another reason is that the venturimeter is not accurate for low
velocities.
The value of the coefficient of friction Cd ranges from 0.6-0.9.
The graph of Cd against Q is not a straight line and this shows that the coefficient of discharge is
not constant.
The coefficient Cd will have a different value for the converging and diverging cones of the meter.
The flow rate is independent of the inclination of the meter.
The venturimeter has a coefficient of discharge of 0.91, which means that the actual flow rate if
91% of the theoretical flow rate. Therefore, this value of discharge is a very good estimation for
flow rates and this is why venturimeters are commonly used to measure flow in pipes.
The graph of ideal and actual pressure against for Q1 and Q2 shows that the actual fluid pressure
is always smaller that the ideal flow rate. The difference in pressure between ideal and actual
becomes greater as we move along the length of the piezometer tubes. This is so because of
greater energy losses along the length of the tube, occurring due to turbulence at the diverging
section and due to greater frictional losses with the inner walls of the tube. Energy losses
accompanying the change of flow pattern within the converging section is lower than the
diverging section. Moreover, at the lowest pressures (at the trough) as the graph goes down to its
lowest values, the pressure is lower since the cross-sectional areas of the tubes are lower and the
velocities are high.
The graph of √ (h1-h2) against the flow rate Q is a straight line, meaning that these two variables
are proportional to each other. This confirms the validity of the flow rate equation used before.
The graph of Cd against flow rate Q is a curve showing the variation of Cd with an increasing flow
rate.

EXPERIMENT TO STUDY FLOW THROUGH A VENTURI METER
FLUIDS MECHANICS1 25
In this experiment, a horizontal venturimeter was used and the reference points were all at the
same elevation with respect to any horizontal datum. Therefore, the elevation head is similar and
cancel out in Bernoulli’s equation (as used before) and is not included for calculations. If an
inclined venturimeter was used, the elevation would have been different and hence the elevation
head would have to be included in the calculations. The actual and theoretical discharge will both
decrease since energy is used (or lost) to move the fluid to a higher elevation along the
venturimeter and is converted to potential energy. The readings on the piezometer tubes will be
lower from A to L than obtained here.

EXPERIMENT TO STUDY FLOW THROUGH A VENTURI METER
FLUIDS MECHANICS1 26
References • Hydraulics and Fluid Mechanics by E.H. Lewitt • http://www.cwru.edu
• fie.engrng.pitt.edu/fie2003/papers/1086.pdf
• www.ambalalab.com/engg_1024_6.htm
• www.ngu.ac.in/academic/engineering/ME402.htm
• Fluid Mechanics Lab Manual
• http://www.loai-naamani.com/Academics/Venturi_Meter.htm
• http://webpages.eng.wayne.edu/~aa6287/ce3250/ • The University of Edinburgh
School of Engineering and Electronics, Fluid Mechanics 3
Flow Measurement Methods
• Fluids mechanics third edition, J.F Douglas, J.M Gasiorek, J.A Swaffield
• www.ngu.ac.in/academic/engineering/ME402.htm
• http://www.loai-naamani.com/Academics/Venturi_Meter.htm