experiment four density determinations - suny...
TRANSCRIPT
Name:__________________________ Lab Section:__________ 04 – Density Determinations
35 | P a g e
Experiment Four – Density Determinations
Objective Density is an important property of matter that may be useful as a method of identification. In this
experiment, you will determine the densities of regularly and irregularly shaped solids, as well as
the densities of pure liquids and an unknown.
Introduction Density is a measure of the matter present within a unit of volume space, mass per volume (mass/Volume).
For most samples mass is measured in grams (g) or kilograms (kg), while volume is typically measured in
centimeters (cm3) for solids, milliliters (mL) for liquids, and Liters (L) for gasses. Since we seldom deal
with exactly 1.0 mL of a substance in the chemistry laboratory, we usually represent density as mass of the
sample divided by its volume. The units will depend on what phase the sample is in, but it’s always some
version of mass over Volume: solid = g/cm3, liquid = g/mL, gas = g/L.
𝒅𝒆𝒏𝒔𝒊𝒕𝒚 =𝒎𝒂𝒔𝒔
𝒗𝒐𝒍𝒖𝒎𝒆
The density effectively represents the ratio of mass/volume of any size sample, this allows us to use density
as an intensive property (property that doesn’t depend on the amount of a substance, example – the density
of water will be 1.0 g/mL regardless of if you have 10mL or 5000mL). An extensive property on the other
hand will depend on the amount of material present; mass and volume are examples of extensive properties.
Density is usually reported at around 20oC (room temperature) because volume of a substance, and hence
density, will often vary with temperature. This variation is most obvious in gases, with smaller (but often
noticeable) changes for liquids and solids. References, such as Handbook of Chemistry and Physics, will
specify the density at which the value was recorded, so be aware of that when looking up literature values.
Density is useful in determining the concentration of some solutions. When a solute is dissolved in a
solvent, the density of the solution will be different from that of the pure solvent itself. Alcohol distillers
and beer brewers use density to determine the alcohol content of their products. Water has a density of 1.0
g/mL and ethanol has a density of 0.79 g/mL; so as the density value of the alcoholic drink gets closer to
that of pure ethanol 0.79 g/mL, the more alcohol it contains. Using this idea it’s possible to determine the
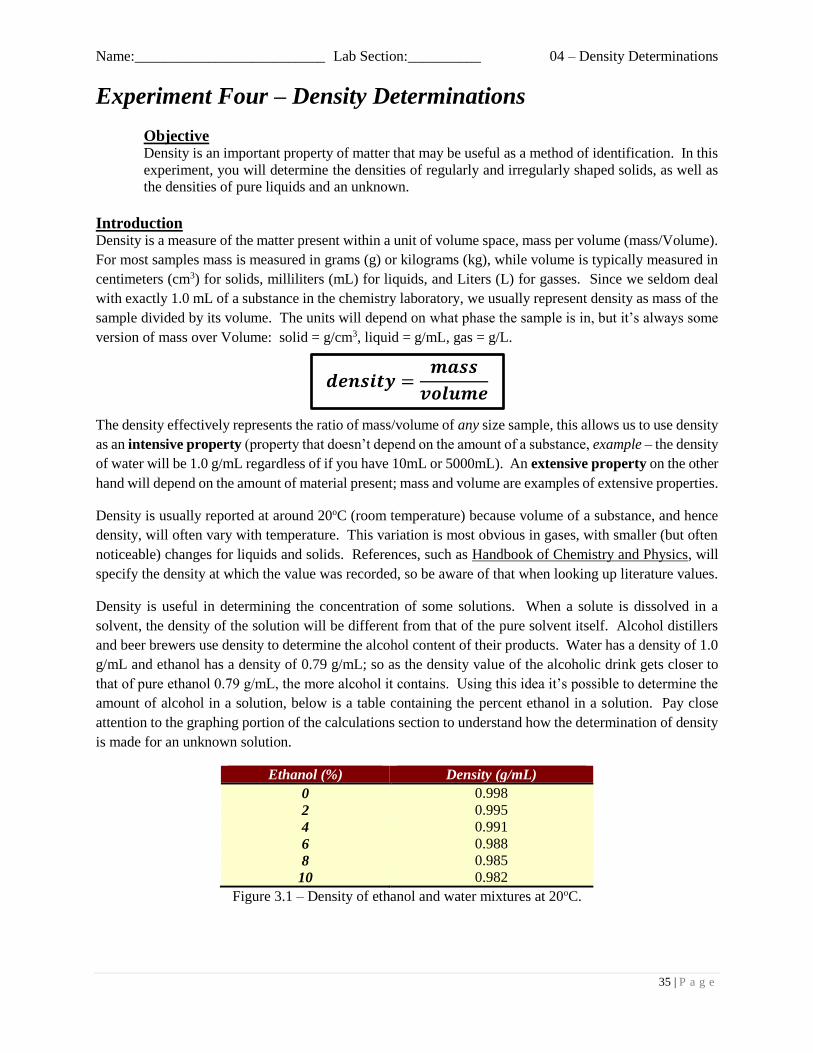
amount of alcohol in a solution, below is a table containing the percent ethanol in a solution. Pay close
attention to the graphing portion of the calculations section to understand how the determination of density
is made for an unknown solution.
Ethanol (%) Density (g/mL)
0 0.998
2 0.995
4 0.991
6 0.988
8 0.985
10 0.982
Figure 3.1 – Density of ethanol and water mixtures at 20oC.

Name:__________________________ Lab Section:__________ 04 – Density Determinations
36 | P a g e
There are several techniques used for the determination of density. The method used will depend on the
type of sample and on the precision desired for the measurement. For example the hydrometer is a
specialized meter used by the fermentation industry to determine the alcohol content of their products, it’s
quick and accurate to the thousandths (0.001). In general, a density determination will involve the
determination of the mass of the sample with a balance, but the method used to determine the volume of
the sample will differ from situation to situation. Several methods of volume determinations are explored
in this experiment.
For solid samples, there may be different methods needed for the determination of the volume, depending
on whether or not the solid is regularly shaped. If a solid has a regular shape (e.g., cube, rectangle, cylinder),
the volume of the solid may be determined by geometry:
For a cube or rectangle solid, volume = length • width • height
For a cylindrical solid, volume = π • (radius)2 • height
If a solid does not have a regular shape, it may be possible to determine the volume of the solid making use
of Archimedes’ principle, which state that an insoluble, non-reactive solid will displace a volume of liquid
equal to its own volume. Typically, an irregularly shaped solid is added to a liquid in a graduated cylinder
and the change in liquid level is determined. Figure 3.2 below demonstrates the change in water level, and
the displacement of water.
Figure 3.2 – displacement method of determining volume of a solid.
For liquids, very precise values of density may be determined by pipetting an exact volume of liquid into a
beaker or other glass container and then determining the mass of the liquid that was pipetted. A more
convenient method for routine density determinations for liquids is to weigh a particular volume of liquid
as contained in a graduated cylinder.
Vfinal
Vinitial

Name:__________________________ Lab Section:__________ 04 – Density Determinations
37 | P a g e
Calculations
% error
Percentage error is a way to check your experimental technique as well as the equipment used, against what
is accepted by the science community. The percent error is based on the experimentally determined values
obtained by a student in the lab, against the literature values accepted by science. If percent error is high
it’s an indication that there is an experimental issue: human error as a result of poor technique or flawed
equipment providing inaccurate measurements; most often it’s a combination of the two.
% 𝑒𝑟𝑟𝑜𝑟 =𝑒𝑥𝑝𝑒𝑟𝑖𝑚𝑒𝑛𝑡𝑎𝑙 𝑣𝑎𝑙𝑢𝑒 − 𝑙𝑖𝑡𝑒𝑟𝑎𝑡𝑢𝑟𝑒 𝑣𝑎𝑙𝑢𝑒
𝑙𝑖𝑡𝑒𝑟𝑎𝑡𝑢𝑟𝑒 𝑣𝑎𝑙𝑢𝑒𝑥100
Graphing
Graphs are a very powerful tool in science; they offer a viewable version of trends within data and can be
used to further understand values outside of the collected data via extrapolation. A graph contains two
axes; y-axis extends vertically and x-axis extending horizontally. The axes should be labeled with the name
of the axes and the unit in parenthesis (example – density (g/mL) or Percent Alcohol (%)). The scale of the
axes is based on your data, it’s important to maximize the space, as a result your data should utilize the
entire graph if possible while leaving room for extrapolation, shown below in “add a trend line”. Drawn
below is an example of a pair of axes:
0.95
0.96
0.97
0.98
0.99
1
0 5 10 15 20 25
y-axis
x-axis origin
den
sity
(g/m
L)
Percent Alcohol (%)
Name:__________________________ Lab Section:__________ 04 – Density Determinations
38 | P a g e
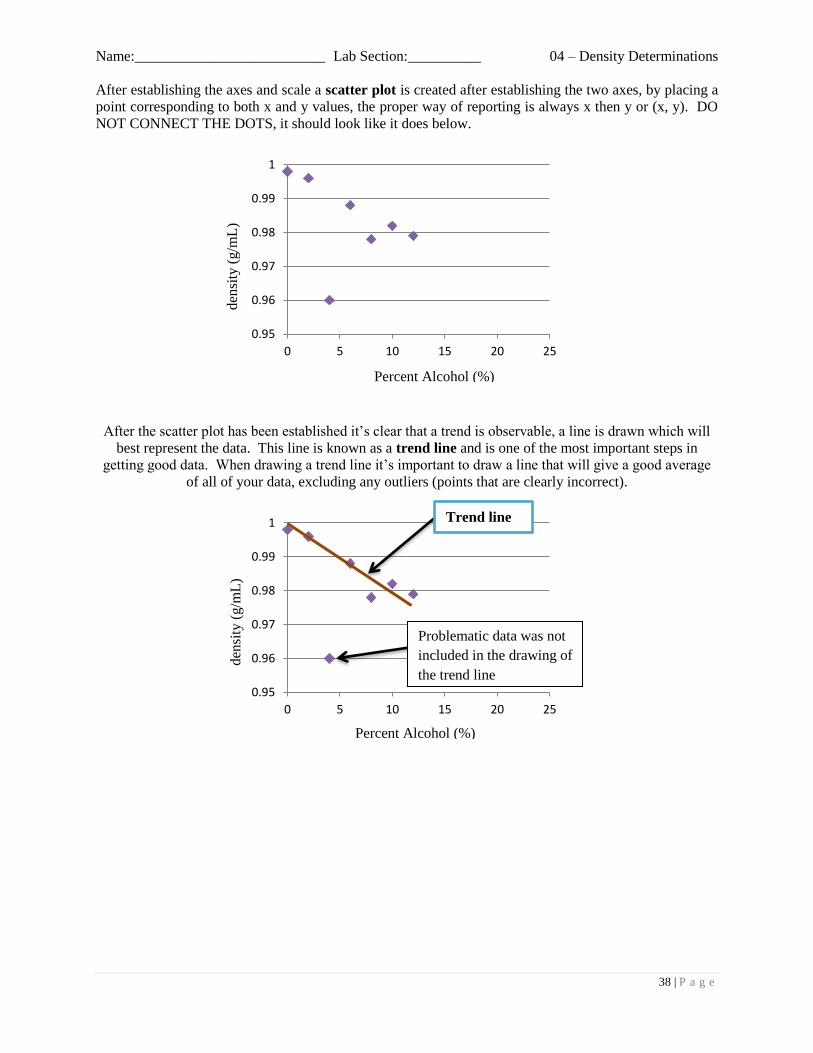
After establishing the axes and scale a scatter plot is created after establishing the two axes, by placing a
point corresponding to both x and y values, the proper way of reporting is always x then y or (x, y). DO
NOT CONNECT THE DOTS, it should look like it does below.
After the scatter plot has been established it’s clear that a trend is observable, a line is drawn which will
best represent the data. This line is known as a trend line and is one of the most important steps in
getting good data. When drawing a trend line it’s important to draw a line that will give a good average
of all of your data, excluding any outliers (points that are clearly incorrect).
0.95
0.96
0.97
0.98
0.99
1
0 5 10 15 20 25
0.95
0.96
0.97
0.98
0.99
1
0 5 10 15 20 25
den
sity
(g/m
L)
Percent Alcohol (%)
den
sity
(g/m
L)
Percent Alcohol (%)
Trend line
Problematic data was not
included in the drawing of
the trend line

Name:__________________________ Lab Section:__________ 04 – Density Determinations
39 | P a g e
Another incredibly important aspect of the trend line is its slope. Slope is the rise (change in x) divided by
the run (change in y) for two points:
𝒔𝒍𝒐𝒑𝒆 =𝒓𝒊𝒔𝒆
𝒓𝒖𝒏=
𝜟𝒚
𝜟𝒙=
𝒚𝟐 − 𝒚𝟏
𝒙𝟐 − 𝒙𝟏
In order to determine the slope just establish two points on your trend line and get the information from the
axes. Remember the values of x come before y for data points, (x, y). In this case point 1 sits at (4%, 0.993
g/mL) and point 2 sits at (11%, 0.981 g/mL) What is the slope of this line? (Answer = -0.0013 g/mL•%)
Negative slope indicates that the line goes downward. There is always a unit attached as well (unit of y /
unit of x).
Extrapolation is the last step, the dashed line represents the extrapolated (extended) trend line. If the
experiment hand continued beyond the last collection it shows the probable result for uncollected data. If
you were asked what the density of a 20% alcohol solution was, what would you guess the value would be?
According to the extrapolated line it’s apparent that the density at 20% alcohol is just below 0.96 g/mL.
0.95
0.96
0.97
0.98
0.99
1
0 5 10 15 20 25
0.95
0.96
0.97
0.98
0.99
1
0 5 10 15 20 25
den
sity
(g/m
L)
Percent Alcohol (%)
Extrapolated data
den
sity
(g/m
L)
Percent Alcohol (%)
1
2

Name:__________________________ Lab Section:__________ 04 – Density Determinations
40 | P a g e
Procedure
Record all data and observations in the space provided below, please write legibly.
Materials/Reagents Required
Unknown liquid sample
Unknown metal shot sample
Wood block
Ruler
50 or 100 mL graduated cylinder
Method
Part I – Regular Shaped Solid
1. Obtain a regularly shaped solid, and record its ID number.
2. With a ruler, determine the physical dimensions (length, width, and height) of the solid to the
nearest 0.02 mm.
Length =
Width =
Height =
3. Convert the values you just obtained to cm, a sample calculation is below. Record the length,
width, and height in your data sheet in cm.
4. Calculate the volume of your sample, where Volume = L x W x H, in cm3. Record the result as
“Volume of wood sample” on your data sheet.
5. Weigh the sample on a balance and record its mass as “mass of wood sample” on the data sheet.
6. Calculate the density of your regularly shaped solid in g/cm3. Record the result as “density of wood
sample” on your data sheet.
7. Using the data table below determine what type of wood you used. Record the result as “Type of
wood?” on your data sheet.
Wood Type Density (g/cm3)
Spruce 0.45
Pine, yellow 0.42
Douglas Fir 0.53

Name:__________________________ Lab Section:__________ 04 – Density Determinations
41 | P a g e
Part II – Metal Shot (irregularly shaped solid)
1. Obtain a test tube of shot from your instructor and record the sample ID on your data sheet.
2. Place the tube in an Erlenmeyer flask so it can sit upright and can be weighed.
3. Weigh the sample of metal shot along with the Erlenmeyer flask, test tube, and cork top. Record
the value as “mass of shot + glassware” in your data sheet.
4. Back at your lab bench lay out a piece or two of dry paper towel and pour the metal shot out very
carefully onto the paper. Weigh the glassware without the shot and record the value as “mass of
glassware” in your data sheet.
5. Calculate the mass of your metal shot (“mass of metal shot + glassware” – “mass of glassware”),
record the result in your data sheet as “mass of metal shot”.
6. Fill a graduated cylinder with ~10 mL of water, it’s okay to be off by a few milliliters. Record the
volume as “Volume (initial)” in your data sheet. Be sure to read the value out to one decimal place
(ex. 13.2 mL).
7. Carefully add your metal shot to the graduated cylinder without losing any of the pieces, easiest to
do this slowly and a little at a time. After all of the metal shot is in the graduated cylinder gently
shake and/or stir the sample to remove any air bubbles (very important).
8. Determine the new volume of water in the graduated cylinder and record it as “Volume (final)” in
your data sheet.
9. Calculate the change in volume, ΔV of the water. The change in water represents the volume of
water that was displaced by the metal shot, and as a result = the volume of shot placed in the
graduated cylinder. Record the value as “Volume of metal shot” in your data sheet.
𝜟𝑽 = 𝑽𝒇𝒊𝒏𝒂𝒍 − 𝑽𝒊𝒏𝒊𝒕𝒊𝒂𝒍
10. Calculate the density of your metal shot using the “mass of metal shot” and “Volume of metal
shot”. Record the result in your data sheet.
11. After determining the density, decant most of the water from the metal sample and dry it on the
paper towel. Once it’s dry place the sample back in the test tube and return the sample.
12. Based on your answer determine what type of metal you have from the data table below and record
your best guess in the data sheet.

Name:__________________________ Lab Section:__________ 04 – Density Determinations
42 | P a g e
Metal Type Density (g/cm3)
Aluminum 2.71
Zinc 7.13
Chromium 7.19
Tin 7.28
Iron 7.85
Copper 8.94
Lead 11.34
Part III – Pure liquid
1. Weigh an empty 10ml graduated cylinder on the balance and record the result as “mass of
graduated cylinder” on your data sheet.
2. Add ~5mL of your pure liquid to the weighed graduated cylinder.
3. Observe the volume of the pure liquid in the graduated cylinder to the appropriate number of
decimal places. Record the value as “Volume of pure liquid” on your data sheet.
4. Weigh the graduated cylinder with the pure liquid in it and record the value as “mass of graduated
cylinder + pure liquid”.
5. Calculate the mass of the pure liquid by subtracting the “mass of graduated cylinder” from the
“mass of graduated cylinder + unknown liquid”. Record the result as “mass of unknown liquid”
on your data sheet.
6. Calculate the density of the pure liquid by dividing the “mass of unknown liquid” by “Volume of
unknown liquid”. Record the result on your data sheet as “density of the pure liquid”.
WASTE DISPOSAL. All of the liquid sample from Part III should be disposed of in the waste
collection area indicated by your instructor. If you’re not sure where to put it, ask. DO NOT PUT THE
LIQUID DOWN THE DRAIN.

Name:__________________________ Lab Section:__________ 04 – Density Determinations
43 | P a g e
Part IV – % Alcohol in a solution
1. Weigh an empty 10ml graduated cylinder on the balance and record the result as “mass of
graduated cylinder” on your data sheet.
2. Add ~5mL of your alcohol solution sample to the weighed graduated cylinder.
3. Observe the volume of the liquid in the graduated cylinder to the appropriate number of decimal
places. Record the value as “Volume of alcohol solution” on your data sheet.
4. Weigh the graduated cylinder with the unknown liquid in it and record the value as “mass of
graduated cylinder + alcohol solution”.
5. Calculate the mass of unknown liquid by subtracting the “mass of graduated cylinder” from the
“mass of graduated cylinder + alcohol solution”. Record the result as “mass of alcohol solution”
on your data sheet.
6. Calculate the density of your unknown liquid by dividing the “mass of alcohol solution” by
“Volume of alcohol solution”. Record the result on your data sheet as “density of alcohol
solution”.
WASTE DISPOSAL. All of the liquid sample from Part IV should be disposed of in the waste
collection area indicated by your instructor. If you’re not sure where to put it, ask. DO NOT PUT THE
LIQUID DOWN THE DRAIN.
The following steps are to be done using the Calculations/Graphing section of the introduction.
7. Using the data in Figure 3.1, on page 1 of the lab, create a graph with the graph paper provided.
8. Add a trend line and determine the slope. Record the result as “slope” on your data sheet.
9. Extrapolate the data, by extending the trend line.
10. Based on your extrapolated data for density, determine the predicted % alcohol of your solution.
Record the result as “% alcohol of alcohol solution” on your data sheet.
11. Obtain the % alcohol value from the container and record the value as “% alcohol (from label)”
on your data sheet.
12. Based on your experimental and literature (bottle label) results for % alcohol, determine percent
error for your experiment, and show the calculation in the space provided on your data sheet.

Name:__________________________ Lab Section:__________ 04 – Density Determinations
44 | P a g e

Name:__________________________ Lab Section:__________ 04 – Density Determinations
45 | P a g e
Data Sheet
Part I – Regularly Shaped Solid
ID # of regular wood sample _______________
Dimensions (in cm)
Length _______________
Width _______________
Height _______________
Volume of wood sample _______________
mass of wood sample _______________
density of wood sample _______________
Type of wood? _______________
Part II –Metal Shot (irregularly shaped solid)
ID # of metal shot _______________
mass of shot + glassware _______________
mass of glassware _______________
mass of metal shot _______________
Volume (final) _______________
Volume (initial) _______________
Volume of metal shot _______________
density of metal shot _______________
Type of metal? _______________

Name:__________________________ Lab Section:__________ 04 – Density Determinations
46 | P a g e
Part III –Unknown Liquid (pure liquid)
What is the pure liquid being used _______________
mass of graduated cylinder + pure liquid _______________
mass of graduated cylinder _______________
mass of pure liquid _______________
Volume of pure liquid _______________
density of pure liquid _______________
Part IV ––% Alcohol in a solution
Name of alcohol solution _______________
mass of graduated cylinder + alcohol solution _______________
mass of graduated cylinder _______________
mass of alcohol solution _______________
Volume of alcohol solution _______________
density of alcohol solution _______________
% Alcohol in alcohol solution? _______________
% Alcohol (from label of bottle)? _______________
Slope of graph _______________
% error _______________
Name:__________________________ Lab Section:__________ 04 – Density Determinations
47 | P a g e
Slope calculation:
% Error calculation:

Name:__________________________ Lab Section:__________ 04 – Density Determinations
48 | P a g e

Name:__________________________ Lab Section:__________ 04 – Density Determinations
49 | P a g e
Post-Lab Questions
1. a.) What error would be introduced into the determination of density of the irregularly shaped
metal shot if you had not stirred/shaken the pellets to remove adhering air bubbles?
b.)Would the density be too high or too low? Explain your answer using the density equation.
2. a.) What error would be introduced into the determination of the density of the regularly shaped
solid if the solid were hollow?
b.) Would the apparent volume of the solid be larger or smaller than the actual volume?
c.) Would the density calculated be too high or low?
Name:__________________________ Lab Section:__________ 04 – Density Determinations
50 | P a g e
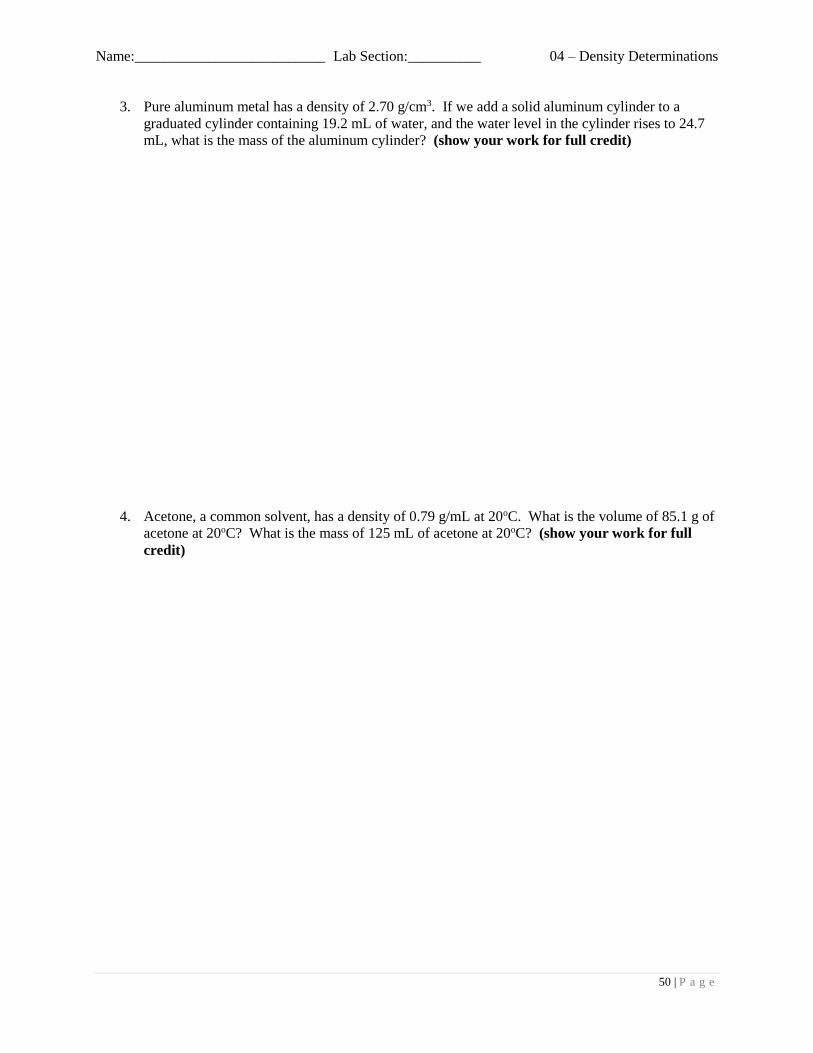
3. Pure aluminum metal has a density of 2.70 g/cm3. If we add a solid aluminum cylinder to a
graduated cylinder containing 19.2 mL of water, and the water level in the cylinder rises to 24.7
mL, what is the mass of the aluminum cylinder? (show your work for full credit)
4. Acetone, a common solvent, has a density of 0.79 g/mL at 20oC. What is the volume of 85.1 g of
acetone at 20oC? What is the mass of 125 mL of acetone at 20oC? (show your work for full
credit)