experiences with sonic wind sensors in operational conditions€¦ · · 2012-10-23experiences...
TRANSCRIPT

1
EXPERIENCES WITH SONIC WIND SENSORS IN OPERATIONAL CONDITIONS
Wiel M.F. Wauben
R&D Information and Observation Technology
Royal Netherlands Meteorological Institute (KNMI)
P.O. Box 201, 3730 AE De Bilt, The Netherlands
Tel. +31-30-2206 482, Fax +31-30-2210 407, e-mail: [email protected]
ABSTRACT
Previous investigations indicate that sonic wind sensors can be considered for operational use. In 2008 KNMI selected a 2D sonic wind sensor and introduced sonics in the measurement network in order to get operational experience. The reason for the replacement of conventional cup anemometers and wind vanes by sonic wind sensors is economical. The sonics have been installed at ten locations throughout the Netherlands, which have been selected to give a wide variety of conditions. At all locations the sonic has been installed in parallel to the existing operational cup anemometer wind vane combination. The measurements of the sonics and the cup anemometers and wind vanes have been made available in the measurement network in order to facilitate the user evaluation. A total of fifteen sonics were in the field for periods of about ½ to 2½ years. Wind tunnel tests have been performed to verify the absolute calibration of the sonics and in order to check any possible degradation of the sonics during the field deployment. Based on the experiences of the field evaluation, specifically the interference and the damage inflicted by birds and ageing of the sonics, KNMI decided not to replace the cup anemometer and wind vane of the measurement network with sonics at this moment.
1. INTRODUCTION
The Royal Netherlands Meteorological Institute (KNMI) uses conventional cup anemometers and wind vanes to measure wind speed and direction. Although the KNMI cup and vane meet WMO requirements concerning the accuracy of wind measurements (WMO, 2008), the sensors require a relatively large amount of maintenance. Therefore, the usage of alternative wind sensors has been considered. In a previous study three commercial 2D sonic wind sensors have been tested (Wauben, 2007). Based on the results of these tests and recent instrument developments, KNMI decided that replacement of cup anemometers and wind vanes by 2D sonic wind sensors was feasible. The Thies 2D sonic wind sensor (Thies, 2008) was selected by KNMI. This sensor is an advanced model compared to the Thies 2D sonic considered in the previous evaluation. The advanced sensor has the required wind speed range up to 75 m/s and an improved housing of the transducers which prevents any damage by birds. With these improvements the shortcomings of the previous evaluation should have been solved. The accuracy of the wind measurements using sonic wind sensors proved to be satisfactory in the previous field evaluation. However, the robustness and stability of the sonics in operational conditions still needed to be verified. The evaluation of 2D sonics in operational conditions is the topic of this paper.
KNMI decided, however, that 2D sonic wind sensors are not suitable for wind profile
measurements in the 213 m meteorological mast at Cabauw. An uncertainty of the wind speed of maximally 2 % at all wind directions is required for the wind profile measurements. The transducers/arms of 2D sonic sensors generally disturb the wind field when the wind is parallel to a transducer pair. For horizontal wind this disturbance is compensated by a direction and speed dependent correction that is applied to the instantaneously measured wind in the sensor software. This correction is less adequate for when the wind has a significant non-horizontal component. Errors of up to −8 % occur when the wind is parallel to a transducer pair with an inclination angle of about 10° (Wauben, 2007). Hence KNMI also conducted a test with 3D sonic wind sensors in order to evaluate their suitability for wind profile measurements. The evaluation of the 3D sonic wind sensors will be reported in a KNMI technical report.
Wauben: Experiences with Sonic Wind Sensors in Operational Conditions, WMO TECO, Brussels, 2012
2
2. WIND TUNNEL ACCEPTANCE TESTS
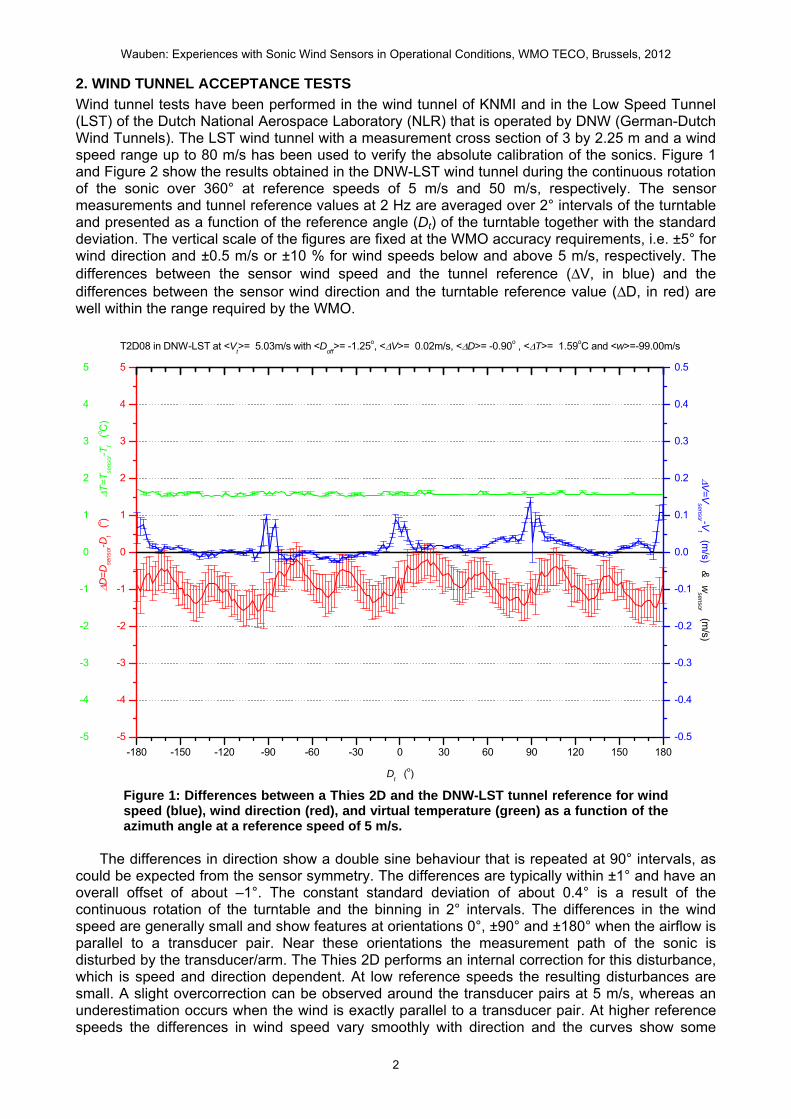
Wind tunnel tests have been performed in the wind tunnel of KNMI and in the Low Speed Tunnel (LST) of the Dutch National Aerospace Laboratory (NLR) that is operated by DNW (German-Dutch Wind Tunnels). The LST wind tunnel with a measurement cross section of 3 by 2.25 m and a wind speed range up to 80 m/s has been used to verify the absolute calibration of the sonics. Figure 1 and Figure 2 show the results obtained in the DNW-LST wind tunnel during the continuous rotation of the sonic over 360° at reference speeds of 5 m/s and 50 m/s, respectively. The sensor measurements and tunnel reference values at 2 Hz are averaged over 2° intervals of the turntable and presented as a function of the reference angle (Dt) of the turntable together with the standard deviation. The vertical scale of the figures are fixed at the WMO accuracy requirements, i.e. ±5° for wind direction and ±0.5 m/s or ±10 % for wind speeds below and above 5 m/s, respectively. The differences between the sensor wind speed and the tunnel reference (ΔV, in blue) and the differences between the sensor wind direction and the turntable reference value (ΔD, in red) are well within the range required by the WMO.
-180 -150 -120 -90 -60 -30 0 30 60 90 120 150 180
-5
-4
-3
-2
-1
0
1
2
3
4
5
-0.5
-0.4
-0.3
-0.2
-0.1
0.0
0.1
0.2
0.3
0.4
0.5
-5
-4
-3
-2
-1
0
1
2
3
4
5
T2D08 in DNW-LST at <Vt>= 5.03m/s with <D
off>= -1.25o, <ΔV>= 0.02m/s, <ΔD>= -0.90o , <ΔT>= 1.59oC and <w>=-99.00m/s
ΔD=
Dse
nsor-D
t (o )
Dt (o)
ΔV=
Vsensor -V
t (m/s) &
wsensor (m
/s)
ΔT=T
sens
or-T
t (o C
)
Figure 1: Differences between a Thies 2D and the DNW-LST tunnel reference for wind speed (blue), wind direction (red), and virtual temperature (green) as a function of the azimuth angle at a reference speed of 5 m/s.
The differences in direction show a double sine behaviour that is repeated at 90° intervals, as
could be expected from the sensor symmetry. The differences are typically within ±1° and have an overall offset of about –1°. The constant standard deviation of about 0.4° is a result of the continuous rotation of the turntable and the binning in 2° intervals. The differences in the wind speed are generally small and show features at orientations 0°, ±90° and ±180° when the airflow is parallel to a transducer pair. Near these orientations the measurement path of the sonic is disturbed by the transducer/arm. The Thies 2D performs an internal correction for this disturbance, which is speed and direction dependent. At low reference speeds the resulting disturbances are small. A slight overcorrection can be observed around the transducer pairs at 5 m/s, whereas an underestimation occurs when the wind is exactly parallel to a transducer pair. At higher reference speeds the differences in wind speed vary smoothly with direction and the curves show some
Wauben: Experiences with Sonic Wind Sensors in Operational Conditions, WMO TECO, Brussels, 2012
3
noise. At 65 m/s the deviations at the orientation of the transducers are more pronounced reaching values up to about 3 %.
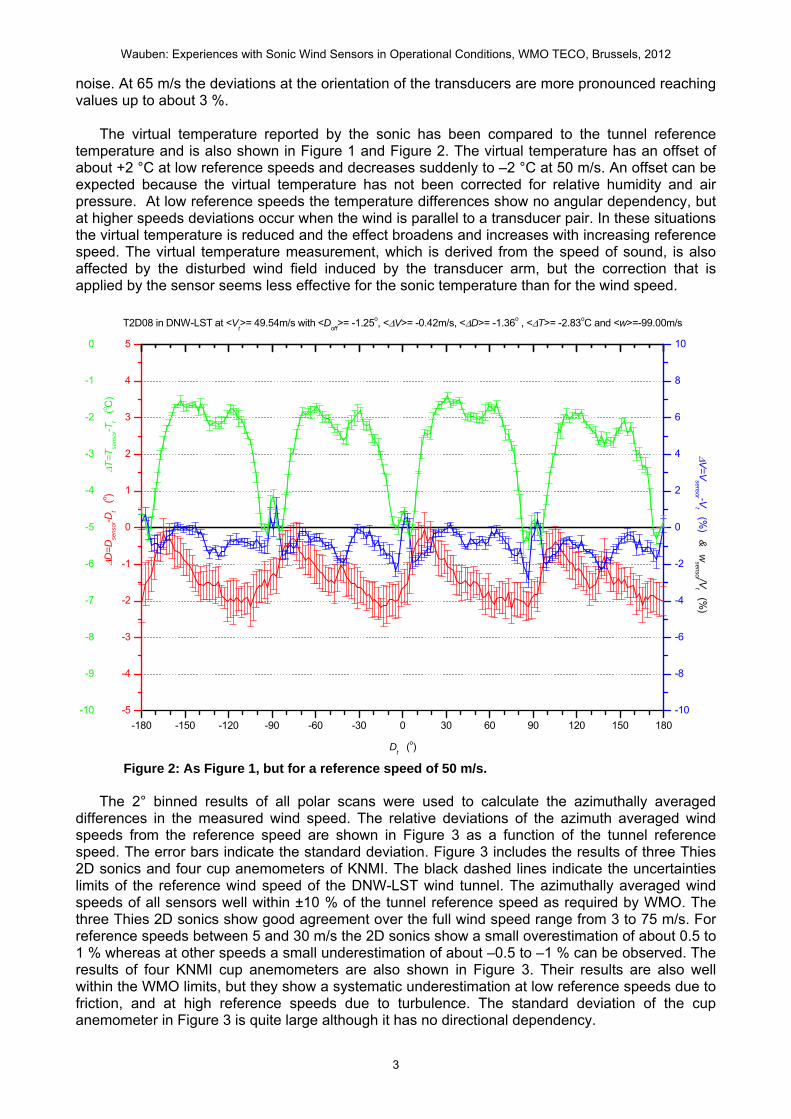
The virtual temperature reported by the sonic has been compared to the tunnel reference
temperature and is also shown in Figure 1 and Figure 2. The virtual temperature has an offset of about +2 °C at low reference speeds and decreases suddenly to –2 °C at 50 m/s. An offset can be expected because the virtual temperature has not been corrected for relative humidity and air pressure. At low reference speeds the temperature differences show no angular dependency, but at higher speeds deviations occur when the wind is parallel to a transducer pair. In these situations the virtual temperature is reduced and the effect broadens and increases with increasing reference speed. The virtual temperature measurement, which is derived from the speed of sound, is also affected by the disturbed wind field induced by the transducer arm, but the correction that is applied by the sensor seems less effective for the sonic temperature than for the wind speed.
-180 -150 -120 -90 -60 -30 0 30 60 90 120 150 180
-5
-4
-3
-2
-1
0
1
2
3
4
5
-10
-8
-6
-4
-2
0
2
4
6
8
10
-10
-9
-8
-7
-6
-5
-4
-3
-2
-1
0
T2D08 in DNW-LST at <Vt>= 49.54m/s with <D
off>= -1.25o, <ΔV>= -0.42m/s, <ΔD>= -1.36o , <ΔT>= -2.83oC and <w>=-99.00m/s
ΔD=
Dse
nsor-D
t (
o )
Dt (o)
ΔV=
Vsensor -V
t (%) &
wsensor /V
t (%)
ΔT=T
sens
or-T
t (
o C)
Figure 2: As Figure 1, but for a reference speed of 50 m/s.
The 2° binned results of all polar scans were used to calculate the azimuthally averaged
differences in the measured wind speed. The relative deviations of the azimuth averaged wind speeds from the reference speed are shown in Figure 3 as a function of the tunnel reference speed. The error bars indicate the standard deviation. Figure 3 includes the results of three Thies 2D sonics and four cup anemometers of KNMI. The black dashed lines indicate the uncertainties limits of the reference wind speed of the DNW-LST wind tunnel. The azimuthally averaged wind speeds of all sensors well within ±10 % of the tunnel reference speed as required by WMO. The three Thies 2D sonics show good agreement over the full wind speed range from 3 to 75 m/s. For reference speeds between 5 and 30 m/s the 2D sonics show a small overestimation of about 0.5 to 1 % whereas at other speeds a small underestimation of about –0.5 to –1 % can be observed. The results of four KNMI cup anemometers are also shown in Figure 3. Their results are also well within the WMO limits, but they show a systematic underestimation at low reference speeds due to friction, and at high reference speeds due to turbulence. The standard deviation of the cup anemometer in Figure 3 is quite large although it has no directional dependency.

Wauben: Experiences with Sonic Wind Sensors in Operational Conditions, WMO TECO, Brussels, 2012
4
3 4 5 6 7 8 9 10 20 30 40 50 60 70 80
-6
-5
-4
-3
-2
-1
0
1
2
Thies2D 08 Thies2D 10 Thies2D 12 CUP 22 CUP 37 CUP 23 CUP 24 Uncertainty reference
<ΔV
>/<
Vt>
(%
)
<Vt> (m/s)
Figure 3: Relative differences between the azimuth averaged wind speeds reported by three Thies 2D sonics and the tunnel reference in the DNW-LST wind tunnel as a function of the tunnel reference speed.
0 30 60 90 120 150 180 210 240 270 300 330 360
-2.5
-2.0
-1.5
-1.0
-0.5
0.0
0.5
1.0
1.5
2.0
2.5
1 m/s 2 m/s 3 m/s 5 m/s 7 m/s 10 m/s 15 m/s 20 m/s
ΔD=
Dse
nsor-D
t-Dof
f (
o )
Dt (o)
Figure 4: Azimuth dependency of the deviations in wind direction obtained in the KNMI wind tunnel for fifteen Thies 2D sonics at 8 reference speeds.
Wauben: Experiences with Sonic Wind Sensors in Operational Conditions, WMO TECO, Brussels, 2012
5
Initially ten Thies 2D sonic wind sensors were purchased by KNMI, but later damaged sensors were replaced or sonics have been upgraded. A total of fifteen Thies 2D sonics have been verified in the KNMI wind tunnel prior to their deployment in the field test. Since the KNMI wind tunnel has a measurements section with a diameter of only 0.4 m and a wind speed range of 0.2 m/s to about 27 m/s it has only been used to check the inter-reproducibility and stability of the sonics. Figure 4 shows the deviations in wind direction as a function of reference azimuth angle for 8 reference speeds and for all fifteen Thies 2D sonics. The results have been corrected for the overall offset in direction of each sensor which ranges between ±1.2° (see Table 1). After this offset correction the deviations in wind direction show almost no dependency with reference speed and the results for all fifteen Thies 2D sonics are within about ±0.5°. Note that the amplitudes of the deviations for direction obtained in the KNMI wind tunnel of about 1.5° are slightly larger than those of the DNW-LST wind tunnel of about 1°.
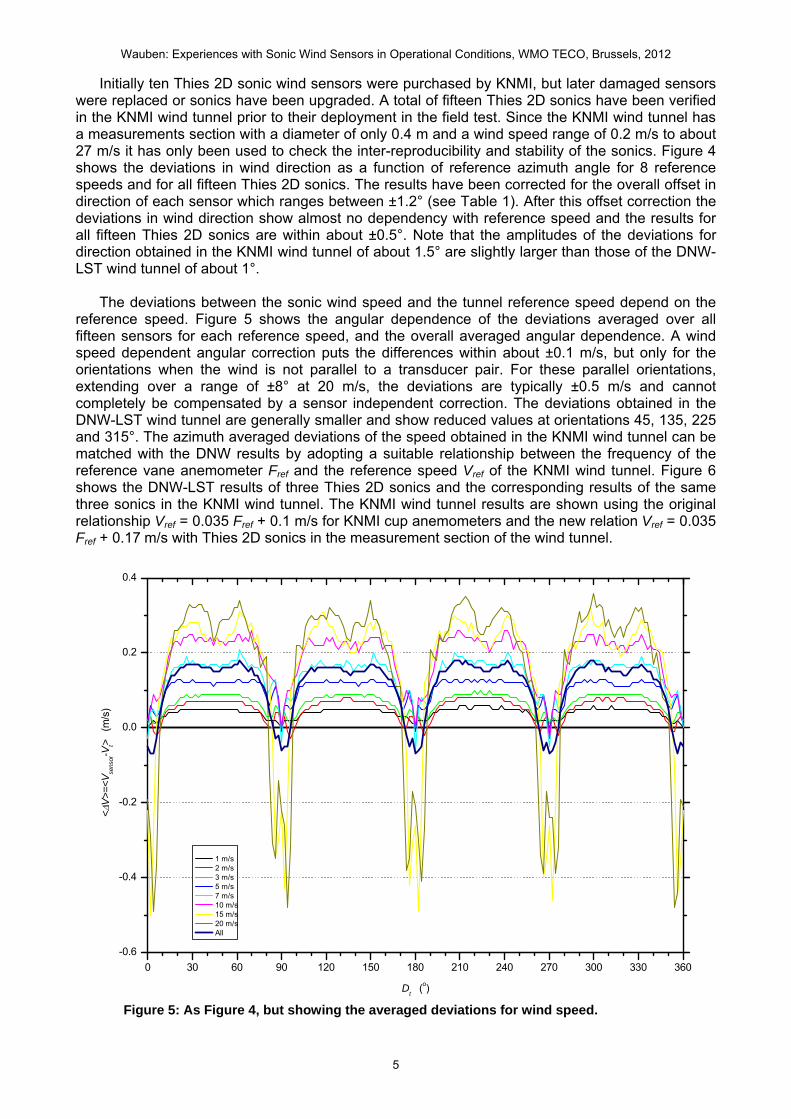
The deviations between the sonic wind speed and the tunnel reference speed depend on the
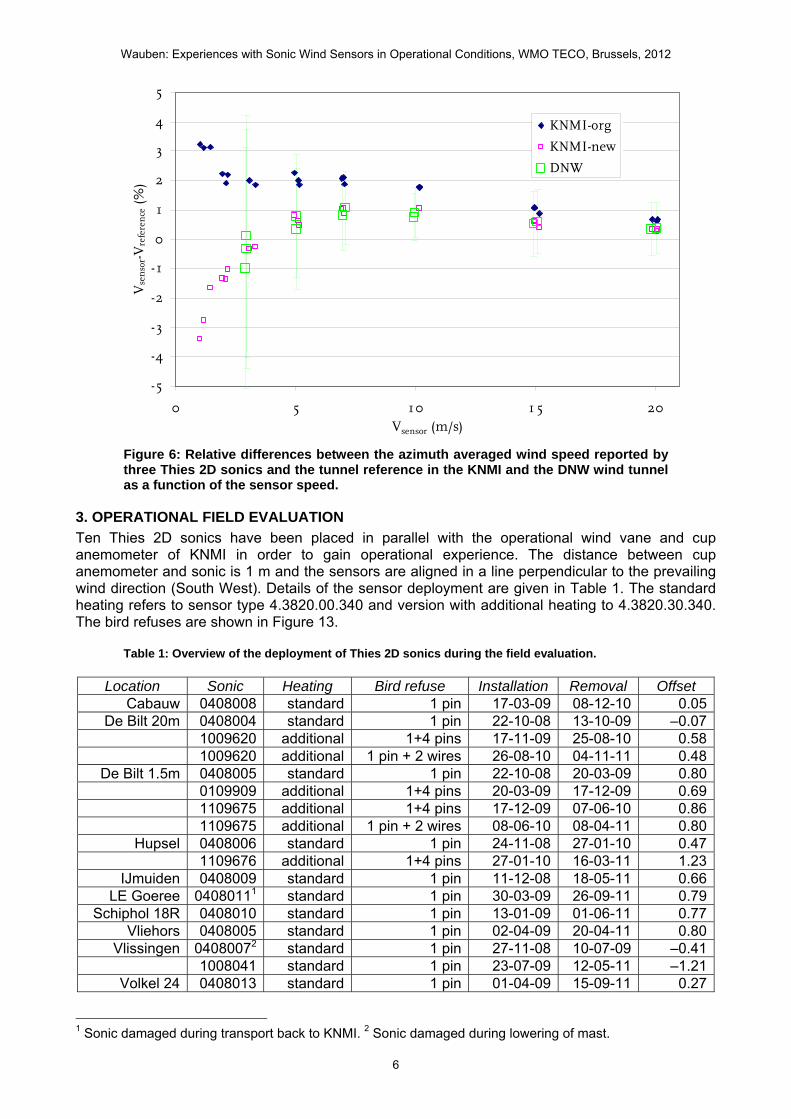
reference speed. Figure 5 shows the angular dependence of the deviations averaged over all fifteen sensors for each reference speed, and the overall averaged angular dependence. A wind speed dependent angular correction puts the differences within about ±0.1 m/s, but only for the orientations when the wind is not parallel to a transducer pair. For these parallel orientations, extending over a range of ±8° at 20 m/s, the deviations are typically ±0.5 m/s and cannot completely be compensated by a sensor independent correction. The deviations obtained in the DNW-LST wind tunnel are generally smaller and show reduced values at orientations 45, 135, 225 and 315°. The azimuth averaged deviations of the speed obtained in the KNMI wind tunnel can be matched with the DNW results by adopting a suitable relationship between the frequency of the reference vane anemometer Fref and the reference speed Vref of the KNMI wind tunnel. Figure 6 shows the DNW-LST results of three Thies 2D sonics and the corresponding results of the same three sonics in the KNMI wind tunnel. The KNMI wind tunnel results are shown using the original relationship Vref = 0.035 Fref + 0.1 m/s for KNMI cup anemometers and the new relation Vref = 0.035 Fref + 0.17 m/s with Thies 2D sonics in the measurement section of the wind tunnel.
0 30 60 90 120 150 180 210 240 270 300 330 360
-0.6
-0.4
-0.2
0.0
0.2
0.4
1 m/s 2 m/s 3 m/s 5 m/s 7 m/s 10 m/s 15 m/s 20 m/s All
<ΔV
>=
<V
sens
or-V
t>
(m/s
)
Dt (o)
Figure 5: As Figure 4, but showing the averaged deviations for wind speed.
Wauben: Experiences with Sonic Wind Sensors in Operational Conditions, WMO TECO, Brussels, 2012
6
-5
-4
-3
-2
-1
0
1
2
3
4
5
0 5 10 15 20Vsensor (m/s)
Vse
nso
r-Vre
fere
nce
(%
)KNMI-org
KNMI-new
DNW
Figure 6: Relative differences between the azimuth averaged wind speed reported by three Thies 2D sonics and the tunnel reference in the KNMI and the DNW wind tunnel as a function of the sensor speed.
3. OPERATIONAL FIELD EVALUATION
Ten Thies 2D sonics have been placed in parallel with the operational wind vane and cup anemometer of KNMI in order to gain operational experience. The distance between cup anemometer and sonic is 1 m and the sensors are aligned in a line perpendicular to the prevailing wind direction (South West). Details of the sensor deployment are given in Table 1. The standard heating refers to sensor type 4.3820.00.340 and version with additional heating to 4.3820.30.340. The bird refuses are shown in Figure 13.
Table 1: Overview of the deployment of Thies 2D sonics during the field evaluation.
Location Sonic Heating Bird refuse Installation Removal Offset Cabauw 0408008 standard 1 pin 17-03-09 08-12-10 0.05
De Bilt 20m 0408004 standard 1 pin 22-10-08 13-10-09 –0.07 1009620 additional 1+4 pins 17-11-09 25-08-10 0.58 1009620 additional 1 pin + 2 wires 26-08-10 04-11-11 0.48
De Bilt 1.5m 0408005 standard 1 pin 22-10-08 20-03-09 0.80 0109909 additional 1+4 pins 20-03-09 17-12-09 0.69 1109675 additional 1+4 pins 17-12-09 07-06-10 0.86 1109675 additional 1 pin + 2 wires 08-06-10 08-04-11 0.80
Hupsel 0408006 standard 1 pin 24-11-08 27-01-10 0.47 1109676 additional 1+4 pins 27-01-10 16-03-11 1.23
IJmuiden 0408009 standard 1 pin 11-12-08 18-05-11 0.66LE Goeree 04080111 standard 1 pin 30-03-09 26-09-11 0.79
Schiphol 18R 0408010 standard 1 pin 13-01-09 01-06-11 0.77Vliehors 0408005 standard 1 pin 02-04-09 20-04-11 0.80
Vlissingen 04080072 standard 1 pin 27-11-08 10-07-09 –0.41 1008041 standard 1 pin 23-07-09 12-05-11 –1.21
Volkel 24 0408013 standard 1 pin 01-04-09 15-09-11 0.27
1 Sonic damaged during transport back to KNMI. 2 Sonic damaged during lowering of mast.
Wauben: Experiences with Sonic Wind Sensors in Operational Conditions, WMO TECO, Brussels, 2012
7
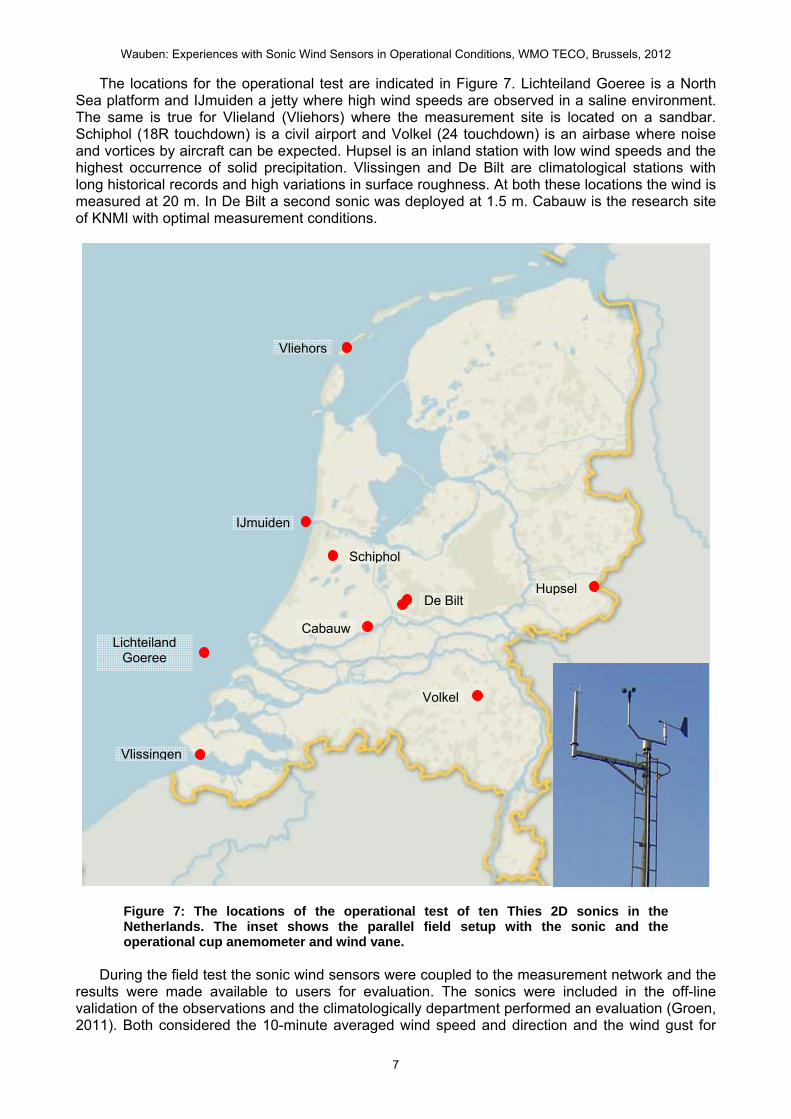
The locations for the operational test are indicated in Figure 7. Lichteiland Goeree is a North Sea platform and IJmuiden a jetty where high wind speeds are observed in a saline environment. The same is true for Vlieland (Vliehors) where the measurement site is located on a sandbar. Schiphol (18R touchdown) is a civil airport and Volkel (24 touchdown) is an airbase where noise and vortices by aircraft can be expected. Hupsel is an inland station with low wind speeds and the highest occurrence of solid precipitation. Vlissingen and De Bilt are climatological stations with long historical records and high variations in surface roughness. At both these locations the wind is measured at 20 m. In De Bilt a second sonic was deployed at 1.5 m. Cabauw is the research site of KNMI with optimal measurement conditions.
Figure 7: The locations of the operational test of ten Thies 2D sonics in the Netherlands. The inset shows the parallel field setup with the sonic and the operational cup anemometer and wind vane.
During the field test the sonic wind sensors were coupled to the measurement network and the
results were made available to users for evaluation. The sonics were included in the off-line validation of the observations and the climatologically department performed an evaluation (Groen, 2011). Both considered the 10-minute averaged wind speed and direction and the wind gust for
IJmuiden
Vliehors
Vlissingen
CabauwLichteiland
Goeree
Volkel
Hupsel De Bilt
Schiphol

Wauben: Experiences with Sonic Wind Sensors in Operational Conditions, WMO TECO, Brussels, 2012
8
that purpose and compared the results of the sonics with that of the collocated operational cup anemometer and wind vane. The results indicated an offset in the wind direction for some locations off about 3° and the averaged wind speed and gust deviate about 0.1 m/s. Both concluded that the replacement of cup anemometer and wind vane by sonics had a negligibly influence on the wind observations. However, when the data was analysed in more detail using 1-minute average data larger deviations could sometimes be observed. Generally the 1-minute data of sonic and cup/vane follow each other very closely as can be observed in Figure 8. The results for the wind direction cover nearly the full 360° wind direction range and show an offset of 3.5° between wind vane and sonic. The curves for the wind speed reported by cup anemometer and sonic are almost on top of each other. Note that cup anemometer and sonic report a maximum of respectively 18.3 and 18.7 m/s at 2:20 UT.
0 4 8 12 16 20 24
0
30
60
90
120
150
180
210
240
270
300
330
360
0
1
2
3
4
5
6
7
8
9
10
11
12
Win
d di
rect
ion
(o )
Time (hours)
direction vane direction sonic speed cup speed sonic
Win
d sp
eed
(m/s
)
Figure 8: The 1-minute averaged wind speed and direction observed at 20 m in De Bilt on May 26, 2009.
However, sometimes the results of the Thies 2D sonic showed deviations from cup/vane
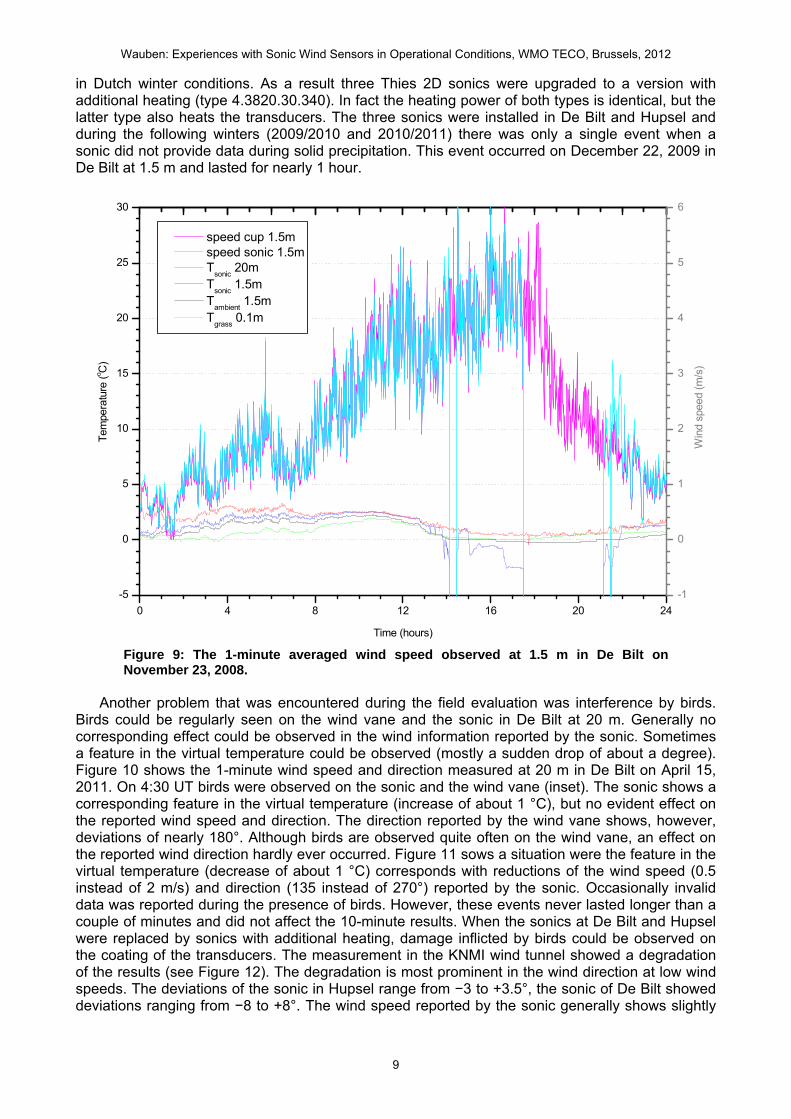
results during precipitation and particularly solid precipitation. Of course it cannot be assumed that the cup/vane operates undisturbed in these conditions. In these situations the sonic often showed a feature in the virtual temperature, which drops suddenly by several degrees, and it rejected some of the raw measurements as a result of internal quality checks. During some events the sonic with standard heating did not report any valid data. One of these events, a very extensive one, is shown in Figure 9. On November 28, 2008 it snowed in De Bilt between about 12:45 and 20 UT. Shortly after 14 UT there is a short outage of the sonic and a second event occurs between 17:30 and 21 UT. Between 15 and 17:30 UT the virtual temperature reported by the sonic show a reduction that is not confirmed by the other temperature measurements. The sonic returned to normal about 1 hour after cessation of the snow event. Note that during the entire event the other sonic at 20 m operated correctly continuously.
During the winter of 2008/2009 several events occurred when the sonic did not provide valid
10-minute data during wintry conditions. Hence, it was concluded that the Thies 2D sonic with standard heating (type 4.3820.00.340) was not able to function continuously without interruptions
Wauben: Experiences with Sonic Wind Sensors in Operational Conditions, WMO TECO, Brussels, 2012
9
in Dutch winter conditions. As a result three Thies 2D sonics were upgraded to a version with additional heating (type 4.3820.30.340). In fact the heating power of both types is identical, but the latter type also heats the transducers. The three sonics were installed in De Bilt and Hupsel and during the following winters (2009/2010 and 2010/2011) there was only a single event when a sonic did not provide data during solid precipitation. This event occurred on December 22, 2009 in De Bilt at 1.5 m and lasted for nearly 1 hour.
0 4 8 12 16 20 24
-5
0
5
10
15
20
25
30
-1
0
1
2
3
4
5
6
speed cup 1.5m speed sonic 1.5m T
sonic 20m
Tsonic
1.5m T
ambient 1.5m
Tgrass
0.1m
Tem
pera
ture
(o C
)
Time (hours)
Win
d sp
eed
(m/s
)
Figure 9: The 1-minute averaged wind speed observed at 1.5 m in De Bilt on November 23, 2008.
Another problem that was encountered during the field evaluation was interference by birds.
Birds could be regularly seen on the wind vane and the sonic in De Bilt at 20 m. Generally no corresponding effect could be observed in the wind information reported by the sonic. Sometimes a feature in the virtual temperature could be observed (mostly a sudden drop of about a degree). Figure 10 shows the 1-minute wind speed and direction measured at 20 m in De Bilt on April 15, 2011. On 4:30 UT birds were observed on the sonic and the wind vane (inset). The sonic shows a corresponding feature in the virtual temperature (increase of about 1 °C), but no evident effect on the reported wind speed and direction. The direction reported by the wind vane shows, however, deviations of nearly 180°. Although birds are observed quite often on the wind vane, an effect on the reported wind direction hardly ever occurred. Figure 11 sows a situation were the feature in the virtual temperature (decrease of about 1 °C) corresponds with reductions of the wind speed (0.5 instead of 2 m/s) and direction (135 instead of 270°) reported by the sonic. Occasionally invalid data was reported during the presence of birds. However, these events never lasted longer than a couple of minutes and did not affect the 10-minute results. When the sonics at De Bilt and Hupsel were replaced by sonics with additional heating, damage inflicted by birds could be observed on the coating of the transducers. The measurement in the KNMI wind tunnel showed a degradation of the results (see Figure 12). The degradation is most prominent in the wind direction at low wind speeds. The deviations of the sonic in Hupsel range from −3 to +3.5°, the sonic of De Bilt showed deviations ranging from −8 to +8°. The wind speed reported by the sonic generally shows slightly

Wauben: Experiences with Sonic Wind Sensors in Operational Conditions, WMO TECO, Brussels, 2012
10
enhanced values, but the angular dependency also changes particularly for wind speeds below 10 m/s. Around 90° the sonic gives higher values, whereas it reports lower values around 270°.
0 4 8 12 16 20 24
0
30
60
90
120
150
180
210
240
270
300
330
360
0
1
2
3
4
5
6
7
8
9
10
11
12
0 2 4 6 8 10 12 14 16 18 20 22 24
0
5
10
15W
ind
dire
ctio
n (o )
Time (hours)
direction vane direction sonic speed cup speed sonic
Win
d sp
eed
(m/s
)
Virt
ual t
empe
ratu
re (o C
)
Figure 10: The 1-minute averaged wind speed and direction and the virtual temperature observed at 20 m in De Bilt on April 15, 2011.
0 4 8 12 16 20 24
0
30
60
90
120
150
180
210
240
270
300
330
360
0
1
2
3
4
5
6
7
8
9
10
11
12
0 2 4 6 8 10 12 14 16 18 20 22 24
0
5
10
15
Win
d di
rect
ion
(o )
Time (hours)
direction vane direction sonic speed cup speed sonic
Win
d sp
eed
(m/s
)
Virt
ual t
empe
ratu
re (o C
)
Figure 11: As Figure 10, but for March 13, 2009.

Wauben: Experiences with Sonic Wind Sensors in Operational Conditions, WMO TECO, Brussels, 2012
11
0 30 60 90 120 150 180 210 240 270 300 330 360
-3
-2
-1
0
1
2
3
4
<Vt>=1.2m/s <ΔD>=0.3o
<Vt>=2.2m/s <ΔD>=0.4o
<Vt>=3.2m/s <ΔD>=0.4o
<Vt>=5.2m/s <ΔD>=0.4o
<Vt>=7.1m/s <ΔD>=0.4o
<Vt>=10.2m/s <ΔD>=0.4o
<Vt>=15.2m/s <ΔD>=0.3o
<Vt>=20.1m/s <ΔD>=0.3o
ΔD=D
sens
or-D
t-Dof
f (o )
Dt (o)
0 30 60 90 120 150 180 210 240 270 300 330 360
-0.6
-0.4
-0.2
0.0
0.2
0.4
0.6
0.8
<Vt>=1.2m/s <ΔV>=0m/s
<Vt>=2.2m/s <ΔV>=0.1m/s
<Vt>=3.2m/s <ΔV>=0.1m/s
<Vt>=5.2m/s <ΔV>=0.1m/s
<Vt>=7.1m/s <ΔV>=0.1m/s
<Vt>=10.2m/s <ΔV>=0.2m/s
<Vt>=15.2m/s <ΔV>=0.3m/s
<Vt>=20.1m/s <ΔV>=0.4m/s
ΔV=
Vse
nsor-V
t (
m/s
)
Dt (o)
Figure 12: Azimuth dependency of the deviations in wind direction (top) and speed (bottom) obtained in the KNMI wind tunnel for Thies 2D sonic #06 after deployment at Hupsel for various reference speeds. The thick solid lines give the range of the results of all Thies 2D sonics prior to the field deployment.
Wauben: Experiences with Sonic Wind Sensors in Operational Conditions, WMO TECO, Brussels, 2012
12
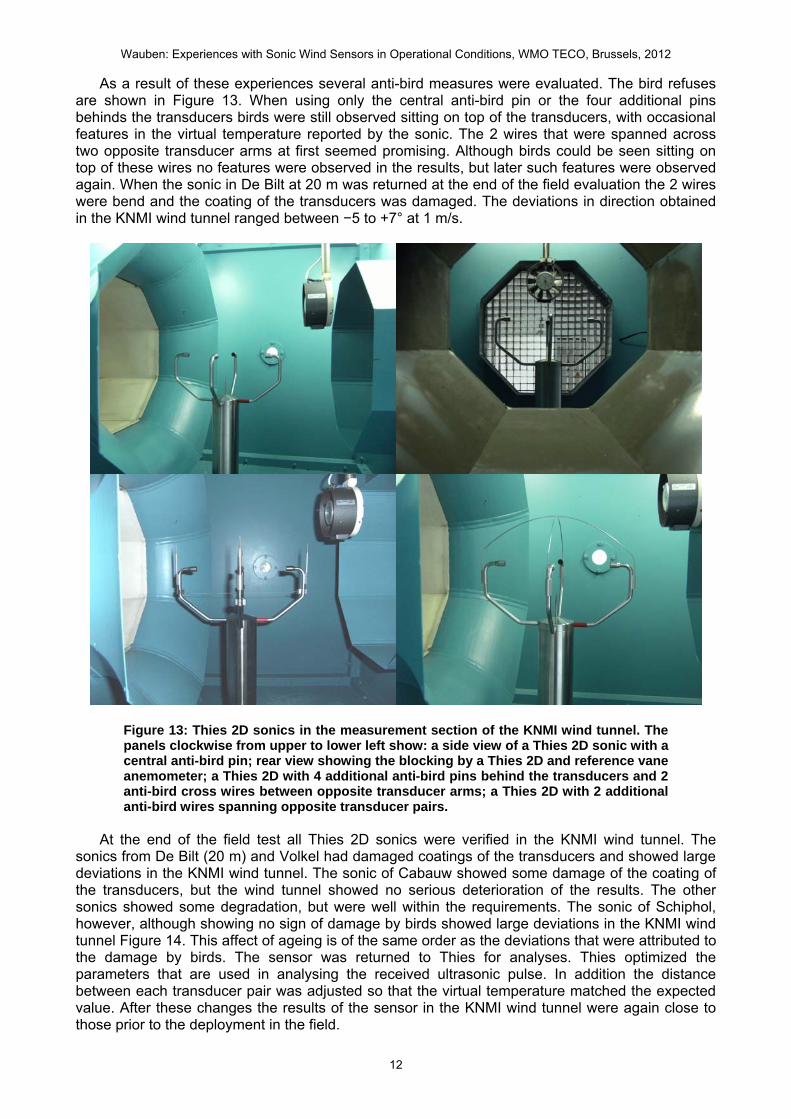
As a result of these experiences several anti-bird measures were evaluated. The bird refuses are shown in Figure 13. When using only the central anti-bird pin or the four additional pins behinds the transducers birds were still observed sitting on top of the transducers, with occasional features in the virtual temperature reported by the sonic. The 2 wires that were spanned across two opposite transducer arms at first seemed promising. Although birds could be seen sitting on top of these wires no features were observed in the results, but later such features were observed again. When the sonic in De Bilt at 20 m was returned at the end of the field evaluation the 2 wires were bend and the coating of the transducers was damaged. The deviations in direction obtained in the KNMI wind tunnel ranged between −5 to +7° at 1 m/s.
Figure 13: Thies 2D sonics in the measurement section of the KNMI wind tunnel. The panels clockwise from upper to lower left show: a side view of a Thies 2D sonic with a central anti-bird pin; rear view showing the blocking by a Thies 2D and reference vane anemometer; a Thies 2D with 4 additional anti-bird pins behind the transducers and 2 anti-bird cross wires between opposite transducer arms; a Thies 2D with 2 additional anti-bird wires spanning opposite transducer pairs.
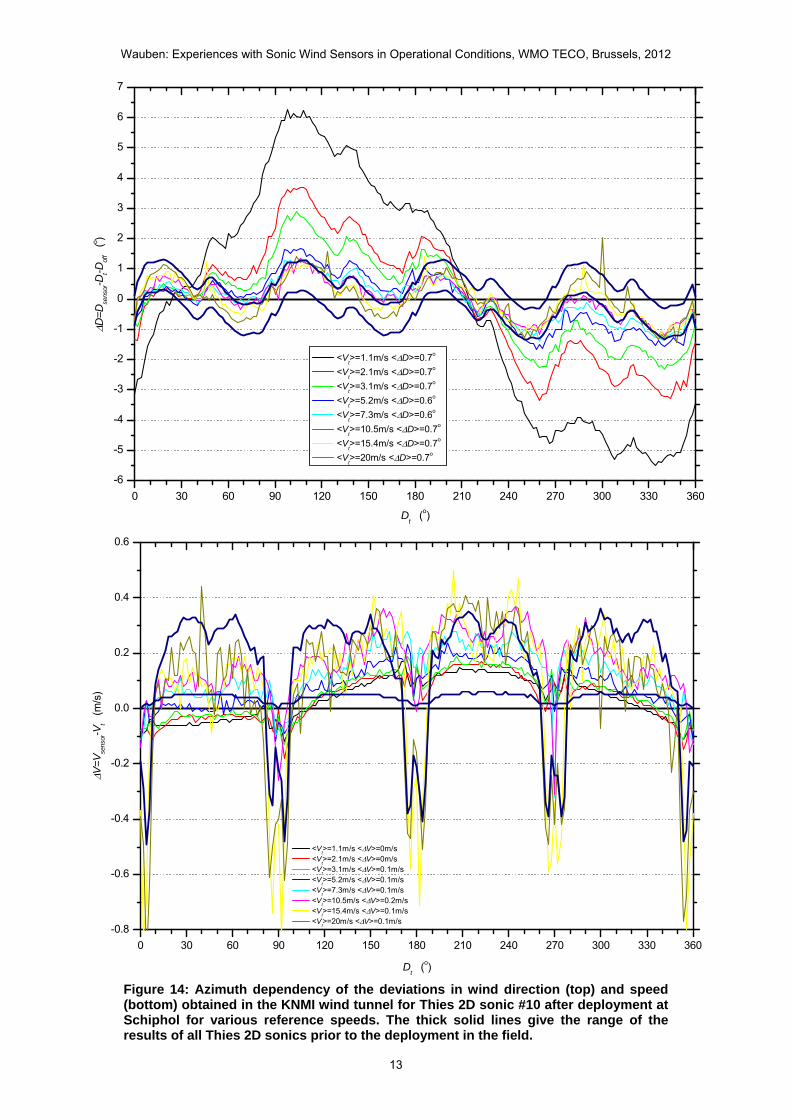
At the end of the field test all Thies 2D sonics were verified in the KNMI wind tunnel. The
sonics from De Bilt (20 m) and Volkel had damaged coatings of the transducers and showed large deviations in the KNMI wind tunnel. The sonic of Cabauw showed some damage of the coating of the transducers, but the wind tunnel showed no serious deterioration of the results. The other sonics showed some degradation, but were well within the requirements. The sonic of Schiphol, however, although showing no sign of damage by birds showed large deviations in the KNMI wind tunnel Figure 14. This affect of ageing is of the same order as the deviations that were attributed to the damage by birds. The sensor was returned to Thies for analyses. Thies optimized the parameters that are used in analysing the received ultrasonic pulse. In addition the distance between each transducer pair was adjusted so that the virtual temperature matched the expected value. After these changes the results of the sensor in the KNMI wind tunnel were again close to those prior to the deployment in the field.
Wauben: Experiences with Sonic Wind Sensors in Operational Conditions, WMO TECO, Brussels, 2012
13
0 30 60 90 120 150 180 210 240 270 300 330 360
-6
-5
-4
-3
-2
-1
0
1
2
3
4
5
6
7
<Vt>=1.1m/s <ΔD>=0.7o
<Vt>=2.1m/s <ΔD>=0.7o
<Vt>=3.1m/s <ΔD>=0.7o
<Vt>=5.2m/s <ΔD>=0.6o
<Vt>=7.3m/s <ΔD>=0.6o
<Vt>=10.5m/s <ΔD>=0.7o
<Vt>=15.4m/s <ΔD>=0.7o
<Vt>=20m/s <ΔD>=0.7o
ΔD=D
sens
or-D
t-Dof
f (
o )
Dt (o)
0 30 60 90 120 150 180 210 240 270 300 330 360
-0.8
-0.6
-0.4
-0.2
0.0
0.2
0.4
0.6
<Vt>=1.1m/s <ΔV>=0m/s
<Vt>=2.1m/s <ΔV>=0m/s
<Vt>=3.1m/s <ΔV>=0.1m/s
<Vt>=5.2m/s <ΔV>=0.1m/s
<Vt>=7.3m/s <ΔV>=0.1m/s
<Vt>=10.5m/s <ΔV>=0.2m/s
<Vt>=15.4m/s <ΔV>=0.1m/s
<Vt>=20m/s <ΔV>=0.1m/s
ΔV=
Vse
nsor-V
t (
m/s
)
Dt (o)
Figure 14: Azimuth dependency of the deviations in wind direction (top) and speed (bottom) obtained in the KNMI wind tunnel for Thies 2D sonic #10 after deployment at Schiphol for various reference speeds. The thick solid lines give the range of the results of all Thies 2D sonics prior to the deployment in the field.
Wauben: Experiences with Sonic Wind Sensors in Operational Conditions, WMO TECO, Brussels, 2012
14
4. CONCLUSIONS AND OUTLOOK
KNMI evaluated fifteen Thies 2D sonics in the field for periods of about ½ to 2½ years. Wind tunnel tests prior to the deployment in the field indicated that the sonics meet the WMO requirements for all direction and the full wind speed range up to 75 m/s. The results of all fifteen sonics showed reproducibility of wind direction within about ±0.5° for reference speeds between 1 and 20 m/s. The overall offset in direction of Thies 2D sonics ranged between ±1.2°. The reproducibility of wind speed was within about ±0.1 m/s, but only for the orientations when the wind was not parallel to a transducer pair. Deviations were typically ±0.5 m/s for orientations parallel to a transducer pair, which extends over a range of ±8° at 20 m/s. These deviations cannot completely be compensated by a sensor independent correction.
The wind speed and direction reported by the sonic during the field evaluation generally
showed very good agreement with the speed and direction reported by the KNMI cup anemometer and wind vane, respectively. However, occasionally larger deviations and even data outages for the sonics occurred during solid precipitation events. The Dutch winter conditions, although not severe, required a sonic with heating of the transducers. Furthermore, it was observed that birds disturbed or temporarily even blocked the measurement path of the sonics at some locations. This could lead to deviations in the reported wind and even data outages. Birds could even inflict damage to the sonics resulting in a permanent deterioration of the results. This deterioration showed up in wind tunnel tests, but could not easily be determined from the parallel measurements during the field evaluation. The manufacturer equipped the sonic with several types of bird refuses, but problems with birds remained at some locations.
The results for the sonics at three locations with bird inflicted damage to the transducer coating
were outside or close to the accuracy limits of WMO, particularly for wind direction at low wind speeds. The sonics of the other locations revealed only a small deterioration of the results, although some showed signs of birds. One sonic, however, showed a serious degradation of the results although there was no sign of damage by birds. Thies advised to use other parameter setting in the sonic to overcome the degradation of the results of the sonics and is currently evaluating two new bird refuses. Based on the experiences of the field evaluation KNMI decided not to replace the conventional KNMI cup anemometer and wind vane with sonic wind sensor at this moment. It can be considered again once it has been proven that the problems related to birds and aging have been solved. The sonic wind sensor should survive at least two years in the field without a significant deterioration of the results under all operational conditions and the maintenance associated with keeping the sonics in operation according to the specifications over their lifetime of 10 years or more should be economical compared to that of a cup anemometer and wind vane. Only then will the sonic wind sensor be a good and cost effective alternative for the cup anemometer and wind vane of the operational measurement network of KNMI.
5. REFERENCES
Groen, G.: Comparison of parallel wind measurement with Sonic and Cup-Vane at nine locations for climatological applications, KNMI Internal Report 2011-01, KNMI, De Bilt, 2011.
Thies: Ultrasonic Anemometer 2D, Instruction for Use 4.382x.xx.xxx, software version 3.07, Adolf Thies GmbH, Göttingen, Germany, 2008 (and later versions).
Wauben, W. M. F: Wind Tunnel and Field Test of Three 2-D Sonic Anemometers, KNMI Technical Report No. 296, KNMI, De Bilt, 2007.
WMO: Guide to Meteorological Instruments and Methods of Observation, 7th edition, WMO No. 8, Geneva, Switzerland, 2008.