experiences with defect prevention - self-conscious mind
TRANSCRIPT

Experiences with Defect Prevention
by R. G. Mays C. L. Jones G. J. Holloway D. P. Studinski
Defect Prevention is the process of improving quality and productivity by preventing the injection of defects into a product. It consists of four elements integrated into the development process: (1) causal analysis meetings to identify the root cause of defects and sug gest preventive actions; (2) an action team to imple- ment the preventive actions; (3) kickoff meetings to increase awareness of quality issues specific to each development stage; and (4) data collection and track- ing of associated data. The Defect Prevention Process has been successfully implemented in a variety of or- ganizations within ISM, some for more than six years. This paper discusses the steps needed to implement this process and the results that may be obtained. Data on quality, process costs, benefits, and practical experiences are also presented. Insights into the na- ture of programming errors and the application of this process to a variety of working environments are dis- cussed.
T o achieve quality software products, most de- velopment processes rely on defect detection
and correction through inspections, walkthroughs, and reviews early in the development cycle, and through extensive testing. However, reliance on de- tecting defects after they have been injected is costly. The detection and correction of defects does not add function to the end product. Inspections and testing are also limited in effectiveness.
A much more effective approach involves preventing defects from being injected during development. Fewer defects during development permits more re- sources to be devoted to developing new product function, and higher product quality in the field means greater customer satisfaction.
Whereas prevention is simple in concept, it was not clear at the beginning of our work on the Defect Prevention Process that software defects could be prevented. However, our experience with this proc- ess has shown that not only are defects preventable, but significant reductions in errors can be achieved with a modest investment. Software defects have identifiable causes, such as an oversight or commu- nications failure, and are preventable through im- proved processes, methodologies, techniques, and tools. A dramatic improvement in quality can be achieved through defect prevention and with it a corresponding improvement in overall productivity and customer satisfaction.
The Defect Prevention Process”z uses causal analy- sis, which is the determination of the specific cause or causes of a defect. Causal analysis is usually described in the quality control literature in terms of quality-circle activities and usually in the context of a manufacturing ~pera t ion .~-~ The causes of manu- facturing defects are analyzed using cause-effect dia- grams (also called Ishikawt or “fishbone” diagrams) and Pareto charts. Crosby, for example, describes a case history involving the use of causal analysis to prevent defects on a manufacturing line.
Copyright 1990 by International Business Machines Corporation. Copying in printed form for private use is permitted without payment of royalty provided that ( 1 ) each reproduction is done without alteration and (2) the Journal reference and IBM copyright notice are included on the first page. The title and abstract, but no other portions, of this paper may be copied or distributed royalty free without further permission by computer-based and other information-service systems. Permission to republish any other portion of this paper must be obtained from the Editor.
4 MAYS ET AL IBM SYSTEMS JOURNAL. VOL 29, NO 1, 1990
Causal analysis of software defects is practiced in a number of Japanese companies, usuqly in the con- text of quality-circle activities. Hino describes the analysis of 52 software defects by a quality circle over an 1 1-month period, resulting in an estimated 100 defects prevented. The circle members estimated that as many as 90 percent of their software defects could be prevented through improved design tech- niques and other preventive mechanisms. Similarly, Sugaya’ reports that circle members are motivated to look into the root causes of defects and propose action plans to prevent them in the next release.
Nakajo, Sasabuchi, and Akiyama’ describe a joint effort between Yokogawa Hewlett-Packard (YHP)
and Tokyo University that analyzed 523 defects from three software projects at YHP. The defects were analyzed in detail to determine both the human error causing the defect and the underlying flaws in the development process that affected the rate of human errors. The defects were analyzed in terms of a fault classification scheme, and the human errors were determined from various documents and through interviews with the developers. From this informa- tion the underlying process flaws associated with the errors were identified and a number of improve- ments to the design process were proposed.
Within IBM, causal analysis has been used in the Systems Integration Division (formerly the Federal Systems Division) on the Space Shuttle Primary Avionics Software System, the on-pgyd computer software that controls the Shuttle. Defects are analyzed to determine the cause of the error, how to prevent the error, and how to remove similar defects that may exist in the system. The primary focus of the causal analysis has been on escapes from test and inspections, and how to improve the effectiveness of both tests and inspections.
The primary difference between these approaches to causal analysis and prevention and the Defect Pre- vention Process described in this paper is the inte- gration of the defect prevention activities into the development process. With Defect Prevention, causal analysis is done by the development team during the development cycle, as each stage of de- velopment is completed, rather than by a quality circle at some later time during development. Direct causal analysis by the developer making the error results in a more accurate determination of the cause of the defect and more relevant preventive actions. In contrast to a quality circle, the preventive actions are implemented by an action team with specific
IBM SYSTEMS JOURNAL, VOL 29. NO 1. 1990
skills and authority to change the development proc- ess. In addition, systematic feedback to the devel- opers is provided by stage kickoff meetings and the status of planned preventive actions is tracked in a database.
The Defect Prevention Process discussed in this pa- per was initially developed in the IBM Communica- tions Programming Laboratory at Research Triangle Park, North Carolina, where the development of such communications products as the Virtual Tele- communications Access Method (VTAM), the Net- work Control Program (NCP), and NetView” is done. To date, Defect Prevention has been implemented in more than twenty-five organizations at seven IBM
development laboratories, involving system pro- gramming, application programming, and micro- code development. The process has been adopted as part of a c2rporate-level Programming Process Ar- chitecture. It is also taught in two internal courses offered by IBM Corporate Technical Education. These courses have now been presented at practically every major software development laboratory within the company.
In this paper, we summarize the Defect Prevention Process and discuss our experiences with it, including observed quality improvements, costs and benefits of the process, and observations on the nature of programming errors and preventive actions. As De- fect Prevention has been implemented in different organizations and in different laboratories, it has been adapted, adjusted, and enhanced. Several ad- aptations and enhancements were ma$: at the Myers Corners Laboratory in Poughkeepsie, for example. This paper describes the Defect Prevention Process in a generalized form.
Throughout the paper we use the terms defect and error interchangeably. A defect is also referred to in the literature as a program fault, and refers to a flaw or problem within the software. An error refers to the underlying cause of the defect. The term “error” implies a mistake that the developer has made. In our experience, the cause of most defects can be traced to human error.
The Defect Prevention Process
In the Defect Prevention Process, the various activi- ties of Defect Prevention are integrated into the development process. Causal analysis meetings and stage kickoff meetings become part of each devel- oper’s day-to-day activities, much like inspections and reviews.

Figure 1 Causal analysis meeting
I PREVENTIVE SUGGESTED
ACTIONS
In this section we describe the application of Defect Prevention in a software development organization, involving causal analysis, the action team, and stage kickoff meetings. The application of the process in a test organization, in information development, and in other areas is described at the end of the section.
Causal analysis meetings. The software development process is divided into a number of design, devel- opment, and test stages, such as requirements and planning, product-level design, component-level de- sign, and code and unit test. '* Programmers generally work together in teams to develop a portion of the product release. At the end of each stage, an inspec- tion, review, or other validation is conducted in which defects are detected.
Once the defects from a stage have been corrected, a meeting that we term a causal analysis meeting, usually two hours in length, is held. The process is illustrated in Figure 1. The development team mem- bers review the defects, determine the root cause of the programmer errors, and propose actions to help prevent such errors in the future.
For each defect, the following questions are posed:
What is the category of cause of the error-com- munication, oversight, education, or transcrip- tion?
How was the error introduced or caused? At what stage was the error created or injected? How can we prevent this error in the future? How can similar defects be detected and removed from other parts of the product?
The causal analysis meeting is led by a person from product development who has been trained as a causal analysis leader. A chalkboard is used that is divided into columns for the defect number, defect abstract, cause category, cause abstract, process stage where the defect was created, and suggested preven- tive actions. A paper form is also used to record the information written on the board.
The emphasis of the meeting is on gathering preven- tive suggestions. The leader keeps the meeting mov- ing and not bogged down in details about a defect or cause, unless these details lead to better suggested actions. If some information is unknown (for ex- ample, the defect's cause), the leader may skip that column. The leader may even decide to skip an entire defect if it does not appear that any meaningful actions will result. Of course, some defects will pro- duce no suggested actions.
During the last half-hour of the meeting, the causal analysis leader directs the team to take a broader view of the defects and of the stage that the team just completed. The following are typical questions that can be asked at this point:
6 MAYS ET AL IBM SYSTEMS JOURNAL, VOL 29, NO 1, 1990

Is there a trend in the errors that indicates a broader problem? Are there additional suggestions to address such a trend? What went right during this last development stage? What saved time? Can suggestions be made to help other teams? What went wrong during the latter stage? What wasted time? Can any suggestions be made to prevent or avoid these problems? How can we improve our defect-detection meth- ods, tools, communications, education, etc.?
B
Often this discussion portion of the meeting pro- duces the most important suggestions. After the
A critical element of the process is the action team whose purpose is
to ensure that preventive actions are implemented.
b meeting, the causal analysis leader records the data from the meeting (suggested actions, defects, and causes) in an action database for subsequent report- ing and tracking.
The team leader may call a causal analysis meeting before the development stage is over, when enough errors have been collected for a meeting, usually around twenty. Repeated causal analysis meetings may be held, especially during the test stages. Such interim causal analysis meetings allow immediate feedback to the team to help them prevent additional errors, as the stage progresses.
b The involvement of the developers who originated the errors is critical, because the developer who created the error is the best person to identify its cause. Also, both the developer and the other team members receive direct feedback about the errors made. This direct feedback has a significant effect in preventing similar errors by that team in the future.
It is also important to have everyone in the team present for causal analysis because a synergism of
B IBM SYSTEMS JOURNAL, VOL 29, NO 1, 1990
ideas results from the group as a whole. It is typical that preventive suggestions come from team mem- bers other than the person who made the error. Some portion of everyone’s defects should be analyzed. If someone had no defects during a particular stage, that person will likely be able to contribute signifi- cant ideas toward preventing future errors. That developer’s ideas naturally have the respect of the other team members.
The action team. A critical element of the process is the action team whose purpose is to ensure that preventive actions are implemented. The action team is illustrated in Figure 2 and consists of people from the area who work part-time as action team members.
The action team typically serves an entire product development organization. Depending on the size of the organization, the team may be smaller or larger. For example, the action team for a small develop- ment organization of 20 to 50 people might have three or four members, whereas the action team for an organization of 200 to 250 people might have eight to ten members. The scope of the action team should encompass the entire development organiza- tion or that portion of a large organization that shares the same development process. For a product devel- opment area, a systems test organization, and an information development organization, three sepa- rate action teams would probably be required. In a very large product area, several action teams might be formed to serve thy3different second-line devel- opment organizations.
The action team members each serve in a role on the team. One member might have responsibility for process definition and documentation, another for tool requirements and implementation, another for education. Others represent design, development, and test. A manager also serves on the action team to handle actions that require communication with other managers in the organization or negotiations with other organizations. Each team member is re- sponsible for ensuring that the actions assigned to him or her are implemented, either by doing the work directly or by reassigning it to someone else in the organization.
The action team meets regularly to review the new actions that have been proposed, to decide which ones are to be implemented and how to implement them, to assign the new actions, and to discuss the status of actions that are currently open. Closed
MAYS ET AL 7

t I
TOOLS PRODUCT CHANGES
TECHNICAL CLASSES NEWSLETTERS AWARDS, RECOGNITION
I ACTION TEAM
/ /” REPORTS
ACTION TEAM I. -
IMPLEMENTED ACTIONS
ACTION STATUS CHANGES
PROCESS DOCUMENTATION CHANGES COMMON ERROR LISTS CHECKLISTS, GUIDELINES TEMPLATES TECHNICAL WRITE-UPS
actions are also reviewed to ensure that the work has been properly completed.
An action team for a large product area (1 50 to 200 persons) may handle several hundred actions each year. An action database and the supporting data- collection tool are essential to keep track of the open actions. The action team uses reports from the action database to guide their meetings. Listings of the new actions and open actions are printed out prior to each meeting. Changes in action status, including the new action assignments, are entered after the meeting.
Preventive actions fall into several categories:
Process improvements, refinements, or documenta- tion are actions that improve existing processes, de- fine new processes, or improve process documenta- tion. Such actions might modify the design change process, define a new test-error fix process, or add new items to a common error list or checklist.
Tools are actions that develop new tools or enhance existing tools that support the process. This might include writing a tool to trace save area utilization or adding a new check to the module checker tool.
Education actions improve knowledge about prod- uct and nonproduct-related technical areas. Educa- tion might include such things as developing a class
8 MAYS ET AL IBM SYSTEMS JOURNAL, VOL 29. NO 1. 1990

in hardware subtleties, organizing a seminar series on the components of the product, preparing a tech- nical write-up on a complex aspect of the product, and writing a newsle’ter article on repetitive errors.
Product changes are actions to improve the product so that developing and enhancing it are less error prone. This might include improving documentation of product macros, implementing a design change to improve an internal interface, and rewriting an error- prone part of the product.
Communications improvements are actions that im- prove communications procedures within the prod- uct organization or with other organizations. Here we think of implementing the automated notifica- tion of design changes to all interested parties, ap- pointing a liaison or focal point to handle commu- nication with another organization, and holding weekly team technical meetings.
Many actions require saving documentation and information for on-line access by people in the prod- uct organization. These materials are placed in re- positories, that is, on-line files that can be accessed by everyone in the area. These materials might in- clude the documentation of the area’s process, pro- cedures, and methodologies, product technical write- ups and documentation, common error lists, inspec- tion checklists, coding guidelines, performance guidelines, a checklist for new-hire education, project management guidelines, and tools documentation. Usually there is so much information that an index is also required.
Not all suggested actions are implemented. The ac- tion team may decide that an idea is not cost justi- fied; it may be deemed impractical or simply a bad idea. A suggestion might fall outside the scope of the team. Also, an action may already have been imple- mented or may duplicate a suggestion already re- ceived. When an action is rejected, the rationale for rejection is documented and the suggester is notified. However, the suggester may request the action team to reconsider a rejected action.
The action team is involved in a number of activities in addition to actual implementation of actions. Usually a preliminary investigation of the action must be done so that all of the relevant aspects of the action are understood. The action team member will typically assign a priority to the action so that it is clear which actions of those assigned should be addressed first.
IBM SYSTEMS JOURNAL, VOL 29, NO 1, 1990
Sometimes an action team member does not have the knowledge to implement an action. The member then asks an appropriate person in the organization to implement the action. A negotiation with the
The action team is involved in feedback to the organization.
person’s manager may be required to allocate time for implementation. The action team member con- tinues to have responsibility to see that the action is implemented and follows up with the implementer until the item is closed.
The action team is also involved in feedback to the organization. Product developers must understand that their suggestions are taken seriously and that they are implemented. An action is not considered finished until there is some form of feedback to the product area about its completion. Feedback on completed actions may be done, for example, through newsletter articles, on-line news bulletins, or at area meetings. In some product areas, informal awards are presented at periodic area meetings to people who have made significant contributions to defect prevention, either in terms of effective sugges- tions or implementation of actions.
The action team also reports on the status of its activities to management. These reports may include such items as statistics on defect distribution by cause, action distribution by action category, cost of the process in terms of causal analysis meetings, kickoff meetings, action team meetings and action implementation, and total projected cost of actions left to be implemented. This kind of information may also be presented at area meetings.
Stage kickoff meetings. Stage kickoff meetings are used at the beginning of each development stage to prepare the development team for the work of the stage. The place of the stage kickoff meeting as the primary means of feedback for the Defect Prevention
MAYS ET AL 9

Figure 3 Stage kickoff meeting
FEEDBACK AT START OF STAGE
KICKOFF PACKAGE FOR STAGE
TOOLS PRODUCT CHANEiES
TECHNCAL CLASSES
AWARDS, RECOGNITION NEWSLETTERS
t
PROCESS DOCUMENTATON CHAN(3ES
CHECKLISTS, GUIDELINES COMMON ERROR LISTS
TEMPLATES TECHNICAL WRITE-UPS
Process is shown in Figure 3. The information pre- sented during the kickoff is updated by the action team as actions are implemented.
Kickoff meetings typically take one to two hours and are led by the technical team leader, who is some- times called the chief programmer. The emphasis in the meeting is on technical aspects of the develop- ment process and on quality. Information presented during the meeting includes:
A description of the process for this stage, includ- ing specific procedures, methodologies, tech- niques, tools, guidelines, conventions, checklists, etc. The inputs available for this stage Examples of outputs that should be produced Validation methods that will be used (e.g., inspec-
The common error list, a list of the errors com- tions, reviews)
monly created during this stage
10 MAYS ET AL IBM SYSTEMS JOURNAL, VOL 29. NO 1, 1990

The team assignments The schedule that will be followed
The process description, procedures, and methodol- ogies for the stage are reviewed. Portions of the process document may even be read, word for word. This serves to educate the team, if they have never read the process, or to re-educate the team periodi- cally and to point out recent revisions to the process. The process is thus repeatedly reinforced in the team.
B
Reviewing the common error list is important for preventing errors.
Il
Because of the constant improvements through causal analysis and the review and discussion during kickoffs, the process document is an active docu- ment, representing the actual process used by the organization.
The inputs to the stage (e.g., the design document) are reviewed so that concerns may be raised about their completeness, for example. Samples of outputs of the stage may also be presented so that the team understands the kinds of outputs required for that stage. For example, the team might review what the appropriate level of detail is for the design stage.
Reviewing the common error list for the stage is important for preventing errors. The list contains brief descriptions-sometimes with examples-of errors that have been identified during causal analy- sis as chronic and repeating. (See Appendix A for a sample common error list.) A review of the list serves as a reminder to the developers and reduces the probability of making these errors.
Some development projects are not organized into specific teams, for example, when developers work individually on separate parts of the product. In such cases, developers whose development schedules rea- sonably coincide can be formed into ad hoc teams which then conduct stage kickoff meetings, inspec- tions, and causal analysis together. Other developers,
b
B
1 IBM SYSTEMS JOURNAL, VOL 29, NO 1, 1990
for example, who develop fixes for field errors do not follow distinct, development stages, and a stage kick- off meeting is not relevant. Such developers should participate in periodic process reviews, occurring perhaps every three or four months, instead of stage kickoffs to reinforce their knowledge of the process, procedures, and common errors, and to learn of recent process revisions.
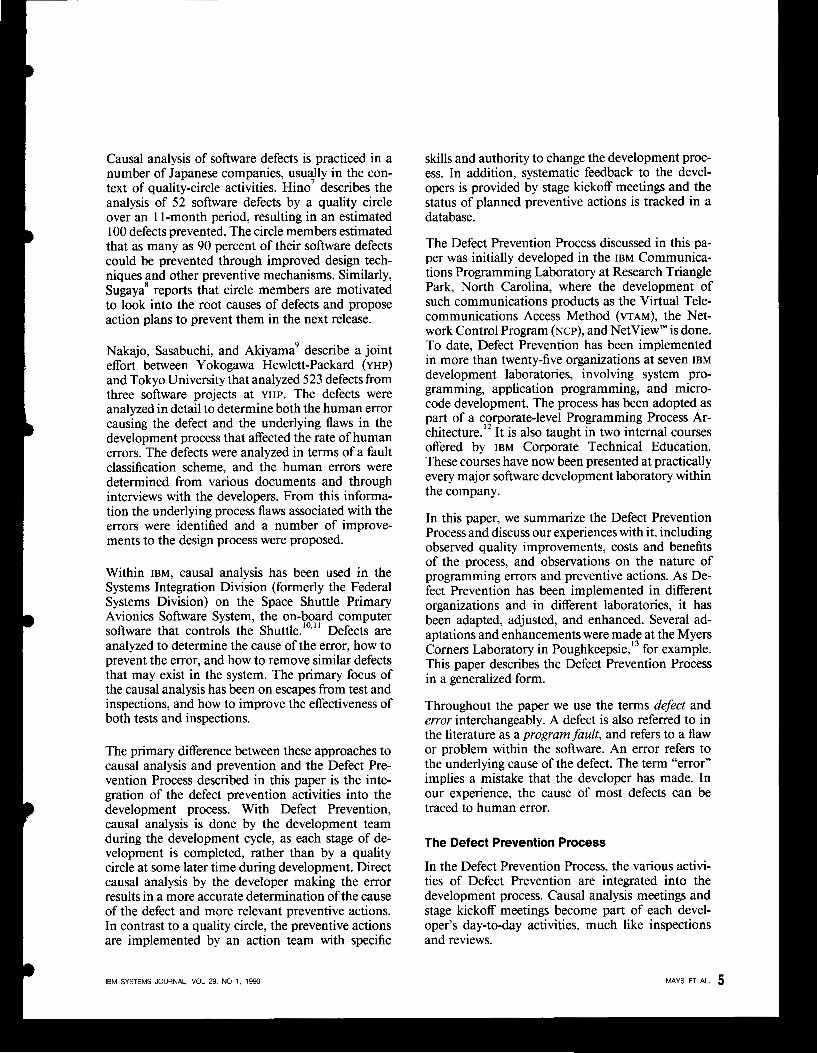
Additional aspects of the process. Field errors or Authorized Program Analysis Reports (APARS) are reported continuously and thus do not fit a devel- opment stage. Special APAR causal analysis meetings are held by the department with responsibility for the component where the APAR defect occurred, as shown in Figure 4. The causal analysis meetings are held whenever ten to twenty APARS have been re- ceived.
During causal analysis, the cause of the APAR may not be accurately determined for a variety of reasons. Nevertheless, good preventive suggestions can still be made. Developers doing APAR causal analysis can sometimes become bogged down in trying to under- stand the details of a problem. Provided the team remembers not to spend excessive time on each APAR
problem, APAR causal analysis proceeds like other causal analysis meetings.
In organizations that have followed the Defect Pre- vention Process, developers begin to make miscella- neous suggestions for improvements outside a causal analysis meeting. Developers typically suggest new tools or tool enhancements, and these suggestions are handled by the action team along with the sug- gestions from causal analysis.
The Defect Prevention Process involves everyone in the development organization over time, as shown in Figure 5. Developers follow the cycle of stage kickoff (KO) meeting, work, inspection or review, and causal analysis (CA) meeting for each stage of product development. The action team (AT) meets usually every two weeks to assign the new suggestions and to report to the rest of the team on the progress of actions being worked on.
If the action team can implement its actions quickly, later teams in a development project will benefit from earlier teams’ experiences. A later development team in its kickoff meeting will be able to review process improvements and common errors that ear- lier teams suggested in their causal analysis. Consider Team 3 in Figure 5. That team can learn information
MAYS ET AL 11
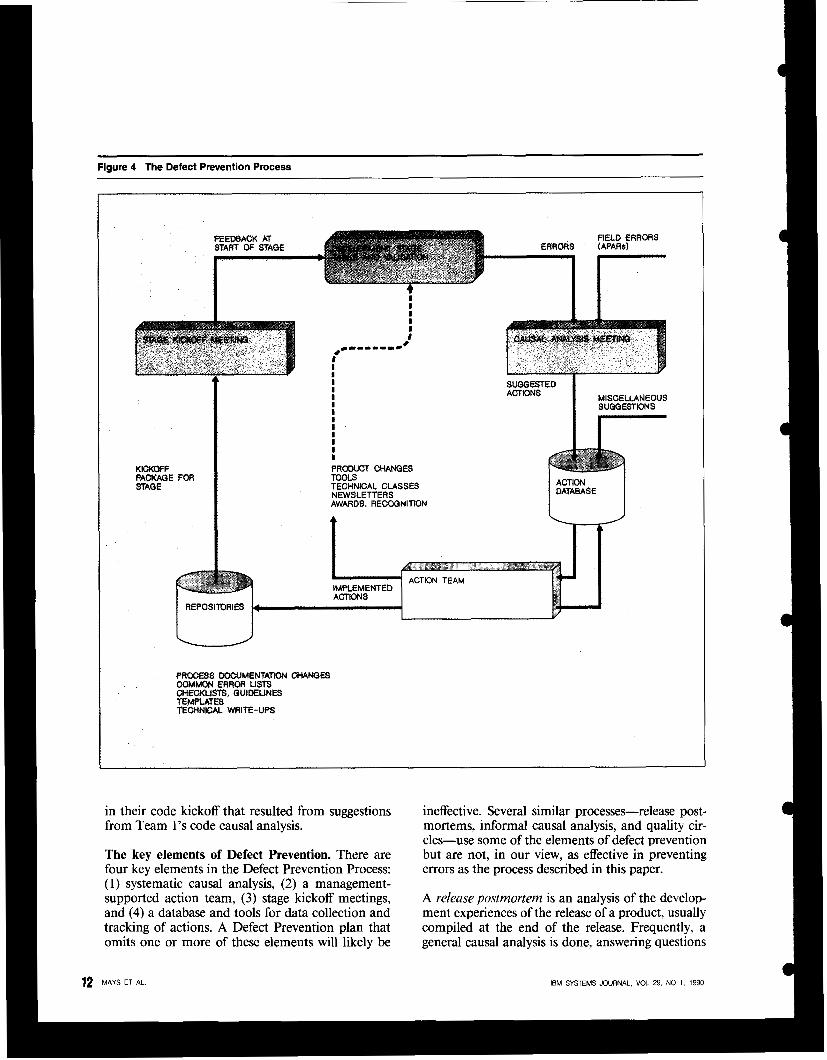
Figure 4 The Defect Prevention Process
KICKOFF PACKAGE FOR STAGE
FE 51:
FIELD ERRORS W A R S )
r
L REPOSITORIES
I I
!
PRODUCT CHiU’JQES TOOLS TECHNICAL CLASSES NEWSLETTERS AWARDS. RECCGNITION
SUGGESTED ACTtONS I SUGGESTIONS
MISCELLANEOUS
4 i
PROCESS WCUMENTATDN CHANGES COMMON ERROR LISTS CHECKLISTS, OUIDEUNES TEMPLATES TECHNICAL WRITE-UPS
in their code kickoff that resulted from suggestions from Team 1’s code causal analysis.
The key elements of Defect Prevention. There are four key elements in the Defect Prevention Process: (1) systematic causal analysis, (2) a management- supported action team, (3) stage kickoff meetings, and (4) a database and tools for data collection and tracking of actions. A Defect Prevention plan that omits one or more of these elements will likely be
ineffective. Several similar processes-release post- mortems, informal causal analysis, and quality cir- cles-use some of the elements of defect prevention but are not, in our view, as effective in preventing errors as the process described in this paper.
A release postmortem is an analysis of the develop- ment experiences of the release of a product, usually compiled at the end of the release. Frequently, a general causal analysis is done, answering questions
12 MAYS ET AL IBM SYSTEMS JOURNAL, VOL 29. NO 1. 1990

such as “What difficulties did we encounter during the release? How can we avoid them in subsequent development projects? What activities improved our process? How can we make them permanent?” There are several differences between postmortems and the Defect Prevention Process. Postmortems are typi- cally done after the release has been completed, with the result that any suggestions for improvement are delayed at least until the next development project. The causal analysis in a postmortem does not ana- lyze specific defects but is more general. Suggestions for improvements that address specific types of errors are frequently overlooked. Recommendations for improvement are frequently lost in the subsequent activity of the next project or in reorganizations that
may follow the completion of the project. Usually no formal mechanism exists to ensure that recom- mendations are implemented.
The causal analysis meetings described in this paper are in effect minipostmortems performed by each team at the end of each development stage. They focus on a sampling of specific errors and their causes. With the use of an action team and a database of suggested actions in the Defect Prevention Proc- ess, the shortcomings of the postmortem process are overcome.
Informal causal analysis is sometimes done by a developer to gain insight into the causes of errors
~ ~
Figure 5 Defect Prevention time line ~ ____ ~~~~
MONTH
TEAM 1
TEAM 2
TEAM 3
TEAM 4
ACTIW TEAM MEETINQS
KO - KICKOFF CA - CAUSAL ANALYSIS AT * ACTION TEAM
IBM SYSTEMS JOURNAL, VOL 29. NO 1, 1990

and to suggest preventive actions. The results of this sort of work can be very beneficial. However, this approach has several difficulties. Frequently the analysis is done long after the defects have been created (typically after all tests have completed) so that improvements are delayed. The defect causal analysis is done by someone other than the devel- opers who created the defects, with the result that the analyst must guess the cause of the defect. As with postmortems, there is usually no formal mech- anism to ensure that the recommendations have been implemented. The developer doing the causal analysis may be shifted to “more productive” work, effectively ending the opportunity to improve the process.
A quality circle or quality improvement team”5,‘4 is a group of developers, usually members of the same department, who meet regularly to discuss problems and ways of overcoming them. Quality circles fre- quently undertake to implement improvements in their work practices, tools, and process. As part of their activities a quality circle may do causal analysis and implement the suggestions. As with postmor- tems and informal causal analysis, any activity that eliminates the underlying causes of errors is benefi- cial. However, quality circles frequently have short- comings that inhibit their effectiveness.
Quality circles usually do not do causal analysis of specific defects but rather pursue problems that are perceived by the circle to be the most important. This practice tends to ignore the many defects that are created regularly, while ultimately leading ironi- cally to the perception that the circle has run out of things to work on. A quality circle is frequently limited to changing what its members are able to change. Thus a major process change affecting the entire development organization or a large tool de- velopment project would probably not be under- taken. The implementation of improvements is usu- ally done on the members’ own time. Management “funding” for quality-circle improvement activities is usually inconsistent and may evaporate over time.
Despite these shortcomings, quality circles can be used very effectively to complement the Defect Pre- vention Process. A quality circle can, for example, take on the task of doing periodic APAR causal analy- sis. In addition, the action team may request a quality circle to implement a specific action, such as writing a summary of a technical topic. In any case, quality circles should be encouraged wherever they continue to be effective.
14 MAYS ET AL
Defect Prevention in test and other organizations. Thus far we have described the operation of the
Defect Prevention has also been effective in test and other
organizations.
Defect Prevention Process for a software develop- ment organization. Defect Prevention has also been effective in test and other organizations. Each differ- ent organization uses different processes and creates different kinds of errors. Defect Prevention can be applied to the errors arising from each particular process.
The test process usually has three major steps that are taken for each test: test planning, which defines the people, hardware and tool requirements, and the schedules for the test; test preparation, which devel- ops and documents the detailed test cases (also called test scenarios); and test execution, which involves the actual execution of the test cases and correction of the problems found. When Defect Prevention is applied to test, the basic four elements of the process are followed. The major types of errors that are analyzed in test are:
Test-planning and test-case errors-for example, required hardware is missing from the planned hardware configuration, or a test case fails to test an important product function Build and test-environment errors-for example, the test product had the wrong level of a module, data sets needed for the test were missing or had the wrong name Test-execution errors-sometimes called user er- rors, these are errors made by the tester in setting up the test or in interpreting the results-for ex- ample, the tester entered the input commands incorrectly or interpreted the presence of an error message as a problem Duplicate errors- failure to recognize that a prod- uct defect manifesting a certain symptom is really a duplicate of another error that was found earlier, possibly with different symptoms (duplicate errors
IBM SYSTEMS JOURNAL, VOL 29, NO 1, 1990

D
are analyzed from the perspective of “Could we have recognized this error as a duplicate of the previous error?” and “What can we do to identify duplicates of this type in the future?”) Recreate requests-a request to recreate a program problem because not enough information was col- lected when the first failure occurred to permit problem diagnosis (recreate requests are analyzed from the perspective of “What caused our failure to collect the needed information?” and “What diagnostic tools would help collect the required information or permit accurate first-failure data capture?”) Test escapes-product defects that a particular test failed to find but which were found in a later test or by a customer (test escapes are product defects
D
Product planners (persons who specify new product requirements and formulate product development plans) analyze errors and plan changes that have occurred in the requirements and planning process. These errors include incomplete or erroneous re- quirements, late requirements, changes in product or market strategy, errors in estimating release size, and difficulties in project management. The root
The process is also applicable outside software development.
but are analyzed from the perspective of “Should the test have caught this error?”; “Why was the error not caught?”; and “What can we do to catch this sort of error in the future?”) D
Since the test organization analyzes product errors as test escapes, a given field error (APAR) can be analyzed multiple times, both from the developer’s perspective (“Why was the error first introduced?”) as well as from the test perspective (“Why did it get through the target test?”).
Information developers (programmers who develop product manuals and related documentation) ana- lyze errors in their books. The errors can be mani- fested during inspections or reviews of various book drafts, testing, or from field errors (documentation APARS) and reader comments. Other errors that occur during the planning stage or during production of books can also be analyzed and prevented.
Software service programmers (those who diagnose customer problems and develop fixes for APARS)
analyze errors that result in bad APAR fixes. As with product developers, the root cause of the program- ming error is examined. Other errors from the service perspective include test escapes, those occurring in the fix packaging and in the install process, and those
6
D in diagnosing customer problems.
Human factors specialists (persons who analyze, test, and improve product usability characteristics) ana- lyze customer user errors, that is, difficulties cus- tomers have had using our products. Frequently these problems are caused by usability problems in the product. The analysis results in suggestions for product usability improvements that are then in- cluded in subsequent product release plans.
cause of the error is determined, and actions for improving the process or anticipating changes earlier are implemented.
Our experience with the Defect Prevention Process shows that it is widely applicable to different proc- esses and organizations involved in software devel- opment. Moreover, the process is also appljcable outside software development, for example, to man- agement practices, hardware design, hardware devel- opment, and manufacturing.
Management’s role in Defect Prevention. Even though the Defect Prevention Process emphasizes the direct involvement of developers in improving the development process, management’s role is crit- ical too. We see this role as being a fourfold one:
Support and encourage the Defect Prevention ac-
Allocate the resources needed for the action team Authorize the action team to improve the devel- opment process as needed to achieve prevention Monitor the results of the Defect Prevention Proc- ess to ensure its continued effectiveness
tivities
A manager serves on the action team and is key to its success. This team member provides management focus on such actions as communicating issues to other managers in the organization, negotiating with other managers for the use of someone’s services to implement an action, and negotiating with other organizations. Because the action team is drawn

Figure 6 Defect rate comparison
1
// I PER THOUSAND LINES A DEFECTS
// I OF CODE
,/ I
/ /- / , / / / /
~"""""-L""""-~"""""-~"-""""~"""""-~
CLD MLD CODE UT/FVT PVTISVT
DEVELOPMENT STAGE
CLD COMPONENT-LEVEL DESIGN FVT = FUNCTION VERIFICATION TEST MLD = MODULE-LEVEL DESIGN UT = UNIT TEST
PVT = PRODUCT VERIFICATION TEST SVT - SYSTEM VERIFICATION TEST
from many different areas of the organization, the team members would not be expected to report to the action team manager. The team manager may or may not direct the action team's activities. Fre- quently it is the process representative who chairs the action team meetings and coordinates the team's activities.
We recommend that managers not participate di- rectly in causal analysis meetings because the pres- ence of the developers' manager is sometimes viewed as inhibiting the free discussion of errors. A similar rationale was cited by Michael Fag$? in regard to management use of inspection data. On the other hand, managers may choose to conduct their own causal analysis to evaluate problem areas in their own work.
Benefits and costs of Defect Prevention
In this section we describe the benefits of the Defect Prevention Process, including quality and process improvements, and the costs of implementing the process.
Defect rates during development. The role of Defect Prevention in reducing defects introduced during development has been a significant one. One product was studied in detail. Historical data are available for eight releases of this product prior to the intro- duction of the Defect Prevention Process, which was introduced fully during two recent releases. Defect rates experienced during development are compared graphically in Figure 6 and are listed in Table 1. All of the numbers represent defects per thousand lines
16 MAYS ET At IBM SYSTEMS JOURNAL, VOL 29, NO 1, 1990

of new and changed source instructions (KLOC) that were discovered in inspections, reviews, and testing in each development stage. The data for unit test and function verification test and those for product verification and system verification test have been combined, because some of the earlier releases did not perform these tests separately. To date we have seen a 54 percent reduction in defects during the development cycle over history.
There are significant differences in the way lines of code are counted in the industry. For example, does one count macro expansions or comments? The method used with the product being discussed results in line of code counts lower than and error rates correspondingly higher than those cited by others in the industry. What is important is not the absolute defect rate but rather the relative improvement in the defect rate experienced by this product.
The historical data are summarized in Table 1. The defect rates shown are the weighted means of the data for the eight releases, and the standard deviation is a weighted standard deviation. In the two recent releases, error data for each development team in each stage were collected. The size of each team's
code is given. For some teams, the module-level design (MLD) stage was combined with the code stage (indicated by n/a in the MLD column). The test stage results have been combined to maintain consistency with the historical data.
Teams A to D represent one release (28KLOC) and teams E to J represent the other (36.3KLOC). The product verification and system verification tests (PVTlSvT) for the second release have not completed, as of this writing. The differences between history and Teams A to J for the individual stages and the overall defect rate were analyzed using the Student t-test. The overall difference and the differences for MLD through PVTISVT are significant (p < 0.05). The difference for the component-level design (CLD) stage is not significant because of the large variability in the historical data which have a mean of 7.9 and a standard deviation of 8.4.
There are clear differences among the various teams, which are due to such individual differences in the team members as level of experience and knowledge of the product. There are also differences in com- plexity of the function being developed. Team D, for example, had relatively higher defect rates compared
Table 1 Defect rates, historical and with the Defect Prevention Process, per thousand lines of code (KLOC)
Historical Defect Rates for N = 8 Releases
Product Unit Test/ Verification
Component- Module- Function TestlSystem Level Level Verification Verification
Design Design Test Test Weightzd mean (CLD) (MLD) CODE (UT/FVT) (PVr/SVr) TOTAL
Standard deviation ( N = 8) 7.9 18.6 20.8 17.4 3.3 68.0 Total size = 125.4K 8.4 9.7 6.0 5.5 1.4 23.3
Using Defect Prevention Process
SIZE TEAM A 8.7K TEAM B 4.2K TEAM C 8.OK TEAM D 7.1K TEAM E 9.3K TEAM F TEAM G
7.6K
TEAM H 6.8K
10.1K TEAM I 1.2K TEAM J 1.3K
Weighted mean Total size = 64.3K Percent reduction over history Significant ( p < 0.05)
CLD
3.0 1.9 0.4 8.6 8.2 2.9 2.4 2.5 1.7 0.0 3.7
53% no
-
MLD 10.7
n/a 2.0 9.2 3.7
n/a nla 14.8 1.3
6.9
63%
Yes
- n/a
CODE 7.0 7.4 7.0
14.4 15.5 9.7
17.8 13.4 5.0 3.1
11.4
45%
-
yes
UT/FVT PVr/SVr TOTAL 10.5 1.8 12.1 9.3 9.2 4.4 6.8 8.8 5.1 9.2
- 0.8 8.7 1.8 32.5
- -
IEM SYSTEMS JOURNAL, VOL 29, NO 1. 1990 MAYS ET AL 17

Table 2 Total cost of the process in 1987
Produel 1 Product 2
Cost of Defect Prevention 0.82 0.86
Total size of organization 227 187
Percent of total resources 0.4% 0.5%
(Penon years)
(People)
with Teams A to C. Their product function was particularly complex, involving complex timing sit- uations in a part of the product that team members had little experience with. In addition, the expert in that component was not readily available to answer questions.
The field defect rate for the first release for Teams A to D can only be projected at this point. However, the number of field defects (total valid unique APARS)
that have occurred since the release was made avail- able to customers is tracking at a level that represents a reduction of 60 percent compared to the field defect rates of the eight prior releases.
One might argue that the observed reductions in error rates are due to other factors. For example, a reduction in error rate might be due to a reduction in the effectiveness of defect detection activities, such as inspections, reviews, and testing. This is not valid in the case of these releases for two reasons: (1) The effectiveness of inspections, reviews, and tests as determined by such other measures as inspection preparation time, inspection rates, and test coverage appears to be at least as good as the historical releases. (2) The error reductions persist throughout the re- lease and into the field.
We are confident that the error reductions we have observed are caused by fewer defects injected during development, as a consequence of the practice of the Defect Prevention Process. No clear trend toward continued cumulative error reductions can be ob- served in this small sample of team results. Nonethe- less, we believe that further reductions in defect rates will be experienced as the cumulative effects of con- stant improvements occur over time.
Costs and direct savings to the organization. The costs of the Defect Prevention Process come from the different activities of the process. The following cost figures are typical of a software development organization:
18 MAYS ET AL
Stage kickoff meetings- 1 to 2 hours per team per stage, where a team comprises typically 3 to 7 persons Causal analysis meetings-2 hours per meeting, usually with 1 to 2 meetings per team per stage. There is typically 0.5 to 1 hour of data-entry time required by the causal analysis leader at the end of the meeting Action team meetings-require 1 to 2 hours every other week Action implementation-usually averages about 24 person hours per action. The average time spent by action team members is approximately 10 per- cent of their time.
Two product areas have kept detailed data on the number of hours spent in each of these activities. The average costs of each activity, in person hours, for the two products are shown in Figure 7. The major difference between the two products is in the average cost of action implementation, which is about 16 versus 42 person hours per action. This cost varies from product area to product area, de- pending on the level of sophistication and maturity of the area’s process. In the case of Product 2, considerably more effort was spent on tools actions than in Product 1, which accounts for the difference shown.
The total cost of the process for both product areas in 1987, including action implementation, is given in Table 2. For both areas, causal analysis was done on only about a third of the defects. At these levels of effort, a product area of 150 to 200 people can expect to spend less than one person year per year on Defect Prevention, or about one-half percent of the area’s resources.
An analysis of cost savings for a typical product area identified the following factors where savings will be realized:
Less developer efort is required to fix design and code errors found in inspections; inspections also take less time when there are fewer errors. Less developer efort is necessary to investigate test errors, analyze diagnostic materials, code fixes, inspect and unit test fixes, integrate fixes, and answer problems. Less test efort is needed to investigate problems, prepare diagnostic materials such as dumps and traces, analyze and write up the problems, recreate the problems as necessary, and rerun the tests after the fix has been applied.
IBM SYSTEMS JOURNAL, VOL 29, NO 1, 1990

Figure 7 Cost of Defect Prevention activities
KGKOFF MEETING
I I I
I !
CAUSAL ANALYSIS MEETINQ
T M ACTION
MEETING
ACTION IMPLEMENTATION
I I I I I I I I I I I I
"_" T - 1-
I I I I I I I I I I I I I I I I I I I I I I I I I I I I I I I I I I I I I I I I I I I I I I I I I I I I I I I I I I I I I I
I I
I I I I I I
I I I
I I I I I I
I I I I I I I I I
42.4
I I I I I I I I I I I I I I I I
I I
0 I 5
I 10
I 15
I 20
I 25
I 30
I 35 40
PERSON HOURS
I I
I I
I I I I I I I I I I I I I I I I I
1 45
Less time is wasted when a test is blocked because of unresolved product defects.
An estimate was made of the savings from the first two factors only. Assuming a 50 percent reduction in errors throughout the development cycle, taking into account the cost of fixing errors from inspections and during tests, the total savings in developer time would be at least 2.2 person years. Given a cost for all Defect Prevention activities of about 0.85 person years per year, this represents a net savings of more than 1.3 person years per year. This is the direct savings that a development area would receive from this process. Savings in tester effort, from the other two factors, would be additional. In addition to quantitative quality improvements, we have noticed a number of positive secondary effects in organiza- tions that follow this process. These effects have included process impacts, improved team commu- nications and increased quality awareness.
Process impacts. The development process, in the broad sense, covers the defined steps followed to
develop a software product. These include the re- quired work products at each step and the specific methodologies, practices, techniques, tools, and guidelines used. The development process gradually changes over time. The process for a newly formed organization may start off fairly simply, but it changes as problem areas are identified and corrected and as new practices are tried out. With continued focus on refining and impmzing the process, it reaches a degree of maturity.
Ordinarily, an organization's processes change very slowly. Process change, even when recognized as needed, is frequently difficult to accomplish because there is no established way to effect a change. Even the idea that the process should change is frequently not recognized or accepted. Also, the organization's process may not be documented or the documenta- tion may be out of date and not reflect the organi- zation's actual practices. The Defect Prevention Process affects the development process in a number of ways and supplies some of the methodology and structure that has heretofore been missing.
IBM SYSTEMS JOURNAL, VOL 29, NO 1 , 1990 MAYS ET AL. 19

The process becomes self-correcting. Wherever cur- rent practices lead to problems or errors, the prac- tices are scrutinized through causal analysis and corrected through suggested actions. If the process
Process documentation becomes up-to-date and is actively used by
the organization.
correction does not eliminate the problem, the proc- ess is automatically reviewed in subsequent causal analysis and further or different corrections are pro- posed. The process is constantly fine-tuned.
Process change is accelerated. Process deficiencies are pointed out and corrections are implemented rapidly by the action team. Those deficiencies which cause the most errors or problems receive the most focus. The action team becomes the focal point in the organization for process change.
Process documentation becomes up-to-date and it is actively used by the organization. The process is repeatedly reviewed in the stage kickoff meetings. The level of adherence to the process increases as a result. If the area’s process is undocumented, one of the first actions is for the action team to document it. If the process documentation differs from practice, this fact is brought up and corrected. Process changes are continuously fed back to the developers.
At some point during the adoption of the Defect Prevention Process-perhaps after a year of causal analysis and stage kickoff meetings-developers be- gin to make miscellaneous suggestions for improve- ment. A miscellaneous suggestion is not related to any specific defect or causal analysis meeting, but it is an idea that a developer has had to improve the way work is done. The presence of miscellaneous suggestions signals a fundamental change in the or- ganization. Developers are now taking an active role in improving the processes they fol!ow, acting to prevent errors before they occur. Developers come to realize that they can influence their process, their working environment, their tools, their educational
20 MAYS ET AL.
opportunities, and even the way they are managed. The developers are now empowered by the system with the ability to change it.
During software development, inspections play a key role in detecting defects that have occurred. How- ever, there is a danger that inspections can be relied on too heavily for defect removal. The key is the prevention of defects in the first place.
Because an inspection is held at the end of each development stage, developers may be inclined to think that being careful with their work is not a high priority because the inspection will catch the errors anyway. However, our experience shows that good inspections are typically 60 to 80 percent effective. This leaves the potential for quite a few errors still in the work product. Successful teams are concerned with preventing errors and thus tend to do much more self-checking and informal peer review as they go through each stage.
On the other hand, inspections and tests are still critical to the quality of the final product, and we are not suggesting the elimination of these steps. In fact, early detection of defects through inspections drives the causal analysis process.
Improved communications and quality awareness. A significant effect of Defect Prevention on the quality of individual development teams is improved com- munications. We have found that teams that have historically had good esprit de corps do more pro- ductive and higher quality work. The causal analysis meetings confirm this relationship. Teams that achieve high quality invariably attribute this at the causal analysis meeting to “improved communica- tions” or “good communications.”
The improved communication occurs mostly among team members. The Defect Prevention Process en- courages such communication. For example, during the stage kickoff meetings, the most important items tend to be the reviewing of common errors, discuss- ing preventive techniques, and understanding the need for the entire team to be more conscious of “trivial” mistakes. During the stage, the developers do not work as individuals but as a team. Whatever education sessions the team needs are sought. A VM
communications network is used to transmit mes- sages to the entire team whenever something needs to be communicated. The developers continually verify their ideas with other team members and ask many questions.
IBM SYSTEMS JWRNAL, VOL 2 9 , NO 1. 1990

These sound like and are very basic work techniques. However, they need to be continually reinforced. The natural tendency for developers is to receive a work assignment and work on that task alone. Com- munications must be continually encouraged. An adjunct to improved communications is improved morale. We have observed improvements in team morale in several areas that have adopted Defect Prevention.
D
Another effect of using this methodology is that quality awareness is greatly increased. The Defect Prevention Process requires that the people who create errors be involved in analyzing their cause.
Higher product quality translates into higher customer satisfaction.
This increased involvement in quality makes a dif- ference. The result is a much more active participa- tion by the people in suggesting preventive actions and ideas.
After repeated causal analyses, developers become
someone else’s error is described, the developer asks whether similar errors exist in his or her own work. If a team member has difficulty with a particular type of error, other team members offer help in avoid- ing that error or assistance in reviewing the work.
Net benefits of the process. In addition to process and quality improvements during development, other benefits of the Defect Prevention Process in- clude:
1 aware of the types of errors and their causes. When
Greater effectiveness of inspections and tests be-
Shorter test elapsed time. We have observed that tests of products that have used Defect Prevention typically complete on or ahead of schedule, some- times using fewer testers and other resources than planned. Cumulative improvements in the development process. The investments that a product area makes in improving its development processes are cumulative. The area keeps earning dividends
1 cause there are fewer defects
from the preventive actions which were imple- mented in prior years.
Our experience shows that the investment required for effective defect prevention is very small, less than a person year per year or about one-half percent in a 150 to 200 person organization. At this level of investment, the organization receives a direct return of at least double and possibly triple the cost, assum- ing a reduction in errors equivalent to what we have seen in other product areas. At this rate, the average cost of a single APAR would fund the Defect Preven- tion Process for more than two months.
However, the most significant benefit of the process is higher product quality in the field. Our experience to date shows that the error reductions seen in de- velopment continue in the field at the same level of reduction or better. Here the benefits of the process both to our customers and the company are substan- tial. Fewer APARS result in fewer customer problems, fewer customer calls, fewer fixes to be developed, certified, tested, and distributed. Because the impact of field errors on the customer can be significant, higher product quality translates into higher cus- tomer satisfaction.
Process details
In the development of the Defect Prevention Process over the past six years, there have been a number of refinements and enhancements, including adjusting the resource allocation for Defect Prevention activi- ties and various considerations to begin the process.
Resource allocation in the process. Organizations implementing this process find that they have so many good ideas and opportunities for improvement that they cannot implement them all. Thus manage- ment must decide how much people time resource to devote to this process. Clearly, the more resources devoted to the process, the more defects will be prevented. Resources are generally constrained in the areas of causal analysis and action team effort. The volume of defects available for causal analysis can be large, and it may not be feasible for the organization to do causal analysis of all the defects, although this is the ideal. The action team may find itself after a while with a substantial backlog of actions still to be completed. As more causal analysis is done, more actions are suggested. Thus the backlog grows.
Management can allocate more resources to the process by authorizing more causal analysis meet-
1 IBM SYSTEMS JOURNAL, VOL 29. NO 1. 1990

ings, by adding additional members to the action team, and by permitting a larger percentage of time to be spent by action team members (e.g., 50 percent rather than 10 percent). In addition, management may provide additional resources to the action team on a temporary basis.
Conversely management may choose to limit the resources in each area of the process to a specific level. For example, development teams may be re- quired to hold only one two-hour causal analysis meeting for each stage. We recommend the following minimum level of resource allocation:
A stage kickoff meeting for each development team at each stage One causal analysis meeting for each development team at each stage to ensure coverage of errors from each team and to provide feedback to all developers An action team of three to six members, depend- ing on the size of the organization-three mem- bers for an organization of 30 or fewer persons and six members for a 120 to 150 person organi- zation Action team participation at 10 percent of each member’s time
If causal analysis meetings are limited in this way to one meeting per team per stage, an appropriate sampling of errors can be examined in a timely manner. If a particular type of error is missed by one team, it will likely be considered by another team at a later time. The team leader may select an appro- priate number of errors-say twenty-for consider- ation at the meeting. We recommend that the selec- tion or screening of errors be done with care. Select an equal number from each developer so that every- one’s errors are analyzed. Select the errors so that a truly representative sample is presented. Do not omit errors because they seem obvious or trivial. Most errors are trivial in nature, and trivial errors need to be addressed with particular attention because they are so numerous. Omit obvious duplicate errors, because they waste time. However, make a note of how many duplicates occurred when the error is presented in the meeting. This lets the team know the magnitude of the problem.
Alternatively, the team leader can separate the errors into groups of related defects. The leader can then select a representative sample of each type of error. For example, one team leader reviewed more than one hundred errors that had accumulated for the
22 MAYS ET AL
team, sorting them by cause category. The team was then able to do causal analysis on sample errors from each error group in two meetings, producing 30 suggested actions. As with random selection, selec- tion by categorization should be done with care to present a truly representative sampling of errors, including errors from each person on the team. If screening of this sort is done, we recommend that a summary of the error groups also be presented to the team so that they can understand the distribution of errors.
Even though causal analysis is done only on a sample of the errors from a stage, the leader should hold the meeting as soon after the errors have been docu- mented as possible. Otherwise the developers have difficulty remembering the causes of the errors. Also, the developers miss timely feedback on the causes of
An advocate is needed to sponsor and promote the process until it is
established.
early errors that can reduce the possibility of repeat- ing the errors later.
Startup considerations. In order to start this process in an organization, an advocate is needed to sponsor and promote the process until it is established. Ideally there are two advocates, one a technical person and the other a manager. Advocates facilitate the startup through the education of developers and management about Defect Prevention, about the benefits and cost of the process, and so on. The initial education addresses any skepticism about the process within the organization. Another duty of the advocate is that of performing or assisting in initial activities, such as action team selection, setting up kickoff packages, holding initial causal analysis meet- ings, and implementing the initial actions. The advo- cate also maintains focus on the process throughout the startup period (which may be a year or longer) by reminding people of their responsibilities, seeing that meetings are held, and presenting initial results to management. The advocates should be correctly positioned within the organization. Ideally both the
IBM SYSTEMS JOURNAL, VOL 29, NO 1, 1990

technical and management persons performing that function are in relatively high positions. The persons should have credibility within the organization and be able to influence their peers.
Management funding. Another requirement for start- up is management commitment to the process. The
There is a continuing need for management’s support and funding
of the process.
Defect Prevention Process can be done with rela- tively small impact on the resources of the organi- zation, but there is a continuing need for manage- ment’s support and funding. Management must fund the resources of the action team and must authorize the action team to change and improve the development process. The action team must be viewed as a dedicated resource that will be protected from resource cuts and schedule pressures. Fre- quently the action team members’ responsibilities are put in their performance plans at an agreed upon level of effort.
We recommend that the Defect Prevention Process first be started as a pilot project, such as a portion of the release of a product involving several teams. The pilot project allows the participants to become used to the process without excessive stress. Initial adap- tation of the process to one area can be accom- plished, and the process can then be gradually ex- panded to encompass the entire organization.
Action team startup. Selection of action team mem- bers is important to the success of the process. Action team members should be persons in the area who are motivated, who can get things done, and who are dedicated to improving the area’s processes. The best action team members are not necessarily the technical leaders in the area. A positive attitude and a willingness to work are more important than tech- nical expertise. The action team manager should likewise be motivated and willing to improve the development process and should be able to represent the team’s perspective to management.
IBM SYSTEMS JOURNAL, VOL 29, NO 1, 1990
During the startup period it is important to establish the credibility of the process. This can be accom- plished by implementing some of the initial preven- tive actions quickly and publicizing them. Devel- opers need to feel that their efforts in making sug- gestions for improvement are being taken seriously and that change to the development process is pos- sible.
Initial meetings. The initial causal analysis and stage kickoff meetings should include an introductory sec- tion that reviews the Defect Prevention Process and describes the format of the meeting. Developers will initially be uneasy because the meetings are new. A review of the meeting content will help set them at ease. At the end of these initial meetings it is also good to ask for comments from the participants about the meeting and the process.
In causal analysis there may be an initial sensitivity and defensiveness because developers are being asked to openly discuss their mistakes. Thus it is important to ensure that the atmosphere ofthe meet- ing is nonthreatening. The causal analysis leader should keep the meeting light, with the focus on suggested improvements rather than a developer’s error. Developers who are new to development fre- quently do not realize that everyone makes mistakes. A good strategy can be to present errors from every- one, beginning with the more experienced devel- opers.
During the startup period, there is typically a flood of suggestions, with sometimes three or more sug- gestions for every defect analyzed. This is usually because there are many suggested improvements that developers have already considered but that have had no channel for implementation. As time goes on, the rate of suggestions slows because ideas that have been offered previously will also apply to defects analyzed later. Thus an initial two-hour causal analy- sis meeting may cover about seven defects and pro- duce 20 suggestions, many of which will be fairly easy to implement. After perhaps 15 causal analysis meetings, a typical meeting will cover 15 to 25 errors and produce five to seven suggestions. Often these later suggestions are more creative actions that may take longer to implement.
The nature of programming errors
Over the past six years, we have participated collec- tively in dozens of causal analysis meetings, involv- ing many widely varied software products, including

systems software, applications, and microcode. The study of the specific causes of errors gives a unique perspective on the nature of programming errors and the types of actions needed to prevent them.
Error cause categories. For many years, software engineers have tried to categorize errors in order to determine what areas to address to improve quality. A number of different error taxonomies have been
Error classification schemes may be helpful to identify broad error-prone areas and ac- tivities, but they do not address the variety of specific causes for errors.
In our view, error classification schemes obscure the details of the error and its cause. As a result, these schemes generally do not lead to thorough preventive measures. It may be misleading to try to identify preventive actions by considering the percentage of errors caused by the quality of;pecifications,’* mis- under$andings of the design, or data definition faults. Preventive actions, derived solely from error classifications, will not be specific enough. The thor- ough analysis of each error during causal analysis provides a much better understanding of specifically why an error occurred and how to prevent its recur- rence.
We have found one error classification scheme to be useful. During causal analysis, we ask that each error be categorized into one of four basic cause categories. In addition, we ask for a description of the specific cause of the error. The cause category helps the team identify the specific cause by focusing the discussion. It is the specific cause, however, that triggers the suggestions for prevention. The four basic cause categories follow.
Oversight. In this category, the developer failed to consider all cases and conditions. Usually some de- tail of the problem or process was overlooked. The developer forgot, had difficulty checking thoroughly, or did not have enough time to be thorough. To identify the specific cause, we ask “What was over- looked? What was not considered thoroughly?” Ex- amples: Developer failed to consider the end-node case of the message flow. Developer did not realize the value of a specific variable could exceed a maxi- mum value.
Education. In this category, the developer did not understand some aspect of the product or the proc- ess. This category is further divided into education in base code, education in new function, and other
24
education, depending on what was not understood. To identify the specific cause, we ask “What exactly was not understood?” Examples: Developer did not understand where specific fields were located in a control block structure (base code education). De- veloper did not understand the purpose of a specific new bit (new function education). Developer did not understand how character fields are initialized by the compiler (other education).
Communications failure. Here, the developer did not receive the required information or the information was incorrect. To identify the specific cause, we ask “What was not communicated, from whom to whom?” Examples: A requirement specification did not list all environments the new function had to work in. The design group failed to communicate last-minute changes to development.
Transcription error. In this category, the developer knew what to do and understood the item thoroughly but simply made a mistake. Transcription errors are typically caused by some problem in a procedure- for example, typing or copying a list of items. To identify the specific cause, we ask “What procedure was being used?” Examples: The developer trans- posed letters in typing. The developer omitted an item when manually copying a list.
An error may have multiple causes and multiple cause categories. In these cases, there is usually a chain of causes ( z was caused by y, which was caused by x). All of the causes can be recorded and consid- ered for preventive suggestions, although the root cause is usually the most important to address.
A fifth cause category, that a defect may be caused by a flaw in the process, is used by some organiza- tions following Defect Prevention. There is a debate as to the appropriateness of the process-cause cate- gory, because it fails to distinguish the human ele- ment of the cause from process flaws that affect human performance. Nakajo et al.9 clearly draw this distinction between human errors and contributory process flaws. The use of the process-cause category circumvents consideration of the human contribu- tion to the error and insulates the developer from taking responsibility for his or her own mistakes. In the authors’ view, process flaws should be considered after human causes have been identified, ideally when proposing preventive actions. Therefore, the process-cause category should be used with caution.
The pinhole effect. We characterize the variety of specific error causes as the pinhole effect. Envision a

Figure 8 Errors analyzed by development stage introduced
MLD 17% I CLD 12% I PLD 8%
CODE 68% PLD 3%
CLD 33%
MLD/CODE 50%
STAGE
PLD = PRODUCT-LEVEL DESIGN CLD = COMPONENT-LEVEL DESIGN MLD = MODULE-LEVEL DESIGN
balloon filled with water, representing the develop- ment process. Water is leaking from the balloon, not from gaping holes (Le., from large, obvious groupings of errors), but from thousands of small pinholes. Thus, product defects result from numerous diverse programming errors.
We have observed that most error causes are trivial, as for example, misspelling a word or forgetting to reinitialize a variable. While an error may have a trivial cause, it may have very severe consequences. Figure 8 shows the distribution of test and field errors for one product, by the stage in which the error was injected. The bulk of the errors found in the various test stages were coding errors. Upon analysis, these errors were considered to be simple mistakes that
could be avoided through preventive actions and attention to detail.
A second observation from these data is that the theory that design errors explode into multiple code errors is not true. A design error is typically counted as a single error regardless of the number of lines of code affected. As a project progresses through the various development stages, errors are created that are unique to each stage. That is, as more detail is added to the design and subsequently to the code, more errors are injected.
Process- or product-sensitive errors versus generic errors. Many errors are specific to the particular

development process and to the maturity of that process. The term process broadly includes the de- velopment stages, tools, procedures, methodologies, and techniques used by the developers. For example, a project whose basic architecture or specifications change while development proceeds may be expected to have many errors due to late changes overlooked or not thoroughly handled. A product that has sig-
The key to reducing errors is attention to detail.
nificant dependencies on another product that is being developed at the same time will probably have errors due to failures in communications between the two groups. A product area that has a weak education program or an influx of new people into the area will probably have a large number of edu- cation-type errors.
In addition, some errors are specific to the product being developed, usually due to its architecture or design. For example, one communications product has two recumng errors caused by its design and which was dictated by the constraints of the hardware on which it runs: (1) overwriting registers because the linkage and save area conventions were con- strained for performance reasons, and (2) confusion over WXTRN (weak external reference) versus EXTRN
because memory constraints required that only se- lected parts of the product be linked at product generation time. Another product, a high-perform- ance operating system, has recumng errors in defin- ing the scope of registers with USING and DROP due to an unusual program segmenting scheme which was selected for hardware performance considera- tions in early versions of the product.
On the other hand, certain errors are truly generic, that is, common to all developers regardless of the process, programming language, or type of product. Many of these are given in the code common error list in Appendix A. Other examples include:
Failure to consider all possible external factors, configurations, and environments under which the program will run Failure to investigate thoroughly impacts of a change Failure to communicate a change or impact to other team members
The nature of preventive actions
Given that programming errors have a large variety of specific causes that are frequently trivial in nature, it is clear that the key to reducing errors is attention to detail. This means attention to the multitude of product details that present themselves during de- velopment, as well as rigorous adherence to the established development processes. The potential for prevention is extremely high, particularly in address- ing trivial errors. In our view, high product quality and high customer satisfaction are attainable for software development through attention to detail, rigorous process adherence, and development auto- mation, which reduces the amount of tedious detail work required of programmers.
Just as errors tend to be sensitive to an organization’s process and the product it produces, the types of preventive actions are also typically product- or or- ganization-specific. Each organization has a different level of sophistication or maturity of its processes and tools. The improvements for one organization may be based on its current level of maturity. Many of these improvements may not be relevant to an- other product area.
Figure 9 shows the profile of actions for two product areas for the period 1987 to 1988, giving the break- down of actions by type. Both products had a signif- icant percentage of actions to enhance their process. A large number of these actions involve simple ad- ditions to common error lists and other process documentation. The two products differed in the profile of the other types of actions. Product 1 had fewer tool actions and more product changes and education actions. Product 2 had more effort spent on improving its set of tools. This reflects the differ- ences in the specific needs of the two areas.
Thus, we see that it is critical for each product to use causal analysis to determine what actions will help to improve its processes and tools. Preventive solu- tions to generic errors, of course, should be shared across all development groups, usually in the form
Failure to consider all error conditions or error of generic tools. Our experience, however, has been paths that most preventive actions are product specific.
26 MAYS ET AL IBM SYSTEMS JOURNAL, VOL 2 9 , NO 1, 1990
1

Figure 9 Action profiles for two products for 1987-1988
ENHANCEMENTS 53% PROCESS OTHER 4%
EDUCATION 12% I
(NEW/CHANGED) 18% CHANGES 13% TOOLS I PRODUCT
PROCESS ENHANCEMENTS 44%
OTHER 6%
I TOOLS (NEW/CHANGEDl 38%
TOTAL: 317 SUGGESTED ACTIONS TOTAL: 335 SUGGESTED ACTIONS
~~~
EDUCATION 4%
PRODUCT CHANGES 8%
Types of preventive actions. Different types of pre- ventive actions address the different cause categories of oversight, education, communications, and tran- scription.
Oversights can be prevented by actions that remind the developer or that automate the process so that the developer cannot overlook detail. Example tech- niques include the following:
Checklists and common error lists Cross-reference and product-logic documentation
Tools that add automatic checks, such as compi-
Templates or skeletons that guide the creation of
available on line
lers and post-compile module checkers
a work product
Permanent reminders and warnings in product
Reminders in the form of newsletters, memo- documentation
randa, and reminder notes
Some developers also find that holding work sessions with their peers to review and check one another's work is very helpful in preventing oversights. Often the vocalization of a design approach to a peer identifies holes in one's thinking. Such work sessions are not considered formal reviews or inspections because the work product has not been completed, and the errors uncovered have not been counted in the error rates.
If schedule pressure is the cause of oversights, man- agement should adjust their planning rates to allow
IBM SYSTEMS JOURNAL, VOL 29, NO 1. 1990

more time in the schedule to do the work properly. The presence of a large number of oversights caused by lack of time can be used to justify such adjust- ments by management.
Education errors can be prevented by providing the appropriate level of education at the right time, such as the following:
Seminars and classes related to the product New-hire education checklist Tutorial articles in the product-area newsletters Education sessions on the new release functions
Communications failures can be prevented by proc- ess changes and the use of tools, such as:
Liaison to receive communications from other areas where the product has dependencies and to pass on the information to others in the product area Use of a conference disk to pass information to interested parties in a product area Enhanced problem-tracking tool to include auto- matic notification of changes to affected parties
Transcription errors can frequently be prevented through such tools as the following that automate an error-prone procedure:
Code spelling checker Tool that maintains a release’s component list and automatically includes it in the design and speci- fication documents and in the build process Variable-not-declared warning in the compiler to check for names that have been misspelled
As with oversights, a work session with a team mem- ber can frequently help prevent transcription errors, where an automated procedure is not available.
Defect extinction. The Defect Prevention Process makes it possible to achieve complete extinction of programming defects. This can be compared with the biological phenomenon of extinction, which in- volves two simple facts: (1) Offspring are no longer being produced, and (2) all existing members of the species have expired. In the same way, there are two simple requirements to make programming defects extinct: ( 1) The cause of the defect has been removed, so that no new defects are produced, and (2) all existing instances of that defect have been removed.
28 MAYS ET AL
Simply preventing future errors is not enough. When several defects of a given type are detected, it is likely that additional defects of the same type exist in the
Product enhancements and tools are the two most effective approaches
in preventing future instances of a defect.
product as yet undetected. To achieve true extinction these existing defects must be identified and re- moved. Thus effective prevention of future defects and the systematic removal of existing defects are the two goals of defect extinction.
We have found that product enhancements and tools are the two most effective approaches in preventing future instances of a defect, and source scanning tools are the most effective way to discover and remove defects that already exist in a product.
In general, tools are the most effective type of pre- ventive action. They help identify predictable errors and prevent them automatically. They can perform an error-prone human task, providing 100 percent accuracy, independently of the programmer’s skill. Tools should be considered if other attempts to prevent an error have not been sufficiently effective. The tool may not actually prevent the error but may enhance our ability to detect the error or to detect it earlier in the cycle. For example, a tool may be used in unit test rather than in systems test.
Some specific examples of these approaches to defect extinction are the following:
Module checker tools. These are tools that audit the product source code with specific checks whenever a module is compiled, producing additional diagnostic messages at the end of the compiler listing. The checks can be specific to the product being developed or generic and applicable to all products using that language. The module checker output is generally required at code inspections.
BM SYSTEMS JOURNAL, VOL 29. NO 1. 1990
1

Module checker tools have been written for both assembler and high-level languages. The checks are usually derived from errors noted in causal analysis or from project standards that the area wishes to enforce. The module checker must be able to distin- guish instances of new code from existing or base lines of code, so that checks can be limited only to new code. Otherwise, extraneous diagnostic mes- sages are printed for the base code and developers may ignore or overlook valid messages from the new code. A module checker can distinguish new code from base code if the product uses change flags on the new and changed lines of code.
The following are examples of module checker checks. The first three examples are instances of product-specific checks, and the remainder are ge- neric checks.
D
D A specific keyword must be coded only once on a
particular product macro. %INCLUDES must specify a specific project library. Register basing must be specified only after ini- tialization of the base register; variables must be referenced only after their register basing is speci- fied. Return codes must be tested for successful com- pletion after each module or macro invocation. The indentation ofthe code in IF-THEN-ELSE blocks must be consistent with its nesting level. This check would detect cases of a missing DO-END
group on a THEN or ELSE leg. B
Product enhancements. A product itself may be a cause of errors. For example, a product interface may be error prone, because of a design flaw. A macro’s sequence of parameters may be counter- intuitive. The choice of variable names in a control block may be confusing. The most effective approach to preventing such errors is to correct the product.
An example of a product enhancement involved a macro that required the programmer to initialize a field after invoking the macro. If the initialization
out checking that the macro had succeeded, subse- quent processing would fail. The preventive solution involves the following two steps: (1) Move the ini- tialization of the field into the macro itself by adding a keyword to the macro that specifies the initial field value to be used; and (2) ensure that the new keyword is required for new uses of the macro but that existing uses of the macro in the product are not affected. This was done via the module checker.
rn were omitted, or if the initialization were done with-
0 IBM SYSTEMS JOURNAL, VOL 29, NO 1. 1990
Source scanning tools. A tool that can scan the entire source code of a product is very useful for discovering and removing existing defects. The scans are gener- ally identified through causal analysis. Errors that can be identified through specific syntactic elements in the code are the best candidates for scanning. If the error cannot be identified exactly through the source code, the scanning tool may be able to select and subset the possible instances where the error may have occurred. Additional analysis would then be needed to determine whether the error actually was present.
Scanning tools have been developed for both assem- bler and high-level languages. For high-level lan- guages, the ability to treat an entire source statement is useful, because source statements can span two or more lines of text. Frequently a scan requires several search terms connected with Boolean AND, OR, or NOT logic. It is also useful to have the option to display a specified number of statements before and after the found statement, to be able to search either by text string or token, and to search independently of upper- and lowercase text.
Examples of scanning code include:
Incompatible keyword combinations on a specific
Macro or module call but the return code was not
Register as the length parameter of an assembler
product macro
checked
storage-to-storage instruction
Preventing chronic errors. Most programming errors are made by developers repeatedly. Of these, some errors are noticeably more frequent than the rest, perhaps those caused by some general problem in the product or the process. These are the area’s chronic, errors. Usually the chronic errors become evident after only a few causal analysis sessions. By collecting data on the frequency of these errors, an ever stronger case can be built to implement effective preventive actions, and management can make rea- soned decisions on how to allocate resources. Once preventive actions are put in place, if the chronic error continues, stronger actions may be justified.
As an example of a chronic error, consider the following: Approximately a third of the defects ana- lyzed in one product area were due to lack of under- standing of various aspects of the product or envi- ronment. This fact was used to justify a full-time education coordinator for the product area. The
MAYS ET AL. 29

coordinator developed a comprehensive education plan and many of the courses and seminars identified in causal analysis have been made available. In an- other case of chronic error, a product that must do
use the storage, and then free it, will invariably have many errors in failing to free the storage on certain paths. Less frequently, the error of freeing the wrong amount of storage will also occur. A tool was devel- oped in one product area to trace storage GETS and FREES to ensure that the storage is always freed. Such a tool does not prevent the error and will not be able
CETMAIN/FREEMAIN-type logic, that is, get Storage,
Action teams usually find it necessary to prioritize their actions
so their efforts have the largest return to the organization.
to catch all instances of failure to free storage on all paths in the product. However, it tends to catch a very high percentage of this type of error compared to ordinary testing techniques.
Relative return on investment of actions. Action teams usually find it necessary to prioritize their actions so their efforts have the largest return to the organization. One method of prioritization devel- oped is that of the relative return on investment. An action’s relative return on investment begins with an estimate of the action’s effectiveness. The percentage effectiveness is a conservative estimate of the per- centage of similar errors the action will prevent. The percentage effectiveness is generally assigned by an individual action team member or by consensus of the entire action team.
Percentage effectiveness varies for different types of actions. For example, changes to the development process are generally in the 30 to 70 percent effec- tiveness range. Tool and product changes tend to- ward 70 to 100 percent effectiveness, and a newsletter article might be 10 to 30 percent effective. Estimating percentage effectiveness is not intended to be precise, but rather an approximation to produce a numerical
estimate of defects prevented and to project the return on investment.
An action’s return on investment (ROI) is the value of preventing a type of defect versus the cost of preventing it. An absolute return on investment cannot be calculated because the exact number of defects prevented cannot be calculated. However, an action’s relative ROI can be estimated from the num- ber of known defects that an action addresses times its estimated effectiveness. For example, a tool en- hancement that prevents three known product de- fects at 70 percent effectiveness and costs two pro- grammer days to implement has a relative ROI of (3 X 0.7)/2 or 1.05 defects per programmer day. Adding an item to a common error list that addresses two known defects at 30 percent effectiveness and which requires 10 minutes (0.02 programmer days) to implement has a relative ROI of (2 X 0.3)/0.02 or 30 defects per programmer day. Adding the item to the common error list is worth doing, even though it is only 30 percent effective.
A basic assumption of this method is that error types that occur in a product in one release, on average are repeated in the next release. This assumption is not precise. The relative ROI is an educated estimate of what today’s preventive action can accomplish for the next release of a product.
Concluding remarks
Significant quality and productivity improvements can be attained through systematic causal analysis of errors, implementation of preventive actions, and feedback to developers. The Defect Prevention Proc- ess uses the actual errors that have occurred and corrects their cause, relying on actual defect data rather than conjecture. Reductions in defects by more than 50 percent have been achieved at a cost of about one-half percent of the product area’s re- sources. Corresponding productivity improvements are realized through the improvements in quality.
Equally significant are the changes we have observed in the product areas themselves. Process change is accelerated and the area’s processes become self- correcting. Communication among team members improves and quality awareness increases.
Defect Prevention has been successfully applied to test, information development, software service, and human factors, as well as to software design and development. We feel that it can be applied generally
IBM SYSTEMS JOURNAL, VOL 29, NO 1. 1990

across all organizations involved in product devel- opment, including hardware design, hardware devel- opment, and manufacturing.
The investment required for the Defect Prevention Process is very modest. However, the benefit result- ing from higher product quality in the field is sub- stantial, both to a company’s customers and to the company itself. In today’s technological and com- petitive climate, we cannot afford to ignore defect prevention. The systematic causal analysis of errors and the resultant attention to detail in all aspects of the development process constitute the most prom- ising approach available for achieving high product quality and high customer satisfaction.
Acknowledgments
The authors wish to thank Florence Gans for her considerable assistance in compiling product error statistics and Ben Sun for his assistance with statis- tical analysis. We wish to acknowledge the contri- bution of Ken de Lavigne of the IBM Corporate Technical Education Center, Joanne Wojtusiak of Skylight Communications, and Jacques Jimenez of Pattern, Inc. in working with the authors to develop and present the Defect Prevention Process course to developers from every major programming center within the company. We are grateful to Katsutoshi Shintani for translating and summarizing the Japa- nese language papers. We also appreciate the thoughtful comments from Ken de Lavigne, Ron Phillips, Florence Gans, and Joanne Wojtusiak in reviewing this paper.
Appendix A: Excerpts from a code common error list
Initialization
Bits, bytes, pointers, or registers are not reset after
Initialize all variables before usage; never assume
Initialize all fields of a control block; do not leave
processing (occurs very frequently).
zeroes.
garbage.
Data definition
When defining a counter, make sure its value range is sufficient; anticipate possible future size changes. Control block or variable declare not properly aligned.
IEM SYSTEMS JOURNAL, VOL 29, NO 1, 1990
Variable name misunderstood or confused with
Do not assume control block bit meanings.
Interfaces
Consider all permutations of parameter values. Parameters passed in wrong order. Omitted double parentheses for a pointer in a
another variable name.
macro call.
Program Logic
Moved code (copied code) is very error prone; deleted code is also very error prone; check all paths, instructions, and variable names (occurs very frequently). Reset bits in the wrong place in the code. Loop logic errors: Initialize all flags and counters before entering loop. Consider all flags on each iteration. Consider three loop cases: first pass, last pass, and middle iterations. Increment counters and update pointers on each iteration.
Programming language/compiler
DO WHILE is used instead of DO UNTIL.
OR is used instead of AND in a complex IF state-
Tested OFF instead of ON.
X‘10’ should have been X‘OA’. Indented statements as a DO group but omitted
ment.
the DO-END.
Assembler
Register clobbered (occurs very frequently). No addressability established. Assembler half-word usage; make sure data will always fit in two bytes and that high-order bytes are cleared.
NetView is a trademark of International Business Machines Cor- poration.
Cited references
I . C. L. Jones, “A Process-Integrated Approach to Defect Pre- vention,” IBMSJistems Journal 24, No. 2, 150-167 (1985).
2. R. T. Phillips, “An Approach to Software Causal Analysis and Defect Extinction,” IEEE Gluhecom ’86 1, No. 12, 412-416 (December 1986).
3. A. V. Feiaenbaum. Turd Olralitv Cunrrul. McGraw-Hill Book

4. K. Ishikawa, What Is Total Quality Control? The Japanese Way, translated by D. J. Lu, Prentice-Hall, Inc., Englewood Cliffs, New Jersey (1985).
5. J. M. Juran and F. M. Gryna, Jr., Quality Planning and Analysis, McGraw-Hill Book Co., Inc., New York (1980).
6. P. B. Crosby, Quality Is Free, McGraw-Hill Book Co., Inc., New York (1979).
7. K. Hino, “Analysis and Prevention of Software Errors as a QC Activity,” Engineers (Japanese), 6-10 (January 1985).
8. H. Sugaya, “Analysis of the Causes of Software Bugs,” Nikkei Computer (Japanese), 167-176 (August 19, 1985).
9. T. Nakajo, K. Sasabuchi, and T. Akiyama, “A Structured Approach to Software Defect Analysis,” Hewleit-Packard Journal40, No. 2, 50-56 (April 1989).
IO. B. G. Kolkhorst and A. J. Macina, “Developing Error-Free Software,” IEEE Aerospace Electronic Systems Magazine 3, No. 1 I , 25-31 (November 1988).
I I . A. Spector and D. Gifford, “The Space Shuttle Primary Com- puter System,” Communications of the ACM 21, No. 9, 874- 900 ( 1984).
12. R. A. Radice, N. K. Roth, A. C. O’Hara, Jr., and W. A. Ciarfella, “A Programming Process Architecture,” IBM Sys- tems Journal 24, No. 2, 79-90 ( 1 985).
13. J. L. Gale, J. R. Tirso, and C. A. Burchfield, “Implementing the Defect Prevention Process in the MVS Interactive Pro- gramming Organization,” IBM Systems Journal 29, No. I , 33-43 (1990, this issue).
14. B. K. Lee, “Implementing a Quality Circle Programme for Computer Professionals,” Computer System Science and En- gineering 1, No. I , 65-67 (1985).
15. M. E. Fagan, “Design and Code Inspections to Reduce Errors in Program Development,” IBM Systems Journal 15, No. 3. 182-2 I I (1976).
16. R. A. Radice, J. T. Harding, P. E. Munnis, and R. W. Phillips, “A Programming Process Study,” IBM Systems Journal24,
17. W. S. Humphrey, “Characterizing the Software Process: A Maturity Framework,” IEEESoftware5, No. 2,73-79 (March 1988).
18. A. Endres, “An Analysis of Errors and Their Causes in System Programs,” IEEE Transactions on Software Engineering SE-1, No. 2, 140-149 (June 1975).
19. B. W. Boehm, R. K. McClean, and D. B. Urfrig, “Some Experiences with Automated Aids to the Design of Large-scale Reliable Software,” IEEE Transactions on Software Engineer- ingSE-1, No. I , 125-133 (1975).
20. D. M. Weiss, “Evaluating Software Development by Error Analysis: The Data from the Architecture Research Facility,” Journal oJSystems and Software 1, No. 1, 57-70 (1979).
2 I . T. J. Ostrand and E. J. Weyuker, “Collecting and Categorizing Software Error Data in an Industrial Environment,” Journal ofsystems and Software4, No 4, 289-300 (1984).
22. J. S. Collofello and L. B. Balcom, “A Proposed Causative Software Error Classification Scheme,” AFIPS Conference Proceedings: 1985 National Computer Conference 54, 537- 545 (1985).
NO. 2, 91-101 (1985).
Robert G. Mays IBM Communication Systems, P.O. Box 12195, Research Triangle Park, North Carolina 27709. Mr. Mays is an
advisory programmer in the Productivity Support Programs De- partment, Communications Programming Laboratory. He joined IBM in 1981 and is currently working on projects related to software process technology and development, including software design methodology, development methods for enhancing existing
32 MAYS ET AL.
code products, and understandability in software development. His current focus is the development and promotion of the Defect Prevention Process throughout IBM. Past assignments have in- cluded requirements process development and system planning for communications management projects. Mr. Mays received his B.S. degree in chemistry in 1968 from the Massachusetts Institute of Technology and is a member of the Association for Computing Machinery and the IEEE Computer Society.
Carole L. Jones IBM Communication Systems, P.O. Box 12195, ResL,arch Triangle Park, North Carolina 27709. Ms. Jones received her B.S. in mathematics from Youngstown State University in 1966. She joined IBM in DOS development at Endicott, New York, working in both the development and advanced testing areas. She transferred to Research Triangle Park (Raleigh) in 1970 and has held a variety of technical jobs in design, development, and testing of both systems software products and applications products. In 1980 Ms. Jones assumed the responsibility of process coordinator for the NCP products and, in that capacity, she was instrumental in developing and applying the concepts ofthe Defect Prevention Process as an integral part of the programming devel- opment process. She is currently a senior programmer in the Network Management Services area of the Communications Pro- gramming Laboratory with process and quality responsibilities.
Gerald J. Holloway IBM Communication Systems, P.O. Box 12195, Research Triangle Park, North Carolina 27709. Mr. Hol- loway, known as Lucky Holloway, is an advisory programmer in the Systems Test organization in the Communications Program- ming Laboratory. He received his B.S. in physics from the Uni- versity of Wisconsin in 1974 and joined IBM in Kingston in the test area of Virtual Telecommunications Access Method (VTAM). In 1981 he transferred to the design area of Network Communi- cations Control Facility (NCCF). In that capacity he began initial efforts toward optimizing the design process and its quality. In 1983 Mr. Holloway moved to the IBM Research Triangle Park site and initiated a quality team to pursue defect extinction in NCCF design and development. Later he worked in network management support to integrate defect extinction into the entire Network Management product area. Recently Mr. Holloway ac- cepted a position in the Systems Test organization to integrate the Defect Prevention Process throughout that organization.
Donald P. Studinski IBM Communication Systems, P.O. Box 12195, Research Triangle Park, North Carolina 27709. Mr. Stu- dinski joined IBM Communications Products Assurance in 1983 and was involved in product assurance for the Network Control Program (NCP) and System Support Programs (SSP) products. In 1987 he joined Teleprocessing Access Methods (TPAM) process control. In that capacity, he has implemented and supported the Defect Prevention Process throughout the TPAM organization. He is also actively involved in promoting Defect Prevention throughout IBM. Mr. Studinski received his B.S. in computer science from Louisiana State University, Baton Rouge.
Reprint Order No. (3321-5383.
IBM SYSTEMS JOURNAL, VOL 29. NO 1, 1990