experience with tax reform in the republic of korea
TRANSCRIPT

Asia-Pacific Development Journal Vol. 7, No. 2, December 2000
75
EXPERIENCE WITH TAX REFORM INTHE REPUBLIC OF KOREA
Ilho Yoo*
How can a tax system be designed to “optimally” raise revenue to financenecessary government expenditures? This question must be at the centreof the economic policies in many countries. In developing economies, onemore function is required – that is, taxation itself must promote rapideconomic growth. In other words, taxation should raise the required funds,and promote economic growth, presumably with tax incentives, while atthe same time satisfying the so-called principles of taxation – efficiency,equity and simplicity. In this paper, the author describes past tax reformsin the Republic of Korea and evaluates them. They are evaluated in relationto five aspects: impact on tax revenue, on growth, on equity, on efficiencyand on simplicity. In addition, suggestions for future tax reforms aregiven.
I. BRIEF HISTORY OF TAX REFORMS
From independence to the war rehabilitation period1
Like many other countries in the world, the history of taxation in the Republicof Korea conforms with that of capitalist development in the country. In this sense,the embryonic tax system in the Republic of Korea was already formed in the late19th century. It was then further developed and distorted concurrently during Japanesedomination.
That system, however, was far from “modern.” A modern tax system in thecountry was only introduced in 1948, when the first government of the country wasformed. In that year, a tax law committee was founded and eight fundamental taxacts were enacted. Major acts included the Income Tax Act, Corporation Tax Act, andLiquor Tax Act. After that, ten additional tax acts, including the Inheritance Tax Actand Commodity Tax Act, were enacted.
* President, Korea Institute of Public Finance, Seoul, Republic of Korea.
1 This period classification, along with those of the subsequent sections, follows the classifications usedin Choi and Han (1992).

Asia-Pacific Development Journal Vol. 7, No. 2, December 2000
76
A number of changes in taxation were needed due to the war (1950-1953).These changes were particularly aimed at providing the additional revenue required tofinance the war. In this regard, the Land Tax Act and Temporary Tax RevenueExpansion Act were introduced in 1950, while a number of existing tax acts, such asthe Income Tax Act, were revised. As the war continued, further reform of the taxsystem, especially with respect to collection, was done. For this, the Special Measurefor Taxation and the Temporary Land Income Tax Act were enacted in 1951. As aresult, the land income tax replaced the general income tax as the main source of taxrevenue.
With the armistice in 1953, emergency wartime tax measures were adjustedto a normal peacetime tax system, especially to meet the needs of economicreconstruction. For this purpose, the government of the Republic of Korea sought thehelp of foreign experts. As a result, H.P. Wald’s Report and Recommendations for theKorean Tax System was published in August 1953.
Following the suggestions of Wald’s report, reform of the tax system was putinto effect. The Special Measure for Taxation and the Temporary Tax RevenueExpansion Act were abolished, while the textile tax was absorbed into the commoditytax and the license tax was transferred from the central government to local authorities.The income tax system was divided into specific taxes with flat rates and global taxeswith progressive rates.
In order to increase tax revenue, the government introduced three new taxesin 1958: an education tax which was levied as a surtax to the personal income tax, anasset revaluation tax, and a foreign exchange tax. This last tax, introduced to absorbgains resulting from the difference between the official and market exchange rates,was abolished in 1963.
In the tax reform initiated by the Democratic Party government in 1960,direct tax rates were generally reduced, but indirect tax rates were raised, and taxexemptions and deductions designed to promote exports and capital accumulationwere increased substantially.
The take-off period
In 1961, right after the coup, the military government began to work onstructural tax reform and measures to improve tax administration. It enacted theTemporary Measure for Tax Collection and the Special Measure for Tax EvasionPunishment in order to collect delinquent taxes. The government also revised theIncome Tax Act, the Corporation Tax Act, and the Business Tax Act, and established anew tax accounting system.
Then, at the end of the same year, the government implemented a general taxreform with emphasis on eliminating irregularities within the tax administration, layingthe foundation for a lasting, modern tax system, and providing strong support for the

Asia-Pacific Development Journal Vol. 7, No. 2, December 2000
77
First Five-Year Economic Development Plan. It was the first time that the role oftaxation was extended to areas other than just securing enough funds. This new roleof taxation, i.e. the promotion of rapid economic growth, was given the central positionin tax policy until the early 1980s, when the main focus of economic policy waschanged. The other important characteristic of this reform was the streamlining ofthe local tax system.
Almost all the major tax acts were revised. As a result, the total number oftaxes was reduced to 28 from the previous 38. Then in 1962, the Adjustment Law forNational and Local Tax and the National Tax Appellate Application Law wereintroduced. These tax reforms in 1961-62 are regarded as establishing many of thefeatures of the present tax system in the Republic of Korea.
In 1966, there was an important change in the tax administration of the country.On March 3rd of that year, the National Tax Service (NTS)2 was established. Its mainfunctions have been the assessment and collection of internal taxes. The establishmentof the NTS marked the beginning of modern tax administration.
There was another large scale tax reform in 1967. The aim of this reformwas to promote rapid economic growth by supporting the Second Five-Year EconomicDevelopment Plan. Tax incentives were widely introduced, particularly for this purpose.Twelve of the 19 existing tax laws were modified extensively and a new Real EstateSpeculation Control Tax Law was instituted. The most important characteristic ofthis reform was the introduction of the global income tax, although it was incomplete.A more complete form of the global income tax was introduced in the major taxreform of 1974, which will be discussed below. Finally, in an effort to enhanceequity, the highest marginal rate of the inheritance tax was increased from 30 per centto 70 per cent.
In 1974, the government undertook reform measures of the tax system,primarily to improve income distribution. Income redistribution was a particularlyimportant policy issue at that time because it was widely recognized that thedevelopment strategy until then put too little emphasis on equity. The major featuresof the reform were as follows: a full-scale global income tax system was introducedas discussed above (see table 1 for the tax bases and rates). Generous personalexemptions were also allowed to reduce the tax burden of low income earners. A ratestructure also lightened the tax burden of low income earners, and increased theburden on those in the high income brackets. A capital gains tax was introduced toreplace the Real Estate Speculation Control Tax which had been in effect since 1968.
In December 1976, the government carried out a large scale tax reform andintroduced the Value Added Tax (VAT) and Special Excise Tax. Eighteen new taxlaws were enacted or amended under the reform as well. This tax reform was mainly
2 At first, it was called the Office of the National Tax Administration (ONTA) and then the National TaxAdministration (NTA).

Asia-Pacific Development Journal Vol. 7, No. 2, December 2000
78
Table 1. Comprehensive income tax rates (1974)
(Unit: thousand won, per cent)
Comprehensive income tax base
Over Not more thanTax rates
0 240 6240 480 10480 720 12720 960 15960 1 200 18
1 200 1 500 211 500 1 800 251 800 2 400 302 400 3 000 353 000 4 800 404 800 7 200 457 200 12 000 50
12 000 24 000 5524 000 36 000 6036 000 48 000 6548 000 70
aimed at improving stable national life, meeting the fiscal requirements of the FourthEconomic Development Plan, and further modernizing the tax system. The lastobjective, that is, modernization of the tax system, is regarded as being accomplishedby this reform.
The 1976 amendments to the internal tax laws generally went into effect inJanuary 1977, except for the Value Added Tax Law and the Special Excise Tax Law,which went into effect on 1 July 1977. By this reform, the traditional indirect taxsystem, which included a cascade-type business tax, was replaced by a consumption-type VAT and a supplementary special excise tax. This was primarily to simplify taxadministration and promote exports and capital investment. A single, flexible rate of10 per cent was applied to all items subject to VAT. The entertainment and food tax,which had been a local tax item, was incorporated into the national tax system. Theregistration tax, which had been treated as a national tax, was converted to a local taxstarting 1 January 1977.
The liberalization and stabilization period
There was a dramatic economic policy change in the 1980s. Following thesecond oil crisis in 1979 and the political turmoil of 1979 and 1980, the economy of

Asia-Pacific Development Journal Vol. 7, No. 2, December 2000
79
the Republic of Korea was plunged into a deep recession. Under these newcircumstances, the government switched its economic policy directions fundamentally:from protection to competition and openness, and from regulation to liberalizationand bold privatization. In this regard, the government began to reduce its interventionin the private sector. As a result, not many new functions were demanded fromtaxation.
Therefore, unlike the 1960s and 1970s, there were no major tax changesduring the 1980s, up to 1987, although there were minor revisions of tax laws. In thisperiod, major changes were made in two areas – tax incentives and the curbing ofland price hikes.
During the course of rapid economic growth, strategic industries were providedwith a variety of tax incentives under many different schemes. The successive additionof new industries, firms, or individuals to the list of beneficiaries, and new types ofincentives to the existing stock of incentive schemes complicated the tax system,generated inequities in the tax burden among individuals and sectors, and lessened theinfluence the tax preference measures could exert. In 1982, the government took itsfirst step towards streamlining the tax incentive system. This will be discussed furtherin the next section.
The centerpiece of the tax reform in the late 1980s was how to control landspeculation through tax measures. Speculation on land has been a serious economicand social problem in the Republic of Korea and the resulting land price hike causedmuch distortion in resource allocation and in the distribution of income and wealth.
To solve this problem, various measures – mostly tax-based – were taken.Most important among these was the aggregate land tax (the global landholding tax)which was introduced in 1989. This tax replaced the excessive land holding taxwhich had been in effect for the previous two years. Also, the so-called “publicconcept” of the ownership of land was introduced. To meet this principle, the increasedrate of land tax was introduced in 1989, together with such non-tax measures as theExcessive Residential Land Ownership Charge and the Land Development Charge.Other major non-tax measures to curb the land price hikes included the introductionof a new system of assessing land: an upward adjustment of the assessment ratio.
Contrary to their intention, however, these measures are judged as (relatively)unsuccessful in their fight against land price hikes. As a result, all three measuresrelated to the public concept of land were abolished in the late 1990s.
The government finally introduced the real name financial transaction systemin August 1993. The tax measure related with this is the inclusion of the financialincome in excess of 40 million won into the global income tax base. It was announcedthat this would be enacted in the tax reform in 1994. This measure, however, wassuspended in 1998 amidst the economic crisis, and is supposed to be reintroduced in2001.

Asia-Pacific Development Journal Vol. 7, No. 2, December 2000
80
In 1994 and 1995, there were major tax reforms in the Republic of Korea.The 1994 tax reform was designed to establish an advanced tax system which ischaracterized by low tax rates and a broader tax base in line with the tax reform inthe United States in 1986.
Among many measures to achieve these goals, the most important ones areas follows: first, income tax became closer to a comprehensive income tax byincorporating interest and dividend income into the global income tax system (thishas been applied since the beginning of 1996). Until 1995, interest and dividendincome were assessed and withheld at a rate of 20 per cent, separate from globalincome.
Second, the self-assessment system for individual income taxes was introducedand went into effect on income reported in 1996. This would have indeed been animportant improvement in tax administration if it had proceeded as intended. Thereality, however, is that government-assessment is widely used even now.
Finally, corporation tax rates were reduced to improve the internationalcompetitiveness of domestic industries. As a result, the corporation tax rate of firmswhose incomes were greater than 100 million won per year was reduced to 30 percent from the previous 32 per cent.
Tax law amendment in 1995 was in line with that of the previous year, thatis, lowering the tax burden and widening the tax base. For this, individual income taxbrackets were adjusted (see table 2). At the same time, the corporation tax rate wasfurther reduced by 2 per cent (see table 3).
Table 2. Individual income tax brackets (1995)
Tax rate Brackets
(per cent) Before Revised
10 10 million won 10 million won20 10 30 10 4030 30 60 40 8040 60 80
Table 3. Change in corporation tax rate
Tax year Tax rate (private corporations)(per cent)
1995 income 100 million won: 18 (19.35)income 100 million won: 30 (31.50)
1996 income 100 million won: 16 (17.20)income 100 million won: 28 (30.10)

Asia-Pacific Development Journal Vol. 7, No. 2, December 2000
81
Financial crisis and tax reform: 1998-1999
The economic crisis which started in late 1997 forced the government toinitiate a series of comprehensive economic reform measures to overhaul the economy.As a part of such reforms, the government made a number of changes in tax laws tofacilitate the restructuring process, stimulate investment and consumption, and broadenthe tax base and tax revenue.
Measures for restructuring
One of the most important causes behind the crisis was too much debt owedby firms. Thus, the financial restructuring of the corporate and financial sectors wasinevitable to overcome the crisis. In this sense, the tax liability should neitherdiscourage nor prevent companies and financial institutions from undergoing thenecessary restructuring. Therefore, the government exempted or reduced taxes onasset transactions that are needed for corporate and financial restructuring.
Tax incentives to encourage and accelerate restructuring were mostly grantedto transaction-related taxes, such as the Capital Gains Tax, Acquisition Tax, andRegistration Tax. These incentives are to encourage corporate mergers and acquisitions,business divisions, asset swaps, alienation of business assets, and contributions bycompany owners. For example, profits resulting from the revaluation of corporateassets after mergers and acquisitions have been made eligible for deferral from corporateincome tax until the alienation of the revalued assets. Corporate mergers andacquisitions have also been exempted from the Registration Tax.
Stimulating investment and consumption
The withdrawal of foreign capital was one of the principal factors thatprecipitated the Republic of Korea’s economic crisis. Therefore, restoring theconfidence of foreign investors and attracting foreign investment were overridingpriorities. To attract foreign direct investment (FDI), the Foreign Investment PromotionAct (FIPA) was enacted in 1998. In May 1999, provisions dealing with tax incentivesfor FDI was subsumed into the Special Tax Treatment Control Law (STTCL).
The principal objective of FIPA is to attract FDI by creating a more liberalizedand favourable business environment for foreign businesses and providing tax incentivesto certain types of FDIs. Under FIPA, foreign businesses and investors who makeadvanced technology FDI in the Republic of Korea have been made eligible forexemptions from individual and corporate income taxes for the first 7 years and50 per cent reductions for the next three years. In addition, foreign businesses andinvestors have been granted exemptions from a number of local taxes (i.e., AcquisitionTax, Property Tax, Aggregate Land Tax, and Registration Tax) for a minimum of5 years and 50 per cent reductions for the next 3 years. Imported capital goods have

Asia-Pacific Development Journal Vol. 7, No. 2, December 2000
82
also been made eligible for full or partial exemptions from customs duties, the specialexcise tax, and VAT.
As an additional measure to attract FDI, the long-protected real estate marketin the country was completely opened to foreign investors in June 1998. In an effortto attract large-scale foreign investment, the government also introduced a ForeignInvestment Zone (FIZ) system. Foreign investment companies that receive the FIZdesignation are eligible for government support and tax benefits.
Tax incentives were provided to small and medium-sized enterprises tostimulate employment and technology investment. They include tax exemptions onstock options, tax credits and exemptions on R&D, reduction of special excise tax onconsumer electronic goods and automobiles, reduction of automobile tax, and reductionof capital gains tax.
Broadening tax bases and increasing tax revenue
Tax revenue has decreased significantly since the beginning of 1998 due tothe recession. On the other hand, a sharp increase in government spending wasnecessary, particularly to meet part of the cost of restructuring, unemployment benefits,and social safety nets. These naturally led to a huge fiscal deficit.
To prevent an excessive deficit, the government raised tax rates on items thatwere believed to have been least affected by the economic crisis. Thus, among others,taxes on gasoline and diesel were raised, and the progressive taxation of interestincome was switched to a proportional withholding tax. In addition to these, cigarettesbecame subject to VAT on top of the existing local tax.
In an effort to broaden the tax bases, the government also curtailed taxexemptions and reductions. One notable example is the abolition of the VAT exemptionon services supplied by professional service providers, e.g., lawyers and accountants.Also, the government enacted the Special Tax Treatment Control Law to control thewidely scattered exemption-related laws, making tax laws that allow exemptions andreductions subject to sunset rules.
II. EVALUATION OF TAX REFORMS
Tax revenue
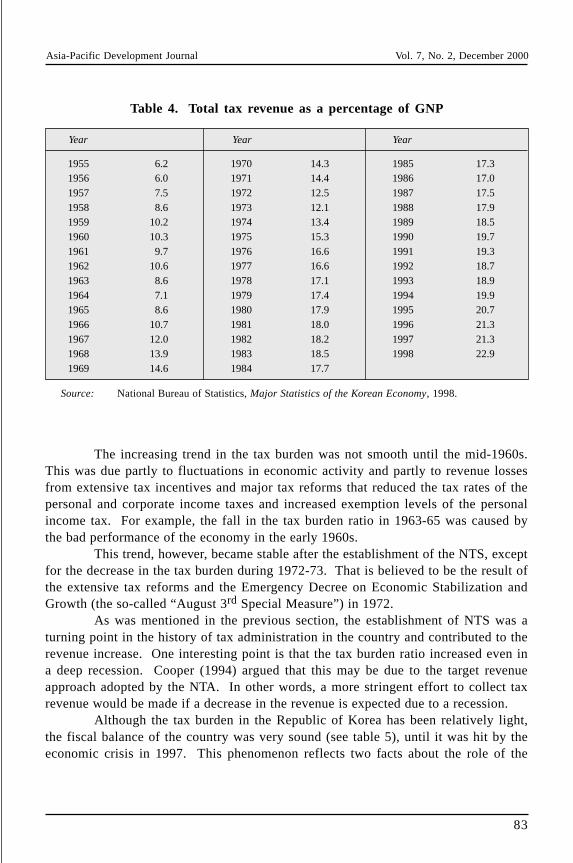
As was pointed out, the major function of taxation is to secure enough fundsfor expenditures. It needs to be seen whether taxation in the Republic of Korea, withits many past reforms, has served this purpose well. As a result of much effort by thegovernment to raise revenue, the share of total (national and local) tax revenue as apercentage of GNP, or the tax burden, increased from 6-7 per cent in the mid-1950s to20-21 per cent in the 1990s, as can be seen in table 4. The overall tax burden as apercentage of GNP, however, is still considered to be low compared to that of othercountries.
Asia-Pacific Development Journal Vol. 7, No. 2, December 2000
83
Table 4. Total tax revenue as a percentage of GNP
Year Year Year
1955 6.21956 6.01957 7.51958 8.61959 10.21960 10.31961 9.71962 10.61963 8.61964 7.11965 8.61966 10.71967 12.01968 13.91969 14.6
1970 14.31971 14.41972 12.51973 12.11974 13.41975 15.31976 16.61977 16.61978 17.11979 17.41980 17.91981 18.01982 18.21983 18.51984 17.7
1985 17.31986 17.01987 17.51988 17.91989 18.51990 19.71991 19.31992 18.71993 18.91994 19.91995 20.71996 21.31997 21.31998 22.9
Source: National Bureau of Statistics, Major Statistics of the Korean Economy, 1998.
The increasing trend in the tax burden was not smooth until the mid-1960s.This was due partly to fluctuations in economic activity and partly to revenue lossesfrom extensive tax incentives and major tax reforms that reduced the tax rates of thepersonal and corporate income taxes and increased exemption levels of the personalincome tax. For example, the fall in the tax burden ratio in 1963-65 was caused bythe bad performance of the economy in the early 1960s.
This trend, however, became stable after the establishment of the NTS, exceptfor the decrease in the tax burden during 1972-73. That is believed to be the result ofthe extensive tax reforms and the Emergency Decree on Economic Stabilization andGrowth (the so-called “August 3rd Special Measure”) in 1972.
As was mentioned in the previous section, the establishment of NTS was aturning point in the history of tax administration in the country and contributed to therevenue increase. One interesting point is that the tax burden ratio increased even ina deep recession. Cooper (1994) argued that this may be due to the target revenueapproach adopted by the NTA. In other words, a more stringent effort to collect taxrevenue would be made if a decrease in the revenue is expected due to a recession.
Although the tax burden in the Republic of Korea has been relatively light,the fiscal balance of the country was very sound (see table 5), until it was hit by theeconomic crisis in 1997. This phenomenon reflects two facts about the role of the

Asia-Pacific Development Journal Vol. 7, No. 2, December 2000
84
Table 5. Budget surplus or deficit
(Unit: 100 million won)
Year General Account Consolidated Budget GDP2
per cent of GDP per cent of GDP
1972 239 0.6 -1 925 -4.6 42 1191975 882 0.9 -4 661 -4.5 102 9551980 3 192 0.8 -11 737 -3.1 381 4841981 2 342 0.5 -21 109 -4.4 476 5671982 -582 -0.1 -22 221 -4.1 547 2101983 2 486 0.4 -9 506 -1.5 641 9651984 1 890 0.3 -9 229 -1.3 736 0511985 -472 -0.1 -7 133 -0.9 820 6211986 2 605 0.3 -649 -0.1 957 3641987 11 132 1.0 2 597 0.2 1 121 3031988 20 180 1.5 16 427 1.2 1 331 3421989 4 314 0.3 -191 0.0 1 491 6471990 2 126 0.1 -15 782 -0.9 1 787 9681991 -17 354 -0.8 -40 220 -1.9 2 165 1091992 1 452 0.1 -17 029 -0.7 2 456 9961993 4 341 0.2 8 129 0.3 2 774 9651994 17 218 0.5 13 843 0.4 3 234 0711995 11 119 0.3 12 415 0.3 3 773 4981996 3 618 0.1 10 990 0.3 4 184 7901997 -3 950 -0.1 -69 5901 -1.5 4 532 7641998 -8 366 -0.2 -187 570 -4.2 4 495 088
Source: National Statistical Office, Korean Statistical Information System.Note: 1 In 1997, includes foreign borrowing of US$ 5 billion dollars from IBRD and ADB.
2 At current prices.
government in the past: first, it has led rapid development through non-fiscal measuressuch as direct intervention, regulation, policy loans, etc. Second, there has beenoversuppression on all or part of government expenditures.
Part of the oversuppression was on expenditures on social welfare. It is alsoto be noted that the social security system in the country has not been developedsufficiently until recently. The fully funded national pension, which was introducedfirst, has not paid full scale benefits yet. Also medical insurance and unemploymentinsurance are still in their initial stages.

Asia-Pacific Development Journal Vol. 7, No. 2, December 2000
85
Impact on growth
One of the major functions of fiscal policy is to stimulate economic growth.Particularly for less developed countries, it is believed that governments should providetax incentives for savings, capital formation, and export promotion to achieve rapideconomic growth. Indeed, in such growing economies as the Republic of Korea, theabove-mentioned tax incentives have been widely used. What interests us is whetherthe country’s taxation, with many of those incentives, contributed much to the rapideconomic growth of the country.
Although there has been much talk about this, rigorous analyses of the impacton growth are rare. The most prominent among them must be those of Trella andWhalley (1991, 1992). These analyses are based upon their two (1991) and three(1992) sector CGE models. Since they are the only meaningful analyses on thissubject to the best of the author’s knowledge, our evaluation here will be centredaround these papers.
According to Trella and Whalley, tax reforms in the Republic of Korea have“probably facilitated rather than fueled high growth.” This conclusion is based ontheir findings that the GDP growth rate in each of the phases in which the major taxregime changes have occurred has been consistently high.
What is more important is their second conclusion in the second paper. Theyconcluded that taxation in the Republic of Korea has played a relatively modest role,accounting for 3.0 to 4.2 per cent of the country’s growth between 1962 and 1982,with only 3.6 per cent between 1962 and 1972. This is equivalent to a 0.26 percentagepoint contribution to the growth rate over the period 1962-1982 (which is about halfof the counterpart in the two sector model).
Thus, the contribution of taxation to the growth rate is indeed small. Thisinterpretation, however, is open to criticism. Krueger (1992) raises this question inher comment to the paper. She started with noting the fact that half a percentagepoint on the growth rate for many other countries would be a major achievement.Moreover, it does not count the secondary effects of taxation, e.g. reducing the budgetdeficit and the rate of inflation. Therefore, she argues that the isolated direct effect oftaxation, excluding all of these derived effects, cannot be small. In other words,taxation may have had a substantial effect on the Republic of Korea’s growth, contraryto Trella and Whalley’s conclusion.
It would be very difficult, however, to analyse the true contribution of taxationcapturing all of these effects. International comparison may be needed. It should beadmitted that taxation has certain limits as a tool for growth, considering the fact thatits primary function is the provision of funds for the public good. Taking this intoaccount, it is more appropriate to see whether taxation has contributed more to growththan other policy tools. We now turn to this subject.

Asia-Pacific Development Journal Vol. 7, No. 2, December 2000
86
There have been so many tax incentives in the country that we cannot evenlist all of them here. The most important among them are special depreciation,investment tax credit and tax free reserves. A tax holiday was extensively used untilits abolition in 1981 (see the appendix for a more detailed explanation of tax incentivesin the Republic of Korea).
In the 1960s, the core of the Republic of Korea’s development policy wasexport promotion, and naturally the greatest emphasis was placed on those taxincentives designed to promote foreign exchange earning activities. In this period,a tax holiday was the most important tax incentive until the investment tax credit wasintroduced in 1967. The government’s efforts to promote exports in the 1960s werehighly successful, and investment in light manufacturing export industries grew rapidly.It is, however, very difficult to measure the net effect of tax incentives because at thesame time, very strong credit support, such as policy loans, was provided to theexport industries.
What are the impacts of such tax incentives? Have they really contributedmuch to the growth of the economy as intended? The answer is neither in theaffirmative nor negative. Almost all the research on the cost of capital and effectivecorporation tax rates in the Republic of Korea points out that they have been somewhateffective, but not very much (Kwack and Yoo (1994), and Yoo (1998)). Yoo (1995)showed that investment tax credits and accelerated depreciation were powerful. Othermeasures, particularly the policy loans, have been argued to be far more effectivethan tax incentives (see Cho and Kim 1994).
Finally, it should be pointed out that the structure of tax incentives in thecountry is very complicated and difficult to interpret. This aspect along with theefficiency of the tax incentives will be discussed later in the paper.
Equity
It goes without saying that equity is one of the most important factors inevaluating taxation. It is said, however, that taxation in the Republic of Korea leavesmuch to be desired in equity, both vertical and horizontal. Despite continuous effortsby the government, the equity of taxation has not improved much.
It is appropriate to look in this context at the tax structure of the country,including the revenue structure first, because it is the outcome of tax reforms. Inother words, it essentially reflects the appropriateness of tax reforms. Currently, thereare 16 national taxes including customs duties, and 15 local taxes (see figure A1 inthe appendix). It is often criticized that there are too many taxes which in turn causesthe complexity of the tax system.
If we look at the composition of taxes the major revenue sources of thecentral government are consumption and income taxes while those of the localgovernment are property related taxes. Since its introduction in 1977, VAT has became

Asia-Pacific Development Journal Vol. 7, No. 2, December 2000
87
Table 6. The tax system in the Republic of Korea (1997-1998)(per cent)
Share in Share in Share in Share in
total national local localNational taxes taxes taxes Local taxes taxes taxes
1998 1997 1998 1997 1998 1997 1998 1997
1. Domestic taxes 60.7 60.9 75.6 75.9 1. Ordinary taxes 17.7 17.8 89.6 90.3Personal income tax 20.4 19.2 25.4 23.9 Acquisition tax 2.9 3.3 14.6 16.8Corporation tax 12.8 11.1 15.9 13.8 Registration tax 3.8 4.6 19.3 23.2Inheritance and gift tax 0.8 1.3 1.0 1.6 License tax 0.3 0.3 1.4 1.6Assets revaluation tax 0.5 0.2 0.7 0.3 Inhabitant tax 3.0 2.6 15.3 13.4Excessive land holding 0.0 0.0 0.0 0.0 Property tax 0.7 0.6 3.8 3.1 tax Automobile tax 2.5 2.1 12.5 10.6Excess profit tax – – – – Farmland income tax – – – –Value-added tax 18.6 20.7 23.2 25.8 Butchery tax 0.1 0.0 0.3 0.2Special consumption tax 2.6 3.7 3.3 4.7 Horse race tax 0.4 0.3 2.1 1.8Liquor tax 2.1 2.3 2.7 2.9 Tobacco tax 2.6 2.4 13.2 12.3Telephone tax 1.1 0.8 1.4 1.0 Aggregate-land tax 1.4 1.4 7.2 7.3Stamp tax 0.4 0.4 0.4 0.6Securities transaction tax 0.3 0.4 0.4 0.5 2. Earmarked tax 1.7 1.6 8.7 8.6Carry-over 1.1 0.7 1.4 0.9 City planning tax 0.9 0.8 4.5 4.1
Fire service facilities tax 0.3 0.3 1.8 1.42. Customs duties 4.5 6.7 5.7 8.3 Workshop tax 0.4 0.4 2.0 1.9
Regional development 0.1 0.1 0.4 0.43. Surcharges 15.1 12.6 18.8 15.8 tax
Education tax 6.2 5.8 7.7 7.3Transportation tax 7.7 5.5 9.6 6.9 3. Carry-over 0.3 0.4 1.8 1.8Special tax for rural 1.2 1.3 1.5 1.6 development
Source: Bank of Korea, Economic Statistics Yearbook, 1999.
a major source of revenue in the Republic of Korea. As shown in table 6, VATyielded 24.3 per cent of total national tax revenue, making it the largest single tax inthe country. Although it ceded its position to personal income tax in 1998, due to therecession after crisis, the switch was reversed again in 1999 according to tentativefigures.
Taxes on wealth at the central government level, such as the inheritance andgift tax, assets revaluation tax, and securities transaction tax are hardly significant interms of their revenue yield. Revenue collected from the above taxes comprise only2.1 per cent of the central government’s total tax revenue in 1998. Wealth taxes atthe local government level such as the acquisition tax, property tax, registration tax,

Asia-Pacific Development Journal Vol. 7, No. 2, December 2000
88
city planning tax, fire service facilities tax and automobile tax are major fiscal resourcesfor local governments, accounting for 56.5 per cent of their total tax revenue. Revenuefrom wealth taxes as a percentage of total tax revenues of both governments at alllevels, however, is about 12.7 per cent, which is not very high by internationalstandards.
As can be seen in table 7, which shows the structure of the national taxsystem, the Republic of Korea once heavily depended on domestic indirect taxes ongoods and services which accounted for 52.4 per cent of total tax revenue of thecentral government in 1980. In the 1990s, however, its share drastically decreased toaround 38 per cent. On the other hand, taxes on income and profits accounted foronly 36.0 per cent of the total national tax revenue in 1994. This is an increasecompared to the 25 per cent level in the late 1970s. Although income taxes havegained importance in recent years, income taxes do not occupy the central position inthe revenue structure of the country. The share of taxes on international transactions,entirely composed of customs duties on imports in the Republic of Korea, has alsogradually decreased to 4.9 per cent in 1998 from 17.2 per cent of the central governmentrevenue in 1980.
These facts, i.e., the largest share captured by VAT, the relatively low sharesof income and property taxes, explain one important characteristic of the structure oftax in the country. It is that the government relies very heavily on indirect taxes. As
Table 7. Structure of national taxes, 1970-1998(per cent)
Percentage of total national taxes
1970 1975 1980 1985 1990 1994 1995 1996 1997 1998
Taxes on income, 35.0 24.3 25.5 28.7 37.5 36.0 35.9 33.3 33.0 35.7 profit and capital gains
Social security 0.8 1.0 1.2 1.7 5.1 8.8 8.7 10.3 10.2 13.4 contributions
Taxes on property 2.5 3.9 0.6 0.7 2.4 3.2 2.6 2.0 2.1 1.8
Taxes on goods and services 46.5 51.1 52.4 49.0 38.4 38.5 37.0 38.0 37.6 34.7
Taxes on international 13.8 14.4 17.2 16.2 13.0 6.7 7.4 7.3 7.3 4.9 transactions
Other taxes 1.3 5.5 3.0 3.8 3.6 6.8 8.4 9.1 10.0 9.5
Total 100.0 100.0 100.0 100.0 100.0 100.0 100.0 100.0 100.0 100.0
Source: Ministry of Finance and Economy, Government Finance Statistics in Korea, 1980, 1991,1995, 1997, 1999.

Asia-Pacific Development Journal Vol. 7, No. 2, December 2000
89
Table 8. Characteristics of the tax structure, 1970-1997(per cent)
Direct taxes to Indirect taxes National taxes Local taxes Local taxes
total taxes1 to total taxes2 to total taxes to total taxes to GNP
1970 33.9 66.1 91.7 8.3 1.2
1971 36.9 63.1 91.9 8.1 1.2
1975 25.8 74.2 89.8 10.6 1.6
1976 29.6 70.4 90.5 9.5 1.6
1980 25.2 74.8 88.3 11.7 2.1
1981 25.7 74.3 88.9 11.1 2.0
1982 26.0 74.0 88.2 11.8 2.2
1983 24.5 75.5 87.8 12.2 2.4
1984 24.8 75.2 87.8 12.2 2.3
1985 27.8 75.2 87.8 12.2 2.1
1986 27.3 72.7 88.3 11.7 2.0
1987 29.8 70.2 88.2 11.8 2.1
1988 33.3 66.7 86.3 3.7 2.5
1989 36.5 63.5 81.8 18.9 3.5
1990 35.9 64.1 80.8 19.2 3.6
1991 35.8 64.2 79.1 20.9 3.7
1992 36.0 64.0 78.8 21.2 4.0
1993 35.7 64.3 78.1 21.9 4.1
1994 35.7 64.3 78.1 21.9 4.3
1995 37.6 62.4 78.8 21.2 4.4
1996 35.9 64.1 80.3 19.7 4.0
1997 33.8 66.2 80.3 19.7 4.3
Sources: Bank of Korea, Economic Statistics Yearbook, 1991, 1996, 1998.Ministry of Finance, Government Finance Statistics in Korea, 1991.National Bureau of Statistics, Major Statistics of the Korean Economy, 1991.
Notes: 1 The classification of direct and indirect taxes is based on national income accounts.2 General sales tax in Korea before July 1977 was the ness tax, which was replaced by
the VAT.
shown in the second column of table 8, more than 70 per cent of total tax revenues,national and local, were revenues from indirect taxes until the mid-1980s, though theshare decreased to 64 per cent in the 1990s.
What do these shares imply? They imply that taxation in the country is stillconsidered to be vertically inequitable because indirect taxes are more regressive thandirect taxes. As a matter of fact, most tax incidence research has shown that directtaxes are progressive while indirect taxes are slightly regressive.

Asia-Pacific Development Journal Vol. 7, No. 2, December 2000
90
There is considerable research on tax incidence in the Republic of Korea.Since conducting new research or a full scale analysis of tax incidence is beyond thescope of this paper, the results of previous research are summarized below.
According to previous research, indirect taxes are generally regressive, exceptfor the special excise tax. These results conform with our expectation. For example,Heller (1981), Han (1982), Hyun and La (1993), and Sung (1999) all showed suchresults (see table 9 and figure 1). For special excise tax, however, the results aresplit. Most of the research showed that the special excise tax is regressive, althoughthis tax was introduced to offset the regressiveness of the VAT. Heller’s result issomewhat mixed and should be interpreted as proportional. On the other hand, Hyunand La (1993) showed that this tax is progressive.
There is not much research on the incidence of direct taxes. Hyun and La(1993) and Sung (1999) all showed that income tax is progressive (see table 10 andfigure 2). The latter have shown that the tax burden became more regressive after thecrisis in 1997. For property tax, Kwack and others have shown that it is progressiveunder the “new” view, while it is regressive under, the “old” view (see table 11).
We have only talked about one part of equity – i.e. vertical. The country’stax system is regarded as horizontally inequitable as well. In particular, the inequalityof the tax burden between the self-employed and employees is serious. Many analyseson tax evasion showed that more than 50 per cent of the income of the self-employedis not reported while that of employees is nearly fully revealed (see Yoo 1997).
Table 9. Indirect tax burden by taxes(per cent)
Special consumption tax Liquor tax VAT Indirect tax
1984 1991 1984 1991 1984 1991 1984 1991
0.61 0.37 0.25 0.24 4.31 3.77 7.34 4.390.36 0.32 0.13 0.21 2.46 3.20 4.27 3.710.36 0.34 0.12 0.20 2.30 3.05 3.95 3.640.42 0.44 0.11 0.18 2.27 3.07 3.89 3.680.34 0.55 0.12 0.15 2.16 3.21 3.59 3.910.36 0.73 0.10 0.15 2.10 3.31 3.47 4.190.39 0.66 0.10 0.13 2.05 3.23 3.37 4.020.37 0.79 0.09 0.12 2.02 3.39 3.25 4.170.38 0.97 0.08 0.09 1.97 3.45 3.10 4.520.41 0.78 0.07 0.07 1.88 2.72 2.85 3.57
Average 0.39 0.69 0.10 0.13 2.10 3.15 3.41 3.95
Source: Hyun, J. and S. La, Analysis of Tax and Social Assistance Policy: Korean Tax-Benefit
Model, 1993.

Asia-Pacific Development Journal Vol. 7, No. 2, December 2000
91
1 2 3 4 5 6 7 8 9 10
0
0.5
1
1.5
2
2.5
3
3.5
4
4.5
5
Non-farm household
Farm household
All households
Level of income
Tax
burd
en (
per
cent
)
Source: Hyun, J. and S. La, Analysis of Tax and Social Assistance Policy: Korean Tax-Benefit
Model, 1993.
Figure 1. Burden of indirect tax (1991)
Source: Hyun, J. and S. La, Analysis of Tax and Social Assistance Policy: Korean Tax-Benefit
Model, 1993.
Figure 2. Burden of income tax 1991
1 2 3 4 5 6 7 8 9 10
0
2
4
6
8
10
12
14
Level of income
Tax
burd
en (
per
cent
)
Non-farm household
Farm household
All households

Asia-Pacific Development Journal Vol. 7, No. 2, December 2000
92
Table 10. Income tax burden 1991(per cent)
Non-farm households Farm households All households
1.10 1.04 0.911.85 0.31 1.582.49 0.41 2.142.75 0.41 2.443.24 0.53 2.864.36 0.44 3.855.60 1.72 4.876.67 1.13 5.778.32 2.07 7.14
Average 11.75 3.68 10.26Gini Index 6.64 1.74 5.79Atkinson Index 0.2907 0.3241 0.2974 = 0.5 -6.3 -1.7 -5.2
0.0725 0.0851 0.0749 = 0.9 -11.2 -3.3 -9.5
0.1269 0.1472 0.1307B-S Index -10.4 -3.0 -8.8Degree of progressiveness 0.9158 0.7328 0.8509Degree of regressiveness 0.0173 0.0810 0.0182Degree of retrogression 0.0669 0.1862 0.1308Degree of horizontal equity 0.1336 0.1523 0.0878
Source: Hyun, J. and S. La, Analysis of Tax and Social Assistance Policy: Korean Tax-BenefitModel, 1993.
Table 11. Burden of property tax 1991
(Ratio to income tax)
Level of incomeTraditional aspect New aspect
Total Land Buildings Total
Average 0.80 0.46 0.34 0.68
0.94 0.35 0.59 0.550.66 0.23 0.43 0.350.61 0.23 0.38 0.340.67 0.30 0.37 0.450.68 0.32 0.36 0.480.74 0.39 0.35 0.580.77 0.44 0.33 0.650.81 0.49 0.32 0.720.88 0.55 0.33 0.820.88 0.62 0.26 0.94
Source: Kwak and others, Reform Proposals for Property Holding Taxes – Concentrated on LandTax, Economic Policy Information Centre, 1991.

Asia-Pacific Development Journal Vol. 7, No. 2, December 2000
93
Efficiency and simplicity
It is hard to tell which tax is relatively efficient or not unless rigorous empiricalresearch is done. Unfortunately, there has been little of that. In particular, researchon the excess burden (or dead weight loss) which is essential to evaluate efficiency, isscarce. Thus, in this section, we will limit our discussion to the corporation tax byintroducing analyses on the marginal effective tax rate, which will enable us to evaluatethe distortion in resource allocation.
There is considerable research on the marginal effective tax rate and the costof capital. Since all of it cannot be introduced here, two papers will be summarizedto see the implications on the neutrality of the corporation tax in the Republic ofKorea. The first is a paper by Kwack and Yoo (1994). It extended the earlier resultsby Kwack (1985), which computed the effective tax rate essentially based upon aJorgenson-Sullivan type analysis. The effective tax rates computed in that paper arepresented in table 11.
The tax reduction effects, which are the differences between the statutoryand effective tax rates, were fairly constant until the early 1970s. They then began toincrease to a level above 10 per cent in the mid-1970s. This seems to be due to thereinforcement of tax support to key industries, particularly the tax holiday. From1982, however, the tax reduction effect began to decrease again and has been stablesince then. This decrease is mainly due to the abolition of the tax holiday.
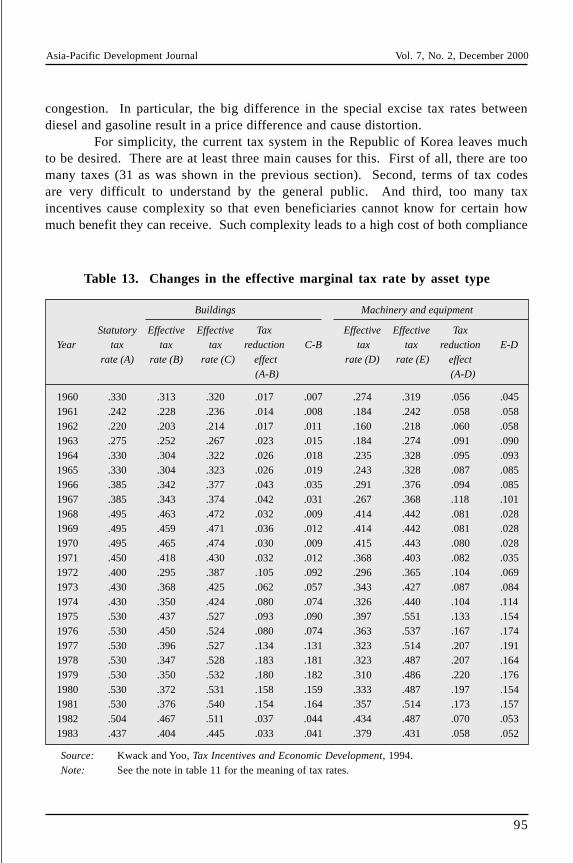
What is of interest in this paper, however, is the distortion of resourceallocation caused by tax incentives. That will be explained now. In table 13, effectivetax rates by asset type are presented. As can be clearly seen from this table, theeffective tax rates of buildings and construction are higher than those of machineryand equipment.
This is considered to be the result of the fact that most of the tax incentiveswere applied only to investments on machinery and equipment. However, since directtax incentives such as the tax holiday (reintroduced in 1975) are applied regardless ofasset type, effective rates of buildings and construction became fairly low during thelate 1970s. Although the effective rates of buildings and construction have beenhigher than those of machinery and equipment, the actual costs of capital of theformer have been lower than those of the latter. This was proven in two researches –Kwack (1985) and Kim (1991). It is argued that the tax holiday is the main reasonbehind this phenomenon (see Kim 1991 for details).
As a final discussion on efficiency, it should be mentioned that the country’staxation has not served well as a device for correcting externalities. Environmentaltaxes have not yet been introduced. The Liquor Tax and Tobacco Consumption Taxare not high enough to correct the externalities caused by drinking and smoking. Thisis why a tax rate hike on these taxes is widely discussed these days. Also, taxes onpetroleum are considered insufficient to correct the problems of pollution and

Asia-Pacific Development Journal Vol. 7, No. 2, December 2000
94
Table 12. Changes in the effective marginal tax rate (all assets)
YearStatutory tax Effective tax Effective tax Tax reduction
A-C C-Brate1 (A) rate2 (B) rate3 (C) effect (A-B)
1960 .330 .300 .319 .030 .011 .0191961 .242 215 .237 .027 .005 .0221962 .220 .189 .216 .031 .004 .0271963 .275 .227 .269 .048 .006 .0421964 .330 .281 .324 .049 .006 .0431965 .330 .284 .324 .046 .006 .0401966 .385 .328 .377 .057 .008 .0491967 .385 .319 .372 .066 .013 .0531968 .495 .436 .453 .059 .042 .0171969 .495 .434 .449 .061 .046 .0151970 .495 .438 .454 .057 .041 .0161971 .450 .395 .414 .055 .036 .0191972 .400 .311 .375 .089 .025 .0641973 .430 .369 .437 .061 -.007 .0681974 .430 .342 .435 -.002 -.005 .0031975 .530 .451 .543 .079 -.013 .0921976 .530 .428 .531 .102 -.001 .1031977 .530 .380 .517 .150 .013 .1371978 .530 .360 .503 .164 .027 .1371979 .530 .359 .504 .171 .026 .1451980 .530 .383 .508 .147 .022 .1251981 .530 .405 .530 .125 .000 .1251982 .504 .454 .502 .050 .002 .0481983 .437 .394 .439 .043 -.002 .0451984 .437 .378 .393 .059 .044 .0151985 .437 .395 .397 .042 .040 .0021986 .437 .386 .392 .051 .045 .0061987 .437 .397 .398 .040 .039 .0011988 .437 .397 .403 .041 .034 .0071989 .437 .395 .404 .042 .033 .0091990 .437 .402 .407 .035 .031 .004
Source: Kwack and Yoo, Tax Incentives and Economic Development, 1994.Notes: 1 Corporation tax rate x (1 + inhabitant tax + defence tax rate).
2 Effective tax rate considering all the tax incentives.3 Effective tax rate considering depreciation allowance only.
Asia-Pacific Development Journal Vol. 7, No. 2, December 2000
95
Table 13. Changes in the effective marginal tax rate by asset type
Buildings Machinery and equipment
Statutory Effective Effective Tax Effective Effective TaxYear tax tax tax reduction C-B tax tax reduction E-D
rate (A) rate (B) rate (C) effect rate (D) rate (E) effect
(A-B) (A-D)
1960 .330 .313 .320 .017 .007 .274 .319 .056 .0451961 .242 .228 .236 .014 .008 .184 .242 .058 .0581962 .220 .203 .214 .017 .011 .160 .218 .060 .0581963 .275 .252 .267 .023 .015 .184 .274 .091 .0901964 .330 .304 .322 .026 .018 .235 .328 .095 .0931965 .330 .304 .323 .026 .019 .243 .328 .087 .0851966 .385 .342 .377 .043 .035 .291 .376 .094 .0851967 .385 .343 .374 .042 .031 .267 .368 .118 .1011968 .495 .463 .472 .032 .009 .414 .442 .081 .0281969 .495 .459 .471 .036 .012 .414 .442 .081 .0281970 .495 .465 .474 .030 .009 .415 .443 .080 .0281971 .450 .418 .430 .032 .012 .368 .403 .082 .0351972 .400 .295 .387 .105 .092 .296 .365 .104 .0691973 .430 .368 .425 .062 .057 .343 .427 .087 .0841974 .430 .350 .424 .080 .074 .326 .440 .104 .1141975 .530 .437 .527 .093 .090 .397 .551 .133 .1541976 .530 .450 .524 .080 .074 .363 .537 .167 .1741977 .530 .396 .527 .134 .131 .323 .514 .207 .1911978 .530 .347 .528 .183 .181 .323 .487 .207 .1641979 .530 .350 .532 .180 .182 .310 .486 .220 .1761980 .530 .372 .531 .158 .159 .333 .487 .197 .1541981 .530 .376 .540 .154 .164 .357 .514 .173 .1571982 .504 .467 .511 .037 .044 .434 .487 .070 .0531983 .437 .404 .445 .033 .041 .379 .431 .058 .052
Source: Kwack and Yoo, Tax Incentives and Economic Development, 1994.Note: See the note in table 11 for the meaning of tax rates.
congestion. In particular, the big difference in the special excise tax rates betweendiesel and gasoline result in a price difference and cause distortion.
For simplicity, the current tax system in the Republic of Korea leaves muchto be desired. There are at least three main causes for this. First of all, there are toomany taxes (31 as was shown in the previous section). Second, terms of tax codesare very difficult to understand by the general public. And third, too many taxincentives cause complexity so that even beneficiaries cannot know for certain howmuch benefit they can receive. Such complexity leads to a high cost of both compliance

Asia-Pacific Development Journal Vol. 7, No. 2, December 2000
96
and administration. These, in turn, become one of the sources of tax evasion andcorruption.
III. SUGGESTIONS FOR FUTURE REFORM
Simplification of the tax system
As was pointed out in the previous section, a complex tax structure is one ofthe most distinguishing characteristics of the Republic of Korea, with 16 nationaltaxes and 15 local taxes. It is argued that the country has too many taxes, and sometaxes contribute little to revenue size, as shown in table 6. Excess profits tax andfarmland tax are good examples. Some taxes do not play an important role as policytools, such as the excessively-increased value tax. Also, some taxes, like the butcherytax, would be better named as fees than as taxes. Earmarked taxes are another sourcethat makes the country’s tax system so complicated. They are a sort of surtax leviedon other tax amounts. For example, Special Tax for Rural Development is a surtaxlevied on the amount of exemption of corporation tax, individual income tax, customsduties, etc. The necessity for tax simplification has long been argued. In 1997, theKorea Institute of Public Finance proposed a tax reform to reduce the number of taxesfrom 31 to 13 (see figure A2 in annex and KIPF reform proposal for details).
Another source of the complex tax system is tax incentives. As was indicated,the structure of tax exemptions and reductions is very complicated and difficult tointerpret. It leads to a low level of tax compliance by taxpayers. Therefore, it isnecessary to abolish so many unnecessary incentives.
Reform of the VAT
Small businesses have been specially treated under the VAT system, sinceVAT was introduced in the country, as in most other countries with VAT. They weregiven special consideration to reduce the cost of tax compliance.
There are two types of special treatment for small businesses; one is asimplified method and the other is a special method. The simplified method is appliedto small businesses that have between 48 million won and 150 million won in turnoverper year. The value-added ratios for this group are predefined according to types ofbusiness by the tax authority. For example, manufacturing has a value-added ratio of22 per cent, and restaurants and hotels have a value-added ratio of 50 per cent.These ratios are, in general, lower than the real value-added ratio. Thus the samevalue-added ratio is applied to the same businesses, irrespective of the real situationof each business. The other method is the special method, which is applied to smallbusinesses with less than 48 million won in turnover per year. This group has a taxliability of 2 per cent of total turnover. It means that this group has a value-addedratio of 20 per cent, irrespective of the type of industry or personal situation. Within

Asia-Pacific Development Journal Vol. 7, No. 2, December 2000
97
the special method, no tax liability is applied to groups that have less than 26 millionwon in total turnover per year.
Table 14 shows the number of taxpayers and the relative size of the tax basefor the group receiving special treatment under VAT. In 1997, around 60 per cent ofthe total VAT taxpayers were considered small businesses and benefited from thespecial treatment in VAT. However, their share in the tax base was only 1.7 per cent.Thus, even though small business groups are very plentiful, their contribution is almostnothing. The reason for the large number of taxpayers receiving special treatmentis that the tax authority is hard pressed to prove the exact size of total turnover foreach business, since the businesses are more dependent on cash than on personalchecks and credit cards. This is why self-employed businesses have a high level ofunder-reporting.
Invoices are very important records for cross-checking tax evasion under theVAT system. One distinguishing aspect is that small businesses receiving specialtreatment do not have to issue invoices with transactions. That is because theirvalue-added ratios are already determined by the tax authority. Also, small businessesunder special treatment do not want to receive invoices with their purchases, as theyrun the risk of letting the tax authorities know the exact size of their turnover if theyreceive invoices. It makes tax evasion possible for all taxpayers under the VATsystem, since small businesses with no obligation of invoicing can be used as a methodof tax evasion by others.
It has been widely criticized that the special treatment of small businesses inthe VAT system is a crucial source for tax evasion. Although the special treatmentwas designed to help small businesses, an unexpected consequence is a high level oftax evasion. Therefore, special treatment must be abolished. It might have to be
Table 14. VAT return (taxpayers and tax base) by tax types(per cent)
Taxpayers Tax Base
Individual Individual
Year Corporation Special Corporation
General Simplified Total No tax General Simplified Special
1993 5.2 34.6 _ 60.2 11.1 78.3 19.7 _ 2.11994 5.6 39.1 _ 55.3 18.0 78.3 19.9 _ 1.91995 5.9 43.7 _ 50.4 34.3 79.1 19.3 _ 1.61996 6.6 35.9 10.6 46.9 40.0 79.9 18.0 0.6 1.61997 6.6 34.3 16.7 42.4 36.9 81.2 16.1 1.2 1.5
Source: National Tax Administration, various years.

Asia-Pacific Development Journal Vol. 7, No. 2, December 2000
98
done gradually or step-by-step to lessen possible political resistance by the affectedgroups.
Comprehensive income tax
It has long been argued that comprehensive income tax is the most desirableform of income tax, setting aside the debate on comprehensive income tax vs personalexpenditure tax. This “principle” must be true of the Republic of Korea as well.Income tax in the country, however, is far from comprehensive.
Currently, there are four different types of income – interest, dividend,retirement, and forestry – which are excluded from global income. Existence of suchseparately taxed income types has undesirable effects, particularly on equity. Sinceincome tax is progressive, the total tax burden will be lower, the larger part of incomeis taxed separately. Thus, the introduction of the comprehensive income tax is desirable.In particular, inclusion of interest income is important in relation to real name basedfinancial transactions.
Realization of self-assessment
All the tax systems became administered by self-assessment, afterself-assessment was introduced in individual income tax in 1996. Even though thesystem was changed to self-assessment, the actual management has tended to be bythe government. A typical example is that the tax authority makes predeterminedtables that show the annual turnover and the level of income by type of business.Also, the tax authority has made this table available to taxpayers. Under thismechanism, taxpayers would report their turnover and income by just following theirgroup guidelines of the amounts for their turnover and income. In addition, there isno incentive for the self-employed group to report their turnover and income honestly.Thus, predetermined tables must be abolished (or made unavailable to taxpayers), andthe system should be switched to a true self-assessment system.
CONCLUSION
In this paper, the past tax reforms in the Republic of Korea have been describedand evaluated. It has been shown that although many tax reforms have been donethey have not been entirely successful. This does not mean that the current taxsystem as a result of such reforms is a failure. Rather, we have to interpret that thereis much room for further development of the current system.
As was shown in section III, the country’s tax system does not seem tocontribute much to the provision of funds for public goods. Although it did contributeto the rapid economic growth of the country, the scope of the contribution has beenlimited. Factors that made these contributions possible – most notably tax incentives

Asia-Pacific Development Journal Vol. 7, No. 2, December 2000
99
– simultaneously caused some inefficiency to creep in and increased the complexityof the tax system. Also, there is much room for improvement as far as tax equity isconcerned.
There are several proposals to simplify the tax system, such as reform VATby abolishing special treatment, introduce a comprehensive income tax and realize aself-assessment system. Of course, these do not comprise the whole reform agenda,but are a major part of it.
In this paper, no attempt was made to add a new analysis or evaluation ofpast tax reforms. Instead, a survey of previous research was done. Conductingrigorous research – theoretical and empirical – on them is left for the future.
Since the economic environment of each country differs, one country’sexperience with tax reforms might not be directly applicable to other countries. Theexperience of the Republic of Korea, however, can be a good reference for tax reformsbeing undertaken, or likely to be undertaken, by other countries in the region.
Asia-Pacific Development Journal Vol. 7, No. 2, December 2000
100
REFERENCES
Cho, Y. and J. Kim, 1994. Credit Policies and the Industrialization of Korea, mimeo.
Choi, K., and S. Han, 1992. “Tax policy and tax reforms”, Public Finance in Korea, The Korean Societyof Public Finance ed. (Seoul National University Press).
Cooper, R., 1994. “Fiscal policy in Korea,” in Stephan Haggerd and others eds., Macroeconomic Policyand Adjustment in Korea 1970-1990 (Harvard Institute for International Development).
Han, S., 1982. The Measurement of Tax Burden and Optimal Tax Rate (Korea Economic Institute).(in Korean)
Heller, S., 1981. “Testing impact of value-added and global income tax reforms on Korean tax incidencein 1976: input-output and sensitivity analysis,” IMF Staff Papers, vol. 28, No. 2, June 1981.
Hyun, J., 1999. Tax Administration in Korea: Policy Issues and Directions for Reform (Korea Institute ofPublic Finance).
Hyun, J., and S. La, 1993. Analysis of Tax and Social Assistance Policy: Korean Tax-Benefit Model(Korea Institute of Public Finance).
Kim, J., 1991. “A study on the cost of capital and the effective corporate tax rate of Korean firms,”Korea Development Institute Discussion Paper 91-32, (in Korean).
Krueger, A.O., 1992. Comment on “The role of tax policy in Korea’s economic growth,” in The PoliticalEconomic of Tax Reform, ed. Ito T., and Krueger A.O. (The University of Chicago Press).
Kwack, T., 1984. “Investment incentives in Korean tax system and their economic effect,” in K. Choi ed.,Major Issues and New Direction in Korean Taxation, (Korea Development Institute).(in Korean).
_______ , 1985. Tax Depreciation System and Corporate Investment Behaviour, Korea DevelopmentInstitute, 1985. (in Korean)
Kwack, T., and I. Yoo, 1984. Tax Incentives and Economic Development (Korea Development Institute).
Kwack, T. and others, 1991. A Study on the Rationalization of the Property Tax (National Institute forEconomic System and Information). (in Korean)
Korea Institute of Public Finance, 1997. Reform Proposal in Tax System and Tax Administration.(in Korean)
Ministry of Finance and Economy, Government Finance Statistics in Korea, 1980, 1991, 1995, 1997,1999.
Ministry of Finance and Economy, 1999. Korean Taxation.
National Bureau of Statistics, 1998. Major Statistics of the Korean Economy.
National Statistical Office, Korean Statistical Information System.
National Tax Service, Statistical Yearbook of National Tax, various years.
Sung, M., 1999. Estimating Tax Evasion of Global Income Tax and VAT of Korea (Korea Institute ofPublic Finance).
Trella, I., and J. Whalley, 1991. “Outward orientation, and growth performance in the Republic of Korea”,in Tax Policy in Developing Countries, ed., J. Khalizadeh Shirazi and A. Shah, Washington DC.

Asia-Pacific Development Journal Vol. 7, No. 2, December 2000
101
_______ , 1992. “The role of tax policy in Korea’s economic growth”, The Political Economy of TaxReform, ed., Takatoshi Ito and Anne O. Krueger (The University of Chicago Press).
Yoo, I., 1995. “Reform of the Korean Tax Incentive System After Uruguay Round,” 1995 KDI PolicyReport. (in Korean)
_______ , 1997. “An estimate of the tax evasion in Korea: income and value added taxes”, WorkingPaper 97-03 (Korea Institute of Public Finance).
_______ , 1998. “Tax incentives in Korea: a survey”, mimeo (Korea Institute of Public Finance).
Yun, K.Y. and J. Kim, 1997. “Effective marginal tax rate of corporate investment in Korea,” KoreaJournal of Public Economics, vol. 2, Korean Association of Public Economics. (in Korean)
Asia-Pacific Development Journal Vol. 7, No. 2, December 2000
102
Annex
Tax incentives
In the early phase of the country’s development, tax incentives played arelatively limited role in influencing business investment behaviour, largely becauseof the prevailing market imperfections. It was only after 1966, the year in which theNational Tax Administration was established, that tax incentives began to play asignificant role in the country’s economic development.
In the 1970s, more diversified and sophisticated tax incentives were providedduring the course of the so-called heavy industrialization phase, while incentives forexport promotion were actually reduced in the early 1970s. During that decade, eventhough direct allocation continued to play a major role, in line with the increasingreliance of the government on market forces in the allocation of resources, tax incentivepolicies began to receive increasing emphasis. In 1974 there was a major tax reformand all major incentives were unified and rearranged under the title of “Special TaxTreatment for Key Industries” in the Tax Exemption and Reduction Control Law(TERCL).
In the 1980s, tax incentives began to be used less than before under theperception that they were being abused. First, some industries were deleted from thebeneficiary list. The 60 per cent special depreciation system was completely abolished.The tax holiday option was abolished and the investment tax credit option was confinedonly to the machinery and electronics industries. At the same time, the investmenttax credit rate was reduced to 6 per cent (10 per cent for investments using domesticcapital goods) from 8 per cent (10 per cent). Effective from 1983, it was againhalved to 3 per cent (5 per cent for investments using domestic capital goods) reflectingthe downward adjustment of the statutory corporation tax rate.
After the Uruguay Round and the subsequent launch of the WTO, theaforementioned trend of the reduction of tax incentives was accelerated. Even withthese and other unexplained changes, however, many tax incentives are still in effecttoday. For example, there are major incentives such as reserves for investment forsmall and medium-sized enterprises, investment tax credits, and various incentives forthe induction of foreign direct investment.

Asia-Pacific Development Journal Vol. 7, No. 2, December 2000
103
Direct taxes
Ordinarytaxes
Earmarkedtaxes
Ordinarytaxes
Earmarkedtaxes
Internal taxes
Income taxCorporation taxInheritance taxGift taxAssets revaluation taxExcess profits tax
Value added taxSpecial excise taxLiquor taxTelephone taxStamp taxSecurities transaction tax
Transportation taxEducation taxSpecial tax forrural development
Acquisition taxRegistration taxRace-parimutuel taxLicense tax
Community facility taxRegional development tax
Inhabitant taxProperty taxAutomobile taxFarmland taxButchery taxTobacco consumption taxAggregate land tax
Urban planning taxBusiness place tax
Customs duties
Earmarked taxes
Indirecttaxes
Provincialtaxes
City andcounty taxes
Nationaltaxes
Local taxes
Figure A1. The tax system of the Republic of Korea

Asia-Pacific Development Journal Vol. 7, No. 2, December 2000
104
Figure A2. KIPF Reform proposal in the tax structure
Source: KIPF (1997).Note: (C): Continuance; (M): Merge; (A): Abolition.
Income tax (C)
Corporation tax (C)
Excessive increased value of land tax (A)
Inheritance & gift tax (C)
Revaluation tax (A)
Excess profit tax (M)
Value added tax (C)
Special excise tax (M)
Liquor tax (M)
Telephone tax (M)
Stamp tax (C)
Securities transaction tax (C)
Education tax (M)
Special tax for rural development (M)
Transportation tax (M)
Customs duties (C)
Acquisition tax (M)
Registration tax (M)
License tax (C)
Race tax (M)
Inhabitant tax
Property tax (M)
Aggregate land tax (M)
Farmland tax (M)
Tobacco consumption tax (M)
Butchery tax (A)
City planning tax (M)
Community facility tax (M)
Business place tax
Regional development tax (C)
Individual income tax
Corporation income tax
Inheritance & gift tax
Stamp tax
Securities transaction tax
Value added tax
Sales tax
Per capita (A)
Pro rate income (M)
Property portion (M)
Employee portion (M)
Directtax
Nationaltax
Indirecttax
Earmarktax
Generaltax
Earmarktax
Customs duties
Acquisition tax
License tax
Local income tax
Property owning tax
Regional development tax
Localtax