experience with best management practices in colorado …redac.eng.usm.my/ead/ead512/conference...
TRANSCRIPT

EXPERIENCE WITH BEST MANAGEMENT PRACTICES
IN COLORADO
Sponsored by:
Colorado Association of Stormwater and Floodplain Managers Urban Drainage and Flood Control District
April 9, 2003
Denver, Colorado

EXPERIENCE WITH BEST MANAGEMENT PRACTICES
IN COLORADO
Sponsored by: Colorado Association of Stormwater and Floodplain Managers
Urban Drainage and Flood Control District
April 9, 2003 Holiday Inn, Northglenn, Colorado

ACKNOWLEDGEMENT The sponsoring agencies, Urban Drainage and Flood Control District and Colorado Association of Stormwater and Floodplain Managers, wish to acknowledge the efforts of the following individuals in organizing this conference on Stormwater Best Management Practices.
Julie Ash Walsh Environmental Scientists & Engineers, LLC Jonathan Jones Wright Water Engineers, Inc. Lisa Klapper Wright Water Engineers, Inc. Peter Kozinski Colorado Department of Transportation Kevin McBride City of Fort Collins, Stormwater Utilities Bill Ruzzo William P. Ruzzo, PE, LLC Ben Urbonas Urban Drainage and Flood Control District Jim Wulliman Muller Engineering Company
i
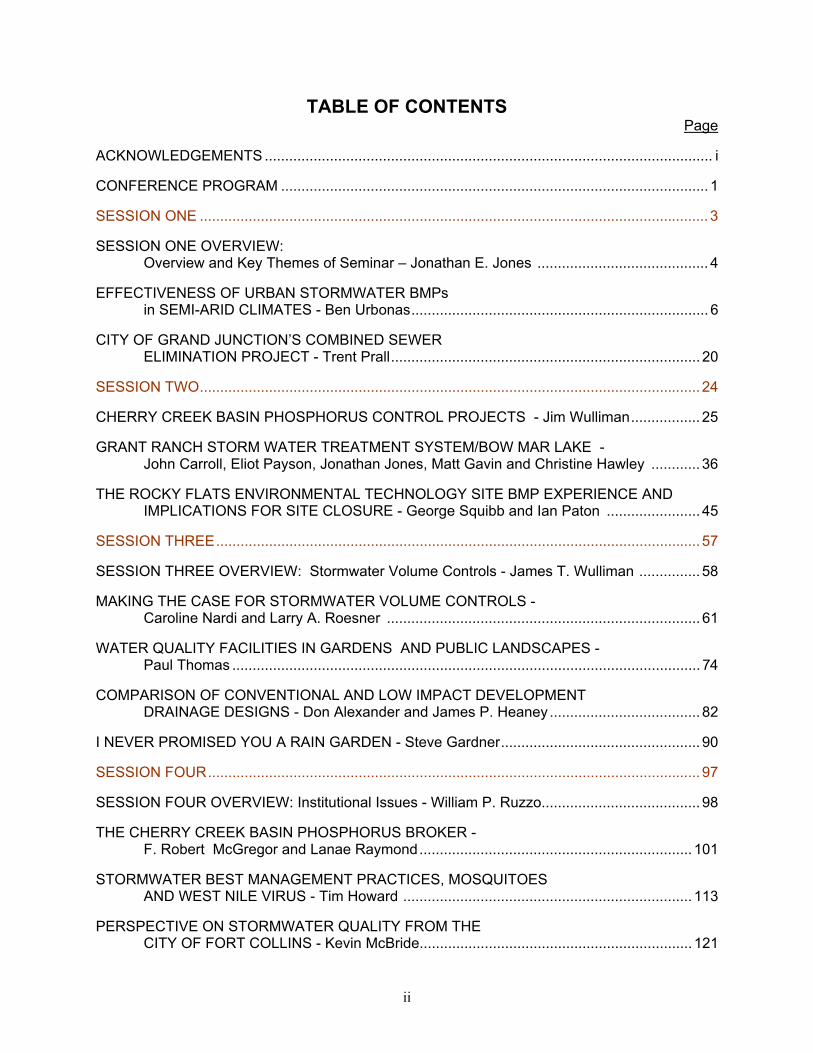
TABLE OF CONTENTS Page
ACKNOWLEDGEMENTS .............................................................................................................. i
CONFERENCE PROGRAM ......................................................................................................... 1
SESSION ONE ............................................................................................................................. 3
SESSION ONE OVERVIEW: Overview and Key Themes of Seminar – Jonathan E. Jones .......................................... 4
EFFECTIVENESS OF URBAN STORMWATER BMPs in SEMI-ARID CLIMATES - Ben Urbonas......................................................................... 6
CITY OF GRAND JUNCTION’S COMBINED SEWER ELIMINATION PROJECT - Trent Prall............................................................................ 20
SESSION TWO........................................................................................................................... 24
CHERRY CREEK BASIN PHOSPHORUS CONTROL PROJECTS - Jim Wulliman................. 25
GRANT RANCH STORM WATER TREATMENT SYSTEM/BOW MAR LAKE - John Carroll, Eliot Payson, Jonathan Jones, Matt Gavin and Christine Hawley ............ 36
THE ROCKY FLATS ENVIRONMENTAL TECHNOLOGY SITE BMP EXPERIENCE AND IMPLICATIONS FOR SITE CLOSURE - George Squibb and Ian Paton ....................... 45
SESSION THREE....................................................................................................................... 57
SESSION THREE OVERVIEW: Stormwater Volume Controls - James T. Wulliman ............... 58
MAKING THE CASE FOR STORMWATER VOLUME CONTROLS - Caroline Nardi and Larry A. Roesner ............................................................................. 61
WATER QUALITY FACILITIES IN GARDENS AND PUBLIC LANDSCAPES - Paul Thomas ................................................................................................................... 74
COMPARISON OF CONVENTIONAL AND LOW IMPACT DEVELOPMENT DRAINAGE DESIGNS - Don Alexander and James P. Heaney..................................... 82
I NEVER PROMISED YOU A RAIN GARDEN - Steve Gardner................................................. 90
SESSION FOUR......................................................................................................................... 97
SESSION FOUR OVERVIEW: Institutional Issues - William P. Ruzzo....................................... 98
THE CHERRY CREEK BASIN PHOSPHORUS BROKER - F. Robert McGregor and Lanae Raymond................................................................... 101
STORMWATER BEST MANAGEMENT PRACTICES, MOSQUITOES AND WEST NILE VIRUS - Tim Howard ....................................................................... 113
PERSPECTIVE ON STORMWATER QUALITY FROM THE CITY OF FORT COLLINS - Kevin McBride................................................................... 121
ii

CONFERENCE PROGRAM EXPERIENCE WITH BEST MANAGEMENT PRACTICES (BMPs) IN COLORADO
April 9, 2003
Holiday Inn, Northglenn
SESSION 1: INTRODUCTION AND OVERVIEW (Moderator: Jonathan Jones, P.E., Wright Water Engineers, Inc.) 8:15-8:25 A.M. Overview and Key Themes of Conference Jonathan Jones, P.E. Wright Water Engineers, Inc. 8:25-8:35 A.M. Perspective of UDFCD Scott Tucker, P.E. UDFCD 8:35-8:45 A.M. Perspective of CASFM Stuart Gardner, P.E. Colo. Dept. of Transportation 8:45-9:15 A.M. Effectiveness of Urban Stormwater Best Ben Urbonas, P.E. Management Practices in Semi-Arid UDFCD Climates 9:15-9:45 A.M. City of Grand Junction’s Combined Trent Prall, P.E. Sewer Elimination Project City of Grand Junction
9:45-10:15 A.M. BREAK
SESSION 2: BMP PERFORMANCE DATA (Moderator: Peter Kozinski, P.E., Colorado Department of Transportation) 10:15-10:45 A.M. Cherry Creek Basin Phosphorus Jim Wulliman, P.E. Control Projects Muller Engineering Company 10:45-11:15 A.M. Grant Ranch Stormwater Treatment John Carroll, P.E. System/Bow Mar Lake Carroll & Lange Eliot Payson Bow Mar Homeowners, Inc. Matt Gavin Wright Water Engineers, Inc. 11:15-11:45 A.M. The Rocky Flats Environmental Technology George Squibb Site BMP Experience and Implications URS Corporation For Site Closure Ian Paton Wright Water Engineers, Inc.
1

11:45-1:00 P.M. LUNCH
LUNCHTIME SPEAKER: J. PALMER HUTCHESON, ESQ. SENIOR PARTNER
GARDERE, WYNNE, SEWELL, L.L.P. HOUSTON, TEXAS
“LONGHORNS UNDER WATER”
SESSION 3: STORMWATER VOLUME CONTROLS (Moderator: Jim Wulliman, P.E., Muller Engineering Company) 1:00-1:30 P.M. Making the Case for Stormwater Larry Roesner, Ph.D., P.E.
Volume Controls Colorado State University
1:30-2:00 P.M. Water Quality Facilities in Gardens Paul Thomas and Public Landscapes Wenk Associates
Comparison of Conventional and Jim Heaney, Ph.D., P.E. Low Impact Development Drainage University of Colorado Designs
2:00-2:30 P.M. I Never Promised You a Rain Garden Steve Gardner, P.E. Arapahoe County 2:30-3:00 BREAK SESSION 4: INSTITUTIONAL ISSUES (Moderator: Bill Ruzzo, P.E., William P. Ruzzo, PE, LLC) 3:00-3:30 P.M. The Cherry Creek Basin Lanae Raymond, P.E. Phosphorus Broker Arapahoe County Bob McGregor, Ph.D., P.E. Water & Waste Engineering 3:30-4:00 P.M. Stormwater Best Management Tim Howard Practices, Mosquitoes, and West Colorado Mosquito Control, Inc. Nile Virus 4:00-4:30 P.M. Perspective on Stormwater Kevin McBride, P.E. Quality from the City of Fort Fort Collins Utilities Collins 4:30 P.M. END OF CONFERENCE
2

SESSION ONE
3

SESSION ONE OVERVIEW: Overview and Key Themes of Seminar
Experience with Urban Stormwater Best Management Practices (BMPs) in Colorado
Jonathan E. Jones1
Wright Water Engineers, Inc. (WWE) The purpose of this conference is to share experiences regarding urban stormwater BMP performance in Colorado. When the conference organizing committee first met, we thought that the papers should primarily focus on presenting BMP pollutant removal data. However, two facts quickly caused us to broaden the subject matter:
• A scarcity of reliable BMP performance data in Colorado. • The realization that “performance” encompasses far more than merely pollutant
removal efficiency, and must include (as examples): hydrologic function, mitigation of adverse receiving water impacts, appearance, public acceptance/rejection issues, regulatory compliance, public safety, tendency to promote mosquitoes and many others.
What resulted is the outstanding collection of papers that are attached, which are divided into four sessions. The first session provides a broad introduction to the subject, featuring introductory remarks from L. Scott Tucker, P.E. of the Urban Drainage and Flood Control District (UDFCD) and Stuart Gardner, P.E. of the Colorado Department of Transportation (CDOT), speaking on behalf of the Colorado Association of Stormwater and Floodplain Managers (CASFM). All of us who attend the April 9, 2003 conference and/or who read these proceedings are indebted to UDFCD and CASFM, as they are the conference co-sponsors. Messrs. Tucker and Gardner offer the perspectives of their organizations with their introductory remarks. They are followed by two outstanding, broad-brush papers, the first by Ben Urbonas, P.E., Chief of Master Planning of the UDFCD, followed by Trent Prall, P.E., with the City of Grand Junction. Ben Urbonas has provided an exceptional overview of the subject matter, and his paper should be disseminated far beyond the confines of this conference. Trent Prall’s paper nicely captures the perspectives of the multiple Phase II Stormwater Discharge Regulation permittees in Colorado.
The second session presents actual numeric performance data, featuring three provocative case studies. Jim Wulliman, P.E. of Muller Engineering provides a thorough overview of BMPs in the highly visible Cherry Creek Basin. John Carroll, P.E. of Carroll and Lange, Matt Gavin of Wright Water Engineers, Inc. (WWE), Christine Hawley of WWE and Eliot Payson of the Bow Mar Homeowners, Inc. have summarized a progressive stormwater treatment system at the Grant Ranch residential development in Littleton, which was designed to protect water quality in Bow Mar Reservoir. George Squibb of Kaiser-Hill and Ian Paton, P.E. of WWE summarize the enormous pollutant removal dataset for the stormwater treatment system at the Rocky Flats Environmental Test Site, and provide an update of what long-term water management at the site will consist of, upon its successful closure.
We are fortunate to have an entertaining and enlightening lunchtime speaker, Palmer Hutcheson, senior partner with one of the top law firms in Texas: Gardere Wynne. Mr. Hutcheson’s talk, “Longhorns Under Water” provides valuable recommendations of
4

which all of us need to be highly cognizant. After listening to Mr. Hutcheson present, you will quickly conclude that you want to be sure that he is on your side rather than the opposing side!
The third session, with papers by Larry Roesner, Ph.D., P.E. (Colorado State University), Paul Thomas (Wenk Associates), Jim Heaney, Ph.D., P.E. (University of Colorado-Boulder) and Steve Gardner, P.E. (Arapahoe County) drives home a critically important point: reducing pollutant levels, alone, is not adequate when we design and implement urban stormwater BMPs. Instead, we must also address mitigation of the adverse hydrologic impacts caused by urbanization with innovative techniques that promote on-site storage, encourage infiltration, minimize directly connected impervious area, lengthen travel times and, in general, reduce peak discharges. The broad class of measures described within these papers, alternatively described as “low impact development,” “better site design,” “minimizing directly connected impervious area (MDCIA)” or other names will undoubtedly become increasingly popular in Colorado. These techniques have been strongly endorsed by the U.S. Environmental Protection Agency (USEPA). In conjunction with source controls and larger, regional facilities, techniques of this kind can be very valuable for protecting receiving water integrity. The fourth session, with papers by Lanae Raymond, P.E. (Arapahoe County), Bob McGregor, Ph.D., P.E. (Water & Waste Engineering), Tim Howard (Colorado Mosquito Control, Inc.) and Kevin McBride, P.E. (Fort Collins Utilities) covers wide-ranging instutitional and public reaction topics. It is vitally important to recognize that no matter how carefully conceived, designed and constructed BMPs are at any particular site, if important issues and concerns of the public are not fully accounted for, the BMPs will not be viewed as successful. All of us who were involved with planning and organizing this conference sincerely hope that you find the April 9th presentations and discussion to be interesting and beneficial. We extend particular thanks to:
• UDFCD and CASFM, the conference co-sponsors • Julie Ash, P.E., of Walsh Environmental and Lisa Klapper of WWE, who have
done an outstanding job of editing these proceedings • Frankie Lane of WWE for her significant work regarding conference
administration • The outstanding administrative staff of the UDFCD, who have played a major role
in formulating yet another successful conference • The Colorado Chapter of the American Public Works Association, which helped
with conference publicity • The conference organizing committee, including: Ben Urbonas, P.E., Jim
Wulliman, P.E., Bill Ruzzo, P.E., Peter Kozinski, P.E., Kevin McBride, P.E., Julie Ash, P.E., Lisa Klapper and Jonathan Jones, P.E.
1 Jonathan E. Jones is a Professional Engineer and Chief Executive Office of Wright Water Engineers, Inc., where he has been working for 22 years.
5

EFFECTIVENESS OF URBAN STORMWATER BMPs IN SEMI-ARID CLIMATES
Ben R. Urbonas, P.E.1
Chief, Master Planning and South Platte River Programs Urban Drainage and Flood Control District
2480 W. 26th Avenue, Suite 156-B, Denver, CO, 80209
ABSTRACT The phenomena of land-use changes, including urbanization, impacting the physical and biologic integrity of the receiving waters are discussed in this paper. The observed and reported impacts are tied to the types of structural stormwater best management practices (BMPs) that have the greatest potential in mitigating them in the semi-arid climates as experienced in Colorado and other states and regions that have similar climatic conditions. In addition, topics related to clogging of filtering and infiltrating systems, underground vs. above ground facilities, water quality capture volume vs. flow-through facilities, details of what makes extended detention basins function best and the basis for comparing “effectiveness” of BMPs are addressed in this paper.
INTRODUCTION Virtually no one argues anymore that land use changes that increase site imperviousness or reduce rainfall-infiltration/interception capacity have an impact on receiving gulches, streams, rivers and lakes of the nation. The degree of these impacts appears to be related to the intensity of the land use change, local climate, site geology and the nature of the receiving water. When a tract of rangeland changes to a single-family residential land use, we estimate that the receiving waters in the Colorado’s high plains region see the following changes:
Annual: Before After Increase Runoff Volume 0.52 3.61 700% Number of Runoff Events < 1.0 29+ >3000% Load of TSS, & TP >500%
6

What this table does not reveal is that most of the 29+ runoff events represent an increase from zero to some measurable values in peak and volume, namely an infinite ratio since the starting value is zero. The most obvious and immediate impacts that we visually observe are the geomorphic changes in the receiving gulches, streams and rivers (see Figure 1).
10 to 15-
Figure 1. Channel degradation at Marcy Gulch. At the August 2002 gathering of experts from around the world in Snowmass Village, Colorado the topic of “Linking Stormwater BMP Designs and Performance to Receiving Water Impact Mitigation” (Urbonas, 2002) was addressed and debated in much detail. The general themes (virtually a consensus) that emerged from this gathering support the above-stated observations for the Colorado’s high plains region. The consensus is that land use changes that reduce rainfall abstractions and increase surface runoff increase the rates and volumes of storm runoff, increase the numbers of runoff events, increase the annual pollutant loads and modify the physical and biologic nature of the receiving waters. The physical changes that occur to our receiving waters also result in changes to aquatic and adjacent terrestrial habitat and their biologic integrity (See Figure 2).
010
2030
4050
6070
8090
100
0 100000 200000 300000 400000
(% TIA)*(100 - % Forest and Wetland cover)*(100-%IRI)
Mac
roin
verte
brat
e In
dex
(% o
f Max
imum
)
25920960375
* *Good Integrity
Poor Integrity
Fair Integrity
Figure 2. Changes in Macroinvertebrate Index in Austin, Texas with increasing degree of urbanization in a watershed. (Horner, 2001)
7

Of most interest to the professionals that manage our water resources and local waterways, were the following three observations that emerged from this conference:
1. Regardless of the location on earth, changes in biology and physical nature of receiving waters are virtually inevitable as land uses change.
2. Watershed-wide use of BMPs to control runoff rates and/or volumes can reduce
the degree of these impacts. (See Figure 3)
0102030405060708090
100
0 10 20 30 40 50 60
Number of Structural BMPs/Impervious km2
(degree watershed is served by rate and volume controlling BMPs)
Mac
roin
verte
brat
e In
dex
(% o
f Max
.)
TIA = 6.6%TIA = 8.3%
TIA = 36.2%
TIA = 26.0%
TIA = 36.6%
TIA = 6.0%
Figure 3. Biologic Index vs. Structural BMP Density. (Horner, 2001)
3. Stabilizing of receiving streams as lands begin to urbanize is essential in limiting stream bank and bed erosion and loss of aquatic habitat. (See Figure 4)
Figure 4. Grade control and soil-riprap stabilized bank - Rock Creek, Superior, Colorado. WHAT SHOULD “EFFECTIVE” BMPs DO? Assuming the reason we use BMPs is to help mitigate the impacts of urbanization on our receiving waters, the BMPs we select will need, as a minimum, to do the following:
1. Control rates of runoff from the large numbers of new, smaller runoff events seen in urban areas to very low rates of flow. This reduces, but does not eliminate, the erosive energies experience by the receiving streams and the erosion they cause.
8

2. Reduce runoff volumes from the new population of small runoff events, thus reducing the pollutant loads delivered by stormwater to receiving waters.
3. Remove from the water column, as much as practicable, Total Suspended Sediment (TSS) particles smaller than 60 µm found in the stormwater column.
4. Integrate structural BMPs into the fabric of the community by providing multi-use opportunities, minimizing nuisances associated with them (e.g., mosquitoes) and making sure they are readily maintainable when visual evidence indicates a need for such maintenance.
The criteria recommended in the Urban Drainage and Flood Control District’s (District) Volume 3 of the Urban Storm Drainage Criteria Manual (Manual) (UDFCD, 1999) have been developed with all of these principles in mind. In addition, looking further down the road, should the Total Maximum Daily Load (TMDL) process mandate that numeric water quality limits be met, the BMPs recommended in the Manual will provide the space to modify these BMPs so as to address these mandates and, hopefully, meet them. The various post-development BMPs recommended in the Manual are based on the following fundaments principles:
1. Reduce the accumulation of pollutants on the urban landscape through public education and other practices that encourage
a. proper disposal of household waste and pollutants
b. proper use of pesticides, herbicides, fertilizers, etc.
c. control of pet waste
d. aggressive erosion and sediment control during construction
2. Reduce surface runoff volumes as much as practicable
3. Fully capture and treat 80% of all stormwater runoff events (annual average) and the “first flush” of larger storms
4. Remove small TSS particles and associated pollutants from the stormwater column before discharging to the receiving waters
5. Appropriate industrial site management to keep rainfall and runoff from coming into contact with products and chemicals that may pollute the runoff
6. Be accessible and visible for easy inspection and maintenance. Let’s examine items 2, 3 and 4 further. Reducing Stormwater Runoff Volume The literature is full of terms such as “Smart Growth”, “Low Impact Development”, “Sustainable Development”, etc. All of these terms refer to a family of stormwater management practices that promote the reduction of runoff volume from urban areas. The first step in stormwater quality management in the Manual recommends reducing runoff volumes through the use of “Minimized Directly Connected Impervious Areas” (MDCIA). This set of practices in nothing less than what is being recommended by the terms described above. The District’s Manual has been advocating these practices
9

since before 1994 and has specific design recommendations for the following runoff volume reducing BMPs:
1. Grass Swale (GS)
2. Grass Buffer (GB)
3. Modular Block Porous Pavement (MBP)
4. Porous Landscape Detention (PLD)
5. Porous Pavement Detention (PPD)
6. Sand Filter Basin (SFB) The first three BMPs require that a follow-up facility that has a Water Quality Capture Volume (WQCV) be provided downstream. They reduce runoff volumes, but do not eliminate runoff entirely from the smallest 80% of the runoff events. As a result, facilities that have a WQCV that is reduced in accordance with the recommendations given in the Manual need to be installed to capture and treat the residual runoff from these events. The final three BMPs have their own WQCV and are actually designed to infiltrate water into the ground if the local geology permits. Even where the underlying soils have very low hydraulic conductivities, such as clays, some of the volume captured will not return to the receiving waters as surface runoff. It will return slowly as interflow or be evapotranspired, a similar manner as pre-developed soils and vegetation would do. All of these can be integrated into the fabric of the development on site, very close to where the rainfall first reaches the ground. “Rain Gardens” (see Figure 5) used in the eastern United States are an example of what we call PLDs. They have the look of slightly depressed grass areas, flower gardens or shrub patches; yet can serve the needs of a commercial and residential sites very well. MBP or PPD can be made to be part of parking lots, private drives, roadside parking strips or shoulders, etc. GS and GB can be substituted for curb-and gutter in most developments, including residential and commercial areas as part of the often-required open space dedications for new developments (see Figure 6).
Figure 5. A “Rain Garden” in Prince George County, MD (same as a PLD in the Manual).
10

Figure 6. Use of GSs and GBs in a residential neighborhood, Boulder, CO.
What does that mean in terms of runoff reduction benefits? We have not yet been able to complete data acquisition and analysis yet ourselves, but data collected in Scotland (Macdonald and Jefferies, 2002) show the following for the events when runoff actually occurred at the porous paved parking lot:
• Average Runoff Volume: 75% less than at asphalt paved parking lot.
• Lag time: Between 30 and 600 minutes at the porous paved parking lot, but almost instantaneous at the asphalt-paved lot.
• Average Peak Flow Rate: On the average reduced by 77% In addition, these data also show that swales do produce a measurable benefit in reducing the runoff rates and volumes, but the result is not as dramatic as with porous pavement. Successful (“Effective”) Performance of BMPs is in the Details Like any technology, it is the details that make the difference between a product that works well and one that does not function well, requires undue amount of maintenance and operation, and is a general pain to own and to get to perform consistently. Let’s examine some of the more common issues, problems and misconceptions that we encounter throughout the District and other locations in United States, namely:
1. Clogging potential of sand filters and infiltrating facilities
2. Extended Detention Basins – need for micro-pools and effective trash tacks.
Clogging Potential of Sand Filters and Infiltrations Facilities There exists a perception that a SFB can impose a large maintenance burden on its owner. This concern is justified and has been addressed by the design parameters recommended in the Manual. The design criteria were developed to minimize maintenance and it is estimated that over an extended number of years an SFB should cost about the same to maintain as an EDB or a RP, and less than a Constructed Wetland Basin (CWB). This will not be the case if there is construction erosion occurring
11

upstream that is washed down into the SFB. Regardless of this possibility, the removal of the accumulated sediment and the removal and replacement of the top two to three inches of the sand will return it to full operation. Under normal urban runoff conditions, it is estimated that a SFB will operate well, namely empty out the full WQCV within two days or less, for about five years. When the emptying time becomes longer than that, simple removal and replacement of the top 2- to 3-inch layer of sand will return it to full operation. Similar, but less frequent maintenance costs are estimated for PPDs and PLDs. In the former, one must use a vacuum to remove the top 2- to 3-inches of sand from the annular spaces in the MBP blocks and replace it with fresh sand. For the latter, plant root activity will keep the top surface area open for a longer period of time than for bare soils, thus extending the period between maintenance. It is important to recognize that all BMPs will require maintenance and some of them will be more difficult to maintain than others. For example, the micro-pool in an EDB will need to be drained, the bottom dried out and deposits removed. In addition, the forebay will need regular cleaning. The entire basin’s bottom will eventually need to have a layer of deposits removed and revegetated, and the structural elements such as inflows, rundowns and outlets fixed as they deteriorate over time. A SFB does not have a forebay or an outlet (see Figure 7). Unless the underdrain pipes are crushed, something that can be avoided with the use of lighter tracked equipment, there are few structural elements to consider. In addition, the sediments on top of the sand media typically dry out quickly and can be removed at almost any time of the year.
Figure 7. Example of a SFB that functioned well for 10-years in Littleton, CO; it was removed by RTD in 1999 to make way for park-and-ride lot expansion.
Extended Detention Basin Two of the most important elements of an EDB that are often misunderstood and improperly implemented are: 1. Micro-pools
2. Trash racks.
12

Micro Pool. Despite that the fact that the latest version of the Manual has been in circulation since 1999, quite a few EDB facilities designed and constructed since then have outlets that work well and/or micro-pools. It appears that some designers and their clients continue to leave out micro-pools and do not use the details for the outlet recommended in the Manual in their designs. Much research and thought went into developing the recommended design details, especially in selecting the materials and the type of trash rack to be used at the outlet. When the recommended trash rack is used, its operation can be compromised if no micro-pool is installed. These two work in tandem to provide a well functioning EDB that will dry out the basin’s bottom within a relatively short period of time, thus preventing ideal breeding conditions for mosquitoes. Yes, a micro-pool significantly reduces, and keeps in check, the mosquito populations associated with many BMPs. It does that by:
1. Providing an active surcharge storage volume for nuisance dry-weather flows and most frequently occurring runoff from very small storms
2. Having a relatively deep permanent pool with steep sideslopes that is poor habitat for mosquito breeding
3. Providing habitat for predator species (e.g., dragonfly) that eat mosquito larvae
4. Limiting the area where shallow waters will be present for extended periods of time
5. Providing a reservoir where mosquito larvae control agents (i.e., DIMP) can be added if the need arises.
Mosquitoes breed best in stagnant shallow waters. Without a micro-pool and the currently recommended details for EDB & RP outlets, the lowermost small orifices in the outlet plate, or riser if one is used, clog with sediment, along with the lower portions of the trash rack. When that happens, stormwater does not empty out fully, leaving behind large areas of the basin’s bottom covered with a stagnant shallow layer of water and soggy soils that stay wet for weeks, a perfect mosquito breeding habitat. Typically, mosquito larvae need 72-hours to hatch, mature and emerge as the blood-sucking insects that we hate so much. When the EDB is constructed using the recommended details, the main body of the basin is emptied out in 40-hours or less, depending on the size of the storm, leaving only the 2.5-feet deep micro-pool area wet (see Figures 8 and 9).
Figure 8. A properly des(m
Micro-pool
igned EDB in Jefferson County, CO. Note the small wet area icro-pool) at the outlet during in 2002.
13

Trash Rack. Many EDBs and PRs today have an ineffective trash rack at the outlet or none at all. Water quality outlets, by their nature, require very small openings. As a result, they are prone to clogging by floating and neutrally buoyant trash such as paper, plastic bags, sticks, leaves, grass clippings, etc. A properly sized and designed trash rack is the best defense against such clogging. In addition, trash racks at all detention basin outlets are an essential element for public safety to keep persons from being lodged against the outlet by hydraulic pressure as the basins fill. The details recommended in the Manual are the result of many observations throughout the United States and suggestions by the practitioners in the Denver area. They come as close as possible to being optimum in configuration and sizing using the knowledge we possess today. The only configuration for the removal of suspended solids that would perform better is a floating outlet that rises and falls with the water level, but the technology for its continued long-term performance has not yet been perfected.
Figure 9. An EDB without a micro-pool. Note the large saturated wet area during a dry weather period in 2002, a drought year, that provides good habitat for mosquito breeding. OTHER IMPORTANT BMP RELATED ISSUES Lets examine three other issues that are the topic of most questions we receive from practitioners, namely: 1. Use of BMPs with a WQCV vs. flow-through devices 2. Above-ground vs. underground BMPs 3. Basis for comparing BMP “effectiveness” Use of BMPs with Water Quality Capture Volume vs. Flow-Through Devices Starting on page 3 of this paper we listed several points in answering the question of “What should effective BMPs do?” One of these is the ability of a BMP to control the rates of runoff from large numbers of smaller runoff events to very low rates of flow. This is needed to reduce the erosive energies experience by the receiving streams, thus also reducing the impacts of urbanization on aquatic habitat. Another was to remove the smallest TSS particles from stormwater (i.e., less than 60 µm) in order to reduce the deleterious effects of these particles on macroinvertebrates and fish in the receiving
14

streams in Colorado. The capture of the WQCV recommended in the Manual and its release over 12 to 40 hours, depending on the type of BMP used, goes a long way towards meeting those goals. It provides for complete capture and treatment, on an average annual basis, of 80% of all stormwater runoff events and of the “first flush” of the remaining 20%. In fact, doubling the capture volume increases the complete capture ratio by only 5%. When it comes to the removal of the small TSS particles, and associated pollutants, the release of the full WQCV over a 40-hour period by an EDB or 12-hour period by a RP provides the residence time needed to settle out these particles from the water column. The difference in the residence time is possible by the fact that the permanent pool of a RP provides a much more efficient treatment facility for the removal of TSS particles than an EDB without one. Another feature of the slow release of the WQCV is that it will retard even the smallest runoff events, thus not allowing them to short-circuit through the outlet without some treatment. For the smallest of these runoff events, the micro-pool provides a similar function to the permanent pool of the RP, extending TSS removal efficiency to runoff events not receiving much treatment without it. Devices that do not have a WQCV, namely the flow-through devices, do not mitigate flow rates. As a result, the full energy of the large numbers of new runoff events in urban areas reach the receiving stream without any attenuation. In addition, the very short residence time, on the order of seconds, does not permit the removal of the smaller TSS particle. Some of these devices, however, can be effective in removing larger sediment, bed load and trash, namely, the “gross pollutants.” For this reason the District has clarified its policy on their use in retrofit situations for small tributary areas (i.e., “not significant redevelopment”). When faced with the prospect of having one of these devices retrofitted into the existing urban landscape or not having any treatment, their use needs to be looked at on a case-by-case basis. Aboveground vs. Underground BMPs Under most normal circumstances, there is no justifiable reason to use underground facilities in areas of new urban development or significant redevelopment. With the expectation of PLD and PPD which require about 4% of the total impervious area of the development, all of the above-ground BMPs recommended in the Manual require less than 2% of the total impervious area of the development to provide a WQCV. The surface area required by BMPs with a WQCV can further be reduced if PP, PPD, PLD, GS and/or GB are used. Since virtually all zoning ordinances require at least 5% of the total land area to be open and landscaped, BMPs can easily be integrated into the site landscape plan. All it takes is creativity and the services of a landscape architect to integrate the two functions, namely site landscaping and stormwater management. Aboveground BMPs are visible to the owners and the public, while underground facilities are out-of-sight and, as a result, often become out-of-mind. As we discussed earlier, effective BMPs need to be accessible and visible for easy inspection and maintenance in order to keep operating as designed. An inspection program can be designed to visit each BMP site on a regular basis, open the access manholes, inspect its condition and to measure the floating debris and deposit layers on the bottom. It is also possible to schedule a regular maintenance cycle to clean them. However, both approaches need a clear commitment on behalf of the original and subsequent owners, good record keeping and some form of institutional reporting to “assure” they are being maintained.
15

The author had an opportunity to inventory underground grease and oil traps at an industrial district. What became obvious is that despite the best of intentions and past agreements to maintain them, virtually all of the traps were not maintained for years and some had their manhole covers overlaid with asphalt paving sometime in the past. It took a jackhammer to break out the hardened grease in one of the traps that had its manholes under a 2-inch layer of asphalt and was not serviced for more than five years. This was a clear case of out-of-sight and out-of-mind. A simple visual inspection, often not much more than a drive-by of aboveground facilities, will reveal significant problems. In addition, when the aboveground facility is not operating properly, becomes silted in, there is structural damage to the outlets, etc., the owner or the responsible municipality will see it and be compelled to take rehabilitative maintenance action to keep the site “clean” nuisance free and operating. Basis for Comparing BMP “Effectiveness” Two significant new thoughts have emerged in recent years about “effectiveness” of structural BMPs. First is the notion that a truly effective BMP will have an ability to mitigate many of the impacts of urbanization on receiving waters, including the modifications in hydrology that accompany land-use changes. The second is the questioning of the hypothesis that “percent removal” of pollutants is an appropriate metric in comparing the performance of different BMPs. The first one was already addressed earlier in this paper. The Urban Water Resources Research Council (UWRRC) of the American Society of Civil Engineers (ASCE), under a grant from EPA, developed a BMP performance database based on scientific and engineering principles. At this time the database contains data from over 200 BMP field evaluation sites in United States, Canada and Europe. After studying this data, it was concluded that there is no scientifically grounded basis for using “percent removal” of pollutants as the basis for comparing the performance of various structural BMPs (Clary, et. al., 2001). Such comparisons may be valid if BMP performance were compared in a specific city to service similar land-use conditions. As the geography and land uses change, the runoff quality and quantity change as well. The result being that the “percent removed” numbers change as well. What the investigative team found was that comparing the effluent quality vs. influent quality, and the volume of stormwater treated in relation to the average runoff volume in the area, provided more stable and scientifically sound basis for comparing performance or “effectiveness” of BMPs in their ability to affect the water quality reaching the receiving waters of the nation (for more information visit www.bmpdatabase.org web site). This is a very important finding if the performance data are to be used in TMDL studies and to make eventual commitments to the regulatory agencies. After all, the total maximum daily, seasonal or annual load will depend entirely on the effluent quality that leaves and bypassed the BMP and not on the percent removal of a constituent. The latter can show high percent removals when the concentrations in runoff are high and low removals when they are low, even when the runoff itself is very clean. Figure 10 shows the results of a statistical analysis of several BMP types in terms of “percent removals” and effluent concentrations for TSS. The percent removal box and whisker plots show very wide bands of confidence that imply that almost all of the BMPs
16
have similar performance when the 95% confidence test is applied. That is not the case when the effluent concentrations are compared. When interpreting this graph it is important to understand that most of these BMP groups (i.e., bioswales, hydrodynamic devices, retention basins and wetlands) have very few data sets and their results are prone to statistical anomalies and need to be viewed with some skepticism. Nevertheless, the trends so far show that, with the exception of hydrodynamic devices, all BMP groups reported here produce less than 30 mg/l TSS in the effluent, a concentration comparable to secondary treatment of wastewater.
0.0
0.2
0.4
0.6
0.8
1.0
- 0.0
0.2
0.4
0.6
0.8
1.0
Frac
tion
of T
SS
Rem
oved
BMP Type BMP Type
0.10
1.00
10.00
100.00
TSS
(mg/
l)
Detention Basins
Hydro Dynamic Devices
Bioswales Media Filters
Retention Basins
Wetlands Detention Basins
Hydro Dynamic Devices Bioswales
Retention Basins
Wetlands
Figure 10. Box and Whisker Plot of influent and effluent Event Mean Concentration for TSS data for several BMPs in the National BMP Database (Ref.: www.bmpdatabase.org) SUMMARY OF ISSUES DISCUSSED The key issues discussed and points made in this paper can be summarized as follows: • Urbanization and other land use changes can have a profound impact on the
receiving waterways of Colorado’s high plains that are driven by changes in hydrology, water quality and human activities.
• Watershed-wide use of BMPs that significantly reduce runoff rates and control runoff volumes from the majority of most frequently occurring smaller storms (i.e., 80% of runoff events) can reduce these impact on receiving waters and their biota.
• Effective BMPs, in addition to controlling runoff volumes and rates of runoff, need to remove TSS particles less than 60 µm in size from stormwater runoff to the maximum extent practicable, should be integrated into the urban landscape to the maximum extent possible and be readily accessible and visible for maintenance.
• The District’s Manual provides good guidance for the selection, sizing and design of a number of BMPs, including those that can reduce runoff volumes.
17

• BMP effectiveness should be based on comparing their ability to mitigate the impacts of modified hydrology as well as the quality of the effluent they can produce. Use of “percent removals” for comparing BMP performance is not recommended by the National BMP Database project.
• Filter-type BMPs can clog quickly if not properly sized and maintained. The criteria in the Manual for sand filters take these issues into account.
• It is critical to provide a micro-pool and the trash rack details recommended in the Manual to have an extended detention basin that has fewest operational and mosquito problems.
• Aboveground facilities are recommended for all new development and significant redevelopment, reserving underground facilities for retrofit in dense urban areas.
• In order to mitigate hydrologic impacts of land use changes and to reduce small TSS particle concentrations in stormwater, BMPs with a water quality capture volume are needed.
18

REFERENCES Clary, J., Kelly, J., Jones, J., Quigley M. and O’Brien, J. (2001). “National Stormwater
Best Management Practices Database; a Key Tool to Help Communities Meet Phase II Stormwater Requirements,” p. 44-48, The Journal for Surface Water Quality Professional Stormwater, March-April, Forester Press, Santa Barbara, CA.
Horner, R. (2002). “Structural and Non-Structural Best Management Practices (BMPs) for Protecting Streams,” Linking Stormwater BMP Designs and Performance to Receiving Water Impact Mitigation, B.R. Urbonas, Editor, p. 60-77, ISBN 0-7844-0602-2, American Society of Civil Engineers, Reston, VA, USA.
MacDonald, K.C.B. and Jefferies, C. (2002). “Performance of BMPs in Scotland.” Linking
Stormwater BMP Designs and Performance to Receiving Water Impact Mitigation, B.R. Urbonas, Editor, p. 519-523, ISBN 0-7844-0602-2, American Society of Civil Engineers, Reston, VA, USA.
UDFCD (1999). Urban Storm Drainage Criteria Manual - Volume 3, Best Management
Practices, Urban Drainage and Flood Control District, Denver, CO, USA. Urbonas, B.R., Editor (2002). Linking Stormwater BMP Designs and Performance to
Receiving Water Impact Mitigation, p.p. 572, ISBN 0-7844-0602-2, American Society of Civil Engineers, Reston, VA, USA.
1 Ben Urbonas holds B.S. and M.S. degrees in Civil Engineering and is a P.E. with a career spanning more than 40 years. He has worked for the Urban Drainage and Flood Control District for over 26 years, where he has directed the development of over 100 master plans, technology development and criteria updates, and the South Platte River Program. He has also served as the chairman of the Urban Water Resources Research Council of the ASCE, vice-chair of the Colorado Water Quality Control Commission and is currently serving on the Board of Directors for the Cherry Creek Basin Water Quality Authority.
19

CITY OF GRAND JUNCTION’S COMBINED SEWER ELIMINATION PROJECT
Water Quality Structures and NPDES Phase II Compliance
Trent Prall, P.E.1
City of Grand Junction ABSTRACT The Combined Sewer Elimination Project in Grand Junction Colorado will not only separate the stormwater from the sanitary sewer system but also accomplish other goals that help the City meet different ecological concerns and regulations. NPDES Phase II, endangered species protection and the Colorado River all led the design team to propose a series of BMPs designed to minimize the risk of urban storm runoff pollution to the environment downstream.
INTRODUCTION The City of Grand Junction is nearing the construction phase of its Combined Sewer Elimination Project (CSEP) which will remove storm flows off of the sanitary sewer system and route them to the river. This project benefits the oldest, fully developed, sections of the downtown "core" area that encompasses about two square miles. The $8.6 million project will construct over 10 miles of new stormwater pipe ranging in size from 12 to 72 inch diameter pipe. DESIGN ISSUES AND CONSTRAINTS The project outfalls will terminate into a section of the Colorado River that the United States Fish and Wildlife Service (USFWS) has designated critical habitat for four endangered species of fish. Colorado Division of Wildlife also has several “Species of Special Concern” listed in this reach. In June 2002, an incident with an illicit connection to one of the storm sewers resulted in the taking of over 1600 fish. The drought heightened the severity of the illegal
20

discharge as the river had recently dropped low enough to abandon one of the side channels into which the storm drain discharged. All that remained was a pool of about 500,000 gallons. The ensuing EPA cleanup helped emphasize the importance of being able to detect and isolate, where possible, illicit discharges and spills. Due to the project funding source, an Environmental Assessment was required. This is similar to an Environmental Impact Statement and had historically only been completed for water and wastewater treatment facilities. This is the first time in the state of Colorado it has been used for a stormwater project. The USFWS was the only potentially affected interest that raised concerns. Their concerns basically boiled down to water discharged directly into the Colorado River that had previously been transported in the combined sewer system and treated at the WWTP. Specifically, some of their concerns involved particulate pollutants such as silts and road sands and dissolved pollutants such as selenium, metals and organics. They were also concerned with illicit spills such as referenced above. Another issue was the creation of open water with the water quality ponds that would facilitate the concentration of pollutants in the biomass and potentially allow for the introduction of non-native species in the river. Organics such as hydrocarbons are a valid concern as three of the five project basins will drain stormwater from an industrial area. This area is the oldest industrial area in the Grand Valley and is in its third to fourth development cycle. This means stormwater runoff from the area has the potential to accumulate a variety of pollutants before it reaches the Colorado River. Other potentially affected interests included the Grand Junction Parks Department, the Grand Junction Botanical Society and the Colorado Riverfront Commission who are all involved in redevelopment of the water front into a community asset. Additionally, the nature of the site gave rise to a series of design constraints. These included; extremely flat topography, multiple existing utility conflicts, jurisdictional wetlands, contaminated soil and high groundwater. One of the issues that most affected the design of the water quality basin was the flat topography. Typically, the pipe invert into the water quality basin was significantly lower than the available outlet elevation to the river. SOLUTIONS It became obvious early on that in order to provide assurances to the USFWS as to the safety of the threatened and endangered species and their habitat, there would need to be provided some sort of primary treatment facility with continuous monitoring of effluent quality. This being an obvious impracticality, the project team developed a review and coordination process with the USFWS so as to work for a win-win solution for all. Already included in the CSEP budget prior to the spill was development of water quality basins at the end of each of five outfalls. Since the spill, the City has incorporated a couple of safety measures to help reduce the risk to the river. First, valving on the downstream end of the basins is now designed to isolate spills for analysis and proper disposal. Secondly, a real time monitoring program to address the concern over spills discharging to the river was explored. A standard sampling regime like a WWTP would not be practical due to inconsistent flows and high expense. Due to the industrial nature of the area immediately upstream of the water quality basins, it was decided to provide pH meters for each of the basins. The meters will be tied through telemetry to 24 hr on-
21

call personnel who would respond and shut the isolation valves if the pH meter triggers an alarm. The criteria to trigger the alarm is user defined and could include flows falling outside a certain pH range. A management plan will be developed to evaluate the contained material and determine proper disposal or on-site treatment. There will be five water quality basins constructed with this project. The water quality basins, where feasible, are sized according to the UDFCD standard of the 80th percentile storm for 24 hours. Most will have wetlands channels in the bottoms and at least one will provide a permanent pool. Of the five, two are designed at the time of the present conference, Basin 10 and Basin 8, described below. Basin 10 One of these water quality basins serves an industrial area of approximately 50 acres. Stormwater flows enter the basin via pipe and overland flow from the adjacent street. A water quality design volume of 2 acre-feet was achieved in this basin. The basin is designed as a dry basin; however, groundwater levels in this area appear to be just a few inches below the pond bottom. Additionally, the outfall elevation is approximately 2 feet higher than the inflow elevation in order to utilize existing outfall pipes that penetrate the levee and allow a gravity outfall to the Colorado River. In addition to the standard UDFCD release plate, the outfall structure contains a baffle wall and a depressed floor. The baffle wall is included to minimize the introduction of floatable materials into the Colorado River. The depressed floor will provide a permanently wet environment for the pH meter. Slide gates are positioned over the primary and secondary outfall pipes and can be closed to prevent the pond contents from flowing into the Colorado River in the event of a spill. Basin 8 The second water quality basin serves the largest area of this project; approximately 425 acres containing a mixture of residential, commercial and industrial areas. This basin will achieve roughly 50% of the water quality design volume due to the amount of land available for the water quality basin. This pond will include a wetland channel terminating at a permanent pool. The pool will be lined due to shallow and contaminated groundwater in this area. Stormwater flows will enter the basin through a 72 inch pipe with a cast in place concrete inflow structure. Once again, the inflow invert is several feet lower than the available outfall invert. The inflow structure allows for stormwater to rise and weir flow into the water quality basin wetland channel. This structure will also contain a wet well/pump system that will pump trapped water to the surface. The inflow structure will also include a depressed floor to allow for sedimentation and pH monitoring. The outlet structure for this basin will be similar to the structure used for the previously mentioned basin, and will also include slide gates, a depressed floor and baffle wall. THE CITY AND NPDES PHASE II The project does go along way toward meeting the intent of NPDES Phase II minimum measures one through three. In regards to the City’s program to meet minimum measures on public information and outreach, the project will provide some opportunity to explain urban impacts on stormwater to the public. Two of the basins are proposed on a future park site and
22

another is proposed adjacent to the Grand Junction Botanical Society butterfly pavilion and park grounds. Therefore the City is proposing signage and walking trails around the water quality basins that help educate the public about water quality basins and their role in helping to clean up stormwater. The program could be expanded to have interested individual or groups aid in the cleaning of the basins. This is not currently proposed for the City’s first permit term, but may be written into the second application for permit in 2008. Minimum measure three requires municipalities to address illicit discharge detection and elimination. This project is intended to help meet the minimum measure by providing isolation valving in the basins and pH monitoring. Although numeric standards are not in place on the Colorado River yet, by the time the 3rd cycle of permits for NPDES II comes around in 2013 City staff believes stream standards will eventually be in place. Although future regulations and treatment requirements are unknown at this time, the most important long range function of the basins is at least setting aside the land for future treatment works. The water quality basins, monitoring and management of the basins have been included into the City’s NPDES Phase II permit application for consideration by Colorado Department of Public Health and Environment towards partially meeting the intent of the regulations. For more information please contact Trent Prall, City Utility Engineer, at [email protected] or 970-244-1590. 1 Trent Prall is the City of Grand Junction Utilities Engineer responsible for development and implementation of the water, sewer, and storm drainage capital improvement program as well as coordination of stormwater management activities. He is a Colorado State graduate that has been with the City of Grand Junction for eight years. He also worked for the City of Los Angeles Public Works Department for five years designing and overseeing construction of a number of different public works projects.
23

SESSION TWO
24

CHERRY CREEK BASIN PHOSPHORUS CONTROL PROJECTS
Jim Wulliman1 Muller Engineering Company
ABSTRACT A variety of water quality projects have been constructed in the Cherry Creek watershed to control phosphorus loading. The projects, for the most part constructed by the Cherry Creek Basin Water Quality Authority, are intended to help protect beneficial uses in Cherry Creek Reservoir. Water quality monitoring data for several of the projects are presented, indicating their effectiveness for immobilizing phosphorus. Future projects to be implemented by the Authority are described, and a series of lessons learned are highlighted.
INTRODUCTION The Cherry Creek Basin Water Quality Authority has been involved in projects to control phosphorus loading to Cherry Creek Reservoir since helping to fund the Shop Creek Water Quality Improvement Project in 1989. Since that time, the number and variety of projects in the watershed has grown, the technical knowledge base has expanded, and a number of new initiatives to manage phosphorus loading are being pursued. This paper describes the features of eleven constructed and planned phosphorus control projects, summarizes existing monitoring data, and concludes with lessons learned. DESCRIPTION OF PROJECTS The following phosphorus control projects are described.
1. Shop Creek Water Quality Improvements (1989) 2. Baldwin Pond (1991) 3. Quincy Outfall Water Quality Improvements (1995) 4. East Shade Shelters Shoreline Stabilization (1996) 5. Cottonwood Creek Perimeter Road Improvements (1997) 6. East Boat Ramp Shoreline Improvements (1998) 7. Tower Loop Shoreline Stabilization (1999) 8. Cottonwood Creek Peoria Street Water Quality Improvements (2002)
25

9. Inverness Water Quality Improvements (projected 2003) 10. Cottonwood Creek Reclamation Project (projected 2003) 11. Cherry Creek State Park Wetlands (projected 2004 and beyond)
1. Shop Creek
In the early 1980’s, the rapidly developing Shop Creek watershed was identified as a key source of phosphorus entering Cherry Creek Reservoir, inputting over 1200 pounds of phosphorus annually from a relatively small (530 acre) drainage area (DRCOG, 1982). At the same time, the half-mile-long Shop Creek channel within Cherry Creek State Park was experiencing severe erosion as runoff from the developing watershed increased. The historically small, grassy stream had
transformed into a canyon up to 100-feet wide with 10- to 20-foot vertical banks completely devoid of vegetation. To stabilize the channel and reduce the phosphorus load it conveys to the Reservoir, the Shop Creek Water Quality Improvement Project created a 9-acre-foot upstream extended detention pond with a permanent pool, followed by a series of five wetland channels stepping down between soil-cement drop structures. The upstream pond fills with runoff during storms events and drains slowly (over approximately 40 hours) to provide the long term settling necessary to encourage fine sediments -- associated with phosphorus -- to drop out. The wetland channels are designed to pool up behind the drop crests during storms to create additional settling, vegetative filtering, wetland treatment, and infiltration (Muller, 1988). Prime growing conditions in the wetlands have encouraged natural riparian vegetation to fill in, helping to slow flow velocities while attracting waterfowl and wildlife. The improvements were designed to blend in to and be compatible with the adjacent prairie landscape of the Park. Interpretive signage has been added to explain the features and benefits of the project and provide an educational opportunity for Park visitors. 2. Baldwin Pond Although not constructed by the Authority, the Baldwin Pond represented an innovative approach to phosphorus control that was embraced by the Authority as good practice. The facility, located on a tributary to Baldwin Gulch in Parker, Colorado, was constructed to promote infiltration of runoff through a sandy loam medium. A gravel layer with an underdrain was provided to pick up flows and convey then out the downstream end of the facility. The goal was to filter runoff and provide a media that could adsorb some of the phosphorus out of the water column (Fifield, 2003).
26

Baldwin pond over time has retained some shallow surface ponding and has essentially transitioned to a wetlands treatment cell. Dense vegetation has filled in and enhanced local wildlife habitat. 3. Quincy Outfall Water Quality Improvements
The Quincy Outfall, the next stream north of Shop Creek (and draining a similar area), was stabilized by the City of Aurora in 1989 with an improved channel, a series of drop structures, and a downstream “island” created by splitting the channel and guiding it around a higher mound. In 1995, the Authority initiated a project to provide additional water quality enhancement near the downstream end of the Quincy Outfall channel improvements.
A two-part project was constructed. First, a Park pedestrian trail – old and in disrepair -- was raised and rebuilt atop an earthen embankment. Capitalizing on the natural topography of the area, the new trail embankment created a large impoundment, approximately 11 acre-feet in volume, with a sandy bottom vegetated with a variety of trees, shrubs, grasses, and pockets of riparian vegetation. Second, the “moat” around the upstream side of the island, which had since filled with sediment and vegetation, was excavated to re-establish an upstream sediment forebay that can periodically be emptied to extend the life of the downstream basin. Storm runoff entering the project flows through the sediment forebay, dropping out heavier sediments, and spreads out in the large vegetated basin impounded by the trail embankment. Little flow has ever exited through the outlet works located at the south end of the project, as most flows seep into the sandy, vegetated soils in the bottom of the facility. 4. East Shade Shelters Shoreline Stabilization
Shoreline erosion can generate a significant amount of phosphorus loading to the Reservoir, since each cubic yard of shoreline soils has been shown to contain up to one to two pounds of phosphorus.
Erosion was especially severe at the East Shade Shelters, a series of picnic shelters located on top of a high bank overlooking the reservoir on its east side, just south of the swim beach. Erosion appeared to be caused by wave action and -- to a greater degree -- by foot traffic, as people scrambled up and down the bank between the shelters and the water’s edge.
27

To repair the bank erosion and try to reduce future damages, the proposed improvements added a gravel “fisherman’s” access bench at the water’s edge, a dense band of willow vegetation behind the path, plantings on the bank, and several sets of concrete stairs for access up and down the bank. Parking lot runoff was directed to shallow, grassy depressions adjacent to the picnic shelters for filtering and infiltration, so flows would not
contribute to bank erosion. The improvements have markedly reduced bank erosion along this section of shoreline, and have generally enhanced the picnic area as a Park amenity. 5. Cottonwood Creek Perimeter Road Improvements Cottonwood Creek, draining a rapidly urbanizing 14 square mile watershed southwest of Cherry Creek State Park, is second only to Cherry Creek as a contributor of phosphorus to the Reservoir. Within the project limits, Cottonwood Creek was characterized by a narrow, eroded cut in the adjacent prairie landscape with high velocity, concentrated flows occurring during storm runoff events. The channel offered little in the way of spreading out flows and naturally treating runoff; on the contrary, its eroding banks contributed to phosphorus loading in the Reservoir.
Water quality improvements downstream of the Park Perimeter Road consisted of raising the invert of the creek several feet and excavating floodplain benches on both sides of the main channel, plus constructing a downstream embankment with a hydraulic control structure. The embankment and control structure serves to back up flows during storm events and release them slowly to achieve long-term settling of sediment-laden runoff. Approximately 23 acre-feet of extended detention
storage over an area of 13 acres is provided in the facility. In addition, another 11 acre-feet of storage is dedicated to sediment accumulation. Any excess storm flows spill over a new concrete trail, designed to act as a spillway, and spread as sheet flow into the Cherry Creek wetlands to the east (CH2MHILL, 1996). The reach of Cottonwood Creek reclaimed as part of this project exemplifies a shallow, well vegetated, natural channel. Its floodplain overbanks receive frequent spills of storm runoff, spreading out flows and providing the hydrology to encourage the establishment of riparian vegetation.
28

6. East Boat Ramp Shoreline Improvements Similar to the conditions at the East Shade Shelters, severe shoreline erosion characterized this heavily used stretch of beach. In addition to wave action and foot traffic, storm runoff from a large parking lot carved deep gullies across the narrow strip of shoreline and carried pollutants directly into the Reservoir. Little vegetation was able to get established in this area, popular with boaters, due to the impacts of waves, runoff, and the
Park users themselves. Improvements included constructing a curb along the Reservoir edge of the parking lot
to direct runoff to a few controlled locations and capturing the runoff in a number of newly created wetland cells. The cells create pockets of "green" along the otherwise sparse shoreline and provide treatment for the parking lot runoff via settling, biological activity, and infiltration. Boulder “jetties” not only stabilized the perimeters of the wetland pockets, but were positioned to protect small, leeward beachfronts that make ideal spots for picnicking or taking a break from boating activities. Like other Authority projects, the East Boat Ramp Improvements
provided significant water quality benefits and also served to create an amenity for Park users. 7. Tower Loop Shoreline Stabilization A third project was constructed to address shoreline erosion at the Tower Loop/Dixon Grove area at the northeast corner of the Reservoir. As in the East Shade Shelter and East boat Ramp Projects, improvements focused on providing stable trails and ramps to allow fishermen and other Park users to access the water’s edge without trampling the banks. 8. Cottonwood Creek Peoria Street Water Quality Improvements To supplement the water quality project at the Park Perimeter Road, a second regional detention basin was constructed on Cottonwood Creek just outside the Park, west of Peoria Street. This facility is designed to provide additional sediment and phosphorus trapping and the capability to clean out accumulated sediments and trash outside the limits of the Park. In this way, maintenance operations do not need to disturb Park activities and were intended to extend the life of facilities inside the Park.
29

The Cottonwood Creek Peoria Street Improvements are designed to emulate a natural oxbow bend on the Creek, increasing the flow path, slowing velocities, and promoting the interaction of creek flows with natural riparian vegetation. Over 11 acre-feet of water quality capture volume are provided for long term detention and settling. Runoff exceeding the water quality capture volume will overtop a spillway and flow through a new three-cell 10- by 16-foot box culvert under Peoria Street. One of the cells of this box culvert serves as an access trail for pedestrians and horses to enter the Park.
One of the notable achievements of this project was the cooperative effort that multiple sponsors and stakeholders put forth to get the project implemented. Funding was provided by the Urban Drainage and Flood Control District, the Cherry Creek Basin Water Quality Authority, Arapahoe County, Greenwood Village, and the Arapahoe County Water and Wastewater Authority. Additional funding and work in kind was provided by a local developer through the Landmark Metropolitan District. Another developer agreed to construct a new drainageway to convey runoff from a tributary watershed to the water quality facility. Close coordination was also required with the Havana Water and Sanitation District and Cherry Creek State Park (Muller, 2001). 9. Inverness Water Quality Improvements The Inverness Business Park is planning to construct an innovative water quality retrofit project in the summer of 2003. The project is to be built within an existing 167 acre-foot regional detention facility on Cottonwood Creek located approximately two miles upstream of the Peoria Street facility. The overall design concept has features that will address water quality both on mainstem Cottonwood Creek and a tributary watershed, although the initial phase of implementation will treat just the tributary flows, draining a 318 acre portion of the business park. A unique aspect of this design is its four-stage treatment process, consisting of the following (Muller, 2002).
1. Extended detention basin with floating baffle outlet. The 7.6 acre-foot detention basin (including 20 percent sediment storage) will feature a meandering forebay/micropool sediment trap emulating a natural stream. The floating baffle outlet is designed to release water from the top of the ponded water column where concentrations of suspended sediment are lower.
2. Polymer basins for flocculation and settling. These basins allow the attenuated outflows from the detention basin to trickle over gel-type polymer “logs” that are anticipated to last throughout a runoff season. The “low-tech” logs enhance flocculation and settling of fine sediment particles without having to monitor flow rates or measure dosage of polymer.
3. Sand filtration. Outflows from the 50'0' 100' 200'
Extended Detention Extended Detention BasinBasin
Polymer BasinsPolymer Basins
Sand FiltrationSand Filtration
Sheet Flow / Sheet Flow / Infiltration AreaInfiltration Area
Sheet Flow / Infiltration AreaSheet Flow / Infiltration Area
Inverness WQ ImprovementsInverness WQ Improvements
30

polymer basins will pass through sand filtration beds to further reduce suspended particles prior to conveyance to the sheet flow / infiltration areas. This, along with the previous stages, reduces the potential for clogging of the infiltration areas due to suspended particles in the storm runoff.
4. Sheet flow / infiltration areas. After sand filtration, outflows will be distributed in long header pipes and allowed to “trickle out” in the form of sheet flow over gently-sloping, grassy buffer strips. This final stage of treatment promotes vegetative filtering and infiltration into the soil, where soil adsorption processes are anticipated to strip significant soluble phosphorus from the runoff.
The improvements are designed to provide a higher level of treatment than a standard extended detention facility alone, and are focused on immobilizing soluble (and total) phosphorus and increasing groundwater recharge. Infiltration of runoff has the added benefit of reducing the increased urban flood peaks and volumes that lead to stream degradation in downstream channels. 10. Cottonwood Creek Reclamation Project The design of this project is currently underway and construction is scheduled later in 2003. This project is ambitious in that the goal is not just to stabilize the eroding creek, but to fully reclaim it as a healthy, naturally functioning stream corridor that provides water quality treatment of base and flood flows (Muller, 2003a).
Cottonwood Creek today is a deep, narrow slot eroded into the adjacent prairie landscape. Other than several cottonwood trees and some sporadic willow growth, the corridor is largely devoid of riparian vegetation. The ruins of an old ditch take-out structure show that the bed of the channel has degraded some 8- to 10- feet below its former elevation. Half of the two mile-long channel appears to have been relocated eastward from its original low point in the valley to the top of a ridge, perhaps for irrigation purposes. The eroding channel prevents plant establishment on the banks and lowers the water table, drying-out the floodplain overbanks, reducing plant diversity, and impairing the value of the corridor for wildlife. The incised condition of the current channel has eliminated flow spreading into the overbank during large floods and instead concentrates flood flows, producing more erosive conditions.
31

The proposed design concept will reclaim Cottonwood Creek as a meandering, shallow prairie stream that will overtop with fairly frequent storm events, allowing overbanks and secondary channels to spread flood flows out, thereby reducing velocities and erosional forces. In addition, hydrologic conditions will be created that will be conducive to the regeneration of cottonwood, willows, and other natural riparian species along the channel to help slow down flood flows and reinforce the channel banks. Where possible, depressions and impoundments will be created to detain storm runoff and promote settling and infiltration. Features, landforms, and plantings will fit the context of the prairie and riparian landscapes of the park. Stable and ecologically rich reaches of similar streams in the region will be evaluated in terms of cross section, profile, and vegetation to serve as prototypes for the channel in this reach. Bioengineering techniques are proposed to help reinforce channel banks using natural, self-healing vegetation. Grade controls will be designed to emulate natural features. 11. Cherry Creek State Park Wetlands This project is in the initial stages of design and is aimed at reducing phosphorus loading from mainstem Cherry Creek, including soluble phosphorus measured in shallow alluvial flows and baseflows. The design concept proposes to improve flow distribution in the existing riparian corridor upstream of the reservoir to expand and enhance natural wetlands treatment in the park, taking advantage of existing hydrology to treat alluvial flows that surface naturally throughout the park (Muller, 2003b).
Raising selected park trails is also envisioned to create treatment “cells” to promote settling and infiltration of Cherry Creek storm flows, similar to the Quincy Outfall Improvements. The trail improvements will also help to address trail erosion and other maintenance problems, preserving park infrastructure. The design concept calls for creation of additional wetlands -- fitting the improvements into areas that reduce impacts
to the existing landscape -- thereby reducing construction impacts and the long-term visibility of new construction. Proposed water quality features will be configured individually to allow phasing over a period of years, and, in total, will comprise a widespread and comprehensive network of treatment facilities.
32
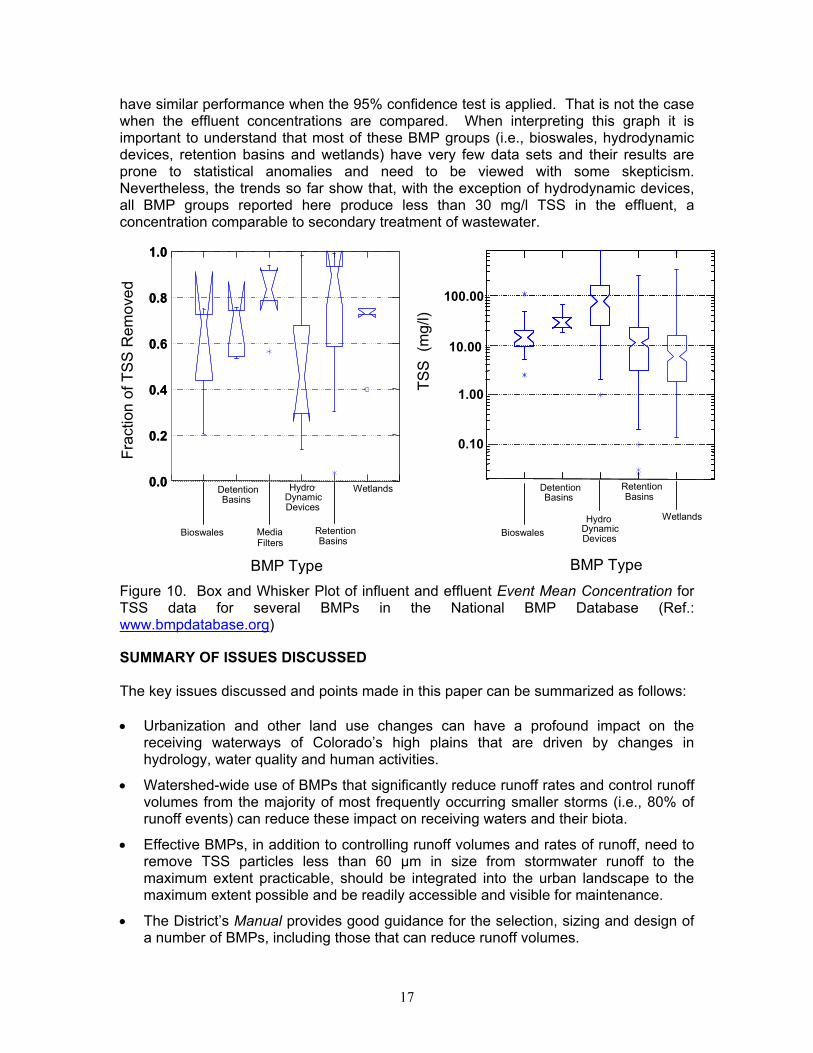
WATER QUALITY MONITORING The Cherry Creek Basin Water Quality Authority has conducted water quality monitoring at the Shop Creek, Quincy Outfall, Cottonwood Creek Perimeter Road and the Cottonwood Creek Peoria Street phosphorus reduction facilities. Results are shown in the following figures (Chadwick, 2003).
Total Phosphorus Loads at Cottonwood Creek Detention Facilities, 1997-2002
0
500
1000
1500
2000
1997 1998 1999 2000 2001 2002
Year
Tota
l Pho
spho
rus,
lb
s
PerimeterInflowPerimiterOutflowPeoriaInflowPeoriaOutflow
The Authority reports total phosphorus reduction efficiencies averaging 59-percent for the Shop Creek system, 21-percent for the Cottonwood Creek Perimeter Road facility, and 51 percent in 2002 for the newly completed Cottonwood Creek Peoria Street facility. Monitoring upstream and downstream of the Quincy Outfall facility was discontinued after it was concluded that near complete immobilization of surface flow phosphorus was being achieved, since most of the incoming runoff exited via infiltration.
Total Phosphorus Loads at Shop Creek, 1992-2001
0200400600800
1000
1992
1993
1994
1995
1996
1997
1998
1999
2000
2001
Year
Tota
l Pho
spho
rus,
lbs
Inf low Outflow
Total Phosphorus Reduction in Shop Creek System, 1992-2001
020406080
100
1992
1993
1994
1995
1996
1997
1998
1999
2000
2001
Year
Tota
l Pho
spho
rus
Red
uctio
n, %
Total Phosphorus Reduction at Cottonwood Creek Detention Facilities, 1997-2002
0102030405060
1997 1998 1999 2000 2001 2002Year
Tota
l Pho
spho
rus
Red
uctio
n, %
PerimeterRoad
PeoriaStreet
33

LESSONS LEARNED A number of lessons have been learned as a result of the Authority’s experience implementing phosphorus reduction facilities over the last 14 years.
• Pursue opportunities to create natural systems and enhance value for people and wildlife. Beyond meeting treatment goals or acheiving regulatory compliance, water quality projects generally present an opportunity to transform problem areas into amenities for the community. Many of the projects implemented by the Authority focus on restoring and enhancing natural treatment systems and benefiting Park users and wildlife.
• Design for long-term maintenance. Providing for long-term maintenance must be an integral part of the design of water quality facilities. Debris control, access, sediment removal, dewatering – all need to be considered and facilitated.
• When it is a pollutant of concern, aim for treatment of soluble, not just
particulate, forms of phosphorus. Advanced or “tertiary” treatment processes may be warrented to specifically target soluble forms of phosphorus in urban runoff.
• Focus upstream in the watershed. Although facilities constructed just upstream
of Cherry Creek Reservoir have provided immediate, significant phosphorus reduction to help protect the lake, the next focus of the Authority is upstream in the watershed. Initiatives to enhance control of urban pollutants near their source are underway. Of particular interest is the encouragement of “Smart Growth” practices in new developments to reduce the increase in runoff and pollutants that accompanies conventional urbanization. The more that is done upstream in the watershed, the less that will be required downstream to protect resources like Cherry Creek Reservoir.
34

References Denver Regional Council of Governments (1982). “Denver Urban Runoff Evaluation Program, File Report.” Fifield, Jerald (2003). Personal Communication. CH2M HILL (1996). “Contract Drawings for Construction of Cottonwood Creek Water Quality Improvements.” Muller Engineering Company (2001). “Contract Drawings for Construction of Cottonwood Creek – Peoria Street Improvements.” Muller Engineering Company (2002). “Contract Drawings for Construction of Inverness Water Quality Improvements.” Muller Engineering Company (2003a). “Feasibility Evaluation for Cottonwood Creek Stream Stabilization Project.” Muller Engineering Company (2003b). “Feasibility Evaluation for Cherry Creek State Park Wetlands Project.” Chadwick Ecological Consultants (2003). “Draft Cherry Creek Reservoir 2002 Annual Aquatic Biological and Nutrient Monitoring Study.”
1Jim Wulliman is a project manager with Muller Engineering Company. He received a bachelor’s degree in civil engineering from Valparaiso University and a master’s degree in civil engineering from Colorado State University. Jim has worked on water resources projects in Colorado for 25 years, and since being involved in the Shop Creek phosphorus control improvements in 1988, has made stormwater quality a major focus of his work. Jim has designed a number of regional water quality projects for the Cherry Creek Basin Water Quality Authority and other clients and has assisted with the development of water quality and erosion control BMP manuals for the Urban Drainage and Flood Control District and Douglas County. Jim is currently active in investigating “Smart Growth” and “low impact development” techniques for water quality enhancement.
35

GRANT RANCH STORM WATER TREATMENT SYSTEM/BOW MAR LAKE
By: John Carroll, P.E.1
Eliot Payson2 Jonathan Jones, P.E.3
Matt Gavin4 Christine Hawley5
PURPOSE This paper summarizes the construction and performance of an advanced stormwater quality treatment system at the Grant Ranch residential development in Littleton, Colorado.
HISTORY AND SITE DESCRIPTION In the mid 1990s, engineers began design on the northeast portion of the Grant Ranch development, which drains into Bow Mar Reservoir (also know as Patrick/Bennett Lake). Bow Mar Reservoir has a wide range of recreational uses including swimming, boating, and fishing. Protecting the lake was of great importance to Bow Mar residents. In 1997, an agreement between Bow Mar residents and the developer of Grant Ranch (Simeon Residential Communities) was negotiated to establish numeric thresholds for various pollutants including metals, suspended solids, nutrients, pesticides, and others. Thresholds were also established for settleable solids during construction. Compliance with the numeric thresholds established in the agreement required the development of an advanced stormwater management program, which included construction of treatment facilities and implementation of a rigorous monitoring program to track performance. Treatment facilities consist of three extended dry detention ponds, all of which drain into a wet pond/wetland facility, referred to as the “Water Quality Wetland Pond.” The water quality monitoring program was implemented in 1999 and has been on-going for four years. Compliance with the agreement is based both on percent removal and/or maximum allowable concentrations, depending on the constituent. Results from the sampling program are presented in Tables 1 and 2. In 2001, the Urban Drainage and Flood Control District (UDFCD) modified one of the extended detention basins (EDBs). The pond was modified to reflect the UDFCD’s
36

current criteria for an EDB, as opposed to the early 1990’s criteria according to which the pond was originally constructed. Major changes to the pond included the installation of a sedimentation forebay and a micro pool. The purpose of the modification was to allow the UDFCD to evaluate the performance of an extended detention basin constructed under the new criteria. An automated sampling station was installed at the outlet of the pond so that the effect on water quality could be isolated from the rest of the system. Samples were taken during the 2002 season with positive results. Additional seasons and a more typical season are needed prior to publishing results.
Basin Description Area: • ± 77 acres
Land Use: • Single-Family Detached ± 61 acres
• Multi-Family ± 5 acres
• Open Space (native grass & trails) ± 11 acres
Typical Lot Size: • 50 feet by 100 feet to 75 feet by 110 feet
Typical Street Grades: • Southerly portion 1 percent to 3 percent
• Northerly portion 2 percent to 5 percent
Collection System Description Paved streets, inlets, and reinforced concrete pipe.
FIRST STAGE TREATMENT: THREE EXTENDED DRY BASINS Reflections and Heron Estates Ponds Water Quality Outlet: • Standpipe with gravel jacket (mid 1990s criteria)
40-hour storage capacity for “water quality capture volume,” as defined by UDFCD in Volume III of the Urban Storm Drainage Criteria Manual.
Stormwater Outlet: • Concrete outlet structure with 10- and 100-year
orifice plate restriction. Pond Characteristics: • Extended Dry Pond. • Concrete Trickle Channel.
• Sod Bottom.
Orchard Pond (Revised by UDFCD in 2001) Water Quality Outlet: • Flat plate with vertical row of outlet holes on face of
concrete structure, 40-hour storage capacity for water quality capture volume.
37

Stormwater Outlet: • Concrete outlet structure with 10- and 100-year orifice plate restriction.
Pond Characteristics: • Dry Pond.
• Concrete Forebay.
• Concrete Trickle Channel.
• Micro Pool at Outlet Structure.
• Three-foot shelf of water quality plants along edge of Micro Pool.
• Sod Bottom.
SECOND STAGE TREATMENT: WATER QUALITY WETLAND POND All dry ponds drain into the second stage wetland pond.
Water Quality Wetland Pond Description Water Quality Outlet: • Orifice restriction plate on concrete outlet structure
with 24-hour storage capacity for “water quality capture volume.”
Stormwater Outlet: • 10-year concrete outlet structure, 100-year buried overflow concrete weir structure.
Pond Characteristics: • Three pools separated by riprap berms. • Two outer pools function as collection pools, the
middle pool functions as a release pool. • Pool Bottom: 12-inches of soil over impervious
liner. • Eight-foot wide shelf of wetland plants and typical
water depth on shelf of 4 to 6 inches. • Pool water depth: 2.5 feet. Outlet to Bow Mar Reservoir: • Reinforced Concrete Pipe. • Flared end section with riprap at outlet. • Sheet flow through wooded area prior to reaching
reservoir. WATER QUALITY SAMPLERS (FIVE, TOTAL) Equipment: • ISCO 4250 Area Velocity Flow Meter
• ISCO 3700 Automatic Sampler W/4 one-gallon glass bottles.
• Rain gauge on top. Phone connection for rain event indicator.
38

Location: • Inlet pipes to all three dry ponds
• Outlet pipes from wetland pond and Orchard Pond
Capability: • Measures flows going into dry pond and flow going out of wetland pond.
• Measures flows going into and out of Orchard Pond
• Collects water quality samples
• Telemetry to inform Metro District when samples have been collected
CONSTRUCTION PHASE SYSTEM PERFORMANCE During construction, settleable solids (sediment) entering the Bow Mar Lake were a major concern to Bow Mar residents and the developer. Therefore, the agreement required that the water quality outlet and the 10-year outlet orifice plate be plugged during construction to prevent the discharge of sediment-laden site runoff into Bow Mar Reservoir. All stormwater was either piped or pumped into the Orchard Pond. From there, stormwater was pumped up to a meadow (Mary’s Meadow) and released into a long perforated PVC pipe, which acted like a yard soaker hose. Stormwater was filtered by the meadow before entering an irrigation ditch (Tule Ditch) where Imhoff cone tests were taken to test for levels of settleable solids. Pumps were designed to drain the ponds in three days. Under a few extreme situations such as recurring, large afternoon storms or power outages, storm flows entered the wetland pond through the 100-year control structure. At the wetland pond outlet pipe, Imhoff cone tests were taken. The State of Missouri Department of Natural Resources, at the time, had a construction site limit for settleable solids of 2.5 ml/L/hr; this was utilized at Grant Ranch.
Water Quality (Imhoff Cone Test) Results During Construction Definition of “During Construction”—from the installation of erosion control silt fences to completion of landscape yards for 95 percent of the homes. Test Taken: • Imhoff Cone Test (looks like a large “V” shaped
glass cone) Threshold: • 2.5 ml/L/hr • Samples taken manually with dip bucket Location: • Outlet from wetland pond and irrigation ditch (Tule
Ditch) just north of project. Any stormwater leaving the Grant Ranch was measured from these two locations
39

Results: • Very positive. For the construction seasons of 1996 through 1998, one storm event exceeded the Imhoff cone threshold. This was early in the construction stage during sanitary sewer construction. Modifications were made to erosion control structures
URBANIZED CONDITION PERFORMANCE DATA Tables 1 and 2 summarize system performance for the fully urbanized condition at Grant Ranch, for both wet weather and dry weather conditions. Applicable numeric limits from the 1997 agreement with Bow Mar are included. This agreement defines a wet weather event sampling as a precipitation event that generates between 0.1 and 0.5 inches of precipitation within a 24-hour period. Numeric limits do not apply in larger storms, as these exceed the “water quality capture volume,” specified by UDFCD. Samples are “split” between the Bowles Metropolitan District and Chadwick Associates, consultant for the Bow Mar residents. Both parties conduct laboratory analyses, to crosscheck results. WHAT DID WE LEARN?
• Design needs to consider maintenance by Homeowner Association o Concrete trickle pans are easier to maintain than grass lined swales,
although swales are better for water quality. o Concrete trickle pans are easier to maintain if wide enough to accept
“Bobcat” type equipment. o The revised Orchard Pond with a concrete forebay, concrete trickle
channel and micro pool are easier to maintain than other ponds.
• Reshaping of detention/water quality ponds after years of accepting construction sediment is expensive. Consider over-excavating pond bottom to accept sediment. Adding soil to reshape pond is cheaper than removing mud.
• Silt fences will collapse under the weight of mud and water buildup behind fence (12 inches or more). Conclusion: Design an outlet to limit buildup to 9 to 12 inches. Straw bales were used at low points in the silt fence to control mud and water buildup and were very effective.
• Inlet Protection—Placing sand bags or milk cartons at low point inlets was effective except for the concentrated buildup of mud in one location. Clean up after a storm event was time consuming and expensive. Results: Milk cartons were replaced with sand bags (easily found at Home Depot) and additional sand bags were placed up the street in the flowline to trap silt prior to reaching low point. It was easier to clean small silt buildup than one large mud hole. Arranging for one laborer, new sand bags, shovel, and a pickup is much easier than arranging for a front-end loader.
• Dry pond and wetland pond were effective at removing sediment.
• A conservatively designed and well maintained/monitored system of Best Management Practices (BMPs) can provide superior pollutant removal effectiveness, as shown by the data in Tables 1 and 2.
40

• Sensitive downstream receiving waters can prompt the need for pollutant removal performance that goes well beyond the norm.
• It has been essential to maintain regular and open communication between the developer (and metropolitan district) and the Bow Mar residents. There have been many technical, legal, and other issues to work through from 1997 to 2003, and the various parties have accomplished this.
1 John Carroll, P.E. is a principal of Carroll and Lange, Inc. Carroll and Lange is a highly regarded firm providing professional engineering and land surveying services to developers in the Metro area. 2 Eliot Payson is a Board member of the Bow Mar Home Owner’s Association. Mr. Payson’s duties include the review of water quality data from the Grant Ranch development to ensure the protection of Bow Mar Reservoir. 3 Jonathan Jones, P.E. is Chief Executive Officer of Wright Water Engineers, Inc., where he has worked for 22 years. 4 Matthew J. Gavin attended the University of Colorado Boulder earning a bachelor’s degree in civil engineering. Mr. Gavin is a water resources project engineer at Wright Water Engineers, Inc. in Denver Colorado. His professional duties include water quality sampling and BMP design. 5 Christine Hawley is an environmental engineer with Wright Water Engineers, Inc.
41

Appendix
Analyte
Average Threshold (Baseflow)
Maximum Allowable
Concentration
Sample Date
3-1-00
Sample Date
5-30-00
Sample Date 8-
7-00
Sample Date
8-19-00 AverageTotal Phosphorus (mg/L) 0.2 0.7 0.04 0.51 0.25 0.15 0.24Dissolved Phosphorus (mg/L) - - ND 0.51 0.19 0.11 0.20Total Nitrogen (mg/L) 4.0 - <1.9 <1.9 <1.5 <2.22 <1.88Fecal Coliform (#/100mL) - See Footnote 3 <2 5 67 26 25Nitrate/Nitrite (mg/L) - - ND (<0.1) ND (<0.1) ND (<0.1) 0.12 <0.11Glyphosate (µg/L) 700 - - - ND (<10) - NDMalathion (µg/L) 0.1 - - - ND(<1.5) - ND
Analyte
Percent Removal
Threshold
Maximum Allowable
Concentration
Sample Date
3-16-01
Sample Date
8-20-01
Average Discharge
ConcentrationTotal Phosphorus (mg/L) - 0.7 mg/L 0.087 0.48 0.28Dissolved Phosphorus (mg/L) - - 0.09 0.32 0.21Total Nitrogen (mg/L) - 4.2 3.5 1.26 2.38Fecal Coliform (#/100mL) - - 8000 - 8000Nitrate/Nitrite (mg/L) - - 0.37 0.66 0.52Chloride (mg/L) - - 31 - 31Chemical Oxygen Demand (mg/L) 50% 80 mg/L 42 46 44Total Suspended Solids (mg/L) 75% 200 mg/L 64 ND(< 5 mg/L) 32Cadmium (µg/L) - - 0.86 ND (< 0.2) 0.43Chromium (µg/L) - - 4.7 1.2 3.0Copper (µg/L) 55% 30 5 4.7 4.9Lead (µg/L) 60% 80 ND(<5.0 mg/L) ND(< 1.5 mg/L) 0.00Manganese (µg/L) 50% - 0.068 0.047 0.058Zinc (µg/L) 55% 140 0.018 0.007 0.012
1/ For dry weather sampling events, samples are collected by hand at the outlet of the water quality wetland pond.2/ Concentration Standards were established in the 1997 Stormwater Agreement3/ To be set jointly by parties of Agreement after two sampling seasons.4/ For wet weather sampling events, values reported refer to discharge concentrations at the water quality wetland outlet. Percent Removal concentrations are based on analyses of inflows to tributary dry ponds (not reported herein).
Concentration Standards2
SUMMARY OF GRANT RANCH BMP PERFORMANCE DATA FOR THE 2000 SAMPLING SEASON
Grant Ranch BMP Performance Data for Wet Weather Sampling Events4 in 2001Table 2
Concentration Standards2 Results
Grant Ranch BMP Performance Data for Dry Weather Sampling Events1 in 2000Table 1
Results
42

Analyte/Units
Average Threshold (Baseflow)
Maximum Allowable
Concentration
Sample Date
3-20-01
Sample Date
5-10-01
Sample Date
9-12-01
Sample Date
9-28-01 AverageTotal Phosphorus (mg/L) 0.2 0.7 0.31 - 0.15 0.10 0.19Dissolved Phosphorus (mg/L) - - 0.092 0.048 0.14 0.07 0.09Total Nitrogen (mg/L) 4.0 4.2 4.3 6.1 3.89 7.03 5.33Fecal Coliform (#/100mL) - See Footnote 3 <1 3 50 210 66Nitrate/Nitrite (mg/L) - - ND(<0.1) 1.3 2.69 5.73 2.46ND = non-detectable concentration
Analyte
Percent Removal
Threshold
Maximum Allowable
Concentration
Sample Date
5-18-01
Sample Date
5-30-01
Sample Date5
9-19-01
Average Discharge
Concentration
Average Percent Removal
Total Phosphorus (mg/L) - 0.7 0.15 0.065 0.09 0.102 -Dissolved Phosphorus (mg/L) - - 0.039 0.046 0.073 0.053 -Total Nitrogen (mg/L) - 4.2 4.12 3.23 4.56 3.97 -Fecal Coliform - - - 790 40 415 -Nitrate/Nitrite (mg/L) - - 0.92 0.93 3.46 1.77 -Chloride (mg/L) - - - 40 - 40 -Chemical Oxygen Demand (mg/L) 50% 80 43 40 28 37 59%Total Suspended Solids (mg/L) 75% 200 13 ND (<5) 4 7.3 90%Cadmium (µg/L) - See Footnote 6 - ND (< 5) - ND (< 5) NDChromium (µg/L) - See Footnote 6 - ND (< 2) - ND (< 2) NDCopper (µg/L) 55% 30 - ND (< 5) - ND (< 5) NDLead (µg/L) 60% 80 - ND (< 50) - ND (< 50) NDManganese (µg/L) 50% - - 74 - 74 80%Zinc (µg/L) 55% 140 - 14 - 14 94%ND = non-detectable concentration
1/ For dry weather sampling events, samples are collected by hand at the outlet of the water quality wetland pond.2/ Concentration Standards were established in the 1997 Stormwater Agreement3/ To be set jointly by parties of Agreement after two sampling seasons.4/ For wet weather sampling events, values reported refer to discharge concentrations at the water quality wetland outlet. Percent Removal concentrations are based on analyses of inflows to tributary dry ponds (not reported herein).5/ Sampling event performed for diagnostic purposes only. Rainfall criteria was not satisfied.6/ To be set jointly by parties of Agreement after three sampling seasons.
Concentration Standards2
SUMMARY OF GRANT RANCH BMP PERFORMANCE DATA FOR THE 2001 SAMPLING SEASON
Results
Grant Ranch BMP Performance Data for Wet Weather Sampling Events4 in 2001Table 2
Concentration Standards2 Results
Grant Ranch BMP Performance Data for Dry Weather Sampling Events1 in 2001Table 1
OBTAINED BY THE BOWLES METROPOLITAN DISTRICT(Note: BMOI independently collects laboratory data, which do not appear in Tables 1 and 2)
43

Analyte/Units
Average Threshold (Baseflow)
Maximum Allowable
Concentration
Spring 1 4-16-02
Spring 2 5-30-02
Summer 1 6-26-02
Summer 2 7-24-02 Average
Total Phosphorus (mg/L) 0.2 0.7 0.400 0.1 0.00 0.12 0.16Dissolved Phosphorus (mg/L) - - 0.000 0.06 0.00 0.07 0.03Total Nitrogen (mg/L) 4.0 4.2 1.100 1.6 2.50 1.40 1.65Fecal Coliform (#/100mL)2 - - 0.000 0 - 210.00 70.00Nitrate/Nitrite (mg/L) - - 0.520 0.3 1.75 2.63 1.30Glyphosate (mg/L) 0.7 - n/a n/a 0.0 0.0 0.0Malathion (ug/L) 0.1 - n/a n/a 0.0 0.0 0.01/ Non-detectable concentrations reported as 0 (per Stormwater Agreement)2/ Fecal Coliform Analysis not required for dry weather sampling (per 1997 Stormwater Agreement, Exhibit E)
Analyte
Average Threshold3
(Stormflow)
Maximum Allowable
Concentration
Spring 1 5-13-02
Summer 1 6-4-02
Summer 2 6-17-02
Average Discharge
Concentration3
Average Percent
Removal4Total Phosphorus (mg/L) 0.2 0.7 0.075 0.132 0.12 0.1 -Total Nitrogen (mg/L) 4 4.2 1.3 1.6 1.4 1.4 -Nitrite +Nitrate (mg/L) - - 2.24 0.81 1.4 - -Dissolved Phosphorus (mg/L) - - 0.059 0.15 0.05 - -Chemical Oxygen Demand (mg/L) 50% removal5 80 67 33 38 - 67%Chloride (mg/L) 230 - 42 53 - 39.0 -Cadmium (ug/L) - - 0 0 - - -Chromium (ug/L) - - 0 0 - - -Copper (ug/L) 55% removal 30 6 11 - - 58%Lead (ug/L) 60% removal 80 0 0 - - 67%Manganese (ug/L) 50% removal - see Footnote 6 see Footnote 6 - - 53%Zinc (ug/L) 55% removal 140 5 8.4 - - 87%Ethyl Benzene (mg/L) 0.68 32 - 0 - 0.0 -Toluene (mg/L) 1 17.5 - 0 - 0.0 -Glyphosate (mg/L) 0.7 - - 0 - 0.0 -Malathion (ug/L) 0.1 - - 0 - 0.0 -Oil and Grease (mg/L) 15 - 0 0 - 0.0 -Total Suspended Solids (mg/L) 75% removal 200 9 9 3 - 97%Fecal Coliform (#/100 mL) 60% removal7 - 230 2300 310 - 92%
1/ Non-detectable concentrations reported as 0 (per 1997 Stormwater Agreement).2/ Concentration Standards were established in the 1997 Stormwater Agreement.
5/ Percent removal concentrations are based on analyses of inflows to tributary dry ponds (reported in Attachment B).6/ Mn not analyzed due to an error in the analytical suite applied by Metro Wastewater Reclamation District Laboratories.7/ This is a performance goal. A performance threshold has not been set.
4/ Calculated average for comparison to average threshold standard. Calculations include results from sampling events prior to 2001 (not reported herein).
3/ Calculated as the running average of the four most recent samples (flow-weighted). Calculations include results from sampling events prior to 2001 (not reported herein).
Concentration Standards2
SUMMARY OF GRANT RANCH BMP PERFORMANCE DATA FOR THE 2002 SAMPLING SEASON
Grant Ranch BMP Performance Data for Wet Weather Sampling Events in 2002Table 2
Concentration Standards
Grant Ranch BMP Performance Data for Dry Weather Sampling Events1 in 2002
Results at Wetland Pond Outfall1
Results at Wetland Pond Outfall
Table 1
OBTAINED BY THE BOWLES METROPOLITAN DISTRICT(Note: BMOI independently collects laboratory data, which do not appear below)
44

THE ROCKY FLATS ENVIRONMENTAL TECHNOLOGY SITE BMP EXPERIENCE AND
IMPLICATIONS FOR SITE CLOSURE
George Squibb1, URS Corporation Ian Paton2, Wright Water Engineers, Inc.
ABSTRACT The Rocky Flats Environmental Technology Site (RFETS or Site) is a Department of Energy facility located approximately 16 miles northwest of Denver, Colorado that was formerly used to process and manufacture nuclear weapons components. Currently, the Site is undergoing closure, environmental remediation, and conversion into a National Wildlife Refuge. The primary surface water contaminants of concern, plutonium-239/240 and americium-241, resulted from releases to the environment during historic Site operations. These radionuclides are transported in surface water as insoluble particles associated with suspended solids. Monitoring data demonstrate that the Site’s detention ponds are generally effective measures for settling these contaminants and reducing their transport via the surface water pathway.
INTRODUCTION Processing and fabrication of nuclear weapons components occurred at Rocky Flats from 1952 through 1989. Operations at the Site included the use of several radionuclides, including plutonium-239/240 (Pu), americium-241 (Am), and various uranium (U) isotopes. These historic operations resulted in legacy contamination, including contaminated facilities, process waste lines, buried wastes and surface soil contamination. The current focus of work at RFETS involves decommissioning and demolishing buildings and facilities, and remediating environmental contamination. Following closure, the Site will be converted into a National Wildlife Refuge. This transition is scheduled to occur by 2006. The Site has historically used detention ponds to settle suspended solids in surface water runoff. Pu and Am are virtually insoluble under normal environmental conditions and are transported when contaminated soil particles are eroded and suspended in
45

runoff. Monitoring the ponds’ influent and effluent allows for assessment of their effectiveness in removing Pu and Am from the water column. BACKGROUND INFORMATION Site Description and Pond Operating Protocol RFETS encompasses approximately 6,585 acres. Major structures are located within a centralized 385-acre Industrial Area, which in the late 1980s comprised a complex of over 440 structures used for manufacturing, chemical processing, laboratory, and support activities. A 6,200-acre grassland Buffer Zone surrounds the Industrial Area (Figure 1). FIGURE 1. Rocky Flats Environmental Technology Site
SW093
995POE
GS10
GS08
GS11
SW027
GS31
A-1
A-2A-3
A-4
B-1B-2
B-3B-4
B-5
C-1C-2
Landfill Pond
McKay Ditch
No Name Gulch
North Walnut Creek
SouthW
alnut Cre
ek
Woman CreekSouth Interceptor Ditch
Mower Ditch
IndustrialArea
0 2,250 4,5001,125 Feet
Selected Automated Surface-WaterMonitoring Location
Surface water flow across RFETS is primarily from west-to-east, with two major drainages, Walnut Creek and Woman Creek, receiving runoff from the Industrial Area. Walnut Creek has two main branches (North and South Walnut Creek). Streams and seeps at RFETS are largely ephemeral, with stream reaches gaining or losing flow, depending on the season and precipitation. Though each major drainage has multiple detention ponds (South Walnut Creek has the most, with five), many of the ponds are operated “off-line” to maintain storage capacity for emergency spill containment. Only the largest, most downstream ponds are discussed in this paper. These “terminal ponds” are:
• Pond A-4 – North Walnut Creek • Pond B-5 – South Walnut Creek • Pond C-2 – South Interceptor Ditch (tributary to Woman Creek)
46

Descriptions of the terminal ponds, including their size, basin characteristics, and monitoring stations, are provided in Table 1. TABLE 1. Summary of Walnut Creek and Woman Creek tributaries and ponds. Drainage Tributary
Terminal Detention Pond
Average Discharge (acre-ft/year) [Water Yrs.]
Capacity(acre-ft)
Basin Description and Monitoring Stationsfor Terminal Pond[upstream; downstream]
Walnut Creek
North Walnut Creek
A-4 190 [WY1996 - 02]
99.7 Northern Industrial Area basin (441 acres) [SW093; GS11]
South Walnut Creek
B-5 230 [WY1996 - 02]
73.6 Central Industrial Area basin (260 acres) Site WWTP effluent (approx. 65% of Pond B-5 inflow) [GS10, WWTP; GS08]
Woman Creek
South Interceptor Ditch
C-2 23 [WY96 – 02]
69.4 Southern Industrial Area basin (214 acres) [SW027; GS31]
All of the terminal ponds are operated in a batch release mode. After filling to a specified limit (typically between approximately 40 to 50 percent of capacity), each of the ponds is sampled by the Site, in conjunction with the Colorado Department of Public Health and Environment (CDPHE), for a range of analytes, including selected radionuclides, metals, inorganics and organics. If results meet water quality acceptance criteria, the ponds are discharged to flow off the Site. Pond A-4 discharges typically occur 2 to 3 times per year (North Walnut Creek), Pond B-5 discharges typically occur 5 to 7 times per year (South Walnut Creek), and Pond C-2 discharges typically occur once every one to two years (Woman Creek).
Regulatory Framework and Monitoring Network Surface water monitoring at RFETS is guided by requirements of the Rocky Flats Cleanup Agreement (RFCA). Flow into the terminal ponds is monitored at Point-of-Evaluation (POE) monitoring locations. Discharges from the terminal ponds are monitored at Point-of-Compliance (POC) monitoring locations (stations listed in Table 1).
47
Flow monitoring and sampling at all POC and POE monitoring locations are performed using automated monitoring stations, part of a network currently comprising 50 automated surface water monitoring stations across the Site. Samples are collected using a continuous, flow-weighted composite sampling protocol. Behavior of Plutonium, Americium and Uranium in the Environment Actinides, which include Pu, Am, and U, are generally less soluble in lower oxidation states and more soluble in higher oxidation states. In environmental conditions, Pu and Am tend to exist in lower oxidation states III (Am) and IV (Pu), and are relatively insoluble (Cleveland, 1979; Livens, et al., 1986; and Bondietti, et al., 1977). In contrast, U is stable in both oxidation states IV and VI, with oxidation state VI dominant in surface and near-oxidizing conditions (Grenthe, et al., 1993 and Ball, 2000). The higher oxidation state U(IV) forms compounds of greater solubility than Pu(IV) or Am(III), and therefore exhibits a tendency to exist in chemical forms that are more soluble than Pu or Am. Because of the extremely low solubilities of Pu and Am (the Pu concentration in solution under oxidizing environmental conditions is approximately 1 x 10-11 moles/liter [Knopp, et al., 1999]), these elements are predominantly associated with solids (Cleveland, 1976). They are either strongly sorbed, or attached, to soil and sediment particles or precipitated as oxides and hydroxides (Warner and Harrison, 1993 and Livens, et al., 1986). Therefore, the transport of Pu and Am is dominated by physical processes, such as wind and water erosion of soils that contain these radionuclides (Whicker and Schulz, 1982). In contrast, U is more prone to be transported as a dissolved chemical species, although U transport can also occur in particulate form (Ball, 2000). Site-specific experiments indicate that approximately 10 percent of Pu in surface water runoff from the Industrial Area in South Walnut Creek (at station GS10) is associated with colloid-size particles (0.001 to 0.1 micron diameter) (Santschi and Guo, 2000). Therefore, it is expected that a fraction of Pu and Am, associated with colloids that do not settle, would not be removed from the water column via settling in the ponds. DATA Walnut Creek Actinide Loads Actinide loading data for Walnut Creek, collected from October 1997 through September 2002, are presented in Table 2. The table does not distinguish between North and South Walnut Creek for percent removal of actinides, because pumped transfers of water between the drainages makes analysis of the individual drainages misleading. Therefore, for overall actinide removal efficiency, North and South Walnut Creeks are analyzed collectively as one system with multiple inputs and outputs. Figures 2, 3, and 4 present the Pu, Am, and U loads, respectively, flowing into and discharged from the Walnut Creek ponds. The Walnut Creek ponds’ removal efficiency for Pu and Am (69 and 85 percent, respectively) is significantly larger than for U (9 percent removed). This large variation is expected because of the greater solubility of U compared to Pu and Am. In terms of the Pu and Am that passes through the ponds without settling, it is explained, at least in part, by the fraction associated with colloid-size particles.
48

TABLE 2. Actinide Loads In and Out of Walnut Creek Ponds (October 1997 – September 2002) Actinide Influent Load
(g) Effluent Load (g)
Percent Removal of Input Load
SW093 (North Walnut)
GS10 (South Walnut)
WWTP (South Walnut)
Total Influent Load
GS08 (Pond A-4, North Walnut
GS11 (Pond B-5, South Walnut)
Total Effluent Load
Pu-239,240 5.20E-4 1.74E-3 8.12E-5 2.34E-3 5.80E-4 1.37E-4 7.17E-4 69%
Am-241 7.52E-6 4.85E-5 1.94E-6 5.80E-5 6.29E-6 2.35E-6 8.64E-6 85%
Total U 3.96E+3 3.03E+3 1.28E+3 8.27E+3 3.12E+3 4.44E+3 7.55E+3 9%
FIGURE 2. Plutonium-239/240 Loads in Walnut Creek (October 1997 – September 2002)
Plutonium-239/240 - Walnut Creek Ponds
0.0E+00
5.0E-04
1.0E-03
1.5E-03
2.0E-03
2.5E-03
Total Influent Load to Ponds Total Effluent Load from Ponds
Pu-2
39,2
40 L
oad
(g)
69% Removal
FIGURE 3. Americium-241 Loads in Walnut Creek (October 1997 – September 2002)
Americium-241 - Walnut Creek Ponds
0.0.E+00
1.0.E-05
2.0.E-05
3.0.E-05
4.0.E-05
5.0.E-05
6.0.E-05
7.0.E-05
Total Influent Load to Ponds Total Effluent Load from Ponds
Am
-241
Loa
d (g
)
85% Removal
49
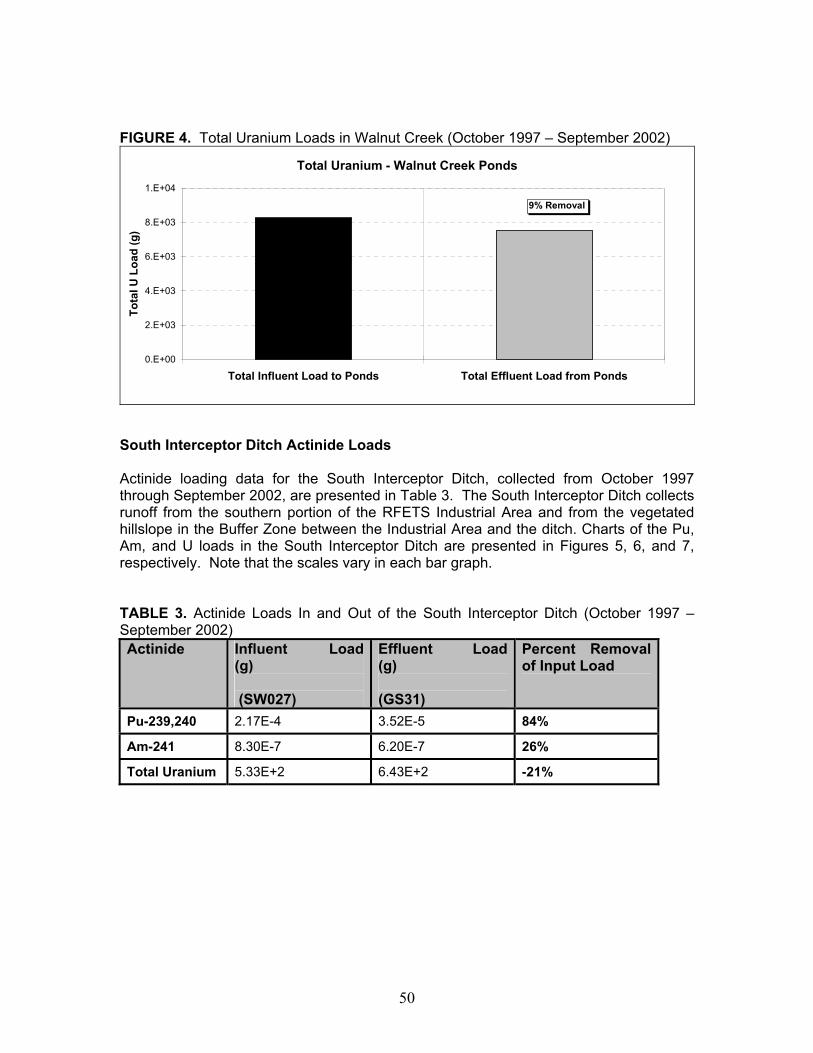
FIGURE 4. Total Uranium Loads in Walnut Creek (October 1997 – September 2002)
Total Uranium - Walnut Creek Ponds
0.E+00
2.E+03
4.E+03
6.E+03
8.E+03
1.E+04
Total Influent Load to Ponds Total Effluent Load from Ponds
Tota
l U L
oad
(g)
9% Removal
South Interceptor Ditch Actinide Loads Actinide loading data for the South Interceptor Ditch, collected from October 1997 through September 2002, are presented in Table 3. The South Interceptor Ditch collects runoff from the southern portion of the RFETS Industrial Area and from the vegetated hillslope in the Buffer Zone between the Industrial Area and the ditch. Charts of the Pu, Am, and U loads in the South Interceptor Ditch are presented in Figures 5, 6, and 7, respectively. Note that the scales vary in each bar graph. TABLE 3. Actinide Loads In and Out of the South Interceptor Ditch (October 1997 – September 2002) Actinide Influent Load
(g) (SW027)
Effluent Load(g) (GS31)
Percent Removal of Input Load
Pu-239,240 2.17E-4 3.52E-5 84%
Am-241 8.30E-7 6.20E-7 26%
Total Uranium 5.33E+2 6.43E+2 -21%
50

FIGURE 5. Plutonium-239/240 Loads in the South Interceptor Ditch/Pond C-2 System
Plutonium-239/240 - Pond C-2
0.0.E+00
5.0.E-05
1.0.E-04
1.5.E-04
2.0.E-04
2.5.E-04
Total Influent Load to Pond C-2 Total Effluent Load from Pond C-2
Pu-2
39,2
40 L
oad
(g)
84% Removal
FIGURE 6. Americium-241 Loads in the South Interceptor Ditch/Pond C-2 System
Americium-241 - Pond C-2
0.E+00
2.E-07
4.E-07
6.E-07
8.E-07
1.E-06
Total Influent Load to Pond C-2 Total Effluent Load from Pond C-2
Am
-241
Loa
d (g
) 26% Removal
FIGURE 7. Total Uranium Loads in the South Interceptor Ditch/Pond C-2 System
Total Uranium - Pond C-2
0.E+00
2.E+02
4.E+02
6.E+02
8.E+02
1.E+03
Total Influent Load to Pond C-2 Total Effluent Load from Pond C-2
Tota
l U L
oad
(g) 21% Gain
51

Similar to the Walnut Creek drainages and ponds, the removal efficiency in Pond C-2 is greater for Pu and Am than for U. As shown, Pond C-2 gains total U load, with the effluent U load more than 20 percent larger than in the influent. The efficiency of Pond C-2 in removing Am (26 percent removal) is less than that observed in the Walnut Creek drainage. This result should be qualified with the observation that less than 1 microgram was measured in the total influent load over 5 years. The analytical limitations associated with such small quantities, combined with relatively few data points (Pond C-2 is typically discharged once per year at most), add to the uncertainty of Am removal efficiency result for Pond C-2. Turbidity Total Suspended Solids (TSS) data are collected for the terminal ponds’ influent and effluent. However, gaps exist for TSS data during low-flow periods because the flow-paced sampling protocol will frequently not fill the sample container quickly enough to allow for TSS analysis prior to the 7-day sample holding time expiring. Therefore, most of the TSS data are from samples collected during storm events. Because actinide data are collected at both low flows and high flows, comparison of TSS with actinide data introduces uncertainty because of the different flow conditions during which the data were collected. Turbidity data, however, are collected continuously at 15-minute time intervals using water quality probes. For example, turbidity data collected in March 2002 for South Walnut Creek, collected upstream and downstream from Pond B-5, are presented in Figures 8 and 9, respectively. Turbidity values and flow rates are plotted at 15-minute intervals in both figures. FIGURE 8. Turbidity and Discharge Data at GS10 – Influent to Pond B-5 (March 2002)
0
100
200
300
400
500
600
3/1/
02
3/2/
02
3/3/
02
3/4/
02
3/5/
02
3/6/
02
3/7/
02
3/8/
02
3/9/
02
3/10
/02
3/11
/02
3/12
/02
3/13
/02
3/14
/02
3/15
/02
3/16
/02
3/17
/02
3/18
/02
3/19
/02
3/20
/02
3/21
/02
3/22
/02
3/23
/02
3/24
/02
3/25
/02
3/26
/02
3/27
/02
3/28
/02
3/29
/02
3/30
/02
3/31
/02
4/1/
02
Date
Turb
idity
in N
TU
0.0
0.5
1.0
1.5
2.0
2.5
3.0
Dis
char
ge in
CFS
TurbidityDischarge
52

FIGURE 9. Turbidity and Discharge Data at GS08 – Effluent from Pond B-5 (March 2002)
0
100
200
300
400
500
600
3/1/
02
3/2/
02
3/3/
02
3/4/
02
3/5/
02
3/6/
02
3/7/
02
3/8/
02
3/9/
02
3/10
/02
3/11
/02
3/12
/02
3/13
/02
3/14
/02
3/15
/02
3/16
/02
3/17
/02
3/18
/02
3/19
/02
3/20
/02
3/21
/02
3/22
/02
3/23
/02
3/24
/02
3/25
/02
3/26
/02
3/27
/02
3/28
/02
3/29
/02
3/30
/02
3/31
/02
4/1/
02
Date
Turb
idity
in N
TU
0.0
0.5
1.0
1.5
2.0
2.5
3.0
Dis
char
ge in
CFS
Turbidity
Discharge
The peak turbidity values at station GS10, influent to Pond B-5, are associated with peaks on the hydrograph during storm events and range up to approximately 500 nephelometric turbidity units (NTUs) (Figure 8). The turbidity for the Pond B-5 effluent, at station GS08, is much less variable than in the influent, and peak values fall in the range of approximately 50 NTUs (Figure 9). The average turbidity, however, exhibits a different pattern than the peak turbidity for the Pond B-5 influent and effluent. For all measured periods from October 1996 through September 2002, the average turbidity was higher in the effluent than the influent (20.0 versus 10.2 NTUs). This is likely attributed to algae growth in Pond B-5, fed by nutrients from Wastewater Treatment Plant discharges to South Walnut Creek. Despite the higher average turbidity in the pond effluent, the increased turbidity does not result in increased actinide loads discharged from the pond. CONCLUSIONS The Ponds as BMPs • The terminal ponds at RFETS are generally effective for removing Pu and Am from
the water column. Both Pu and Am are virtually insoluble under normal environmental conditions and are transported with soil and sediment particles eroded by surface water runoff.
• The ponds are not effective for removing U, a relatively soluble actinide in oxidizing
environmental conditions, compared to Pu and Am.
• The fraction of Pu and Am that passes through the ponds can be attributed, in part, to their association with colloidal material that will not settle.
• Increased levels of turbidity in Pond B-5 effluent, likely caused by algae growth, do
not result in increased actinide loads discharged from the pond.
53

Lessons Learned and Implications for Site Closure • TSS samples are difficult to collect continuously because of sample holding time
requirements. Although turbidity data can be collected continuously with a water quality probe, turbidity is not necessarily representative of solids, nor contaminants associated with solids, such as Pu and Am.
• Terminal ponds should remain throughout the remediation phase of the Site as
protective measures to capture insoluble actinides, such as Pu and Am, in stormwater runoff.
• In addition to using ponds as control measures, limiting Pu and Am loading to surface water must address minimizing the erosion of surface soils and sediments that have residual contamination.
54
REFERENCES Ball, J.W. 2000. Geochemical Modeling of Solar Ponds Plume Groundwater at the
Rocky Flats Environmental Technology Site, Part I: Ion Plots and Speciation Modeling. Golden, CO: U.S. Geological Survey.
Bondietti, E.A., S.H.Sweeton and H. Fox. 1977. Transuranic Speciation in the
Environment. In Trnasuranics in Natural Environments, eds. M.G. White and P.B. Dunaway, NVO-178, U.S. Energy Research and Development Administration. Springfield, VA: NTIS.
Cleveland, J.M., T.F. Rees and W.C. Gottschall. 1976. Factors Affecting Solubilization
of Plutonium and Americium from Pond Sediments at the Rocky Flats Facility. Report ES-376-76-196. Golden, CO: Rockwell International, Rocky Flats Plant.
Cleveland, J.M., 1979. The Chemistry of Plutonium. LaGrange Park, IL: American
Nuclear Society. Grenthe, I. , J. Fueger, R.J.M. Konings, R. J. Lemire, A. B. Muller, C. Nguyen-Trung, H.
Wanner, review team. 1993. Chemical Thermodynamics of Uranium> Volume 1 of Chemical Thermodynamics Series. H. Wanner and I. Forest (eds.). Elsevier Science Publishing Company, Inc. New York, New York.
Kaiser-Hill, 2002. Actinide Migration Evaluation Pathway Analysis Report. Rocky Flats
Environmental Technology Site. Golden, CO. April 2002. Knopp, R., V. Neck and J.I. Kim. 1999. Solubility, Hydrolysis and Colloid Formation of
Plutonium (IV). Radiochimica Acta, No. 86, pp. 101-108. Livens, F.R., M.S. Baxter and S.E. Allen. 1986. Physico-Chemical Associations of
Plutonium in Cumbrian Soils. In Speciation of Fission and Activation Products in the Environment, eds. R.A. Bulman and J.R. Cooper. Amsterdam, Netherlands: Elsevier, pp. 143-150.
Santschi, P.L. and L. Guo. 2000. Final Report on Phase Speciation of Pu and Am for
Actinide Migration Studies at the Rocky Flats Environmetnal Technology Site. Texas A&M University. September, 29 2000.
Warner, F. and R.M. Harrision, eds. 1993. Radioecology After Chernobyl. New York:
John Wiley and Sons. Whicker, F.W. and V. Schulz, 1982. Radioecology: Nuclear Energy and the
Environment, Vol. 1 and 2. Boca Raton, FL: CRC Press, Inc.
55

1George Squibb, M.S. Civil Engineering, University of Colorado, Boulder. George has been working on water quality issues at the Rocky Flats site for the past 10 years. He is the lead engineer responsible for building and managing the automated surface water monitoring network that gages and samples surface water at approximately 50 locations around the site. 2Ian Paton, M.S. Civil Engineering, University of Colorado, Boulder
56

SESSION THREE
57

SESSION THREE OVERVIEW: Stormwater Volume Controls
James T. Wulliman, P.E.1
Muller Engineering Company, Inc. Lakewood, Colorado
Increased Stormwater Volume Associated with Urbanization The desirable resources and natural functions of lakes and streams are somewhat fragile; they can be disturbed and impacted by natural causes or the activities of people. The modern phenomenon of constructing cities – with homes, places of business, driveways, sidewalks, roads, and parking lots – creates significant impacts that can degrade the health of our water resources. The chief cause of degradation is the increased stormwater runoff generated by roofs and pavement; rainfall can no longer penetrate these surfaces and infiltrate into the ground, so instead, it accumulates and flows downstream in greater volume and at greater peak rates and velocities than ever before. Stream Degradation Impacts Increased runoff throws a natural stream’s equilibrium out of balance, leading to degradation (lowering of the stream bed via erosion) as the channel flattens its gradient to compensate for the extra flow. This sets up a cycle of bank erosion and tends toward a progressively deeper and wider channel. Vertical banks up to 10 to 20-feet high can be found along degrading streams in the Denver metropolitan area. Degradation usually displaces any vegetation that formerly existed along the channel and tends to lower the water table under the overbanks, drying up riparian vegetation and creating more of prairie, dryland grass environment adjacent to streams. Stream degradation concentrates flood flows. Storm runoff that formerly may have spread out several hundred or a thousand feet wide and flowed two to four feet deep may run, say, ten feet deep and thirty feet wide in a degraded channel. The velocity and erosive power of the concentrated flow may be two or three times greater than in a natural floodplain, further exacerbating degradation. Thus, in an urbanizing environment, floods not only become more erosive, but occur more frequently. A flood that used to occur only once in ten years may now happen several times each year due to the increased runoff from roofs and pavement.
58

Water Quality Impacts Increased storm runoff from urbanization impacts water quality in several ways:
• Pollution associated with eroding stream sediments • Increase in pollutant loads from watershed surfaces
The quantity of sediment eroded from the beds and banks of degrading stream channels can be substantial; an inch of erosion in the bottom of a watershed’s stream network could send the equivalent of hundreds or thousands of dump trucks of soil to downstream receiving waters. The sediment itself can cause problems, impairing aquatic habitat, clogging channels and culverts, and filling reservoirs. In addition, many pollutants bind to sediment particles and get carried along with the sediments, only to be later released. In this way, sediment-bound constituents (phosphorus, heavy-metals, and the like) can impair water quality. Phosphorus is of special concern in watersheds upstream of reservoirs because it is a critical nutrient leading to excessive algal growth. Excessive algal growth in a reservoir, although an impairment in itself, is also indicative of potential health problems such as lack of dissolved oxygen in the bottom of the reservoir, something that can further release phosphorus and other pollutants from sediments and even lead to fish kills. Urbanization and increased runoff can cause a corresponding increase in pollutant loads from watershed surfaces, since there are more sources of pollution in an urban environment (fertilizers, petroleum products, and atmospheric fallout from vehicles and smokestacks), and there is more runoff to carry pollutants to downstream receiving waters. Since pollutant loads are calculated as the product of runoff volume and the concentration of the pollutant in the runoff, and since urbanization tends to increase both pollutant concentrations and the volume of runoff, urbanization creates a “double” increase in pollutant load over pre-development conditions. Stormwater Volume Controls Stormwater volume controls seek to mitigate urban impacts to downstream receiving waters by addressing the cause of stream degradation and increased pollutant loading. If taken to their fullest extent, new development projects incorporating volume controls could potentially come close to replicating predevelopment hydrology and pollutant loading. Controlling runoff at its source would be of considerable value in lessening impacts and reducing the effort that it takes to stabilize downstream channels and reduce pollutant loading. These presentations focus on the need for stormwater volume controls, design examples and techniques for incorporating volume controls in new development projects, and institutional issues associated with ensuring that volume controls are properly designed, constructed, and maintained. This overview was modified from a discussion of urban runoff impacts written for The Trust for Public Land’s Cherry Creek Basin Open Space Conservation and Stewardship Plan, to be completed in summer, 2003.
59

1Jim Wulliman is a project manager with Muller Engineering Company. He received a bachelor’s degree in civil engineering from Valparaiso University and a master’s degree in civil engineering from Colorado State University. Jim has worked on water resources projects in Colorado for 25 years, and since being involved in the Shop Creek phosphorus control improvements in 1988, has made stormwater quality a major focus of his work. Jim has designed a number of regional water quality projects for the Cherry Creek Basin Water Quality Authority and other clients and has assisted with the development of water quality and erosion control BMP manuals for the Urban Drainage and Flood Control District and Douglas County. Jim is currently active in investigating “Smart Growth” and “low impact development” techniques for water quality enhancement.
60

MAKING THE CASE FOR STORMWATER VOLUME CONTROLS
Caroline Nardi1, Dept of Civil Engineering
University of Notre Dame Notre Dame, IN
Larry A. Roesner2, Dept of Civil Engineering
Colorado State University Fort Collins, CO
ABSTRACT It has been shown that the predevelopment flow frequency curve can largely be reproduced in simulation using a combination of flood control detention basins and best management practices (BMPs) for pollutant removal (Nehrke, 2002). This study examines the effectiveness of the state-of-practice flow controls on the flow duration curve, and how well the post-development flows are controlled to the predevelopment levels. Continuous simulation, using 50 years of hourly rainfall record, was performed on two climatically different locations. Detention ponds with a variety of flow control orifices were simulated singularly and in combination with extended detention and swale BMPs. Conclusions are drawn concerning the efficiency of the current state-of-practice on controlling the flow duration curve and its correlation with controlling the flow frequency curve.
INTRODUCTION
It has been widely accepted that urbanization can change the geometry and stability of a stream, particularly by enlargement of the channel downstream. Channel enlargement severely lowers the quality of the stream’s habitat, and is thought to be responsible for the drop in aquatic diversity in urban streams. It is commonly thought that channels are shaped primarily by bankfull flows, and thus stormwater management has focused largely upon lowering peak discharges to pre-development levels (Caraco, 2000). However, these management practices increase the duration and frequency of bankfull flows. Research has been conducted to show that pre-development flow-frequency curves can largely be reproduced in simulations using a combination of flood control detention basins and BMPs for pollution removal (Nehrke, 2002). However, it has been suggested that even if flow-frequency curves can be lowered to predevelopment levels, the flow-duration curve will still be changed because of an increased volume of
61

stormwater in the system. This study investigates if post-development flow-duration curves can also be lowered to predevelopment levels in simulations using a combination of flood control detention basins and BMPs. STUDY APPROACH AND INITIAL FINDINGS The test watershed for this study was a 24 acre proposed subdivision illustrated in Figure 1. Two climatically diverse sites were chosen for simulation; Fort Collins, Colorado and Atlanta, Georgia. Fort Collins is representative of a semi-arid climate with little rainfall, while Atlanta has a humid, temperate climate. In the predevelopment watershed, runoff would have sheet flowed across the land, acting as a single subcatchment. In the post-development state, the watershed was divided into twenty-two subcatchments, with differing levels of imperviousness. The site layout, as shown in Figure 1, and preliminary event simulations using the USEPA SWMM Model were performed by Melissa Figurski (2001). Figures 2 and 3 show the comparison of the pre-development rudevelopment runoff (47% overall directly connected imperviousnthe 2-yr and 10-yr storms.
Comparison of Predevelopment Flow to Postdeveloyr Storm in Fort Collins, CO
0
1
2
3
4
5
6
7
8
9
0 10000 20000 30000 40000 50000 6
Time (sec)
PreDevelopment PostDevelopment
Fig 2
62
Fig 1: Site Layout
noff with the post-ess) for Fort Collins for
pment Flow for 2-
0000 70000 80000

Comparison of Predevelopment Flow to Postdevelopment Flow for 10-yr Storm in Fort Collins, CO
0
5
10
15
20
25
0 10000 20000 30000 40000 50000 60000 70000 80000
Time (secs)
10YrPre 10YrPost
Fig. 3
Nerke (2002), used this network, and applied the Environmental Protection Agency (EPA) Storm Water Management Model (SWMM) in continuous simulation mode to examine the entire spectrum of the runoff flow-frequency curve. 50 years of continuous simulation were run using hourly rainfall data from the National Climatic Data Center (NCDC) for Fort Collins, Colorado for the period 1948 to 1998. Summary statistics for these rainfall records are shown in Table 1. Table 1: Precipitation Summary
Annual Precipitation
Mean Storm Depth*
Runoff Events per Year Annual Runoff (mm) Location
Millimeters/Year Millimeters Undeveloped Developed Undeveloped DevelopedFort Collins, CO 335 11 27 47 12 124 * Values obtained from Figure 5.3 ASCE MOP (1998) The statistical analyses were performed on the runoff hydrographs generated by the SWMM model. Nerke (2002) focused on the frequency of the peak flows generated by individual events. The partial duration series were examined, allowing for the analysis of high frequency, low runoff producing storms, down to the event equaled or exceeded 18 times in a year. The partial duration series looks at ALL the events that occur during the period of record, in contrast to the annual maximum/minimum series. This is important because the authors are interested in the flow frequency curve below the one-year recurrence interval cutoff.
63

This study focused on flow-duration analyses of the runoff control scenarios examined by Nerke (2002). The Effective Discharge Program, developed by CSU is designed to analyze flows, effective discharges, and sediment transport capabilities for single events, as well as extended records. It was only used in this study to tabulate flow data from the SWMM model and to create flow-duration curves. The undeveloped watershed was tested first as a basis for comparison with subsequent simulations. The developed watershed was then tested with no flow controls for four different levels of imperviousness: 16%, 28%, 37%, and 47%. The developed uncontrolled watershed was simulated as a drainage system made up of concrete gutters draining to circular concrete pipes. All sizing of the pipes and setup of the drainage system were performed by Nehrke (2002). Figure 4 shows the flow frequency curve that would result from a conventional (gutters and pipes) storm drainage system with no flow controls.
Exceedance Frequency for Various Levels of Development in Fort Collins, Colorado
0.01
0.10
1.00
10.00
100.00
0.010.101.0010.00100.00
Exceedances per Year
47% Imperv.37% Imperv.28% Imperv.16% Imperv.Undeveloped
Fig. 4
Traditionally flow-duration curves are plotted with the cumulative occurrence probability as a function of the flow rate. This was the first approach used in this study. But as shown in Figure 5, plotting the duration as a probability function results in flow-duration curves which can largely be controlled by flood controls and BMPs, even with an increased volume of stormwater runoff. The problem with this approach is that the probability function displays only the percentage of the total outflow for a given flow rate, and does not take into account the difference in total hours of outflow between different system configurations. As shown in table 1, the hours of total outflow for systems containing a BMP are about ten times larger than those for the undeveloped scenario. To account for these differences, the flow-duration curves were plotted with exceedance duration, the number of hours per year that the outflow is greater than or equal to a given flow, as a function of flow rate.
64

Figure 5 shows the flow-duration curves corresponding to the undeveloped case and the four different levels of imperviousness with traditional gutter and pipe drainage with no flow controls.
Fig 5. Effects of development on flow duration curve for Fort Collins, CO
To study the effectiveness of flow controls on flow frequency and on flow duration, a detention basin was added at the end of the drainage system. The detention basin was modeled as multi-orifice system, with the smallest orifice on the bottom and progressively larger orifices above, as shown in Figure 6. The sizing of the detention basins and outlet orifices was done by Seth Nehrke (2002). Flood Control
Orifices BMP
Orifice
Fig. 6: Detention Basin Outlet Arrangement
65

The following combinations of controls were considered:
100/10 year controls • • • • • • •
•
100/10/2 year controls 100/10/BMP controls 100/10/2/BMP controls 100/2/BMP controls 100/1/BMP controls 100/BMP designed to control 1 year storm using Rainmaster analysis (Fort Collins only) 100/10 year controls with grass swales and channels
• 100/10/2 year controls with grass swales and channels • 100/10/BMP controls with grass swales and channels
In all scenarios, the BMPs were modeled as extended detention basins. In the final three scenarios, concrete gutters and conduits were replaced by grass swales and grass trapezoidal channels draining to the detention basins. SUMMARY OF NERKE’S FINDINGS ON CONTROLLING THE FLOW FREQUENCY CURVE Common practice for flood control in the United States consists of controlling the flow for the 100-year, 10-year, and sometimes the 2-year storm. Figure 7 shows the effect of detention basins and extended detention on the flow frequency curve for Fort Collins.
Exceedance Frequency for Detention Basins in Fort Collins, Colorado
0.001
0.010
0.100
1.000
10.000
0.010.101.0010.00100.00
Exceedances per Year
Uncontrolled
100&10&2-yr Controls
100&10&BMP Controls
Undeveloped
Fig. 7: Effects of flood detention and extended detention basins in Fort Collins,CO The flow frequency curves for the undeveloped case and the fully developed (47% composite imperviousness) with no flow controls are also shown for reference. The
66

figure shows that in flow control alone is effective for storms larger than the smallest design storm (2-yr). But for smaller storms the flow frequency curve wanders back towards the uncontrolled curve, showing that runoff from very frequent storms is essentially uncontrolled. Adding extended detention, with 24 hour drawdown time greatly improves the reproduction of the flow frequency curve for small storms, but that control becomes weaker and weaker as progressively larger storms overtop the BMP. Nerke found that by sizing the flow control for the break point in the flow frequency curve (see the 1.4-year storm in Figure 7, that the flow frequency curve can be reproduced very closely as indicated in Figure 8.
Fig. 9: Fitting the Predevelopment Flow Frequency Curve in Fort Collins, CO with Detention Controls for the 100- and 1.4-yr Storms, and an Extended Detention BMP
Exceedance Frequency for Detention Basins in Fort Collins, Colorado
0.001
0.010
0.100
1.000
10.000
0.010.101.0010.00100.00
Exceedances per Year
Uncontrolled
Undeveloped
100&Rmstr BMP for Hist.1.4yr Controls
1.4-yr Frequency
EFFECTS OF PEAK SHAVING ON THE FLOW FREQUENCY CURVE It is well known that an increase in imperviousness in a watershed increases the volume of runoff for the watershed system (ASCE 1998). As seen above in Figure 5, increasing imperviousness also increases the duration of outflows, even in an uncontrolled system. In the Fort Collins simulation outflows of 0.01 cfs or greater occurred for 245 hours per year in the fully developed uncontrolled watershed, while in the predevelopment setting flows occurred at this level for only 120 hours per year, i.e. the duration of flows greater than 0.01 cfs were two times as long in the developed case, as they were in the predevelopment case.
67

Examining the case for flood control only, Figure 10 shows the flow duration curves for detention basins that would control the peak discharge to predevelopment levels for two cases:
1. The 100-yr and 10-yr storms, and 2. The 100-, 10- and 2-yr storms.
Figure 10: Effects of flood control detention basins on flow duration curve for Fort Collins, Colorado Figure 10 shows that standard practice flood control is sufficient only for controlling the flow-duration curve for the larger flows (greater than 2 cfs for Fort Collins). In Fort Collins 315 hours of flow occur per year at 0.01 cfs or greater for the watershed controlled by 100/10/2-year control detention basins vs. 245 hours of flow per year occur at this level for the uncontrolled developed scenario, and only 120 hours for the undeveloped scenario. Providing only 100/10-year control lowers the flow frequency curve a little, but the curve is closer to the 100/10/2-yr curve than to the uncontrolled post-development curve. EFFECT OF SWALES As imperviousness and stormwater runoff increase, infiltration to the groundwater system decreases (ASCE 1998). The implementation of certain BMPs, such as swales, buffer strips and wetlands can increase infiltration, and thus decrease the stormwater runoff of the system. For the next scenarios the concrete gutters and conduits of the drainage system were replaced by grass swales and grass trapezoidal channels.
68

Fig. 11: Effect of adding swales to flood controls on flow-duration curve for Fort Collins, Colorado Figure 11 shows that the implementation of swales and grass trapezoidal channels in combination with standard practice flood control increases the flow-duration of the system further than flood control alone. Flows of 0.01 cfs or greater occur for 295 hours per year in the 100/10 year controlled system, while flows at this level occur for 435 hours per year with the addition of swales and grass channels. EFFECT OF AN EXTENDED DETENTION BMP The use of BMPs to control pollutant delivery to the receiving streams is a requirement in most parts of the country, due to EPA regulations (ASCE 1998). The BMP in this study was modeled as an extended detention basin. The effectiveness of the BMP with various combinations of flow control devices was compared to determine the arrangement that most effectively controls the entire flow duration curve. As shown in Figure 12, the addition of the BMP to the flood controls greatly increases flow duration for smaller flows. However, the addition of the BMP lowers the flow duration curve to below the uncontrolled developed level for larger flows (greater than 0.2 cfs for Fort Collins). In Fort Collins, flows of 0.01 cfs or greater occur for 295 hours per year in the 100/10 year controlled system, while flows at this level occur for 1040 hours per year with the addition of the extended detention BMP to the system. The addition of a 2-year flood control orifice to the 100/10year/BMP system does not further increase flow duration.
69

Figure 12: Effects of flood controls and BMPs on flow duration for Fort Collins, CO
Both locations were also simulated with the 100/10/BMP system with the concrete gutters and conduits replaced by grass swales and trapezoidal channels. As shown in Figure 13 this configuration produces a minimal increase in the flow duration of small flows in comparison with the 100/10/BMP system.
Fig. 13: Effects of swales flood controls and BMPs on flow-duration curve for Fort Collins, Colorado
70

Flows of 0.01 cfs or greater occur for 1150 hours per year for the 100/10/BMP with grass swales and channels system, while the 100/10/BMP system with concrete gutters and conduits has flows at this level for only 1040 hours per year.
Various other combinations of flood controls were also combined with the extended detention BMP. However, the type of flood controls used had little bearing on the flow-duration curve as shown in Figure 14. The addition of a 2 year control orifice to the 100/10/BMP control system resulted in very little change to the flow-duration curve in both Fort Collins, except for very small flows less than .008 cfs. The optimal system for controlling the flow-frequency curve in Fort Collins was the 100-year control orifice combined with 1.4-yr control plus an extended detention BMP. However, as Figure 14 shows, this configuration produces little change in the flow-duration curve as compared to the 100/10/BMP control system.
Fig. 14: Flow-duration curve 100/1/BMP (best fit for flow duration curve CONCLUSIONS The flow-duration curve could not be controlled with any combination of simulated flood controls and extended detention BMPs. The addition of grass swales and channels resulted in a decrease in the volume of stormwater runoff, but also produced an increase in the duration of smaller flows. It is likely that the grass swales and channels slowed down the runoff and produced the increase in flow duration. The volume of infiltrated runoff water was not enough to offset the increase in duration. The substitution of grass swales and channels for concrete gutters and conduits raised the flow-duration curve with flood control and BMP systems, as well as with flood control alone. However, the addition of the extended detention BMP to any configuration of flood controls produced the greatest increase in the flow-duration curve. The temporary storage of stormwater runoff in the extended detention basin resulted in long durations (as indicated in Table 2 below) of small outflows.
71

System Total Hours of Outflow Atlanta, GA Fort Collins, CO Undeveloped 28304.25 12408.25 16% imperviousness 28636.50 12588.75 28% imperviousness 31119.75 14578.00 37% imperviousness 32506.50 15401.75 47% imperviousness 33696.00 15612.75 100&10yr Det Pond 33719.25 20871.00 100&10&2yr Det Pond 37170.50 22620.25 100&10yr w/Swales 65712.50 32722.25 100&10&2yr w/Swales 66423.25 32911.50 100&10yr&BMP w/Swales 223235.25 116635.75 100&1yrBMP(Rmstr) - 117844.75 100&10yr&BMP 223887.50 119437.25 100&2yr&BMP 224001.00 119602.50 100&1yr&BMP 224055.00 119611.00 100&10&2yr&BMP 224009.25 119615.50
Table 2. Total Hours of Outflow for Various System Configurations
The system that came closest to reproducing the predevelopment flow-frequency curve was the 100 year flood control detention basin combined with an extended detention BMP designed to control the 1 year storm, as determined by Rainmaster analysis (Nehrke, 2002). This same system resulted in one of the largest increases of the flow-duration curve of the systems simulated. Therefore, even if the flow-frequency curve can be controlled to predevelopment levels using a system of flood controls and extended detention BMPs, the flow-duration curve cannot be reduced to its predevelopment level. This study was performed using only one model and two locations. An extended detention basin was the only BMP simulated at the outlet of the system. These results are relevant for the given climates and drainage system, but care should be taken in applying them to other systems. It remains to be seen how other types of BMPs and different climates will affect the results. ACKNOWLEDGEMENTS This study was part of a Research Experiences for Undergraduates program at Colorado State University. It was funded by the National Science Foundation and the study was performed by Caroline Nardi under the direction of Dr. Larry A. Roesner as a faculty mentor. Christine Rohrer also provided invaluable instruction in the laboratory and background knowledge.
72

REFERENCES
American Society of Civil Engineers (1998). “Urban Runoff Quality Management”. ASCE Manual and Report on Engineering Practice No. 87. ASCE Reston, Virginia. Caraco, D. (2000). “Dynamics of Urban Stream Channel Enlargement.” The Practice of Watershed Protection., Center for Watershed Protection, Ellicot City, Maryland, pp 99-104. Figurski, M. (2001). “Modeling an Urban Development with MIKE-SWMM” www.ce.utexas.edu/stu/rowenemj/swmm_project.htm Nehrke, S. (2002). “Influence of Extended Detention BMPs and Traditional Flood Controls on the Flow Frequency of Urban Runoff.” Masters Thesis. Department of Civil Engineering. Colorado State University, Fort Collins Colorado 80523-1372 Roesner, L.A. (2002). Personal Communication. 1Caroline Nardi is a student in Civil Engineering at Notre Dame. She was awarded a National Sciences Foundation Summer Internship in their Research Experiences for Undergraduates Program in Water Research at Colorado State University. Caroline's professional interests are in water resources and urban hydrology. 2Dr. Roesner's area of specialization since 1970 has been urban hydrology and nonpoint source pollution control. He is a principal developer of the Corps of Engineers model STORM, a simplified urban stormwater management model, and EPA's SWMM EXTRAN model, a sophisticated flow-routing model for urban drainage systems. Applications experience includes nonpoint source pollution studies in California, Michigan, Georgia, and Florida, and storm drainage/combined sewer studies in Seattle, San Francisco, Boston, Cincinnati, Detroit, Cleveland, Omaha, and many Florida cities. Dr. Roesner has contributed chapters and sections to a number of books and manuals of practice on urban drainage design, and urban water quality management. Another of Dr. Roesner's areas of specialization is water quality simulation of surface water bodies. Dr. Roesner is the principal author of QUAL-II, a stream water quality model developed for USEPA which simulates 11 water quality parameters. He has conducted a number of USEPA-sponsored workshops on the application of QUAL-II and has experience with model applications throughout the United States and in Canada. QUAL-II has been used extensively for wasteload allocation studies throughout the United States. Other major responsibilities include the development of a reservoir temperature model and the application of Ecologic-Water Quality Models to Monterey Bay, California, Puget Sound, Washington, and Montevideo, Uruguay to study the effects of discharges from proposed ocean outfalls on the receiving waters in these areas.
73

WATER QUALITY FACILITIES IN GARDENS AND PUBLIC LANDSCAPES
Paul Thomas1
Wenk Associates Denver, Colorado
Abstract Site design approaches are discussed for the integration of water quality features into a site or development’s landscape areas, including parks, parkways, and yard/garden areas. A process for the design of facilities that not only perform water quality functions but which also enhance the civic realm of the community is proposed. Case studies of built and designed projects that integrate water quality functions into public landscapes are presented.
Introduction With cities taking action to meet the requirements of the NPDES program to reduce pollution in our communities’ stormwater systems, development of facilities for water quality and flood control has become a major consideration in the urban landscape. Detention facilities and other structural best management practices (BMPs) are now becoming ubiquitous in every new shopping mall, office complex, and residential area. Water quality treatment facilities are now commonplace even in our public open space as parks, parkways and “natural areas” are utilized as part of regional water quality treatment systems. Many of these measures are “end-of pipe” approaches, which can do an adequate job treating stormwater that is already in the storm drainage system, but require a great deal of space, and can pose aesthetic and maintenance issues. These types of facilities require significant, expensive infrastructure costs to convey stormwater to the treatment site and to hold and treat the water. Reduction of the quantity of stormwater that enters the traditional storm drainage system is the goal of alternative stormwater approaches. Driven by the high cost, lack of available space for “end of pipe”-type facilities, and uneven results achieved in traditional detention approaches, alternative stormwater approaches deal with stormwater as closely as possible to where it hits the ground. This minimizes the flow of water from the site through the use of infiltration and on-site detention, greatly reducing the need for
74

piping, treatment pond construction, and intensive maintenance. Infiltration, a very effective method of removing pollutants from stormwater, can be performed in landscape areas that serve a variety of aesthetic and environmental functions. These landscapes must be designed to accommodate large quantities of water and move it steadily into the ground while maintaining the health of the landscape. The importance of landscapes in alternative stormwater systems signals the need for a new approach in the planning and design of these facilities. No longer a “plumbing problem” for engineers to solve on their own, these water quality treatment systems are both landscape and engineering challenges, sometimes even involving the building architect. In addition, to be truly successful, these alternative facilities must offer the developer or community an advantage over traditional water quality methods, such as the typical treatment pond at the lowest point on the site. A multi-disciplinary approach can successfully develop a palette of BMPs that respond to the very real requirements of urban development—cost efficiency and reduction of “unusable” water treatment space, while providing the added value of enhancing civic and environmental goals. If carefully crafted, these new techniques will garner acceptance from the development community and public review agencies, and help to push these alternative stormwater management practices from the “alternative fringe” into the mainstream of stormwater management and community design. Toward the goal of making alternative stormwater management an integral part of the process of community design, Wenk Associates, a landscape architecture firm that has worked on stormwater-related projects for over twenty years, and for which I work, has developed the following guiding principles: • Explore the entire site as a place to deal with water quality and quantity issues • Develop BMPs that respond to the challenges of the urban environment • Create designs that promote a health ecology, provide for sustainability, and
minimize maintenance and human intervention • Treat stormwater as a multiple-use resource to promote environmental sustainability • Achieve civic and environmental goals simultaneously Successful practice of these principles is only possible in a highly collaborative team environment. The design team must be able to work iteratively to identify opportunities and explore their feasibility in the design. Engineers and designers have to go back and forth, testing, adding, and often discarding ideas throughout the process. More than anything, the approach is opportunistic. Every aspect of a design must be pushed and prodded to see if it can be more effective, somehow improved. This process pushes each of the professions to demand more out of the other, and the result is a much higher quality design that is more likely to meet with review agency approvals. Case Studies While much has been written about alternative stormwater approaches, relatively few of these types of projects have been built. Problems arise with conflicts between BMP design and municipal landscape and roadway standards; owners are leery of investing time, energy and money in getting an untested detail approved which may delay their project; and, agency reviewers unfamiliar with new techniques may not provide needed approvals. Acceptance of new techniques will be gradual, building on the success of a few projects, instilling confidence in review agency staff, developers, and even the consultants themselves to try new and better designs.
75

Following are four case studies of projects in which water quality treatment is integrated into the site’s landscape. These projects offer real-world testing of alternative stormwater management approaches, as each project is either built, or moving toward construction. Environmental Center of the Rockies Status: Built The Boulder, Colorado-based Environmental Center of the Rockies is a small office building that houses the regional offices of the Sierra Club, the National Wildlife Federation, and the building’s owner. As part of a major building remodel, the site was completely redesigned by Wenk Associates to serve as a demonstration of how regionally appropriate landscapes can be rethought and intentionally designed to cleanse polluted stormwater. Stormwater is held on the site rather than emptying directly into adjacent Skunk Creek; pollutants will be absorbed by the soil and dispersed by the root systems of hardy native and non-native plants. Drainage details and plantings serve functional needs and demonstrate the wide range of landscapes that can flourish with reuse of stormwater. The entire site was explored for potential water treatment opportunities. Locations where water quality elements were integrated into the site include:
• Landscape beds around
the building that retain water from roof drains for infiltration purposes and to irrigate landscape plants;
• Parking lots with permeable
landscape islands to infiltrate parking lot runoff and irrigate landscape plantings; and
• Parking lots graded to keep
water on site in storms of up to a three year frequency.
Sculptural scuppers deliver stormwater from building roof drains into landscaped areas around the building.
Lessons Learned from the Project:
• Collecting water in landscapes can trigger geo-technical concerns regarding the collection of water from the roof drains close to the building foundations. This was resolved by using an impermeable liner on the sides of the landscape / collection area, and carefully designing a subsurface drainage system to remove excess water from the system;
• The planting design must be carefully adapted to locate and specify plants correctly so the landscape can withstand the often intense flows from roof drains. Prevention of soil and plant wash-out requires a suitable mulch that stays in place during major precipitation event;
76
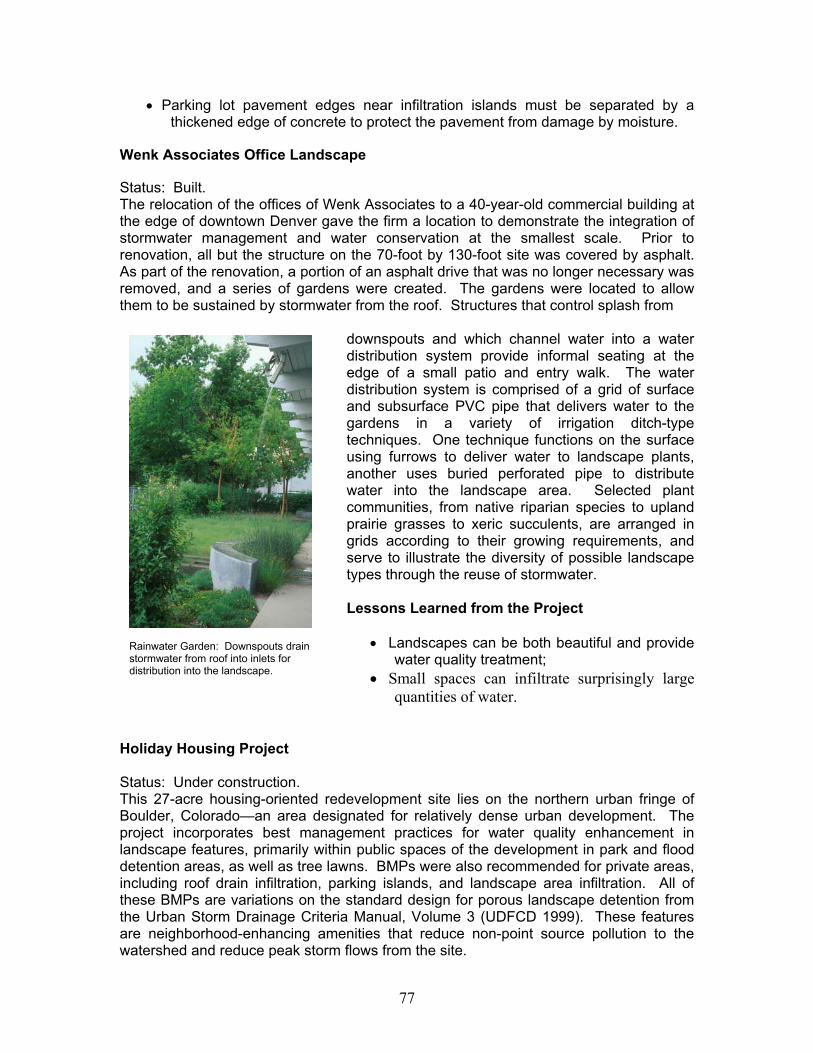
• Parking lot pavement edges near infiltration islands must be separated by a thickened edge of concrete to protect the pavement from damage by moisture.
Wenk Associates Office Landscape Status: Built. The relocation of the offices of Wenk Associates to a 40-year-old commercial building at the edge of downtown Denver gave the firm a location to demonstrate the integration of stormwater management and water conservation at the smallest scale. Prior to renovation, all but the structure on the 70-foot by 130-foot site was covered by asphalt. As part of the renovation, a portion of an asphalt drive that was no longer necessary was removed, and a series of gardens were created. The gardens were located to allow them to be sustained by stormwater from the roof. Structures that control splash from
downspouts and which channel water into a water distribution system provide informal seating at the edge of a small patio and entry walk. The water distribution system is comprised of a grid of surface and subsurface PVC pipe that delivers water to the gardens in a variety of irrigation ditch-type techniques. One technique functions on the surface using furrows to deliver water to landscape plants, another uses buried perforated pipe to distribute water into the landscape area. Selected plant communities, from native riparian species to upland prairie grasses to xeric succulents, are arranged in grids according to their growing requirements, and serve to illustrate the diversity of possible landscape types through the reuse of stormwater.
Rainwater Garden: Downspouts drain stormwater from roof into inlets for distribution into the landscape.
Lessons Learned from the Project
• Landscapes can be both beautiful and provide water quality treatment;
• Small spaces can infiltrate surprisingly large quantities of water.
Holiday Housing Project Status: Under construction. This 27-acre housing-oriented redevelopment site lies on the northern urban fringe of Boulder, Colorado—an area designated for relatively dense urban development. The project incorporates best management practices for water quality enhancement in landscape features, primarily within public spaces of the development in park and flood detention areas, as well as tree lawns. BMPs were also recommended for private areas, including roof drain infiltration, parking islands, and landscape area infiltration. All of these BMPs are variations on the standard design for porous landscape detention from the Urban Storm Drainage Criteria Manual, Volume 3 (UDFCD 1999). These features are neighborhood-enhancing amenities that reduce non-point source pollution to the watershed and reduce peak storm flows from the site.
77

The site is divided into three drainage basins. Sizing for the BMPs exceeds the area determined by the Criteria Manual design forms (110% to 227% of recommended capture volume). By over-sizing these areas, deposited sediment will have less of an impact on the performance of the water quality areas, and will be reduce the need and frequency for maintenance.
BMP plan for Holiday Housing project. BMPs were recommended for public and private landscapes.
Lessons Learned from the Project
• Early determination of water quality treatment goals is critical in successfully integrating BMPs into development plans;
• Alternative stormwater management systems can effectively be fit into dense development sites; and
• Public park areas provide the greatest opportunity to accomplish water quality goals.
Near Northside Housing Redevelopment Status: Under Construction. The redevelopment of a public housing project in Minneapolis, Minnesota incorporated drainage and water quality planning as key elements in the community plan. In addition to daylighting Bassett Creek (which had been buried in a culvert since the first round of development in the 1960s), and making it a spine of the main parkway, a surface storm drainage system for the area has been integrated with the two new parks and the parkway, creating multiple purpose landscapes that serve both water quality and civic / recreational functions. A network of wetlands, meadows and ponds will be distributed throughout the development to remove urban pollutants and create a rich fabric of park landscapes that relate to the traditional system of park lakes in Minneapolis. Project Design Goals:
• Phosphorus reduction: 70-80 percent • Total Suspended Solids (TSS) reduction: 85 percent plus • Biological Oxygen Demand (BOD): significant reduction
78

Elements of the Plan include:
• Parkway stormwater gardens: Water quality treatment is performed by filtering stormwater from roadway drainage and other pipe outfalls through wetland plant material and soils at each pipe outfall;
• Water quality treatment pond in park: Water from Bassett Creek is treated in a forebay (sedimentation pond) integrated with the park water feature. The forebay is accessible by small excavating equipment for maintenance. A low earthen weir separates the forebay from the “polishing” area of the pond, which also serves as a main focus of the park design;
• Infiltration areas / Wet meadows: Any place that stormwater is collected is an opportunity for infiltration. Water is distributed through level spreaders and sand galleries into the landscape wherever possible.
Concept sketch for water quality treatment gardens in parkway median. Water from roadway
drainage and culverts draining adjacent development are filtered through wetland plantings and wet meadows at each pipe outfall.
Lessons Learned from the Project
• Early coordination with the agencies responsible for long term maintenance helped create a design that was not only acceptable to the reviewing agencies, but garnered a sense of ownership in the project.
• Early involvement of the landscape architect, along with a clear vision from the client regarding water quality treatment goals, resulted in a design that maximized the water quality treatment potential of the site in a manner that added interest and value to the project.
• Maintenance for landscapes that function as surface stormwater systems is different than typical park landscape care. Issues that must be addressed include: weed-related training and maintenance will be needed to deal with increase in weeds; clear, understandable edges for different landscape types are
79

needed to guide maintenance staff on appropriate practices for each area; access must be provided for equipment needed to clean out facilities; and, maintenance practices will require assessment and modification as landscapes establish.
Conclusion The projects described begin to demonstrate an integrated approach to water quality treatment design. The marriage of landscape and water quality has made sense for a long time, but institutional divisions between landscape architects and engineers have limited the creative potential of solutions. Multi-disciplinary teams approaching water quality issues in a collaborative process have the potential to effect great improvements not only on the functional aspects of water quality, but also on the physical urban environment. Creatively dealing with the constraints and challenges of water quality issues within our public landscapes will make our designs more interesting, more sustainable, and more meaningful to the community.
80

References: Urban Drainage and Flood Control District, Urban Storm Drainage Criteria Manual, Volume 3, 1999. 1Mr. Thomas is a landscape architect and Senior Project Manager with the firm of Wenk Associates in Denver, a firm that has developed a national reputation for its work bridging the fields of landscape architecture and engineering. Mr. Thomas has been with the firm for 13 years, and heads up the firm’s Infrastructure practice area. Mr. Thomas’ experience includes park design, channel stabilization and restoration design, visitor and interpretive facilities design, and recreation master planning. He currently is leading the design of several large urban park projects that integrate water quality facilities within the park design and feature them as amenities. Mr. Thomas has also been integrally involved in the development of bio-engineering techniques that are adapted for the Colorado Front Range area, and has been lead landscape architect for two of the last four CASFM honor award-winning projects.
81

COMPARISON OF CONVENTIONAL AND LOW IMPACT DEVELOPMENT DRAINAGE DESIGNS
Don Alexander1 and James P. Heaney2 University of Colorado
Boulder, Colorado
ABSTRACT A conventional drainage design and a Low Impact Development (LID) design incorporating permeable landscape detention areas are compared using standard engineering practices to evaluate the ability of each system to control flooding and drainage problems associated with urbanization. The evaluation also includes an analysis of the runoff during frequent storm events and the quality of the runoff.
The comparison of the two drainage designs resulted in several distinct differences. The use of infiltration practices resulted in the removal of several sections of the pipe network for the LID design. In addition, analysis of three years of rainfall events representing a dry, average and wet year showed that the LID design was able to reduce the average annual runoff volume by 26%, 15% and 25%, respectively. The LID design also reduced the average annual volume to just below predevelopment volume. The LID drainage design improves water quality by infiltrating pollutants and runoff from directly connected impervious areas and relying on natural filtration processes to occur. The cost analysis shows that the inclusion of permeable landscape detention areas can be constructed at a cost comparable to that of the conventional drainage design.
ACKNOWLEDGEMENTS The modeling study was funded by a grant from the U.S. Environmental Protection Agency to the Boulder Housing Authority and the Sustainable Futures Society. This report is part of a larger study analyzing the impact of urban development on air and water quality and energy use. INTRODUCTION Conventional stormwater collection systems efficiently remove stormwater runoff from roads, lots, buildings or other areas of human activities as quickly as possible using a series of curbs and gutters, inlets and pipes. Detention ponds may be included to
82
reduce peak runoff rates. Water quality issues are addressed by with the inclusion of detention ponds. The purpose of Low Impact Development (LID) designs is to provide equivalent performance to conventional techniques during peak runoff periods with added functionality under frequent storm events. LID techniques aim to mimic the pre-development hydrologic regime, accomplished with distributed wet-weather flow controls (WWCs) such as permeable landscape detention areas (PLDs), extended detention basins, roof storage and sand filters. In addition, LID techniques include the reduction of directly connected impervious areas (DCIA) such as streets, parking areas, roofs and driveways that are believed to contribute the majority of pollutant loads. Directing runoff from impervious areas to WWCs can reduce DCIA. A modeling study was performed on The Holiday Neighborhood, a new 27-acre single and multi-family development on the northern urban fringe of Boulder Colorado. Due to growth restrictions in the area, this project received funds to study the effects of urbanization on the environment. This paper covers the efforts to assess those effects on the quantity and quality of runoff, focusing on the comparison of two drainage designs that were applied to the site. The first is a conventional layout focusing on large, extreme storm events. The second is an LID design that is a combination of the conventional design and distributed WWCs throughout the neighborhood. Each design is evaluated by local standards. Included in the comparison is an evaluation of runoff volumes for water quality control. A construction cost analysis of the two designs examines the feasibility of applying a LID design. LITERATURE REVIEW An LID drainage design consists of any number of distributed WWCs, or best management practices (BMPs). The performance of WWCs is a subject of current research. However, when engineered and applied properly, WWCs can reduce runoff volumes and pollutant loads (USEPA 2000). Guidance on the application and design of LID drainage techniques can be found in stormwater design manuals across the United States (Prince George’s County 1999; State of Maryland 2000). The SEA Streets Program in Seattle, Washington provides an example of a constructed LID development (SEA Streets Walking Tour 2002). The WWCs used in the LID scenario are based on design examples from the drainage manual for the Denver, Colorado area (UDFCD 1999). One basic type of WWC is permeable landscape detention (PLD). The area is engineered to reduce the rate and volume of runoff from particular areas through sound landscaping and infiltration. Advantages and disadvantages are discussed. Estimates for pollutant removal are also given. The governing standard for the design of a stormwater collection system for this case study is the City of Boulder’s Design and Construction Standards (DCS) (City of Boulder 2000). These standards address everything from the method to be used for the rainfall-runoff response to inlets and street and capacities to storage requirements. Each of the specific aspects of these design procedures are documented and discussed in detail. In addition, the Denver Urban Drainage and Flood Control District manual (UDFCD 1999) provides additional guidance on selected methods and procedures, specifically, the concept of the water quality capture volume (WQCV).
83

As prescribed by the local standard (City of Boulder 2000), the Rational Method is used to develop the design flow rates and pipe sizing. Some examples of properly applying this method are presented by Yen (2001) and the ASCE manual (1994). STUDY SITES The Holiday Neighborhood contains several types of development, including single and multi-family residential lots and commercial lots. There are three detention ponds designed for the development, one of which is located within a park whose area could be utilized during dry periods. The National Guard Armory contributes runoff to the neighborhood and was considered during the design of the collection system. The layout of the neighborhood is shown in Figure 1.
Figure 1: Holiday Neighborhood in Boulder, Colorado
The conventional drainage design is based upon the design submitted to the City of Boulder by Carter-Burgess (2000). The alternative LID design was developed by the project landscape architects and is a composite of the conventional design and distributed WWCs (Wenk 2002). The detailed analysis of this study involved only a representative portion of the entire development. One type of WWC is used in that area, an example of which is shown in Figure 2. PLDs parallel many of the neighborhood streets and are a combination of a swale and infiltration trench.
84

Figure 2: Porous Landscape Detention
The swale is approximately 8-feet wide and 1-foot deep at the deepest point. Lengths depend on street lengths and intersections. The infiltration trench contains three layers: 1) vegetation later (~3 inches), 2) filtering layer (~18 inches) and 3) drainage layer (~9 inches). A small pipe along the bottom, which connects to stormwater inlets or manholes, removes infiltrated water. MODELING METHODOLOGY The two drainage designs for the Holiday development are compared based on the methods outlined by local stormwater manuals (City of Boulder 2000 and UDFCD 1999) and the Final Drainage Report (Carter-Burgess 2002). The method presented by ASCE (1994) for the calculation of design flows and concentration times was also used. Calculations were performed to determine the street and inlet capacities. Then, using the Rational method, the peak discharge rates were determined at each design point. Based on the instructions from ASCE (1994), at each design point, decisions are made as to time of concentration, contributing area, rainfall intensity and runoff coefficient. A spreadsheet model was created to perform all of these calculations. The differences between the two drainage designs exist in time of concentrations and runoff coefficients. The application of the PLDs results in extending the time of concentration of various design points and reduces the runoff potential from the contributing areas. Finally, inlet and pipe sizes are determined based on the peak discharge rates determined from the Rational method calculations. In addition to the Rational method calculations, an analysis of total annual runoff volume is included to show how the different designs perform under the entire range of precipitation events, from small, frequent storms to the large, infrequent events. This measure of performance is not included in local standards. Runoff volumes from various land uses are based on precipitation events exceeding the initial abstraction, which was determined based on the SCS methodology (USDA 1986). Runoff volumes were calculated for three years of rainfall events representing a dry, average and wet year. The runoff volumes were calculated based on precipitation minus the initial abstractions
85
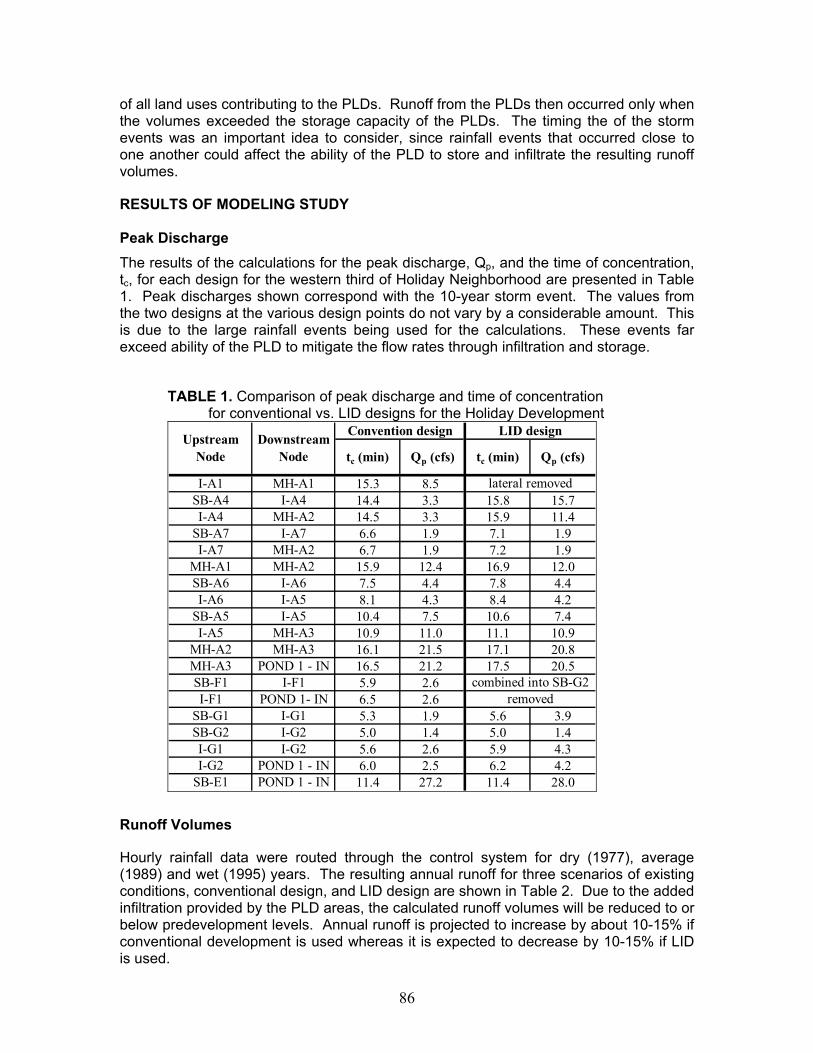
of all land uses contributing to the PLDs. Runoff from the PLDs then occurred only when the volumes exceeded the storage capacity of the PLDs. The timing the of the storm events was an important idea to consider, since rainfall events that occurred close to one another could affect the ability of the PLD to store and infiltrate the resulting runoff volumes. RESULTS OF MODELING STUDY Peak Discharge The results of the calculations for the peak discharge, Qp, and the time of concentration, tc, for each design for the western third of Holiday Neighborhood are presented in Table 1. Peak discharges shown correspond with the 10-year storm event. The values from the two designs at the various design points do not vary by a considerable amount. This is due to the large rainfall events being used for the calculations. These events far exceed ability of the PLD to mitigate the flow rates through infiltration and storage.
TABLE 1. Comparison of peak discharge and time of concentration for conventional vs. LID designs for the Holiday Development
tc (min) Qp (cfs) tc (min) Qp (cfs)
I-A1 MH-A1 15.3 8.5SB-A4 I-A4 14.4 3.3 15.8 15.7I-A4 MH-A2 14.5 3.3 15.9 11.4
SB-A7 I-A7 6.6 1.9 7.1 1.9I-A7 MH-A2 6.7 1.9 7.2 1.9
MH-A1 MH-A2 15.9 12.4 16.9 12.0SB-A6 I-A6 7.5 4.4 7.8 4.4I-A6 I-A5 8.1 4.3 8.4 4.2
SB-A5 I-A5 10.4 7.5 10.6 7.4I-A5 MH-A3 10.9 11.0 11.1 10.9
MH-A2 MH-A3 16.1 21.5 17.1 20.8MH-A3 POND 1 - IN 16.5 21.2 17.5 20.5SB-F1 I-F1 5.9 2.6I-F1 POND 1- IN 6.5 2.6
SB-G1 I-G1 5.3 1.9 5.6 3.9SB-G2 I-G2 5.0 1.4 5.0 1.4I-G1 I-G2 5.6 2.6 5.9 4.3I-G2 POND 1 - IN 6.0 2.5 6.2 4.2
SB-E1 POND 1 - IN 11.4 27.2 11.4 28.0
combined into SB-G2removed
lateral removed
Upstream Node
Convention design LID designDownstream Node
Runoff Volumes Hourly rainfall data were routed through the control system for dry (1977), average (1989) and wet (1995) years. The resulting annual runoff for three scenarios of existing conditions, conventional design, and LID design are shown in Table 2. Due to the added infiltration provided by the PLD areas, the calculated runoff volumes will be reduced to or below predevelopment levels. Annual runoff is projected to increase by about 10-15% if conventional development is used whereas it is expected to decrease by 10-15% if LID is used.
86

TABLE 2. Annual runoff for three land use scenarios and a dry, wet, and average year
1977 (Dry) 1989 (Ave) 1995 (Wet)Existing Conditions 7.6 22.2 12.9Conventional Design 8.8 24.5 14.4LID Design 6.5 20.5 11.4
Total Annual Runoff DepthScenario
Cost Analysis The cost analysis was performed to include only construction and material cost of the area analyzed, as shown in Table 3. Operation and maintenance costs and the expected benefits of either option were excluded.
TABLE 3. Required infrastructure and associated cost for conventional vs. LID designs
Conventional Design LID Design Conventional Design LID Design12" RCP 32 58 ft 24.00$ 768$ 1,392$ 18" RCP 301 146 ft 29.00$ 8,729$ 4,234$ 24" RCP 48 72 ft 34.00$ 1,632$ 2,448$ 30" RCP 72 0 ft 41.00$ 2,952$ -$ 4" Perf PVC 0 500 ft 14.00$ -$ 7,000$ Manhole 4 4 ea 3,000.00$ 12,000$ 12,000$ Inlet- triple 3 2 ea 3,500.00$ 10,500$ 7,000$ Inlet- double 2 2 ea 3,000.00$ 6,000$ 6,000$ Inlet- single 3 2 ea 2,800.00$ 8,400$ 5,600$ Outlet 3 2 ea 3,000.00$ 9,000$ 6,000$ Excavation 205 154 yd3 5.60$ 1,148$ 862$ PLD Area 0 21,034 ft2 3.17$ -$ 66,678$ Conv Area 21,034 0 ft2 2.70$ 56,792$ -$
117,921$ 119,214$
Extended Price
Total
Cost Item Quantity Unit Unit Price
The results of the modeling study and the use of the Rational method to determine peak discharge rates resulted in a reduction of the infrastructure of the pipe network. The application of the PLDs areas removes a portion of the runoff volume, thereby reducing the sizes of some of the pipe. In some cases, an inlet was removed due to the removal of runoff from the street. Overall, the cost of the LID design is slightly higher. The reduction of infrastructure is offset by the application of the PLDs. The last two items in Table 3 cover the application of the PLDs. An area of 21, 034 ft2 is the applied area of the PLDs. The construction cost per ft2 of the “PLD Area” include excavation, lining the excavated area with a geotextile material, placing the gravel bed and perforated pipe in the bottom of the trench, filling the excavation with sand, fine grading and plantings on the surface. Under the conventional design, the line item “Conv Area” includes fine graded and plantings. However, curb and gutter, which is removed under the LID design to drain the streets, is included in this cost. The resulting unit cost of the PLDs is, as expected, higher than that under conventional landscaping.
87

The resulting total construction cost shows that the application of the PLDs is somewhat higher than that of the conventional design. It is believed that the PLDs may also be more costly to maintain. Maintenance should definitely be considered CONCLUSIONS Based on the methods and procedures used in the design of stormwater collection systems, the application of LID techniques appears to offer some benefits. These benefits include better performance under micro-storm events, reduced pipe network infrastructure and improved quantity and quality of runoff. These benefits result from having greater infiltration capacity and increasing the response time of runoff. By removing a certain percentage of the runoff volume, the pollutant load is expected to be reduced by a similar amount. The advantage of the LID design is not as apparent during the major storm events. The rainfall depths from the 100-year event are expected to far exceed the storage capacity of stormwater controls, such as the permeable landscape detention areas. Although infiltration would increase with the application of PLD areas, the amount of infiltration becomes insignificant as the precipitation depth increases. The cost analysis shows that the LID design can be constructed for a slightly increased cost above that of the conventional design. The slightly higher unit costs of constructing the PLD areas are offset by the removal of several structural components of the pipe network. REFERENCES American Society of Civil Engineers. (1994). Design and Construction of Urban Stormwater Management Systems. ASCE Manuals and Reports of Engineering Practice No. 77, ASCE, NY. Carter-Burgess, Inc. (2002a). “Final Drainage Report - Holiday Neighborhood.” June 3, 2002. City of Boulder. (2000). “Design and Construction Standards.” 2nd Edition, Planning and Development Services, Boulder, CO. Prince George’s County. (1999a). “Low-Impact Development Design Strategies - An Integrated Design Approach.” Department of Environmental Resources, Programs and Planning Division, Prince George’s County, Maryland. SEA Streets Walking Tour. (2002). Retrieved from City of Seattle, Seattle Public Utilities Web site, http://www.cityofseattle.net/util/SEAstreets/default.htm. State of Maryland. (2000). “Stormwater Design Manual.” Maryland Department of the Environment, Volumes I & II. United States Department of Agriculture. (1986). “Urban Hydrology for Small Watersheds.” Technical Release No.55, 2nd Edition, Natural Resources Conservation Service, Conservation Engineering Division, Washington D.C. United States Environmental Protection Agency. (2000). “Low Impact Development – A Literature Review.” Low Impact Development Center, Office of Water, Washington D.C.
88

Urban Drainage and Flood Control District. (1999). Urban Storm Drainage Criteria Manual, Volumes I, II, and III, Denver Regional Council of Governments, Denver, CO. Wenk Associates. (2002). “Porous Landscape Detention (PLD) Area for WQCV Treatment.” Yen, B. C. (2001). “Hydraulics of Sewer Systems,” in L. W. Mays, ed., Stormwater Collection Systems Design Handbook, McGraw-Hill, NY, pp 6-1 – 6-113. 1Don Alexander is a water resource engineer and is currently working as a graduate student with Dr. Heaney at the University of Colorado. His Master's Thesis is Life Cycle Cost Analysis of Stormwater Systems. Don has designed stormwater and sanitary sewer collection systems on a variety of land development projects, coordinated an NPDES Phase II workshop and collaborated with a team of engineers on local municipal stormwater management programs. Don is proficient on numerous hydraulic and hydrologic models including RIVERWARE, SWMM, HEC-RAS, HEC-HMS, and MODFLOW-96. 2Jim Heaney is a Professor at the University of Colorado, Department of Civil, Environmental, and Architectural Engineering and a Registered Professional Engineer. Jim has Masters and PhD degrees in Civil Engineering from Northwestern University, as well as a Bachelors degree in Civil Engineering from the Illinois Institute of Technology. Jim’s current research and teaching focuses on developing simulation and optimization techniques to evaluate innovative urban water infrastructure systems including water supply, wastewater, and stormwater. Recent research has included Evaluation of Highway Low Impact Development Practices and Best Management Practices and studies for the U.S. Environmental Protection Agency on Optimization of Decentralized Urban Stormwater Systems, Evaluation of the Cost of Urban Stormwater Systems, and Use of Heuristics to Optimize Urban Stormwater Systems.
89

I NEVER PROMISED YOU A RAIN GARDEN An Integrated Approach to Incorporating Water Quality BMPs into
Stormwater Management
Steve Gardner, P.E.1 Stormwater Program Manager
Arapahoe County/City of Centennial
ABSTRACT Infiltration basins have been used for many years as a best management practice (BMP) to control stormwater runoff. Several variations of infiltration basins have also been developed, including the “rain garden” concept. Although relatively new to the Colorado area, rain gardens have been incorporated into site designs in many areas of the east coast and a few of the upper great lakes states. The rain garden concept has been proposed as an alternative to the on-site detention pond for a development in Arapahoe County. This paper examines the challenges presented by incorporation of water quality BMPs into a stormwater management program that is dominated by water quantity considerations. Water quality BMPs are discussed in general, and the rain garden concept is used as one of the first attempts by Arapahoe County to incorporate water quality BMPs into development of a residential site. Using this example, this paper acknowledges the advantages and disadvantages of rain gardens, and identifies key areas that must be addressed by local governments and stormwater staffs to ensure the best chance of successful implementation of not only rain gardens, but also water quality BMPs.
INTRODUCTION Various versions of infiltration BMPs have developed over the last couple of decades, including infiltration trenches, infiltration basins, and bioretention systems. Originally conceived and developed by the Prince George’s County, Maryland Department of Environmental Resources in the early 1990s, the bioretention concept has been fairly well received as an alternative to traditional structural BMPs (Schueler and Holland, 2000). Bioretention is considered a BMP to collect and treat stormwater runoff using a conditioned soil bed and planting materials to filter runoff stored within a shallow depression. Rain gardens evolved as a sub-group of the bioretention family of BMPs
90

and are typically used in residential and smaller commercial lots. Rain gardens can be used by themselves or as part of a treatment train that might include a filter strip, grass swale, and sediment forebay. Most of the performance data compiled to date was collected and analyzed in the Prince George’s County, Maryland area. Historically, Arapahoe County’s stormwater criteria has encouraged the generally accepted stormwater management practices of collecting stormwater runoff with curbs, gutters, and swales and allowing it to be conveyed to the street where it is put underground as soon as the street capacity is reached. Using the traditional BMPs, stormwater pollutants were essentially allowed to flow into our drainageways, creeks, and lakes, which has resulted in negative impacts to these environmental assets. The National Pollutant Discharge Elimination System (NPDES) Phase I and II programs have driven the need to begin to think about how stormwater should be managed from a quality perspective. Local governments need to experience a “paradigm shift” with respect to how stormwater management is practiced within their communities. Arapahoe County is currently experiencing some of these relatively drastic changes in the way we think about stormwater management, and this paper shares some of the lessons that we’ve learned, as well as efforts to incorporate the new stormwater management paradigm in an attempt to re-shape our stormwater program. WHAT IS A RAIN GARDEN? A rain garden is a relatively small depressed area located in the low points of a residential or commercial lot that is constructed to enhance infiltration of stormwater, settling out of sediment, and uptake of stormwater pollutants. Stormwater runoff from downspouts and other areas of the developed lot is routed to the rain garden and filtered naturally through the plant and soil layers into the ground. The rain garden acts as a mini-retention pond, reducing the volume of runoff that reaches the drainageway, and minimizing the amount of sediment and other pollutants that adversely affect water quality. Underdrains may be installed to drain the pond for maintenance purposes or to convey filtered stormwater to a conveyance facility or drainageway. ADVANTAGES AND CHALLENGES OF RAIN GARDENS Rain gardens provide several advantages over traditional structural BMPs, but also present a number of significant challenges that must be addressed in order to enhance their overall chances for success. Rain gardens effectively reduce runoff volumes, remove pollutants, and provide groundwater recharge. In some cases, rain gardens can be strategically located to preserve mature trees or other important site design elements to enhance the overall effectiveness of a development site. The utilization of rain gardens also provides aesthetically pleasing landscaping to a neighborhood and promotes an environmentally positive message. However, site limitations and poor design can sometimes result in unintended consequences. Rain gardens may be overwhelmed by the intensity of the thunderstorms that are common to Colorado. If sediment loads are too high, rain gardens may clog frequently with sediment, debris, and leaves, creating a pond that simply doesn’t drain effectively. Ponds that do not drain out in 24 to 48 hours often lead to mosquito problems, and with the threat of the West Nile virus looming, this is a concern that cannot be ignored. Native soil conditions and types, the wet season
91

location of the groundwater table, and ownership and maintenance of the rain gardens are also challenges that must be addressed. To quantify the seriousness of these challenges, a field survey was conducted in Prince George’s County, Maryland, to determine how 60 infiltration basins and trenches were performing in the field. The survey found that less than half were still functioning as designed, and most of the problems were caused by sediment buildup and a lack of routine maintenance. Over 70 percent of the BMPs surveyed required major rehabilitation (Galli, J., 1993). The results of this survey should motivate those responsible for BMP selection at the local level to address the challenges presented by rain gardens and other BMPs directly, or face a multitude of problems in the future. MEETING THE CHALLENGES The literature is full of disaster stories where BMPs fail within the first 6 months to a year of operation, largely because of poor design, poor construction, or inadequate or non-existent maintenance. Arapahoe County is relatively new to the infiltration BMP arena, but we’ve recognized that an integrated approach is needed to avoid becoming another statistic. If a citizen has a problem with their water system, they call a plumber. If they have problems with their sanitary sewer system, they call a roto-rooter company to come out and fix their problem. If a citizen has a problem with their rain garden, they call…you guessed it, the local government. Ultimately, the stormwater professionals at the local level will be called upon to assess the problem with the rain garden and provide a quick and inexpensive solution. How do we prepare ourselves for this challenge? Education and Involvement Fortunately, part of the aforementioned paradigm shift engages other stakeholders in the effort to be better prepared to meet the challenges of providing water quality benefits. With the introduction of Phase II, nearly every department in local government, as well as most consulting engineers, planners, and architects will be affected in some fashion. Above all, our Boards and Councils will have to be convinced that stormwater management and environmental stewardship are important enough to put together a stormwater program that is more than just reactive. Stormwater management is not a sexy topic; one of our tasks is to identify an area of local interest or importance that shows just enough leg to pique the interest of politicians and obtain their support. Developers, architects, engineers, and contractors must also adapt to the changing stormwater environment. Site designs will need to move from being efficient drainage conveyance and storage systems to being environmentally effective systems, controlling runoff volumes and infiltrating as much rainfall as possible while still protecting property. Planning, Zoning, and Legal departments will need to help put together ordinances that require water quality components and include enforcement authority to enhance cooperation. Citizens must also be educated about environmentally effective stormwater systems when they inquire about why “that pond in my yard” isn’t working. Our field personnel will need to be well versed in rain garden and BMP jargon to be able to articulate to homeowners the importance of environmental stewardship.
92
Site Design and Construction Considerations Environmentally effective site design must start with the Developers, their planners, architects, and engineers. Minimizing directly connected impervious areas and other volume reduction and water quality enhancements should be considered initially, instead of being shoehorned into the design by the engineer after the site has already been planned. Key issues at the design stage include:
• Ensure that the minimum Water Quality Capture Volume, as defined by UDFCD, is obtained.
• Attempt to capture the runoff from the 100-year event; if not feasible for the site,
ensure that 100-year flows have a conveyance path that protects homes and property.
• Design with long-term operation and maintenance in mind; who will be maintaining the rain garden?
• Test the soils to ensure that infiltration rates are high enough to drain the pond (UDFCD recommends 2 inches/hour) and prevent stagnant water. If infiltration BMPs won’t work with a site’s soils, select another BMP.
• Check the depth to groundwater during the high-groundwater season; if the water table is too high, water will not infiltrate effectively.
• For local governments: Make sure that the construction costs are guaranteed financially in your improvement agreement with the developer.
Key issues to consider at the construction stage:
• For the owner/developer: Hire a contractor who is familiar with construction of BMPs, and preferably, has constructed rain gardens before. Check with UDFCD or your local government for recommendations. Make sure that the design engineer or expert is on site for key construction activities.
• For local government reviewers and inspectors: Establish an early relationship with the developer, architect, engineer, and contractor; organize and attend pre-design and pre-construction meeting; work with the contractor to provide resources and suggestions; make sure that a knowledgeable inspector is on site during all stages of BMP construction.
• Make sure that construction activities are staged to coincide with the erosion control components necessary to prevent construction runoff from adversely affecting the infiltration BMP.
Operation and Maintenance Considerations One of the most important issues with rain gardens and other like-BMPs is ownership and maintenance. Who will maintain these rain gardens? What should be the role of
93
the local government? How do we increase the success rate these and other infiltration BMPs? When a BMP is regional in nature, it makes sense to have the BMP owned by a public (City or County) or quasi-public entity (metro district). BMPs that serve individual lots or sites and that are constructed on private property, however, are more difficult to handle. Arapahoe County’s current practice usually assigns ownership of BMPs such as detention ponds and conveyance facilities on site to the owner of a commercial site or to the homeowners association (HOA) if the development is residential. The County gets easements from commercial properties and insists upon tracts that are owned and operated by the HOAs in residential situations. The County also has a Stormwater License Agreement (Agreement) that permits developments to discharge stormwater runoff into the County’s storm sewer system. The Agreement gives the County the right to deny service to licensees if they are discharging pollutants into the system. While the County has threatened to correct malfunctioning water quantity BMPs in the past, it rarely is in a position to enforce the threats, as the current condition of a number of private BMPs in the County would indicate. Phase II, however, ups the ante by requiring permittees to “ensure” long-term operation and maintenance of water quantity and quality BMPs. Based on our experience, here are a few things to consider when implementing rain gardens or other BMPs on a development site:
• Recognize that the local government must play a supporting role in the entire process. Be prepared to provide help to the owner and suggestions for maintenance and rehabilitation. Several local governments have brochures on rain gardens and other BMPs that I’m sure they would be happy to share.
• Plainly indicate ownership and maintenance responsibilities on the plat,
development plan, or other legal document. If possible, place a note on each document, focusing on the zoning plans, as removal or lack of maintenance then becomes a Zoning violation.
• Require easements for BMPs that give the local government the ability to repair
or rehabilitate the BMP at the expense of the owner or HOA.
• Require the owner of the BMP to place money in an escrow account for use by either the owner or the local government to maintain the BMP.
• To ensure that BMPs are inspected regularly, develop protocol during the design
and construction phase for operating and maintaining each BMP that is put in place. Require an operation and maintenance manual and prepare a checklist for inspectors.
• Encourage landscaping and other contractors to learn about rain gardens and
other BMPs and consider providing this service to existing and new customers.
• The first owners of new homes having rain gardens will likely accept having to maintain their rain gardens. However, problems may surface after the home has changed hands. Ensure that new owners are made aware of their rain garden responsibilities by perhaps recording a document against the property that indicates the rain garden is required as part of the plat or development plan.
94

LESSONS LEARNED (A FEW PARTING THOUGHTS) In general, dealing with BMPs such as rain gardens requires creativity and flexibility, as well as caution and common sense. Here are a few more general considerations based on our experience:
• Don’t bite off more than you can chew. Utilize a “phased approach” to your program. Arapahoe County is using one 5-acre, 10-lot subdivision as a test case for rain gardens.
• Encourage flexibility in your criteria manuals. This is an experiment in what
works and what doesn’t. Don’t make the mistake that some Phase I communities made by, for example, requiring infiltration BMPs in all locations.
• If you haven’t started already, begin to lay the groundwork for a solid,
dependable source of funding for your entire program.
• Provide financial or other incentives to developers who incorporate water quality BMPs into their site design. If a utility is in place, perhaps a credit against the user fee would be an incentive for the developer to include water quality BMPs. Work with your Planning departments to allow perhaps an increase in density if runoff volumes are sufficiently decreased with their site design.
CONCLUSION Local governments affected by the NPDES Phase II regulations are currently attempting to figure out how to assemble an integrated stormwater management program that achieves the goals of Phase II and is still cost effective. The integrated approach to stormwater management presents many challenges that are going to require a shift in the way we think about and deal with stormwater. If a cautious, phased approach to implementation of water quality components is used, the opportunities for success far exceed the chances for failure.
95

REFERENCES
1. Schueler, Thomas R., and Holland, Heather K., The Practice of Watershed Protection, Center for Watershed Protection, 2000.
2. Galli, J., Analysis of Urban BMP Performance and Longevity in Prince George’s
County, Maryland, Metropolitan Washington Council of Governments, 1993. 1Steve Gardner has a Masters Degree in Civil Engineering from Colorado University and is a Certified Floodplain Manager. He has been working in the Civil/Environmental field for 12 years, 5 years in consulting and 7 on the public side (…and he’s still not sure which is considered the "dark side"). Steve joined Arapahoe County in 1996 doing land development reviews and became stormwater program manager in 1999. Current projects Steve is working on include integrating NPDES into the stormwater management program and establishing a stormwater authority that includes unincorporated Arapahoe County and the City of Centennial. Steve is married to Heidi and has 2 terrific boys, Jared (2 yrs old) and Calen (6 years old).
96

SESSION FOUR
97

SESSION FOUR OVERVIEW: Institutional Issues
What Have We Learned about Implementing BMPs?
William P. Ruzzo, P.E.1 William P. Ruzzo, PE, LLC
Lakewood, Colorado
Improving urban stormwater quality is not an easy task. If it were, perhaps we would not be having this conference. However, two questions are frequently asked. Are we creating more problems than we are solving? Are we on the right path? I hope the answers to these questions are positive and trust that information you obtain from this conference is more encouraging than discouraging. The purpose of this conference is to examine what is right and wrong with one of our better means to manage urban runoff quality, best management practices (BMP). However, just when we thought we had viable solutions, we are faced with new problems that could derail the effort. This session, in particular, focuses on three of these “challenges”, mosquito control and BMPs, perceptions in land development practices, and are we providing benefits to the citizens by implementing BMPs. Mosquito Control and BMP Some of the better natural-type-systems to improve stormwater quality are detention basins, wetlands, and infiltration basins. I use the word “natural” to distinguish them from chemical treatment or filtering through man-made materials, but also to emphasize their ability to blend into the environment and not become obtrusive. One aspect that these BMP have in common is that they result in some standing water, even if only for a “brief” period in the case of infiltration basins. Based on the West’s experience with the West Nile Virus in 2002, there is movement to eliminate any standing water, going so far as to suggest minimizing standing water sources for periods longer than a couple of days (AMCA 2003). There are numerous publications that support these BMP and provide design guidance, most notably in the Denver area is the Urban Storm Drainage Criteria Manual (UDFCD 2001). Whereas mosquito management may not be explicit in all of these guidance documents, the issue has not gone unnoticed (WEF 1998). WEF suggests that “…wetland plants within a littoral zone of a retention pond (wet) provide a habitat for birds, predacious insects, and fish that serve as a natural check on mosquitoes.” As we begin to study this issue further, similar suggestions for “dry” detention basins and infiltration basins have begun to evolve. Perhaps the bigger question is whether we can overcome public perception, even if we minimize breeding habitat in the design of BMPs. Phosphorus-Ombudsman Another promising technique for managing urban runoff is to improve “source control” by promoting infiltration at the individual lots or smaller areas of a subdivision. There are several names for this approach including low impact development (EPA 2000), minimizing directly connecting impervious area (UDFCD 1999), sustainable development
98

and built-green, all of which embrace the concept to manage stormwater from urban areas. Problems arise in the implementation of the concept. One design approach is to use broad, shallow, roadside swales for stormwater conveyance, instead of curb and gutter. These swales would filter stormwater in the vegetation, reduce flood peaks, and promote some infiltration and biological/chemical immobilization (WEF 1998). This approach, however, has met with resistance from planning and engineering types in local governments. The approach is also strongly opposed by the American Public Works Association (APWA). They present such arguments that curb and gutters “are more cost effective”, “controls drainage”, “improves appearance”, and “tends to require less right-of-way”. Perhaps these issues can be overcome given the right design approach. APWA also suggest that public works officials insist on curb and gutter even when presented with logical arguments for other approaches. This is where the Phosphorus-Ombudsman can play a key role by educating communities toward more environmental friendly approaches. The concept behind the “P-man”, as sometimes referred to, is to have a single person in the Basin whose job it is to work with communities, developers, planners, and engineers to design subdivisions that go much further than just meeting minimum requirements. This person would need to be “in the face” of the developers’ design team before the concepts are fixed on paper. He, or she, needs to have authority, or at least be a strong advocate for land use compromises to achieve water quality goals. Benefits of Implementing BMPs The City of Fort Collins has been proactive in its approach to stormwater quality, before the advent of the Federal programs. They have been experimenting with various BMPs and their acceptance by the community. One lesson they have learned is to make the connection between BMP and benefits to their citizens, such as open space, sustainability, and water quality improvements. To accomplish this goal, they have had to focus on educating the public, engineers, environmental scientists, and policy makers. They have identified a variety of perspectives from these stakeholders and have some suggestions on how our “industry” might help. Lessons Learned I once had a boss tell me not to come to him with problems, but come to him with solutions. I believe this is good advice since it requires us to think about solutions, not just problems. I obviously have not forgotten this lesson and will apply it here as well. A solution to the problems discussed above is one that keeps showing up in all aspects of life…education. This means not only understanding the technical aspects of the problem, but also understanding the human aspects. Whereas, this is not something we technical folks are always comfortable in doing, we must adjust and learn to educate as well and calculate
99

References American Mosquito Control Association, 2003. Mosquito Information. American Public Works Association, no date. Why Curb and Gutter? Environmental Protection Agency, October 2000. Low Impact Development (LID) A Literature Review. EPA-841-B-00-005. Urban Drainage & Flood Control District, September 1, 1999. Urban Storm Drainage Criteria Manual Volume 3 Best Management Practices. Water Environment Federation, American Society of Civil Engineers, 1998. Urban Runoff Quality Management. WEF Manual of Practice No. 23, ASCE Manual of Practice No. 87. 1Bill Ruzzo has been a civil engineering consultant in the Denver area for over 30-years and has been self-employed for the last 10. He specializes in storm drainage, flood control and storm water quality projects. He co-authored many drainage criteria manuals in Colorado, Oklahoma, Texas and Washington State. Several of these manuals include the first storm water quality criteria in the Denver Metropolitan area, which preceded Volume 3 of the Urban Drainage & Flood Control District. He has been working with the Cherry Creek Basin Water Quality Authority for 6-years, providing guidance and direction on watershed scale, best management practices.
100

F. Robert McGregor and Lanae Raymond
THE CHERRY CREEK BASIN PHOSPHORUS BROKER
DR. F. ROBERT MCGREGOR, P.E.1 Water & Waste Engineering, Inc.
Denver, Colorado
LANAE RAYMOND2 Arapahoe County Stormwater Management Group
Arapahoe County, Colorado
ABSTRACT Water-based recreation at Cherry Creek Reservoir (Reservoir) is a major regional asset. The Colorado Water Quality Control Commission (WQCC) has established water quality standards and set into motion a process for determining a Total Maximum Annual Load (TMAL) for total phosphorus that can protect those uses. Substantial urban growth will likely occur within the watershed over the next 20 years. Scientific studies indicate that the use of the Best Available Technology (BAT) for wastewater dischargers and generally accepted Best Management Practices (BMPs) for stormwater discharges will not achieve the water quality standards set for the Reservoir. Smart Growth practices that include innovative site designs to preserve and enhance open space while achieving improved management of stormwater discharges will be required.
The traditional development review practices can be barriers to innovative Smart Growth practices. The Cherry Creek Stewardship Partners (Partners), an active group of local stakeholders, has proposed the establishment of a Phosphorus Broker to help overcome these barriers. The Phosphorus Broker will work with both the development community and review agencies to help foster and implement timely and cost effective Smart Growth practices that will help achieve water quality and other watershed goals.
INTRODUCTION Cherry Creek Reservoir is located within Cherry Creek State Park. Cherry Creek State Park has historically been one of the most popular parks in the state park system because of its location in the Denver metropolitan area and its water-based recreation opportunities. Economic studies of this water-based recreation have estimated its capitalized value to be in the range of $800,000,000 to $3,100,000,000 depending upon
101

the extent to which the indirect regional economic impacts are included in the analysis. By any measure, these recreation values are a major asset for the Denver region worthy of protection. The WQCC in 1984 established an in-reservoir total phosphorus water quality standard of 35 microgram per liter (ug/L) and a total phosphorus Total Maximum Daily Load (TMDL) of 14,270 pounds per year (lbs/yr) to protect the water-based recreation of the Reservoir. The WQCC then modified the in-reservoir water quality standard in 2000 to be 15 ug/L Chlorophyll a (Chl a) with a total phosphorus concentration goal of 35 ug/L. The WQCC then adopted a control regulation in 2001 that required the wastewater dischargers to use BAT to limit wastewater discharges to 50 ug/L and the use of baseline BMPs recommended by the Denver Urban Drainage and Flood Control District (UDFCD) to remove 45 to 55% of the total phosphorus in stormwater. The WQCC also established a phased TMAL process to define the pollution sources and the mitigation practices that would be required to achieve the 15 ug/L Chl a standard. The Cherry Creek Basin Water Quality Authority (Authority), established by state statue, is responsible for the preparation of plans for the control of pollutants in the watershed to meet the water quality standards adopted by the WQCC. The unprecedented growth in the Cherry Creek watershed, which includes the thriving towns of Franktown and Parker, the expanding cities of Aurora and Centennial, and the growing counties of Arapahoe and Douglas, has prompted wide-spread focus on local water quality and quantity management strategies for the watershed. Development changes the historic rainfall/runoff process to produce higher rates of runoff with higher concentrations of phosphorus and other pollutants. These urban growth pressures have solidified the need for additional, innovative development strategies and enhanced BMPs for dealing with the increasing urbanization of what was formerly undisturbed parcels. The 15 ug/L Chl a standard is not being met today with Reservoir total phosphorus loads averaging approximately 6,800 lbs/yr. Scientific studies by the Authority and others have confirmed that, with the growth in the watershed anticipated over the next 20 years and with the implementation of BAT by the wastewater dischargers and the application of the baseline BMPs recommended by UDFCD throughout the watershed, the loads will remain at about 8,800 lbs/yr. Compliance with the Reservoir 15 ug/L Chl a water quality standard will not be met with these loads. The present and future loads are summarized in Table 1. Since it is unlikely that it will be possible to further reduce the loads caused by the wastewater discharges, it is likely that it will be necessary to find ways to further reduce the stormwater discharges using more innovative stormwater management practices. If additional reductions totaling approximately 2,000 lbs/yr can be achieved, it is likely that it will be possible to achieve the Reservoir water quality standards.
102

Table 1. Summary of Phosphorus Loads at Cherry Creek Reservoir
Source
Annual Total P Loads
6,836 lbs/yr8,321 lbs/yr NET
-2,000 lbs/yr Smart Growth Practices
8,836 lbs/yr8,321 lbs/yr Subtotal
210 lbs/yr0 lbs/yr Basin Authority Trades
- 2,720 lbs/yr0 lbs/yr Basin Authority PRFs
- 1,313 lbs/yr0 lbs/yr Stormwater BMPs
10,349 lbs/yr7,067 lbs/yr Stormwater Sources
2,310 lbs/yr1,254 lbs/yr Wastewater Plants
Future (2020)
Current (1997)
Note: compliance with 15 ug/L Chl a standard likely achieved with average annual totalphosphorus loading at 6,800 lbs
The Partners was formed in 1999 by a broad-based group of stakeholders in the Cherry
reek watershed to provide a forum for stewardship activities in the Cherry Creek atershed. The Partners bring together representatives from the land use jurisdictions,
e of grass-lined swales rather than storm ewers, preservation and construction of wetland areas, conservation of riparian areas,
rus Broker) within the Authority organizational
Cwthe state and federal resource management agencies, conservation, recreation, and historic preservation groups, the business community, and interested citizens. The Partners Water Quality Committee highlighted 4 case studies that identified innovative streamside and on-site enhancement projects that go beyond the generally accepted baseline BMPs to improve the water quality. The additional practices identified by the Partners include the aggressive maximization of infiltration to minimize runoff, maximum ussand the implementation of other practices to integrate stormwater management into regional efforts to conserve open space, protect riparian habitat and enhance wildlife habitat. The Partners evaluated these practices as a part of its participation in a nation-wide “Smart Growth for Clean Water” project sponsored by the U.S. Environmental Protection Agency (EPA) and the National Association of Local Government Environmental Professionals (NALGEP). As a result of the Smart Growth for Clean Water project work, the Partners identified a need for a special ombudsman (Phospho
103

structure to assist the Authority, local land use agencies, and developers in the use of
POSITION
he implementation of stormwater BMPs occurs at the local government level. The goal eyond minimal BMPs to include enhanced
ractices that achieve total phosphorus removals greater than 45 to 55%. The
motion of the wise use of our watershed resources while at the same time maintaining the economic viability of development;
ory
s and the development of
of BMPs that go beyond the minimum regulations; and
in the watershed is a shared vision and
A critical component of promoting Smart Growth strategies in the watershed is the reation of a Smart Growth advocate (Phosphorous Broker) that facilitates the best use f technology and competitive development tools that can be utilized in the watershed.
arcel. Such plans are very site specific and do not include special consideration for
innovative non-point source controls as a tool for achieving water quality standards and other goals in the watershed. THE PHOSPHORUS BROKER Tof the Partners and the Authority is to go bpmechanisms to achieve the additional removals have been identified by the Partners as Smart Growth practices. The Partners have envisioned several Smart Growth practices including:
Optimization of regional opportunities and encouraging collaborative efforts; Pro
Use development incentives wherever possible in place of additional regulatcontrols; Identification of barriers to innovative approachesolutions to overcome those barriers; Facilitation
Communication of strategies with other stakeholders in the watersheds so that the enhancement of the water quality promised reality.
co The standard development review process is usually reactionary in nature as illustrated in Figure 1. The developer typically prepares and submits a plan for a specific landpmore watershed-wide issues such as regional open space goals, the availability of off-site parcels to implement enhanced BMPs, etc. The development proposal is then reviewed by the local government agency in the context of the minimum applicable requirements for that specific land parcel. In this process, there are only limited opportunities to consider water quality, open space, riparian habitat enhancement, and other watershed goals.
104

Developer (Proposes)•Limited private property•Density limits•Excess drainage water•Enhance property value•Profit
Review Agency (Reacts)•Sets regulatory limits•Assures compliance•Density bonus/credits•Public property
Acceptable Development•meets minimum standards
Figure 1: Standard Development Review Process This process will produce an acceptable development plan, but could miss opportunities for innovative practices that could prove to work to the advantage of both the developer and regional interests. Figure 2 illustrates an alternative, more interactive, process that would be enhanced by the active presence of the Phosphorus Broker. The Phosphorus Broker would become actively involved in the development planning process long before a specific proposal is completed by the developer and submitted to the review agencies. The Phosphorus Broker would actively encourage the developer to consider innovative Smart Growth practices and would work with the review agencies to recognize those Smart Growth practices that could produce the greatest benefit for the region. The preparation of the development proposal would be an interactive exercise between the developer the Phosphorus Broker and the review agencies. Proposals would be discussed, refined, and improved upon based on the input from all three parties. The goal of this interactive process would be to produce a plan that is cost effective, can be approved in a timely manner, and will achieve regional watershed goals that may not be apparent when consideration is limited to the development requirements that would apply only to the parcel in question. Such a planning process could create opportunities to obtain open space, construct enhanced BMPs, and allow for density transfers or bonuses for the development parcel.
105

P h o sp h o ru s O m b u d s m a n (E n h a n c e s )
•M u ltip le o b je c tiv es (w a te r q u a lity , o p e n sp ac e , w ild life h ab ita t, e tc .)•F le x ib ility to c o n s id e r m u ltip le p ro p ertie s•D em o n stra tio n g ra n ts
D e v e lo p e r (P ro p o se s )•L im ited p riv a te p ro p e rty•D e n s ity lim its•E xc es s d ra in a g e w a te r•E n h a n ce p ro p e rty v a lu e•P ro fit
R e v ie w A g e n c y (R ea c ts )•S e ts re g u la to ry lim its•A ss u re s c o m p lia n c e•D en s ity b o n u s /c re d its•P u b lic p ro p erty
P re fe rre d D e ve lo p m e n t•m ee ts m in im u m s tan d a rd s•m e ets m u ltip le o b je c tive s
Figure 2: Enhanced Interactive Development Process The Canyons Development in Douglas County is a good example in which the Phosphorus Broker could have facilitated the development process to produce a desired result in a timely manner. The Canyons Development is located immediately east of I-25 and north of Castle Rock, encompassing the Newlin Gulch, Lemon Gulch, Scott Gulch and McMurdo Gulch drainageways, all tributary to Cherry Creek. The site design for the Canyons Development incorporates large amounts of open space land that include approximately 40 acres of constructed wetlands as effective enhanced stormwater BMPs. The 2,501 living units are placed in clusters within a 5,576 acres development site. Cluster zoning maintains high levels of development by clustering buildings and infrastructure on a concentrated area of the site instead of spreading development evenly over the site. This generates more open space and makes more efficient use of the infrastructure. The clustering of the development areas has provided opportunities to enhance property values through dedicated open space with constructed wetlands. Of the total acreage, 60% is dedicated open space. The constructed wetlands will enhance wildlife habitat and improve the opportunities for recreation along a trail system that parallels the constructed wetlands. The Canyons Development plan also utilizes the baseline BMP stormwater management practices. The use of the baseline BMPs plus the enhanced BMPs will improve stormwater management to a degree that totally mitigates the adverse water pollution effects of the proposed development. The Canyons Development cluster plan with the large open space and constructed wetlands became a condition of approval from the local planning agency. These conditions helped to overcome objections to a development plan that had been rejected several times over a 15-year period. With a Phosphorous Broker position in effect in the watershed, the development process may not have taken so long or been subject to so much uncertainty. The Canyons Development was one of the 4 case studies by the Partners Water Quality Committee in the Smart Growth project All 4 examples illustrate the benefits to be derived from Smart Growth development practices for other developments in the watershed. It is envisioned that in the future, the Phosphorous Broker could facilitate
106

just such a development proposal in a way that serves the interests of the developer, the watershed, and the water quality goals for the Reservoir. SMART GROWTH CONSTRAINTS Implementation of Smart Growth practices that could increase the quality of the environment and the quality of life in the community is not as straightforward a process as it would appear. Despite increasingly proactive Smart Growth leadership by key organizations, several barriers remain in the path of implementation. Constraints to Smart Growth in actual practice have been identified within the Cherry Creek basin as follows:
Lack of widely available information on Smart Growth strategies to make informed decisions;
No established policies that complement Smart Growth within the planning agencies;
Lack of certainty in the review and approval process; and Lack of cooperative planning and collaborative efforts
Within the Cherry Creek basin, it is imperative that water quality strategies go beyond the status quo and reach into the realm of reducing runoff volumes and subsequent pollutant loads to equal to or less than pre-development conditions. The Phosphorus Broker advocate would be in a key position to identify low impact development techniques, encourage developers to adopt these approaches, facilitate their approval in the regulatory process, coordinate outreach and education on the benefits of these approaches, and provide wider implementation of these practices. The following are some thoughts on the identified constraints and how progress can specifically be achieved through the efforts of the Phosphorus Broker. 1. Lack of Smart Growth strategy information to make informed decisions: Most local government staff and the development community remain unaware of the economic and environmental costs of business-as-usual development, as well as the benefits of Smart Growth. The Phosphorus Broker’s ability to provide training sessions with local land use staff, as well as developers, on applicable Smart Growth strategies for the watershed is a key. From a development standpoint, higher development costs can accrue whenever the local planning agency does not understand the benefits of an innovative proposal and the approval of the innovative plan is delayed.
107
Some of the specific things that can be done by this Phosphorous Broker position include:
Organize and facilitate face to face meetings between the developer and review agency staffs to discuss and explore Smart Growth development techniques that will provide watershed benefits beyond those which will accrue as a result of meeting minimum regulatory requirements;
Work with the development community to encourage it to adopt proven Smart Growth development techniques that are cost effective and responsive to those concerned with preserving open space; and
Conduct information-sharing sessions with elected and appointed officials so that Smart Growth opportunities can be fully supported at all decision-making levels to avoid any unnecessary delays.
2. No established policies that complement Smart Growth within the planning agencies, and a lack of certainty in the review and approval process: Doing the ‘right thing’ for the environment in terms of Smart Growth, beyond the regulatory requirements, is not inherently identified in the development planning and engineering process. For example, the runoff volumes can be minimized through the use of narrower streets with adjacent grass-lined swales. This approach may make sense from a Smart Growth perspective, but local roadway standards may not allow streets other than standard width with curb and gutter in a developable area. So mere education is a great start, but education alone may not achieve the intended result. There may be a need to institutionalize Smart Growth practices that make sense for the Cherry Creek basin. In addition, the local government requirements in the form of building, zoning, and other regulations may not be integrated sufficiently to successfully deal with the integrated issues development design and stormwater quality management. Smart Growth practices, if new to the review agencies, can slow the schedule for planning approvals. Without predictability in the timetable for the planning and approval process, funding sources may require higher lending rates to make up for any uncertainty and schedule lapses. Additionally, this can lead to a longer learning curve during the development planning approval process. The Phosphorous Broker advocate position would provide a go-between with local review agencies to obtain certainties, incentives, and timely approvals from local development review authorities.
108

The Phosphorous Broker could enhance this process through the following:
Identification of approximately 5 specific development parcels where Smart Growth practices could be implemented in the short run (2 to 5 years);
Evaluation of local review processes to see where reviews and approvals may be accelerated following the inclusion of Smart Growth practices;
Facilitation of the creation of incentives like density credits, transfer of development credits, faster permit approval, services based on site area, not just developed areas, and/or reduced building fees to direct development where it is desired. Compile list of incentives developers have found to be advantageous in the planning process;
Facilitation of the goal of an increase in certainty and predictability in the planning, approval, and permitting process; and
Submission of recommendations to the Authority and local land use agencies on the institutionalizing of these incentives over time
3. Lack of cooperative planning and collaborative efforts: Local governments can promote Smart Growth activities by participating in the watershed management as a key stakeholder and a champion for creating a long-term strategy for the development impacts on the watershed. Homeowner Associations and other community groups can play a key role in shaping local plans by providing information about the concerns of their constituents, disseminating development information back to the community, and facilitating the eventual implementation of the strategy or plan. In many instances, public involvement is required by state and local statutes and comprehensive plans. In other cases, public participation may be a necessary part of securing funding for a watershed enhancement. In all cases, citizens and grassroots organizations want significant opportunities to interact with watershed groups, land use planning agencies, developers and regulators in order to communicate their vision for how they want their watershed to mature, and see it formalized in planning documents. The nature of planning documents is such that they require an extensive commitment in time and energy during discussion, preparations and implementation. However, the result is an extremely valuable document that captures the intent of the parties in indelible ink, and provides a baseline with which to document and monitor the progress and ensure the long-term adherence to the agreement. The Partners organization has made great strides to fill this need for communication and collaboration. Greater strides can be made with an active and
109

knowledgeable Phosphorous Broker. The Phosphorous Broker can do the following to facilitate the collaborative process as follows:
Identify common ground between the planner, the engineer, the developer, the
financial backer, the environmentalist, and the public that allows each entity to realize its goals;
Create new partnerships where the developer is assisted in viewing land
development sites that have a difficult time making it through the regulatory process in the broader context of regional goals, such as open space set-asides and wetland construction, such that approvals are forthcoming because the development met the regional watershed water quality goals; and
Create new partnerships where the environmentalist and the public are
conversant about the efficient use of capital such that they work better and smarter with the development community to meld all of their respective needs
PHOSPHORUS BROKER OBJECTIVES AND RESPONSIBILITIES The Phosphorous Broker will require skills and experience in areas such as mediation, watershed protection, BMPs, Smart Growth tools, development economics, and public communication to fulfill the following objectives:
Identify Beyond Compliance Practices – The Phosphorous Broker will identify a set of low impact development practices that have proven effective at phosphorus reduction and removal, with a focus on constructed wetlands, riparian buffers, and on-site stormwater retention techniques. The advocate position will assemble a clearinghouse of information and resources on these techniques, including information on the economic advantages of these techniques for the private sector.
Gain Support of Development Review Authorities – The Phosphorous Broker
will conduct an effort to educate development and planning review staff and officials on the water quality and economic benefits of these low impact development techniques. Efforts will be focused in Douglas County, Arapahoe County, the City of Centennial, and the Town of Parker. The Phosphorous Broker will seek support from these development authorities for regulatory incentives for these techniques, including streamlined approvals, phosphorus trading credits, and development density bonuses.
Facilitate Adoption by Developers – The Phosphorous Broker will approach
developers proposing subdivisions of significant size to encourage the developers to adopt proven low impact development techniques, identify the economic benefits of these approaches, and facilitate their acceptance in the regulatory process.
110

Promote Institutionalization – The Phosphorus Broker will make
recommendations to the Authority and local governments on the institutionalization of these techniques over time through regulatory or voluntary programs. The Phosphorus Broker will also identify how the advocate position can be sustained through the sponsorship of local and state entities, development fees, and/or the economic value created by the implementation of these practices.
ESTABLISHING THE POSITION The Phosphorus Broker position may require a full time employee funded by the Authority, local governments and the development community. Until the details of the position are fully defined, the position could be effectively filled through a series of work tasks that are contracted to one of several consulting firms, utilizing expertise that is currently present in the basin. The position would be established at the Authority, and report to the Authority’s Technical Advisory Committee, while working closely with the Partners in their planning education, and project activities. At this point in time, the Authority has set aside $40,000 in their 2003 budget for this function. NEXT STEPS
The Partners Water Quality Committee will discuss the tasks to be performed by the Phosphorous Broker position and finalize a list of prioritized tasks and appropriate entities to complete the tasks;
The Partners will present a proposal for a Phosphorous Broker to the Authority Technical Advisory Committee; and
The Technical Advisory Committee will present the proposal to the Authority Board for consideration and discussion.
111

LESSONS LEARNED The development community has already voluntarily implemented stormwater management practices in Cherry Creek basin that go beyond the BMP requirements. They have done so in their economic self-interest because of enhanced property values and to gain acceptance from review agencies and the community at large. It is possible that the Phosphorus Broker will encourage other developers and review agencies to do the same, in a way that is a benefit to the Cherry Creek watershed. 1Bob McGregor is the President of Water & Waste Engineering, Inc. Bob is a Colorado native with special interests in watershed management and urban drainage designs that complement the natural environment and enhance property values. Bob has Mechanical and Environmental Engineering degrees from the University of Notre Dame and a PhD in Environmental Science and Engineering from the University of California in Los Angeles. Bob has more than 30 years experience as a professional consulting engineer in the fields of water supply, urban drainage, and wastewater treatment. He received the 1981 American Consulting Engineers Council National Award for Engineering Excellence and the 1991 Colorado Consulting Engineers Council Award for Engineering Excellence. His company was recently honored by the National Republican Congressional Committee as a recipient of the 2002 Entrepreneur’s Gold Medal. 2Lanae Raymond has a hydrology degree from the University of Arizona and has been working for Arapahoe County for 5 years in the Stormwater Management Group. Lanae will be a key staff member administering the County's Phase II permit. Previously, she worked for a consulting firm in the southwest and California for 12 years as a hydrogeologist doing groundwater investigations for water supply or hazardous waste contamination assessments. Lanae was one of the founding members of the Cherry Creek Stewardship Partners, formed in 1999 to provide a forum for stewardship opportunities in the basin, and has continued her efforts to improve the water quality in the reservoir by promoting collaborative efforts and facilitating innovative projects. She is a member of the Cherry Creek Basin Water Quality Authority Technical Advisory Committee, assisting the Authority in integrating watershed goals and a basin-wide vision into their mandate for protecting the Reservoir. Lanae received the Partners 2001 Stewardship Award for her efforts in the basin, and in 2002, the Stewardship Partners received a DRCOG Local Governments Innovation Award.
112

STORMWATER BEST MANAGEMENT PRACTICES, MOSQUITOES, AND WEST NILE VIRUS
A Look at the Colorado Front Range
Tim Howard Colorado Mosquito Control, Inc.
9999 Olde Wadsworth Blvd., Broomfield, CO
1
ABSTRACT: Stormwater detention technologies and structures are being built into all new neighborhoods and developments. Commonly referred to as Best Management Practices (BMPs), these devices are required under regulations promulgated to achieve in stream water quality requirements mandated by federal laws (primarily the Clean Water Act and the Endangered Species Act). A comparison of data collected over 3 years for 5 of these structures in the Denver Metropolitan area with 5 non-BMP sites in Boulder County will demonstrate that the structures contribute significantly to the population of mosquitoes capable of vectoring West Nile Virus (WNV) in urbanized areas. Landscape changes from indigenous short grass prairie, to an area with a variety of trees has provided habitat for a diverse avian population. The urban combination of birds, vector mosquitoes, and people can create an increased risk of WNV. Improved maintenance of BMPs, designing BMPs to eliminate any water standing longer than 72 hours, and insuring mosquito control personnel know the location of new BMPs, and have access to them will significantly reduce this risk.
INTRODUCTION How we view the world around us is in large part determined by our perspective. In researching the topic of Best Management Practices, it quickly became obvious that engineers, planners, and others involved with controlling storm water runoff do not see the world the same way as public health and mosquito control professionals. “Best Management Practices” (BMP) has specific meaning within the stormwater context – a group of technologies and structures that collect and control stormwater runoff to protect the receiving waters from pollution and erosion. In the public health community
113

however, one “best management practice” is to eliminate potential larval mosquito development sites if possible. Another example of the difference in perspective is demonstrated very well in a recent article where the term vector is defined alternately in physics as a: “…quantity that has magnitude and direction…commonly represented by a directed line segment…” or in biological terms as “…any organism that can transmit an infectious disease pathogen to another organism.” (Metzger 2002) Those of us in public health or mosquito control generally see the physics term as a concept we learned in a long forgotten college class. How we define our terms depends on our perspective. How we view stormwater BMPs also depends on our perspective. To stormwater engineers and managers, they are a beneficial means to achieve compliance with the Clean Water Act (CWA) and the Endangered Species Act (ESA). To public health professionals, they are an ongoing problem and increasing source of concern. Why are BMPs problematic? BMPs that do not completely drain in less than 72 hours can produce mosquitoes. Not all mosquitoes are equally troublesome, however. Although most species of mosquitoes can be an annoyance problem to humans, those known as “floodwater” mosquitoes (genus Aedes/Ochlerotatus), are not usually considered a human health problem because they are not primary vectors of encephalitis viruses, including West Nile Virus (WNV). Stagnant water mosquitoes (genus Culex) are primary vectors of WNV, and are a public health concern. Floodwater mosquitoes lay eggs on mud, leaves, or other debris in areas prone to flooding. A variety of factors determine how rapidly these eggs can go through the aquatic stages of the mosquito life cycle (larvae and pupae). Under some conditions employees with Colorado Mosquito Control, Inc (CMC) have documented emergence of adult mosquitoes from newly flooded sites in less than 5 days. Vector mosquitoes lay eggs directly on the water’s surface in groups of up to 250, called rafts. Water in preferred oviposition sites is typified by discoloration, a noticeable odor, and organic matter like rotting grass clippings, pet waste, fallen leaf matter, etc. It generally takes several days for new runoff water to stand before Culex mosquitoes will begin to lay eggs at the site. Once these conditions are met however, sites can be partially recharged with fresh water without loosing their “stagnant” characteristics.
A variety of BMPs create habitat suitable for production of Culex mosquitoes. Some of these are predictable, others create suitable habitat because of poor placement, poor maintenance, or improper construction. Grass swales, extended detention basins, sand filter extended detention basins, constructed wetland basins, and retention ponds all produce conditions suitable for Culex production. Grass barriers do not directly provide larval development habitat, however CMC personnel have many documented instances where they create mosquito problems because irrigation necessary to sustain them adds a constant recharge to adjacent habitats suitable for mosquito production.
BMP design, construction, and use recommendations are set forth in Volume 3 – Best Management Practices of the Urban Storm Drainage Criteria Manual (section S, and section IC). Non-structural BMPs listed in the manual are essentially common sense approaches to preventing pollution of soils and waterways.
114

As a professional biologist and environmental scientist, I question some of the recommendations – particularly the recommendation of retention ponds as suitable for virtually all runoff conditions. For example: How does creating a pond to store runoff water contaminated with toxic substances solve any problem? At what time does the pond become part of the “receiving waters” protected under the clean water act? Do these recommendations take non stormwater runoff into consideration? Based on observations by CMC field personnel, most of the water creating problems in BMP along the Colorado Front Range urban areas is runoff from lawn and turf irrigation rather than stormwater runoff. BMPs that look like sand filters designed to dewater within 72 hours often have permanent pockets of water that are prolific mosquito producing sites either because sediment has clogged the sand filter, or non stormwater runoff was not considered when designing or placing the BMP.
The overwhelming majority of larval mosquito development sites in the urbanized areas CMC works in can be classified as BMPs. Old irrigation storage ponds that have maintained water rights, landscape features (fountains, birdbaths, water gardens and ornamental ponds) and unattended swimming pools, make up a small percentage (less than 10 %) of the “permanent” sites commonly creating mosquito problems. Local mosquito problems can be created by buckets, trash cans, or other containers that receive water from yard irrigation; however, mosquito annoyance calls allow CMC personnel to quickly identify and eliminate these sites.
Public health and mosquito control organizations have many common objectives with stormwater managers. We all have to abide by regulations promulgated to comply with federal environmental laws, and we are both in the business of insuring a high quality of life and a healthy environment.
Colorado Mosquito Control, Inc. utilizes an environmentally friendly but effective Integrated Pest Management (IPM) strategy throughout the north metropolitan and Boulder County areas to control mosquitoes. Steps in the programs includes mapping sites likely to provide habitat for larval mosquito development; inspecting these sites weekly throughout the summer season for mosquito larvae – treating them in an appropriate way to kill any larvae found; trapping adult mosquitoes to monitor the population and assess the vector potential; collecting and submitting mosquitoes and chicken blood for encephalitis analysis; control of adult mosquitoes when and where appropriate. Through this program, CMC has maintained records for over 10 years for many sites within the north metro area. Data presented here is a 3 year retrospective comparison of 5 urban BMP sites found in Westminster, Broomfield, Lakewood, and Thornton with 5 non-BMP rural sites in Boulder County. Sites are inspected throughout the summer season by field technicians for the presence of water and mosquito larvae. If mosquito larvae were found, they were eliminated in an appropriate manner. Because of drought conditions during 2002, data presented are for the years 1999 through 2001. METHODS Technicians inspect and larvicide (as needed) (I/L) known larval development sites weekly from mid May through early September. Inspection consists of walking to the site and determining if it is wet or dry. If the site has standing (or slowly flowing) water, a white pint sized dipper (essentially a cup at the end of a 4 foot long wooden dowel) is
115

used to dip water from the site. The water is then examined for the presence of mosquito larvae or pupae. The process is repeated enough times to quickly and accurately determine if any part of the site has mosquito larvae or pupae present. A site can vary in size from a small section of ditch or a tire track, to an irrigated pasture encompassing many acres.
If mosquito larvae or pupae are found in the site, it is treated with an appropriate product to kill the mosquitoes. Information about the genus and species of mosquitoes found during I/L is not collected. Each known larval development site identified by a unique number and is mapped in ArcView GIS.
Records are maintained for every site inspection carried out by CMC personnel including the date and time of the inspection, whether the site is wet or dry, the number of dips taken at the site, the average number of larvae per dip, if the site was treated, what product was used, the amount of product used, the area treated, and other actions taken (like filling in tire ruts or opening clogged drains).
Data is a summary of the inspections of 5 BMP and 5 non-BMP sites for the 1999 to 2001 seasons. Because the purpose of this paper is demonstration rather than research, sites were selected because of their propensity to produce mosquitoes, rather than a random selection of BMP and non-BMP sites. DATA Table 1 is a summary of the location and habitat type for the sites selected.
TABLE 1. Site description Site # Location Site type Water source BR-033 Brmfld Multiple use catch basin BMP / runoff + irr.
124th/Lowell
LK-036 Lkwd Runoff catch basin / pond BMP / runoff
Beliot Pl. / Oak Wy.
TH-056 Thrntn Runoff catch basin / pond BMP / runoff
104th/Colorado
WE-081 Wstmn Ditch – Flat catch basin BMP / runoff + irr.
134th/Kalamath
WE-086 Wstmn Series of small catch basins BMP / runoff
Bruchez Pkwy / 107 pl.
BN-032 Bldr Cnty Irrigation ditches in field Flood irrigation
63rd / Nelson Rd.
BS-092 Bldr Cnty – Irrigated field Flood irrigation
95th / Oxford Rd.
BN-051 Bldr Cnty Marsh / Pond Riparian wetland
Hwy 119 / Airport Rd.
BS-019 Bldr Cnty Cattail marsh Riparian wetland
St. Vrain ck / 119th(w)
116

BS-192 Bldr Cnty Irrigation storage pond Flood irrigation
Jasper Rd. / 109th
Table 2 is a summary of the site inspection history for the chosen sites during the 1999 through 2001 period.
TABLE 2. Site Inspection Record Site # Inspections Wet Larvae Present BR-033 29 28 6
LK-036 39 24 2
TH-056 37 30 14
WE-081 39 38 15
WE-086 37 36 19
BN-032 37 34 20
BS-092 33 33 23
BN-051 34 31 3
BS-019 20 17 12
BS-057 39 37 21
TABLE 3. BMP / Non-BMP Comparison Site Type # Insp / Avg.Season Total Wet With Larvae % Positive BMP 181 12 136 56 41
Non-BMP 163 11 142 79 56
RESULTS Mosquito production from BMPs is not only possible, but is the norm. In urban / suburban areas along the Front Rang of Colorado, BMPs are the primary source of larval development habitat for vector mosquitoes. As BMPs continue to proliferate in new developments, the overall mosquito populations will increase, and human health risks from mosquito vectored diseases will increase. Discussion A variety of actions can reduce the potential of BMPs to produce mosquitoes capable of vectoring WNV. First and most important is to eliminate the standing water from BMPs not designed to have permanent areas of standing water. Improved maintenance would solve the mosquito problem at many existing sites. Simple actions like weekly trash and vegetation removal from concrete channels to improve water flow would eliminate the stagnant water that produces mosquitoes. Removing grass clippings when turf in BMPs is mowed would significantly reduce clogging and organic buildup (both important factors in the production of vector mosquitoes). Completely removing sediment or other
117

obstructions from the BMP when concrete low flow waterways are cleaned would prevent rapid recurrence of the problem.
Altering the amount and timing of turf irrigation in BMPs would be a significant step toward stopping mosquito production. In a semi-arid environment like that of the Front Range, changing from a little water every night to less frequent watering with larger amounts of water would not only eliminate the standing water, but would improve the health of the turf. Filling in holes created by stormwater runoff in areas adjacent to concrete culvert structures would significantly reduce the number of mosquito breeding sites at BMPs. Periodic aeration and sanding of sand filters (much like a golf course green) would prevent clogging with silt, and allow the filter to drain as it is designed to do.
Since it is unlikely that non stormwater runoff entering BMPs can be eliminated, altering the design or placement of other BMPs would help reduce mosquito production. Changing from a rip rap channel to a series of offset concrete or gravel tube baffles in a concrete race to slow runoff and prevent erosion will eliminate most of the pockets that hold water and produce mosquitoes during the summer season. Utilizing a flow through design wetlands channel will dramatically reduce mosquito production when compared to a constructed wetland or retention pond. Sand filter BMPs seem to hold water longer than intended, possibly because non stormwater runoff or high clay content in underlying soils were not considered in the design and construction of the BMP.
Stormwater managers need to keep local health departments and / or mosquito control personnel informed about the location of new BMPs so that they can be included in existing inspection and larvaciding programs. Designing BMPs so that mosquito control personnel have relatively easy access to work on the site is also very important. If we know where the problems are and have access to them, we can control the mosquitoes coming from the sites.
Several papers I looked at in researching BMPs and mosquitoes indicate that mosquito eating minnows are an excellent mosquito control option for BMPs. It is true that Gambusia affinis (gambusia) are very efficient at controlling mosquito larvae under some conditions. Unfortunately, these fish are an introduced species that can have significant detrimental impacts on indigenous species. They should not be used in any situation where they can escape into ditches, streams, rivers, or lakes. At the present time it is unlawful to use gambusia in any BMP west of the Continental Divide because they conflict with provisions of the ESA protecting several threatened or endangered fish species found in the Colorado River system. It is expected that in the near future, it will be illegal to stock gambusia in waters in eastern Colorado as well. There are no indigenous fish species in the Colorado River System that are appropriate for mosquito control, and native fish species in eastern Colorado that theoretically would be effective at controlling mosquito larvae present ESA and other problems of their own.
Many other factors like habitat changes for birds associated with urbanization and the planting of trees in areas formerly devoid of trees affect the potential for WNV moving into an area because they provided habitat for a more diverse avian community. Birds are the reservoir for WNV and other encephalitis viruses. Because there is a large diverse bird community in close proximity to people, and vector mosquito species, there is an increased risk of WNV infection in humans.
118

WNV is not the most serious exotic mosquito vectored disease capable of moving into the United States from abroad. In the future, introduced diseases will pose a threat to the health of humans and domestic animals. Historically mosquito vectored diseases have had a major impact on the people of the United States (US). Malaria, Dengue Fever, Yellow Fever, Eastern Equine Encephalitis, Western Equine Encephalitis, California Group Encephalitis and others have been controlled in the US through mosquito control efforts. BMPs in general are a step back in terms of mosquito control and preventing the diseases associated with mosquitoes.
One option that has potential to significantly reduce mosquito production from BMPs in new developments is to not build them.
Environmental mitigation credit banking is modeled after the pollution credit system established to meet overall pollution discharge limits established in the National Environmental Policy Act (NEPA). A pollution credit is essentially a set portion of the total amount of a pollutant that the government will allow to enter the environment. By trading pollution credits, low discharging entities are able to sell their unused credits to higher polluting entities. This approach allows overall environmental goals to be met and encourages development of new pollution control strategies and technologies without hurting entities through command and control regulations. Through the mitigation credit program currently used in Colorado and a number of other states, it may be feasible to decrease BMP usage in urbanized areas through expansion of the credit trading program while remaining in compliance with federal laws.
In terms of stormwater mitigation; a group of towns or developments might work together to finance a beneficial project – like a water treatment facility for irrigation tail-waters entering the Blue River in a kokanee salmon spawning area. The benefit to those participating in building the facility would be environmental credits that could be traded for an easing of regulations in some less critical habitat area where new developments are generating stormwater runoff problems, like the area of the South Platte River downstream from the Denver waste water treatment facility. The benefit to the general public would be fewer BMPs, decreased risk of mosquito vectored disease, and improvement of a valuable habitat resource. This approach has been used in Washington State to protect critical salmon spawning habitats. A detailed discussion of Environmental credit banking for stormwater runoff can be found in: Final Report to the Washington State Legislature. Washington Stormwater Management Study. Appendix J. Washington State Department of Ecology and Washington State Department of Transportation. 2001.
Dealing the health of the environment and the health of the human population are complex problems that do not lend themselves to simple solutions. Stormwater managers and public health professionals need to work more closely to find creative solutions to current problems, and avoid more serious problems in the future. Including a section on mosquito control at this conference is a step in that direction.
119

REFERENCES
Marco E. Metzger, et. al. 2002. The Dark Side of Stormwater Management: Vectors associated with Structural BMPs. Stormwater. Forester Comm., Inc. 27 September 2002.
1Tim Howard has a masters degree in Environmental Science and a bachelors degree in Wildlife Biology from Colorado State University. Tim is the Operations Manager for Colorado Mosquito Control’s Main office and provides oversight for its Cortez Field Office. Tim has 14 years experience in field biology and research including wildlife and fisheries management, environmental toxicology, and mosquito and vector surveillance and control. Mosquito experience includes conducting and supervising operational research, establishing and managing new IPM control programs in urban and rural areas. Tim is a member of the American Mosquito Control Association and the West Central Mosquito Control Association. Tim has been a Licensed Qualified Supervisor through the Colorado Department of Agriculture for Aquatic Pest, Outdoor Vertebrate Pest, and Public Health Pest Control since 1992.
120

PERSPECTIVE ON STORMWATER QUALITY FROM THE CITY OF FORT COLLINS
Kevin McBride1
City of Fort Collins, Stormwater Utilities Fort Collins, Colorado
First, I’d like to make it clear that this talk comes from an engineer who has spent the last eleven years working in stormwater quality management for the City of Fort Collins. So I am a colleague of yours not a political representative of Fort Collins. I don’t say this just to protect my job mind you; I say this because I’m confused about perspective. I hope that the last eleven years has given me some experienced confusion and that I can effectively share my confusion with you. In the end I have some ideas about how we can all become a little less confused about this topic of urban runoff and perspective. When offered the opportunity to give this perspective, I immediately went to the dictionary (Webster’s) to look up perspective. the definition was: Perspective: 1. The technique or process of viewing or representing on a plane or curved surface the
spatial relation of objects as they might appear to the eye. 2. a: The interrelationship in which a subject or its parts are viewed mentally: b. The
capacity to view things in their true relations or relative importance. We’ll look at this definition of perspective as it relates to Fort Collins and stormwater quality.
Initially, it might seem that
this first definition was not the perspective that was in mind for this conference. However, it may be that viewing some spatial relationships might be very important to this topic. Figure 1 shows the spatial relationships of several rivers along the Front Range of particular importance to Fort Collins. Shown are the watersheds of the Colorado Big Thompson Project (CBT) and the Cache la Poudre River. The Poudre, as it’s usually referred to, along withFigure 1. The CBT and Cache la Poudre Watersheds Figure 1. The CBT and Cache La Poudre watershed.
the CBT are the drinking
121

water supply sources for Fort Collins. The Poudre is the final “receiving water” for our stormwater runoff. We’ll get back to this perspective later. The second definition of perspective has two parts. First: 2a: The interrelationship in which a subject or its parts are viewed mentally: What “viewed mentally” meant to us was understanding. In this case understanding the relationships between the rainfall runoff process and urban watersheds. When the Stormwater Utility worked with City Council and their appointed boards and commissions to develop a stormwater quality policy this was exactly what we sought, understanding. We examined the spatial characteristics of the watershed, described the relationships and proposed a program. We needed both direction and funding to implement a program, and we were not going to get this without some understanding. We had to work on our own understanding too and look at what related policies had been adopted. City Council had adopted what was called the “Framework for Environmental Action” in early 1990’s. That framework identified stormwater quality as
an issue to be addressed and the Stormwater Utility as the lead agency. There was also a Natural Areas Policy Plan that spoke in visionary terms about “natural areas incorporated into the fabric of the community” and the like. Eventually our discussions led to the adoption of “A Watershed Approach to Stormwater Quality” in 1995. Figure 2 shows three spatial characteristics of a watershed and the goal that was adopted for each of them. The spatial characteristics are; land,
trtr Aptotow Im2a Tb
Figure 2: The Watershed Approach to Stormwater
ibutaries, and receiving waters and the goals are pollution prevention, stormwater eatment and habitat protection and restoration, respectively.
doption of this approach gave us the political will and ability to fund education rograms, to include BMP’s as requirements in new developments, and for moving ward more ecologically sensitive designs for channel projects. Viewing the parts gether gave us a common perspective for stormwater quality management. At least ith the City Council at that time.
plementing programs brings up Webster’s last of the definitions of perspective. b. The capacity to view things in their true relations or relative importance (emphasis dded).
hose of you working for governments or with diverse publics, particularly in times of udget shortfalls, know that “truth” with respect to the relative importance of things is
122

hard to come by. Most of us have the experience that this “relative importance” issue runs the whole gamut. Since urban planning seeks to balance these issues we looked for perspective there. Figure 3 shows the City of Fort Collins’ “Structure Plan”, which is a component of its land use plan.
Figure 3. Fort Collins’ Structure Plan
You can make out the Cache la Poudre River Running through town and several of its tributaries also. There is a generally accepted perception that these receiving waters are worth protecting. Yet, the effort that should be put forth is not generally understood. Builders, developers, restaurants, carpet cleaners, pet owners, transportation providers, parks maintenance supervisors, NRDC lawyers, people living in the flood plain, growth control advocates, and stormwater quality engineers have differing perspectives. Of course all of these perspectives are valid, if not completely integrated. There are a lot of colors on the map and they are all in the watershed where we are implementing stormwater programs. No wonder there is some confusion.
How will we develop a more consistent perspective? Will it be through the “Public Involvement” minimum measure in the stormwater permits? I think that will help but perspective is a difficult thing to mandate and I wouldn’t suggest it as a measurable goal. However, I will advocate that a more consistent perspective is exactly what we need to be working towards. The mechanism, I think, needs to be the watershed and more accurately, groups organized around the watershed. These groups must include engineers, planners, scientists, environmental activists, water users, and politicians. They will be most effective if they are nested inside each other just like watersheds and take into account what is the same and what is different in the watershed. Attempting to put the same practices in place in all urban areas makes some sense. All urban areas have much the same characteristics. The same asphalt with the same makes of cars driving to the same restaurants with the same paint on their outside walls, all exposed to stormwater. The six minimum measures make sense. However, the streams that different cities stormwater systems drain to are wildly different. From high mountain trout streams to the lower Color Red River, the BMP’s we use may require some different emphasis to be effective. That brings me back to the three-part definition of perspective and working in Fort Collins. I hope my perspective grows to include more of the spatial characteristics of the watershed where I work, a good view of the interrelationships there, and a better idea of the “truth” of stormwater quality (at least from a technical standpoint). I can tell you that one of my main goals working in the City of Fort Collins is to learn more about how our
123

stormwater runoff affects our local streams and the Cache la Poudre River. First I hope to be part of developing a broader perspective of the role of stormwater management within the larger watershed context of the Cache la Poudre River. After that the Platte River Basin, maybe even the Missouri River Basin. Being part of a larger watershed group would include more interactions with our neighbors in Greeley since it’s at the confluence of the Poudre and the Platte. Also with neighbors in Loveland since the Big Thompson is also a tributary of the Platte. Our final perspective will hopefully include an answer to the question “what does the watershed need to provide what citizens want?” Additionally a process to keep perspective will be important too. Perspectives change showing again the need for functioning watershed groups. Yes, this is going to mean a greater understanding of our structural BMP’s and a whole lot more. 1Kevin McBride received his bachelors degree from C.S.U. in Watershed Sciences in 1979 and M.S. in 1996. He is a registered professional engineer in the State of Colorado and is currently employed by the City of Fort Collins Utilities where he is in charge of developing and implementing their stormwater quality program. He sits on the State of Colorado Non-point Source Council representing CASFM.
124