expecting greater in- and outbound flows - cushman & wakefield · expecting greater in- and...
TRANSCRIPT

Investment Market Update Nordics Q2 2014
Expecting greater in- and outbound flows
DTZ Research
17 September 2014
Contents
Economic context 2
Investment volume 3
Source of capital 4
Investor type 6
Property type 7
Yield trends 8
Outlook 9
Authors
Karin Witalis
Head of Research, DTZ Sweden
+ 46 (0)8 671 34 26
Kasia Sielewicz
Capital Markets Research
+44 (0)20 3296 2322 [email protected]
Contacts
Magali Marton
Head of EMEA Research
+ 33 (0)1 4964 4954
Nigel Almond
Head of Capital Markets Research
+44 (0) 20 3296 2328
Hans Vrensen
Global Head of Research
+ 44 (0)20 3296 2159
Nordic commercial real estate investment in Q2 2014 increased to EUR3.5bn, up by 6% compared to Q1. On an annual basis volumes are marginally lower.
Growth in Q2 was not uniform across the Nordic markets. We saw strong investment activity in Finland with sales hitting a record EUR1.5bn, while sales in Sweden halved to EUR1.0bn across core commercial sectors.
Industrial assets registered a record level of investments, increasing five-fold in Q2 to EUR1.2bn as investors turned to more higher yielding assets. Office sales were on the other hand weakest since Q2 2010 reflecting high prices in some markets.
The proportion of domestic investments remains substantial reaching 84% in Q2 2014. However on net basis domestic investors became net sellers. So far, activity from foreign investors across the Nordics remains fairly limited on the buy side. On the other hand, Nordic cross border investors remained net buyers in Q2.
We see more Nordic investors, led by institutional capital, increase their exposure outside their home region as the need for diversification and better risk return reward grows. This follows strong activity in 2012/13 (Figure 1). To achieve this they will have to release stock in their home markets. Early signs of this trend are emerging with Nordic institutions net sellers in H1 2014.
With many of the Nordic markets still attractively priced and relatively liquid, non European investors should take a closer look at the region. Over EUR18bn of newly raised capital is now targeting the region. As such, despite the slow first half of this year we would expect the full year volumes to come in at above the 10-year average in both 2014 and 2015.
Figure 1
Global Nordic cross border activity by region, EUR bn
Source: DTZ Research, Real Capital Analytics
0
2
4
6
2009 2010 2011 2012 2013 H1 2014
Nordics Europe North America Asia Pacific

Nordics Q2 2014
www.dtz.com
Investment Market Update 2
Economic context
Nordics to outperform the Eurozone
All the Nordic economies are expected to gradually improve over the coming years. Performance is likely to be strongest in Sweden, followed by Denmark and Norway (Figure2). Sweden’s economy is currently supported by strong domestic demand. The labour market is gradually strengthening but exports are likely to remain weak in the near term. In Norway a stronger external environment should result in a steady pace of expansion over the next few years. Mainland GDP growth is forecast to pick up to 2.4% in 2015. However, weakness in the petroleum sector means that overall GDP is likely to rise by a more modest 1.9% in 2015. After five years of broadly flat consumer spending in Denmark, indicators now signal continued improvement. Next year, when both domestic and external conditions improve further, GDP growth should pick up to 2.1%. In Finland deep structural problems are likely to mean another year with negative growth in 2014. However momentum should then return and in 2015 the Finnish economy is likely to expand in line with the Eurozone average.
Bond yields has continued to decline
Although the Nordic economies have continued to improve bond yields have declined during the first half of the year (Figure 3). One explanation is the continued very low policy rates. Low inflation pressure and a complex macro risk environment are other factors. As economic growth strengthens, interest rates and bond yields will eventually rise. This in turn will increase the required return on property and reduce its relative attractiveness. However, the speed of this process depends on a number of factors and is hard to forecast.
Property market risk approaching pre-crisis lows
As investors are becoming increasingly less risk averse they are getting much more willing to move up the risk curve. This can be seen in all asset classes, with the Vix Index, a measure of volatility in the US equity market, approaching pre-2007 levels, and the spread between Eurozone composite AA corporate bond yields and German government bond yields falling for the eleventh quarter in a row. This has resulted in our risk multiplier, which gauges the risk of investment in property, falling to its lowest level since 2006 (Figure 4).
Figure 2
GDP annual growth
Source: Oxford Economics
Figure 3
5 year bond yields
Source: Bloomberg
Figure 4
DTZ European risk multiplier
Source: DTZ Research
-2%
0%
2%
4%
2012 2013 2014F 2015F 2016F
Denmark Finland Sweden
Eurozone Norway
0%
1%
2%
3%
4%
Denmark Finland Norway Sweden
0
1
2
3
0
10
20
30
40
50
60
70
Vix Index DTZ Risk Multiplier (RHS)

Nordics Q2 2014
www.dtz.com
Investment Market Update 3
Investment volume
Weaker sales pushed by less activity in Sweden
After 2009 when the financial crisis hit most of the world, the Nordics experienced a tremendous rebound in investment volumes, reaching a peak of EUR7.4bn in Q4 2012 (Figure 5). Since then quarterly activity has stabilised. Sales of commercial real estate (excluding hotels and residential transactions) reached EUR3.5bn across the Nordics in Q2 2014, up by 6% on Q1 but down by 6% on Q2 2013.The rolling annual total reached EUR14bn, the lowest level since the start of 2011 indicating a downward trend. Sweden recorded the largest slowdown with sales volumes halving (-48%) to EUR1bn in Q2 on Q1 2014 as investors shifted focus from offices to residential and hotel assets, sectors that are not covered in our analysis. In Finland, Q2 activity hit a record high EUR1.5bn driven by sales of several industrial portfolios. Activity in Norway was up by 14% to EUR0.7bn in Q2 on Q1, but was only half the level compared to Q2 last year. Activity in Denmark more than doubled to EUR0.3bn in Q2 pushed by foreign acquisition of retail assets.
Property sales across capital cities dropped in Q2
All capital cities except Copenhagen experienced a drop in investment activity between Q1 and Q2 2014 resulting in a widening of the gap between the capital city and the rest of the country. This drop in activity across capital cities was driven by the lack of suitable products, resulting in fewer transactions. Demand remains strong but buyers have to look outside the core markets in order to deploy capital and achieve their target returns. The share of investments outside the capital cities increased to 70% in Q2 from 50% in Q1 (Figure 6).
Average deal size flat
The average lot size across the Nordic region has been stable but down from 2012 level at EUR26m in Q2 (Figure 7). Deals with price tags between EUR100-500m were most common during the quarter and accounted for 42% of all deals, up from 34% in Q1. Another 39% of capital was allocated within the EUR20-100m range. The remaining deals were under EUR20m. This reflects a steady supply of medium sized deal but also lack of big ticket deals as investors adopt hold strategy. As such there were no deals above EUR500m taking place since Q3 2014.
Figure 5
Nordic investment volume, EUR bn
Source: DTZ Research
Figure 6
Nordic investment activity by location, EUR bn
Source: DTZ Research
Figure 7
Nordic investment activity by lot size, EUR m
Source: DTZ Research
0
10
20
30
0
2
4
6
8
Q1 2012
Q2 2012
Q3 2012
Q4 2012
Q1 2013
Q2 2013
Q3 2013
Q4 2013
Q1 2014
Q2 2014
Denmark FinlandNorway SwedenRolling annual (RHS)
0%
20%
40%
60%
80%
100%
Q1 2012
Q2 2012
Q3 2012
Q4 2012
Q1 2013
Q2 2013
Q3 2013
Q4 2013
Q1 2014
Q2 2014
Rest of country Capital city
0
20
40
60
0%
20%
40%
60%
80%
100%
Under 20m 20-100m100-500m Above 500Average size (RHS)
Nordics Q2 2014
www.dtz.com
Investment Market Update 4
Source of capital
Nordic cross border capital increase exposure in the region
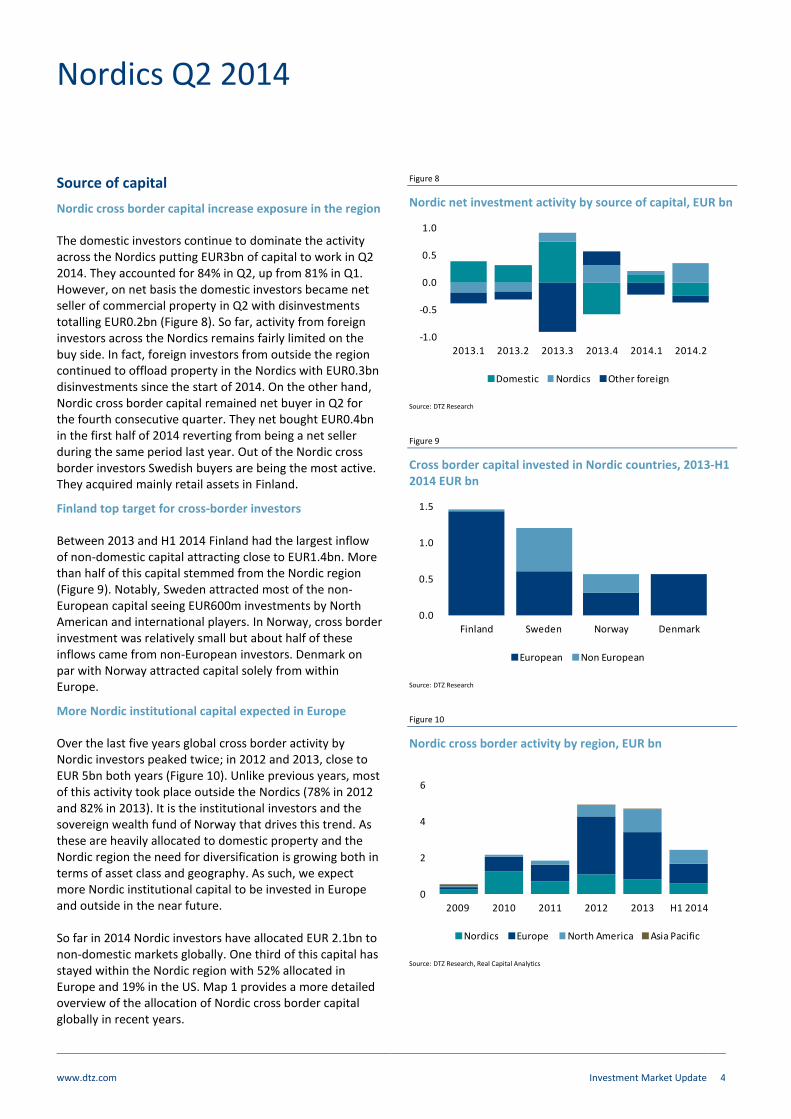
The domestic investors continue to dominate the activity across the Nordics putting EUR3bn of capital to work in Q2 2014. They accounted for 84% in Q2, up from 81% in Q1. However, on net basis the domestic investors became net seller of commercial property in Q2 with disinvestments totalling EUR0.2bn (Figure 8). So far, activity from foreign investors across the Nordics remains fairly limited on the buy side. In fact, foreign investors from outside the region continued to offload property in the Nordics with EUR0.3bn disinvestments since the start of 2014. On the other hand, Nordic cross border capital remained net buyer in Q2 for the fourth consecutive quarter. They net bought EUR0.4bn in the first half of 2014 reverting from being a net seller during the same period last year. Out of the Nordic cross border investors Swedish buyers are being the most active. They acquired mainly retail assets in Finland.
Finland top target for cross-border investors
Between 2013 and H1 2014 Finland had the largest inflow of non-domestic capital attracting close to EUR1.4bn. More than half of this capital stemmed from the Nordic region (Figure 9). Notably, Sweden attracted most of the non-European capital seeing EUR600m investments by North American and international players. In Norway, cross border investment was relatively small but about half of these inflows came from non-European investors. Denmark on par with Norway attracted capital solely from within Europe.
More Nordic institutional capital expected in Europe
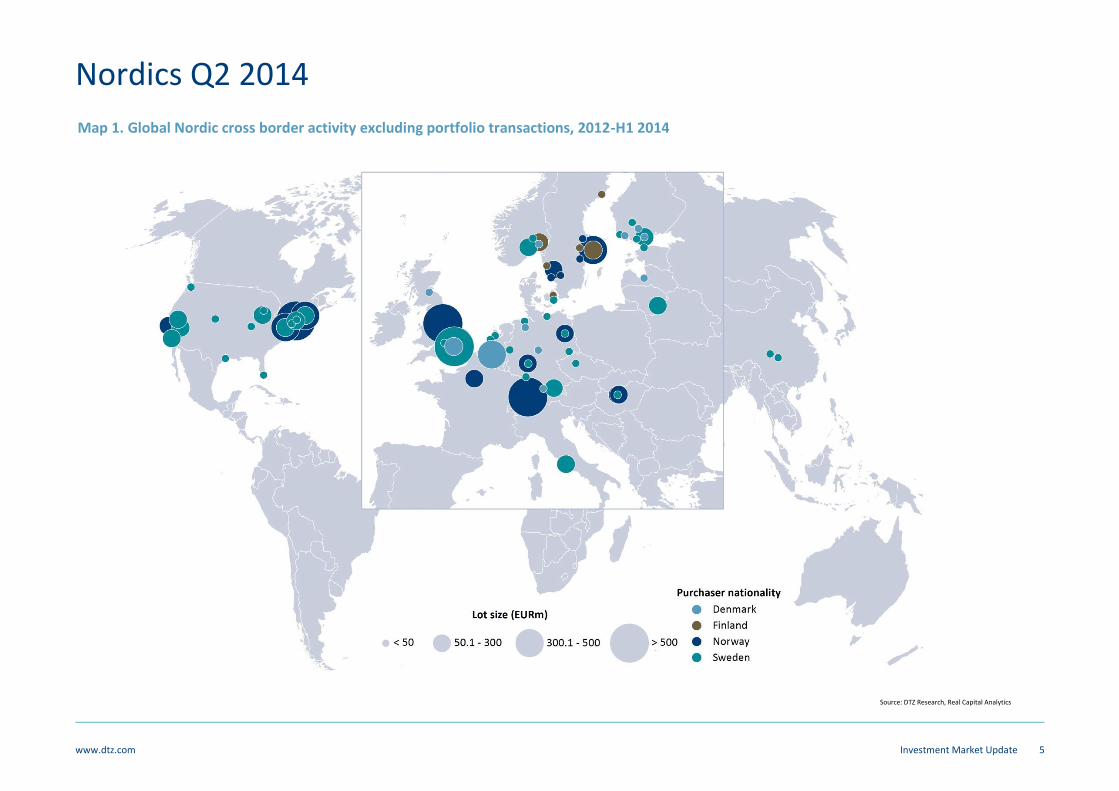
Over the last five years global cross border activity by Nordic investors peaked twice; in 2012 and 2013, close to EUR 5bn both years (Figure 10). Unlike previous years, most of this activity took place outside the Nordics (78% in 2012 and 82% in 2013). It is the institutional investors and the sovereign wealth fund of Norway that drives this trend. As these are heavily allocated to domestic property and the Nordic region the need for diversification is growing both in terms of asset class and geography. As such, we expect more Nordic institutional capital to be invested in Europe and outside in the near future. So far in 2014 Nordic investors have allocated EUR 2.1bn to non-domestic markets globally. One third of this capital has stayed within the Nordic region with 52% allocated in Europe and 19% in the US. Map 1 provides a more detailed overview of the allocation of Nordic cross border capital globally in recent years.
Figure 8
Nordic net investment activity by source of capital, EUR bn
Source: DTZ Research
Figure 9
Cross border capital invested in Nordic countries, 2013-H1 2014 EUR bn
Source: DTZ Research
Figure 10
Nordic cross border activity by region, EUR bn
Source: DTZ Research, Real Capital Analytics
-1.0
-0.5
0.0
0.5
1.0
2013.1 2013.2 2013.3 2013.4 2014.1 2014.2
Domestic Nordics Other foreign
0.0
0.5
1.0
1.5
Finland Sweden Norway Denmark
European Non European
0
2
4
6
2009 2010 2011 2012 2013 H1 2014
Nordics Europe North America Asia Pacific
Nordics Q2 2014
www.dtz.com
Investment Market Update 5
Source: DTZ Research, Real Capital Analytics
Map 1. Global Nordic cross border activity excluding portfolio transactions, 2012-H1 2014

Nordics Q2 2014
www.dtz.com
Investment Market Update 6
Investor type
Private companies and funds most active buyers
Since the start of 2013, investment activity by institutions has decreased (Figure 11). From Q1 2013 to Q2 2014 this group’s relative share has fallen from 22% to 1%. Institutions have been investing heavily in residential property, which is not included in this analysis. This is one explanation to the drop. Investment activity by private property companies has varied over the period, both in terms of absolute amount and relative share. In Q2 2014 they became the most active investor group both in absolute (EUR 1.8bn) and relative terms (53%). Property funds accounted for 22% of the total amount invested in Q2. This is lower than in Q4 2013 when funds invested EUR 1.7bn, representing 37% of the total that quarter. The listed sector was the most active group in Q3 2013 with EUR 1.3bn invested capital, 41% of the total. Last quarter their share was down to only EUR0.4bn, representing 10% of the total.
All investors net sell except private companies
On net basis (purchases less sales) we see some different trends. In Q2 2014 all investor groups except private property companies and private investors were net sellers (Figure 12). Combined private sector bought on net basis EUR1.3bn in Q2. But the bulk of this strong performance was due to portfolio purchases of industrial property in Finland. After a strong finish in 2013 funds became less active buyers in the first half of 2014, becoming net sellers but by relatively small amount. Notably, Nordic institutions were the largest net sellers offloading EUR0.9bn of commercial property since the start of the year.
Institutions grab Nordic healthcare assets
During H1 2014 there has been a strong demand for almost all types of property in the Nordic region. However there are variations in preferred sectors between the investor groups as they all have their individual return target and willingness to take on risk. Institutions have been heavily investing in healthcare property whereas funds and corporate have preferred offices (Figure 13). The listed sector has invested in mixed use properties while private property companies and investors have invested most capital in offices and industrial property.
Figure 11
Nordic investment activity by investor type, EUR bn
Source: DTZ Research
Figure 12
Net investment in Nordics by investor type, EUR bn
Source: DTZ Research
Figure 13
Nordic investment activity by investor and asset type, H1 2014
Source: DTZ Research
0
2
4
6
Q1 2013 Q2 2013 Q3 2013 Q4 2013 Q1 2014 Q2 2014
Developer/Private Company FundListed Sector InstitutionOther
-1.5
-1.0
-0.5
0.0
0.5
1.0
1.5
Private company/ Investor
Fund Listed sector Institution
Q2 2013 Q3 2013 Q4 2013 Q1 2014 Q2 2014
0% 50% 100%
Institution
Listed Sector
Private …
Corporate
Fund
Office Retail Industrial Mixed Use Healthcare Other

Nordics Q2 2014
www.dtz.com
Investment Market Update 7
Property type
Industrial assets dominated activity in Q2
For a long time offices have been the most sought-after asset type among investors in the Nordic markets. Over the period Q1 2013 –Q2 2014 offices stood for an aggregated EUR8.2bn investment. Notably, in Q2 office sales halved compared to a year ago driven by fewer larger sized deals in Sweden as well as growing concerns about asset overpricing in core markets (Figure 14). Retail has been experiencing large variations in its relative share over the period Q1 2013-Q2 2014, while demand for industrial properties has been growing. In Q2 the industrial sector recorded the biggest increase in activity, five folding to EUR1.2bn compared to Q1. This activity was boosted by several portfolio sales in Finland. With currently attractive pricing and strong investors demand for higher yielding assets we would expect the industrial sector to retain this activity momentum. The mixed use market share was consistent with the historical average figures in Q2 2014.
Mixed asset allocation across Nordic markets
Looking by aggregated deal volume by property types across the Nordic countries reveal market diversity. Office property dominates activity in Norway, accounting for 46% of the total volume both in H1 2013 and H1 2014 (Figure 15). The second largest property types in Norway are retail and mixed use. Office is also the largest sector in Sweden accounting for just below 40% both in H1 2013 and H1 2014. Mixed use has increased its share in 2014 while the interest for industrial has come down. In Finland industrial’s share has gone from 8% in H1 2013 to 55% in H1 2014. All other sectors have experienced falling percentages over the last year. In Denmark retail remains the most sought after product at 39% in H1 2014 but less so than in H1 2013. Offices have gone from 18% to 30%.
Shopping centre and warehouse most popular
Within the retail segment shopping centres followed by supermarkets and retail parks/warehouses have been the largest sub sectors in H1 2014. We see increasing interest towards supermarkets reflecting the relative positive trading and income stream from these assets (Figure 16). Looking at the industrial segment warehouses stood for the largest percentage share followed by distribution warehouses.
Figure 14
Investment in Nordics by asset type
Source: DTZ Research
Figure 15
Investment by asset type and country
Source: DTZ Research
Figure 16
Retail and industrial activity by use, H1 2014
Source: DTZ Research
0
1
2
3
4
5
Q1 2013 Q2 2013 Q3 2013 Q4 2013 Q1 2014 Q2 2014
Office Retail Industrial Mixed Use Other
0%
20%
40%
60%
80%
100%
Office Retail Industrial Mixed Use Other
H1 2013 H1 2014
0%
20%
40%
60%
80%
100%
Retail Industrial
OtherOther
Superstore
Retail Park/Warehouse
Supermarket
ShoppingCentre
Shop
Warehouse
DistributionWarehouse
Prod. space

Nordics Q2 2014
www.dtz.com
Investment Market Update 8
Yield trends
Office yields close to record lows
Continued demand and improved market activity, particularly for core assets has led to further yield compression in a number of markets. Helsinki, Oslo and Stockholm are all closing on, or at, their lowest points that were hit before the financial crisis (Figure 17). The prime office yield level in Stockholm is currently standing at 4.45%, only 20 basis points above its lowest level in 2007 and is still on a downward trend. Since mid 2007 Stockholm has had the lowest yield level among the four Nordic capitals. Yields have recently come down in Helsinki and Oslo as well, both standing at 5.00% at the moment. Oslo is now only 25 basis points above its lowest level in Q4 2007 and Helsinki is currently at its lowest which was reached in Q2 2007. In Copenhagen yields have remained stable at 5.00% since Q1 2012. Yields stood as low as 4.00% in Q4 2006.
Oslo has been the most volatile market
Over the last eight years, Oslo has been the most volatile office market in the Nordics, with yields moving in a range of 200 basis points (Figure 18). By contrast Helsinki has been the least volatile, experiencing only 100 basis points range. Most scope for compression in offices can be found in Copenhagen with yields currently standing 100 basis points from its record lows in Q2 2006. In Stockholm yields have varied between 4.25% and 5.40% over the last eight years. This makes Stockholm the second least volatile market among the four Nordic capitals.
Gap is narrowing between high and low yield assets
As confidence builds throughout the Nordic region, investors are continuing the trend of ‘moving up the risk curve’ and focusing more attention on non-core markets and assets. This is reflected in a narrowing gap between prime and secondary yields. The gap has been gradually narrowing since Q4 2011 (Figure 19).
Figure 17
Prime office yields in Nordics
Source: DTZ Research
Figure 18
Prime office yields in Q2 2014 – changes 2006-Q2 2014
Source: DTZ Research
Figure 19
Nordic property transaction yield analysis (all property)
Source: DTZ Research
4%
5%
6%
7%
8%
Copenhagen Helsinki Oslo Stockholm
4%
5%
6%
7%
Copenhagen Helsinki Oslo Stockholm
0
2
4
6
8
10
12
14
Gap Lower quartile Upper quartile

Nordics Q2 2014
www.dtz.com
Investment Market Update 9
Outlook
EUR16.5bn of investment expected for 2015
Overall the Nordic markets remain attractively priced and relatively liquid compared to some of their European peers. Our DTZ Fair Value Index
TM shows that all markets covered
in our analysis are classified as hot or warm in the Nordics in Q2 2014 (Figure 20). Combined with favourable long term demographics, this gives the region an advantage and good value propositions for investors going forward. The weight of capital targeting the Nordics also remains substantial. According to our latest Great Wall of Money 1research over EUR18bn of newly raised capital will be
targeting the region over the next two years and represents an increase on estimates a year previous. Despite a slow start to 2014, we expect to see a pick up in the second half of the year and into 2015. We anticipate the full year volumes to come in at above the 10-year average in both 2014 and 2015. Our investment volume forecast for the Nordic region currently stands at EUR 16.0bn in 2014 and EUR 16.5bn in 2015 (Figure 21). We expect investment activity to continue to be driven by the domestic investors for now. However, we should see gradually more investments by cross-border investors from outside the Nordics as investors search for new diversification opportunities and better risk-return reward. As elsewhere in Europe, the lack of suitable product and pricing remain a concern. But rebalancing of portfolios by Nordic institutions towards a greater share of overseas assets might help out as they might be less active on the buy side in their home markets and region. We have already started to see early signs of this trend as Nordic institutions have been net sellers of commercial property since the start of the year.
Figure 20
DTZ Fair ValueTM
scores, Nordics, Q2 2014
Source: DTZ Research
Figure 21
Nordic investment volume forecast, EUR bn
Source: DTZ Research
1DTZ Great Wall of Money, March 2014
9 1 22
9
6 37 4
1
19 4
37
8 71 6
65
11 471
79 76 73 100 92 64 60 76
0%
20%
40%
60%
80%
100%
Cold Warm Hot
0
5
10
15
20
25
Current Forecast
Average (2004-2014)
Nordics Q2 2014
www.dtz.com
Investment Market Update 10
Other DTZ Research Reports Other research reports can be downloaded from www.dtz.com/research. These include:
Occupier Perspective Updates on occupational markets from an occupier perspective, with commentary, analysis, charts and data. Global Occupancy Costs Offices Global Occupancy Costs Logistics Occupier Perspective - User Guide to The Americas Occupier Perspective - User Guide to Asia Pacific Occupier Perspective - User Guide to EMEA Occupier Perspective - Global User Guide Global Office Review India Office Demand and Trends Survey 2013-14 Sweden Computer Games Developers November 2013
Property Times Regular updates on occupational markets from a landlord perspective, with commentary, charts, data and forecasts. Coverage includes Asia Pacific, Baltics, Bangkok, Barcelona, Bengaluru, Berlin, Brisbane, Brussels, Budapest, Central London, Chennai, Chicago, Delhi, East China, Europe, Frankfurt, Geneva, Guangzhou & Central China, Hamburg, Helsinki, Ho Chi Minh City, Hong Kong, Hyderabad, Jakarta, Japan, Kolkata, Kuala Lumpur, Los Angeles, Luxembourg, Lyon, Madrid, Manhattan, Melbourne, Milan, Mumbai, North China, Paris, Poland, Prague, Pune, Rome, San Francisco, Seoul, Singapore, South & West China, Stockholm, Sydney, Taipei, Toronto, Ukraine, UK, Warsaw, Washington.
Investment Market Update Regular updates on investment market activity, with commentary, significant deals, charts, data and forecasts. Coverage includes Asia Pacific, Australia, Belgium, Czech Republic, Europe, France, Germany, Italy, Japan, Mainland China, South East Asia, Spain, Sweden, UK.
Money into Property For more than 35 years, this has been DTZ's flagship research report, analysing invested stock and capital flows into real estate markets across the world. It measures the development and structure of the global investment market. Available for Global, Asia Pacific, Europe, North America and UK.
Foresight Quarterly commentary, analysis and insight into our in-house data forecasts, including the DTZ Fair Value Index™. Available for Global, Asia Pacific, Europe, UK and China. In addition we publish an annual outlook report.
Insight Thematic, ad hoc, topical and thought leading reports on areas and issues of specific interest and relevance to real estate markets. Insight Beijing TMT Office Occupier Survey- June 2014 Insight European Transaction Based Index Q1 2014 Net Debt Funding Gap - May 2014 China Insight Office Pipeline and Dynamics May 2014 Deflation and Commercial Property - March 2014 Tokyo Retail Market 2014 Great Wall of Money – March 2014 German Open Ended Funds – March 2014 China Investment Market Sentiment Survey - January 2014 China The Technology Sector - January 2014 Czech Republic Green buildings - December 2013 UK secondary market pricing - October 2013 Quantitative Easing - UK Regions – September 2013
DTZ Research Data Services
For more detailed data and information, the following are available for subscription. Please contact [email protected] for more information.
Property Market Indicators Time series of commercial and industrial market data in Asia Pacific and Europe.
Real Estate Forecasts, including the DTZ Fair Value Index
TM
Five-year rolling forecasts of commercial and industrial markets in Asia Pacific, Europe and the USA.
Investment Transaction Database Aggregated overview of investment activity in Asia Pacific and Europe.
Money into Property DTZ’s flagship research product for over 35 years providing capital markets data covering capital flows, size, structure, ownership, developments and trends, and findings of annual investor and lender intention surveys.

www.dtz.com Investment Market Update 11
DTZ Research
DTZ Research Contacts
Global Head of Research
Hans Vrensen
Phone: +44 (0)20 3296 2159
Email: [email protected]
Global Head of Forecasting
Fergus Hicks
Phone: +44 (0)20 3296 2307
Email: [email protected]
Head of Capital Markets Research
Nigel Almond
Phone: +44 (0)20 3296 2328
Email: [email protected]
Head of Americas Research
John Wickes
Phone: +1 312 424 8087
Email: [email protected]
Head of EMEA Research
Magali Marton
Phone: +33 (0)1 49 64 49 54
Email: [email protected]
Head of North Asia Research
Andrew Ness
Phone: +852 2507 0779
Email: [email protected]
Head of South East Asia and Australia New Zealand Research
Dominic Brown
Phone: +61 (0)2 8243 9999
Email: [email protected]
Head of Research Sweden
Karin Witalis
Phone: +46 (0)8 671 34 26
Email: [email protected]
DTZ Business Contacts
Denmark
Henrik Lyngskjold
Phone: +45 33 73 45 18
Email: [email protected]
Norway
Jorn Hoistad
Phone: +47 23 11 68 74
Email: [email protected]
Finland
Janne Eriksson
Phone: +358 10 836 8406
Email: [email protected]
Sweden
Fredrik Lidjan
Phone: +46(0)8 671 34 76
Email: [email protected]
Nordic
Agneta Jacobsson
Phone: +46 (0)8 671 34 55
Email: [email protected]
DISCLAIMER
This report should not be relied upon as a basis for entering into transactions without seeking specific, qualified, professional advice. Whilst facts have been rigorously checked, DTZ can take no responsibility for any damage or loss suffered as a result of any inadvertent inaccuracy within this report. Information contained herein should not, in whole or part, be published, reproduced or referred to without prior approval. Any such reproduction should be credited to DTZ.
© DTZ September 2014