expectations for students with cognitive disabilities: is
TRANSCRIPT
Home | About NCEO | Topics | Reports | Presentations | Teleconferences | State Policies | Tools | Accommodations Bibliography | Data Viewer | + LargerFont | Smaller Font
Expectations for Students with Cognitive Disabilities:Is the Cup Half Empty or Half Full? Can the Cup FlowOver?
NCEO Synthesis Report 55
Published by the National Center on Educational Outcomes
Prepared by:
Kevin S. McGrewInstitute for Applied Psychometrics (IAP)
Jeffrey EvansEvans Consulting
December 2004
Any or all portions of this document may be reproduced and distributed without prior permission, provided the source is citedas:
McGrew, K. S., & Evans, J. (2004). Expectations for students with cognitive disabilities: Is the cup half empty or half full? Canthe cup flow over? (Synthesis Report 55). Minneapolis, MN: University of Minnesota, National Center on EducationalOutcomes. Retrieved from the World Wide Web: http://education.umn.edu/NCEO/OnlinePubs/Synthesis55.html
Executive Summary
To make informed decisions about the best instruction and assessments for students with cognitivedisabilities, several questions need to be answered. For instance, how many students with cognitivedisabilities can be expected to achieve the same level of proficiency as other students? To what extentcan we predict who these students are? Can we discern whether a student’s failure to meet proficiencyis due to the student’s disabling condition or lack of appropriate instruction? Finally, what effects doteacher expectations have on student achievement?
This report addresses these questions, and includes an analysis of nationally representative cognitiveand achievement data to illustrate the dangers in making blanket assumptions about appropriateachievement expectations for individuals based on their cognitive ability or diagnostic label. Inaddition, a review of research on the achievement patterns of students with cognitive disabilities andliterature on the effects of teacher expectations is included.
The literature raises numerous issues that are directly relevant to today’s educational context for
students with disabilities in which both the Individuals with Disabilities Education Act (IDEA) andthe No Child Left Behind (NCLB) Act of 2001 are requiring improved performance. Particularly forthose students with cognitive disabilities, the information on expectancy effects should cause us muchconcern. Is it possible that expectancy effects have been holding students back in the past? Are weunder the influence of silently shifting standards, especially for students with cognitive disabilities? Itis anticipated that the information in this report will help guide decisions about appropriately highand realistic academic expectations for students with cognitive disabilities.
Introduction
Over the past 30 years the United States has slowly and steadily clarified the meaning of access to afree and appropriate public education (FAPE) for students with disabilities. Today’s interpretation ofFAPE certainly differs from that of 1975 when the Education for All Handicapped Children Actinitially was passed into law (EHA, 1975), and even from 1990 when the reauthorization of EHAchanged the name to the Individuals with Disabilities Education Act (IDEA, 1990). Case law (e.g.,Board of Education of the Hendrick Hudson Central School District v. Rowley, 1982), subsequentamendments to IDEA, federal regulations, and guidance continue to create expectations about theextent to which students with disabilities are expected to benefit academically from their education.Unfortunately, there is still limited consensus among educators regarding appropriate achievementexpectations for students with disabilities, particularly those with cognitive disabilities.
A concern about low expectations and the need for high expectations was reflected in the IDEA’s 1977Preamble: “Over 20 years of research has demonstrated that the education of children withdisabilities can be made more effective by (A) having high expectations for such children and ensuringtheir access to the general education curriculum to the maximum extent possible . . .” (IDEA, 1997, §601). IDEA 1997 clarified that all students with disabilities are to have access to instruction focusedon the same skills and knowledge as all other students, and that their achievement is to be measuredwith the same district and statewide assessment programs as used for all students (and, adding analternate assessment for those students unable to participate in the general assessment).
The No Child Left Behind (NCLB) Act of 2001 further clarified that schools are to be held accountablefor the adequate yearly progress (AYP) of all groups of students. NCLB specifically requires thedisaggregation of assessment data for specified subgroups, including students with disabilities. Theintended purpose of NCLB is “to ensure that all children have a fair, equal, and significantopportunity to obtain a high quality education and reach, at a minimum, proficiency on challengingState academic achievement standards and state academic assessments” (NCLB, 2001, § 1001). Inother words, the expected educational outcomes for students with disabilities, or for any othersubgroup of students, are the same high expectations held for all students.
Although data show that some students with disabilities are reaching the statedetermined level ofproficiency, many students with disabilities are still far from performing at this level (Thurlow &Wiley, 2004). Students with disabilities participate in proficiency assessments in three primary ways:(1) participation in the general assessment without accommodations, (2) participation in the generalassessment with accommodations, and (3) participation in an alternate assessment. Federalregulations released December 9, 2003 clarified that an alternate assessment could be based onalternate achievement standards for students with significant cognitive disabilities. Alternateassessments could also be based on gradelevel achievement standards. Both types of alternateassessments are to be aligned to content standards appropriate for the student’s grade level ofenrollment.

For NCLB accountability purposes, only up to one percent of all students (approximately nine percentof students with disabilities) can be counted for AYP as proficient or advanced based on alternateachievement standards (with possible exceptions for states or districts if certain conditions are met).Thus, with the exception of students working toward alternate achievement standards, (described inthe December 9, 2003 regulation as those with significant cognitive disabilities), all students withdisabilities are to be held to the same gradelevel achievement standards as their peers withoutdisabilities.
Many educators have grown increasingly concerned about the performance of students with cognitivedisabilities who are appropriately working toward gradelevel achievement standards, but whosecurrent performance is far from a proficient level on gradelevel achievement standards as measuredby current statewide assessments. Considerable controversy surrounds the issue of what can andshould be expected for these students. Some people argue that the vast majority of students withdisabilities, when given appropriate access to high quality curriculum and instruction, can meet orexceed the levels of proficiency currently specified. Many special education advocates believe thatsubscribing to the same high expectations and accountability for student progress will ultimately leadto improved instruction and learning for all students. Others argue that a student’s disability willultimately prevent the student from attaining gradelevel achievement standards, even when providedappropriate instruction and accommodations. This latter group believes that it is unjust to punishschools when these students fail to perform at the proficient level.
The discrepant “expectations” arguments reflect very different perspectives regarding the nature ofcognitive disabilities. These two perspectives have existed for many years. To make informeddecisions about the best instruction and assessments for students with cognitive disabilities, severalquestions need to be answered. For instance, how many students with cognitive disabilities can beexpected to achieve the same level of proficiency as other students? To what extent can we predictwho these students are? Can we discern whether a student’s failure to meet proficiency is due to thestudent’s disabling condition or lack of appropriate instruction? Finally, what effects do teacherexpectations have on student achievement?
This report was prepared to begin to address these issues. It includes an analysis of nationallyrepresentative cognitive and achievement data to illustrate the dangers in making blanketassumptions about appropriate achievement expectations for individuals based on their cognitiveability or diagnostic label. In addition, a review of research on the achievement patterns of studentswith cognitive disabilities and literature on the effects of teacher expectations is included. It isanticipated that the information in this report will help guide decisions about appropriately high andrealistic academic expectations for students with cognitive disabilities.
Overview
Few would argue that the concept of intelligence (IQ), and tests that measure the construct, haveplayed a long and significant role in education, and special education in particular. The use ofpractical IQ tests is typically traced to the beginning of the century when Alfred Binet developed abattery of tasks to help identify children with learning difficulties (Neisser et al., 1996). Binet’s goalwas to develop a means by which to identify struggling students who would then receive remediationvia “mental orthopedics.” Clearly, Binet did not believe that his measure of intelligence quantified aninnate or “fixed” ability. Binet was an optimist who believed that the ability “glasses” of children withlower ability were half full, and that their vessels could be filled further.
In stark contrast to Binet’s optimistic position was that of English psychologist Sir Cyril Burt (1911).

Burt’s work was based on the then popular view that intelligence was a genetically based fixed entity.Burt’s ideas influenced the design of educational systems that segregated children in differenteducational tracks based on ability. According to Burt, “capacity must obviously limit content. It isimpossible for a pint jug to hold more than a pint of milk; and it is equally impossible for a child’seducational attainments to rise higher than his educable capacity permits.” Clearly Binet and Burtviewed the proverbial halffilled glass differently.
A final view, based on the 1994 feelgood movie Forrest Gump, can be considered the “cupoverflowing” perspective. Briefly, this movie portrayed the fictitious life history of Forrest Gump, anindividual who was classified in the mental retardation range early in school. The exchange betweenthe school principal and Forrest’s mother clearly illustrated an educational approach grounded in theBurt philosophy:
School principal: “Your boy’s... different, Miz Gump. His IQ’s 75.”
Ms. Gump: “Well, we’re all different, Mr. Hancock. He might be a bit on the slow side. He’snot going to a special school to retread tires!”
Ms. Gump’s response, and the subsequent string of life achievements of her son Forrest (e.g., starfootball player in college, world class ping pong player, Vietnam war hero, CEO of successful shrimpcompany) reflects the “cup flowing over” perspective on IQ test scores. That is, Forrest’s achievementswere beyond his measured IQ (which was below the average sized “jug” according to Burt).
When faced with students whose classroom performances or achievement test scores surpass theirmeasured (or implicitly estimated) IQ scores by significant amounts, laypersons and professionals(e.g., educators and psychologists) frequently demonstrate an implicit subscription to a Burtphilosophy that a person can achieve only up to his or her level of intelligence when they characterizeGumplike students as “overachievers.” Ms. Gump’s implicit intelligence conception, which wassubsequently manifested in Forrest’s accomplishments, would suggest that there is more to schoollearning than the size of a child’s “IQ cup or jug”—other variables contribute to achievement.
Halffull or halfempty? Filled tothebrim or the cup flowing over? Which intelligencelearningmetaphor is correct? Burt versus Binet/Gump? Who should be believed during the current standardsdriven educational reform fueled by the mantra that “no child shall be left behind” (NCLB), and thatall children should reach grade level standards. More importantly, which philosophy should guideeducational expectations for students whose primary special education classification is tied closely toIQ scores below the normal range (i.e., students with mental retardation or cognitive disabilities)?Should educational expectations for students with cognitive disabilities be grounded in a Burtphilosophy (i.e., expect academic performance and achievement no higher than the student’sestimated cognitive ability), or should expectations be based on the more optimistic Gump philosophy(i.e., it is possible for students with cognitive disabilities to achieve higher than their IQ test score andat grade level)? Is the Gump philosophy (i.e., a child’s IQ cup can overflow) nothing more than aPollyannaish belief based in fiction?
The primary purpose of this paper is to address the formation of appropriate expectations forstudents with cognitive disabilities by exploring the known empirical relations between intelligenceand school achievement. In addition, a review of the research literature on how expectation effects,which are often based on perceptions of student ability and implicit theories of intelligence, caninfluence student performance.
Diversity within Disability Distributions
Probably no environment elicits individual differences sooner in life than formal education. Inclassrooms teachers strive to arrange conditions to elicit optimal performance among a diverse classof unique learners. However, due to the only true “law” in psychology (the law of individualdifferences), optimal learning conditions and techniques are not universal across learners.
This holds true for all learners—those with and without disabilities. It is important that students withdisabilities not be saddled with groupbased stereotyped low academic expectations. Just as thediversity of learning rates for students without disabilities is acknowledged, so it should be forstudents with disabilities. According to the 1997 National Research Council report Educating One &All: Students with Disabilities and StandardsBased Reform, “it is hard to talk about asking studentsin special education to the meet the same standards and outcomes as everyone else without payingattention to their varied characteristics [italics added]” (Olson, 2004, p. 10).
The federally funded Special Education Elementary Longitudinal (SEELS) study, the first evernationally representative longitudinal investigation of elementary students with disabilities (ages 6 to12), recently provided empirical support for the diversity of achievement levels of students withdisabilities. According to the SEELS project director, José Blackorby, the data indicate that “you canfind kids with disabilities who are scoring right near the top—above the 80th percentile—and youyou’ll find some in the middle…and then a lot more kids in the lowest quartile. So it’s heavily weightedtoward the low end but there’s quite a bit of diversity” (Olson, 2004, p. 10). Although students withdisabilities, as a group, tend to achieve in the lower half of the distribution of achievement,“individuals with disabilities can be found across the full range of academic performance” (Olson,2004, p. 10). What accounts for the diversity of learning among students with disabilities, and for thatmatter, among all students?
IQ and Disability: The Misunderstood Common Denominator
Despite their diversity of characteristics, the majority (58%) of students receiving special educationservices under IDEA share a common experience—most have been classified as having a learningdisability or cognitive impairment (mental retardation) with the aid of an intelligence test. Despitemany disputes over competing theoretical conceptualizations of intelligence and the utility ofintelligence test scores, even the most ardent critics recognize that IQ tests “predict certain forms ofachievement—especially school achievement—rather effectively” (Neisser, 1995, p. 96).
Despite a defensible rationale for their early development and continued deployment in the schools(BeirneSmith, Ittenbach, & Patton, 1998), many people have developed inaccurate perceptions of thepower of IQ test scores. Many laypersons, educators, policymakers, and other professionals havedeveloped the inaccurate belief, often reinforced by court decisions (Reschly, 1988), that measuredintelligence is a genetically determined, largely fixed, global, and enduring trait that explains most ofa student’s success (or failure) in school learning. Such a Sir Cyril Burt conceptualization ofintelligence can doom a student to low expectations if his or her IQ score is significantly below thenorm. This fixed entity view of intelligence, summarized in the belief in the predictive power of thesingle global IQ score, represents the mental jug or cup being “halfempty” or “filled to the brim”philosophy. According to this view, to expect more academic achievement than a person’s estimatedor measured IQ score is simply not possible.
A recent Education Week (2004) national survey (Count me in: Special Education in an Era ofStandards) of 800 special and general education teachers suggests that most educators implicitlysubscribe to the Burt IQpotential philosophy. Eightyfour percent of surveyed teachers did not
believe that students in special education should be expected to meet the same set of academicstandards as students without disabilities. In addition, approximately 80% of the teachers felt thatstudents with disabilities should not be included in the same state tests as students in generaleducation, especially if the results are used for accountability purposes (Olson, 2004).
The surprising extent to which educators appear to hold alternative (and typically lower) standardsand expectations for students with disabilities, although appropriate for many of these students, istroubling given the empirical reality of the predictive power of IQ test scores—scores that are often atthe root of lowered expectations. Sir Cyril Burt’s IQfixed potential legacy appears to be alive and wellin America’s schools (albeit not typically adopted maliciously or explicitly articulated).
Fortunately, decades of research on intelligence tests have repeatedly converged on a near unanimousconsensus on the predictive accuracy of IQ test scores (Neisser, 1995). This consensus, which isexplained next, indicates that it is time to “leave the Burt IQpotential philosophy behind.”
Reality of the IQAchievement Relationship: Statistics Made Simple
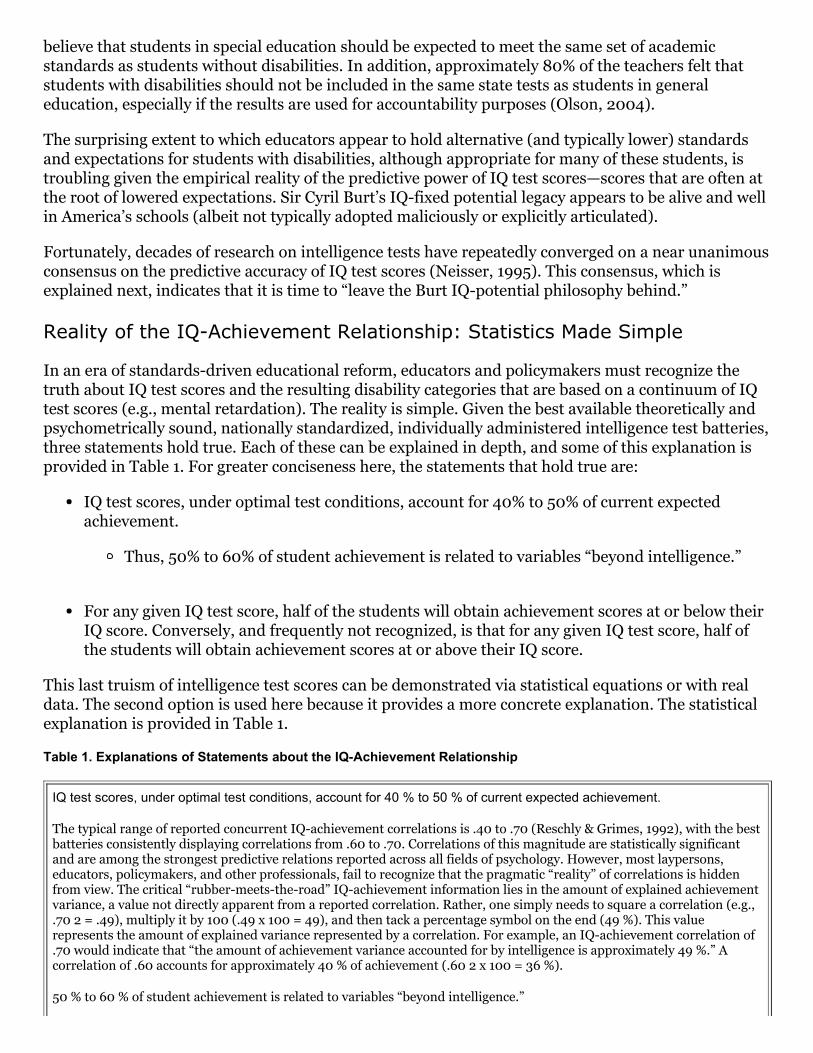
In an era of standardsdriven educational reform, educators and policymakers must recognize thetruth about IQ test scores and the resulting disability categories that are based on a continuum of IQtest scores (e.g., mental retardation). The reality is simple. Given the best available theoretically andpsychometrically sound, nationally standardized, individually administered intelligence test batteries,three statements hold true. Each of these can be explained in depth, and some of this explanation isprovided in Table 1. For greater conciseness here, the statements that hold true are:
IQ test scores, under optimal test conditions, account for 40% to 50% of current expectedachievement.
Thus, 50% to 60% of student achievement is related to variables “beyond intelligence.”
For any given IQ test score, half of the students will obtain achievement scores at or below theirIQ score. Conversely, and frequently not recognized, is that for any given IQ test score, half ofthe students will obtain achievement scores at or above their IQ score.
This last truism of intelligence test scores can be demonstrated via statistical equations or with realdata. The second option is used here because it provides a more concrete explanation. The statisticalexplanation is provided in Table 1.
Table 1. Explanations of Statements about the IQAchievement Relationship
IQ test scores, under optimal test conditions, account for 40 % to 50 % of current expected achievement.
The typical range of reported concurrent IQachievement correlations is .40 to .70 (Reschly & Grimes, 1992), with the bestbatteries consistently displaying correlations from .60 to .70. Correlations of this magnitude are statistically significantand are among the strongest predictive relations reported across all fields of psychology. However, most laypersons,educators, policymakers, and other professionals, fail to recognize that the pragmatic “reality” of correlations is hiddenfrom view. The critical “rubbermeetstheroad” IQachievement information lies in the amount of explained achievementvariance, a value not directly apparent from a reported correlation. Rather, one simply needs to square a correlation (e.g.,.70 2 = .49), multiply it by 100 (.49 x 100 = 49), and then tack a percentage symbol on the end (49 %). This valuerepresents the amount of explained variance represented by a correlation. For example, an IQachievement correlation of.70 would indicate that “the amount of achievement variance accounted for by intelligence is approximately 49 %.” Acorrelation of .60 accounts for approximately 40 % of achievement (.60 2 x 100 = 36 %).
50 % to 60 % of student achievement is related to variables “beyond intelligence.”
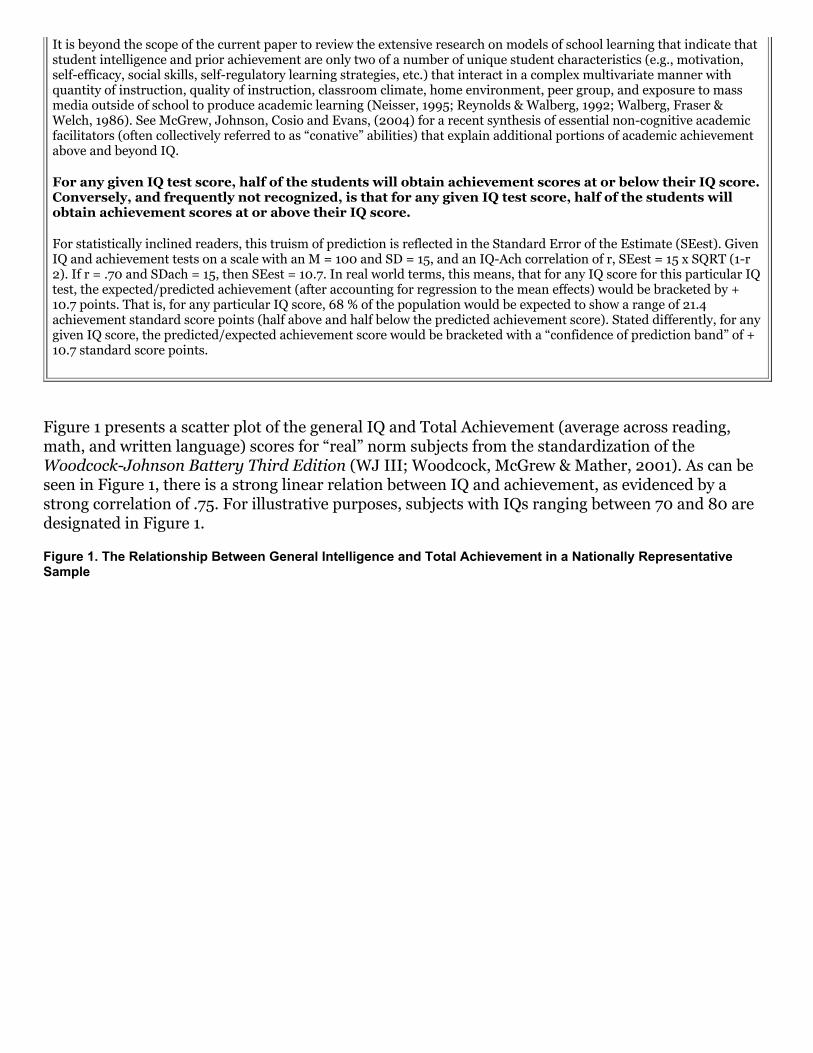
It is beyond the scope of the current paper to review the extensive research on models of school learning that indicate thatstudent intelligence and prior achievement are only two of a number of unique student characteristics (e.g., motivation,selfefficacy, social skills, selfregulatory learning strategies, etc.) that interact in a complex multivariate manner withquantity of instruction, quality of instruction, classroom climate, home environment, peer group, and exposure to massmedia outside of school to produce academic learning (Neisser, 1995; Reynolds & Walberg, 1992; Walberg, Fraser &Welch, 1986). See McGrew, Johnson, Cosio and Evans, (2004) for a recent synthesis of essential noncognitive academicfacilitators (often collectively referred to as “conative” abilities) that explain additional portions of academic achievementabove and beyond IQ.
For any given IQ test score, half of the students will obtain achievement scores at or below their IQ score.Conversely, and frequently not recognized, is that for any given IQ test score, half of the students willobtain achievement scores at or above their IQ score.
For statistically inclined readers, this truism of prediction is reflected in the Standard Error of the Estimate (SEest). GivenIQ and achievement tests on a scale with an M = 100 and SD = 15, and an IQAch correlation of r, SEest = 15 x SQRT (1r2). If r = .70 and SDach = 15, then SEest = 10.7. In real world terms, this means, that for any IQ score for this particular IQtest, the expected/predicted achievement (after accounting for regression to the mean effects) would be bracketed by +10.7 points. That is, for any particular IQ score, 68 % of the population would be expected to show a range of 21.4achievement standard score points (half above and half below the predicted achievement score). Stated differently, for anygiven IQ score, the predicted/expected achievement score would be bracketed with a “confidence of prediction band” of +10.7 standard score points.
Figure 1 presents a scatter plot of the general IQ and Total Achievement (average across reading,math, and written language) scores for “real” norm subjects from the standardization of theWoodcockJohnson Battery Third Edition (WJ III; Woodcock, McGrew & Mather, 2001). As can beseen in Figure 1, there is a strong linear relation between IQ and achievement, as evidenced by astrong correlation of .75. For illustrative purposes, subjects with IQs ranging between 70 and 80 aredesignated in Figure 1.
Figure 1. The Relationship Between General Intelligence and Total Achievement in a Nationally RepresentativeSample
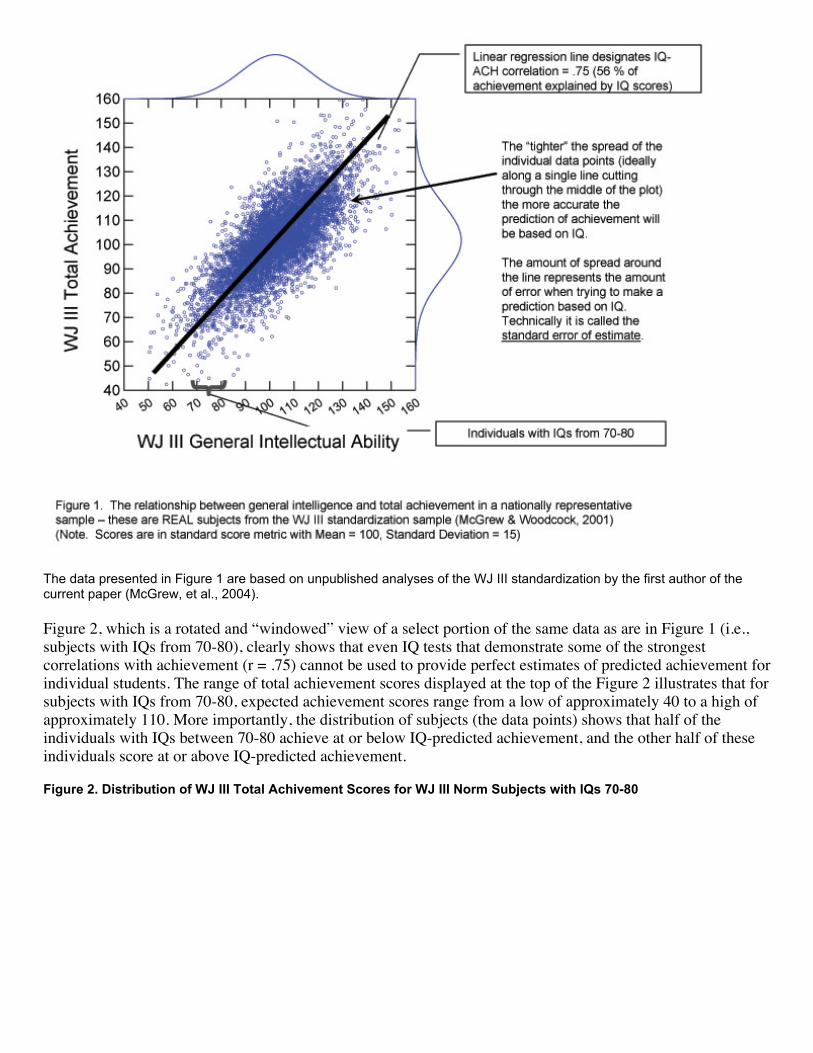
The data presented in Figure 1 are based on unpublished analyses of the WJ III standardization by the first author of thecurrent paper (McGrew, et al., 2004).
Figure 2, which is a rotated and “windowed” view of a select portion of the same data as are in Figure 1 (i.e.,subjects with IQs from 70-80), clearly shows that even IQ tests that demonstrate some of the strongestcorrelations with achievement (r = .75) cannot be used to provide perfect estimates of predicted achievement forindividual students. The range of total achievement scores displayed at the top of the Figure 2 illustrates that forsubjects with IQs from 70-80, expected achievement scores range from a low of approximately 40 to a high ofapproximately 110. More importantly, the distribution of subjects (the data points) shows that half of theindividuals with IQs between 70-80 achieve at or below IQ-predicted achievement, and the other half of theseindividuals score at or above IQ-predicted achievement.
Figure 2. Distribution of WJ III Total Achivement Scores for WJ III Norm Subjects with IQs 7080
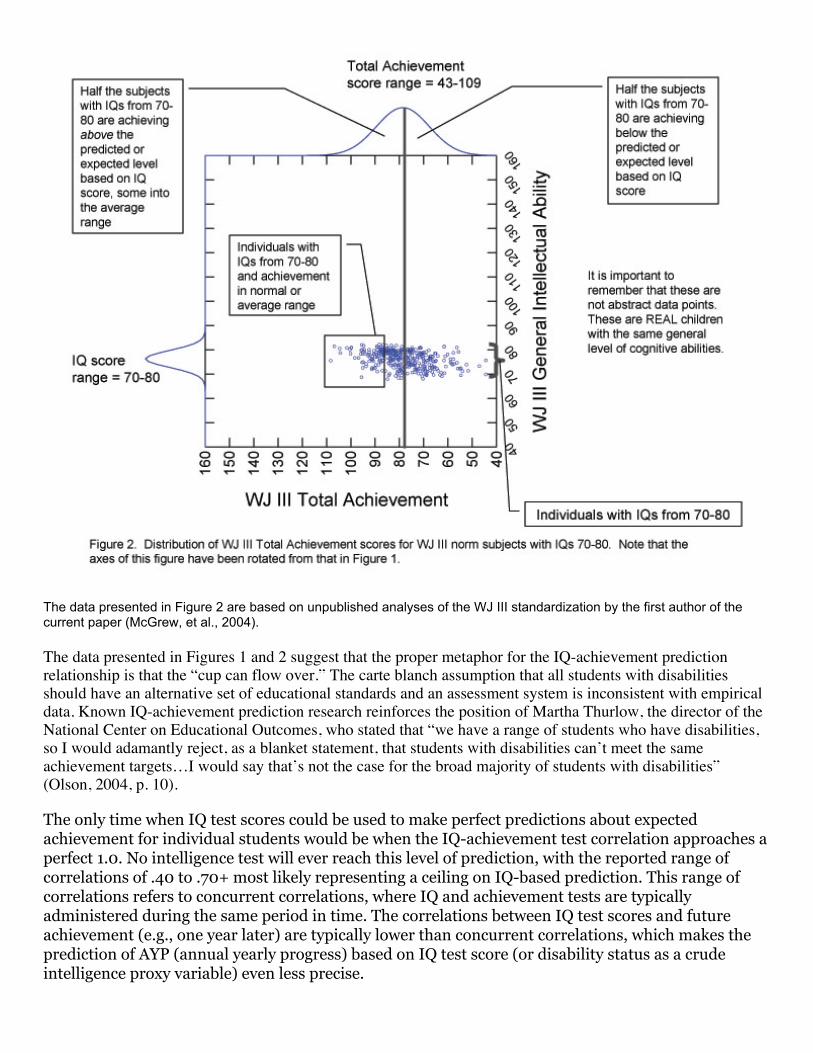
The data presented in Figure 2 are based on unpublished analyses of the WJ III standardization by the first author of thecurrent paper (McGrew, et al., 2004).
The data presented in Figures 1 and 2 suggest that the proper metaphor for the IQ-achievement predictionrelationship is that the “cup can flow over.” The carte blanch assumption that all students with disabilitiesshould have an alternative set of educational standards and an assessment system is inconsistent with empiricaldata. Known IQ-achievement prediction research reinforces the position of Martha Thurlow, the director of theNational Center on Educational Outcomes, who stated that “we have a range of students who have disabilities,so I would adamantly reject, as a blanket statement, that students with disabilities can’t meet the sameachievement targets…I would say that’s not the case for the broad majority of students with disabilities”(Olson, 2004, p. 10).
The only time when IQ test scores could be used to make perfect predictions about expectedachievement for individual students would be when the IQachievement test correlation approaches aperfect 1.0. No intelligence test will ever reach this level of prediction, with the reported range ofcorrelations of .40 to .70+ most likely representing a ceiling on IQbased prediction. This range ofcorrelations refers to concurrent correlations, where IQ and achievement tests are typicallyadministered during the same period in time. The correlations between IQ test scores and futureachievement (e.g., one year later) are typically lower than concurrent correlations, which makes theprediction of AYP (annual yearly progress) based on IQ test score (or disability status as a crudeintelligence proxy variable) even less precise.
The current reality is that despite being one of the flagship developments in all of psychology(Embretson, 1996; Neisser, 1995), intelligence tests are fallible predictors of academic achievement.IQ test scores (and associated IQbased disability category labels) are adequate, but not nearlysufficient metrics, by which to make reasonably precise predictions about any particular individualstudent’s future expected achievement progress. It simply cannot be done beyond a reasonable doubt.
The fallibility of IQ tests, coupled with the enduring presence of the ghost of Sir Cyril Burt’sdeterministic IQachievement educational philosophy, in the context of today’s highstakeseducational accountability environment, raises the specter of many children with disabilities beingdenied the right to appropriate and demanding expectations. Stereotyping students with disabilities(often on the basis of disability label or test scores) as a group that should be excluded from generaleducation standards and assessments is not supported by the best evidence from current science inthe field of psychological and educational measurement. The potential soft bigotry of setting a prioriIQ or disability labelbased low academic expectations (for students with disabilities) needs to berecognized, understood, and minimized, if all children are not to be left behind.
Expectancy Effects: A Brief History and Literature Review
Since the 1970s, the notions of the “selffulfilling prophecy” (SFP), the “Pygmalion Effect” (PE), andmore recently, “expectancy effects” (EE), have become commonplace in the educational psychologyliterature. In general, these terms refer to similar phenomena. The research literature on teacherexpectancy effects is large. For the purposes of the current paper, we have relied extensively on anumber of key research syntheses, many that have included multiple metaanalyses. Key sources (andrecommended reading) include Babad (1993), Cotton, (1999), Jussim, Madon, and Chatman (1994),and Spitz (1999).
Merton (1948) is recognized as the first to coin the term “selffulfilling prophecy” (which has nowevolved into the more general phenomena of “expectancy effects”; Jussim, Madon & Chatman, 1994;Spitz, 1999). According to Merton (1948), SFP occurs when an inaccurate definition of a situationelicits new behaviors which, in turn, make the originally inaccurate conception a reality. SFP is acompelling theory, largely because of its potential implications and elegant simplicity.
The concept is simple enough: If we prophesy (expect) that something will happen, webehave (usually unconsciously) in a manner that will make it happen. We will, in otherwords, do what we can to realize our prophecy (Spitz, 1999, p. 200).
In most EE research, it is usually a person in a position of authority (e.g., an employer, medicalprofessional, parent, teacher, etc.) who holds expectations about an individual (or group) under theirsupervision. According to the EE research, expectations expressed by an authority figure via verbaland nonverbal communication often influence the selfimage and the behavior of the supervisedperson in such a way that the expectations held come to pass.
Origins of Expectancy Effects
The “selffulfilling prophecy” (SFP) has long been studied by sociologists and psychologists undervarious labels (Gozali & Meyen, 1970; Rosenthal & Jacobson, 1966; Wineburg, 1987; Zuroff & Rotter,1985). SFP is also often referred to as the “Pygmalion Effect” which was drawn from the title of theoriginal book (Rosenthal & Jacobson, 1968a; Pygmalion in the Classroom) that reported thephenomenon. SFP first appeared in early psychological research studies where it was demonstratedthat experimenters could unwittingly influence the behavior of animal and human subjects during an
experiment (Rosenthal & Jacobson, 1966). In 1968, Rosenthal and Jacobson substituted teachers forexperimenters in order to investigate the effects of teachers’ expectancies on the intelligence testscores of their pupils. The Rosenthal and Jacobson (1968b) study was designed to measure “whetherthose children for whom the teachers held especially favorable expectations would show greaterintellectual growth than the remaining or controlgroup children’’ (p. 68) when evaluatedapproximately 5, 8, and 20 months later. Cotton (2001) provided a succinct summary of the originalPygmalion study:
The Rosenthal/Jacobson study concluded that students’ intellectual development islargely a response to what teachers expect and how those expectations are communicated.The original Pygmalion study involved giving teachers false information about the learningpotential of certain students in grades one through six in a San Francisco elementaryschool. Teachers were told that these students had been tested and found to be on thebrink of a period of rapid intellectual growth; in reality, the students had been selected atrandom. At the end of the experimental period, some of the targeted students—andparticularly those in grades one and two—exhibited performance on IQ tests which wassuperior to the scores of other students of similar ability and superior to what would havebeen expected of the target students with no intervention (¶ 4).
The Rosenthal and Jacobson (1968a) report suggested that teacher expectations could increase ordecrease intelligence (IQ) test scores. Understandably, this report created a media sensation (seeElashoff & Snow, 1971; Spitz, 1999; Wineburg, 1987). The possibility that teachers could effect change(either positive or negative) in a student’s IQ scores held considerable popular interest and appeal.According to Cotton (2001):
These results led the researchers to claim that the inflated expectations teachers held forthe target students (and, presumably, the teacher behaviors that accompanied those highexpectations) actually CAUSED the students to experience accelerated intellectual growth.Few research studies in the field of education have generated as much attention andcontroversy among educators, researchers, and the general public as Rosenthal andJacobson’s Pygmalion study…in the popular press, articles began appearing which usedthe Pygmalion findings as a springboard for the claim that perhaps “Johnny can’t read”because his teachers don’t have faith in his abilities and don’t encourage him, particularlyif he is poor or a member of a minority group. Other articles looked at the positive side,giving teachers and parents the message that they could improve children’s schoolperformance dramatically by communicating high expectations to them (¶ 6).
Since the publication of Rosenthal and Jacobson’s original 1968a study, SFP/EE research has enjoyeda long and controversial history in the educational psychology literature. Controversies have focusedprimarily on methodological (e.g., technical adequacy of measures, individual differences betweenteachers in studies, etc.) and dependent variable (i.e., affecting intelligence, behavior, achievement,etc.) issues (see Babad, 1993; Spitz, 1999). In general, contemporary research syntheses (includingmetaanalyses) indicate that the expectations of one person can influence the behavior orperformance of another person (Babad, 1993; Jussim et al., 1994). Based on a comprehensive reviewof the literature, Cotton (2001) concluded that “teacher expectations are, of course, a component ofschool wide expectations…the most important finding from this research is that teacher expectationscan and do affect students’ achievement and attitudes” (¶ 21). The prevailing conclusion is that someSFP/EE effects exist with regard to certain student characteristics (Jussim et al., 1994). According toBabad (1993):
Today there is no doubt that SFP effects exist, and teacher expectations—based on
fabricated information as well as on real differences among students—can have systematicinfluences on (in descending order of effect magnitude) teachers’ impressions of students,teachers’ grades, students’ performance on objective achievement tests…However, thephenomenon is probabilistic, and SFP effects do not take place in every classroom and forevery teacher. (p. 128)
Expectancy Effects and Intelligence
It would be an understatement to describe the EE research focused on the relations between teacher’sexpectations and intelligence as contentious (Babad, 1993; Spitz, 1999). Post hoc reanalysis of theoriginal classic Rosenthal and Jacobson (1968a) investigation raised many questions about the study’smethodology. Numerous attempts to replicate the Pygmalion effect (i.e., teacher expectations canincrease or decrease student IQ scores) have proven unsuccessful; in fact, only one doctoraldissertation (of 20) was deemed a success in Spitz’s review (1999). In many of the subsequent followup studies the control groups often gained more IQ points than the experimental groups. In addition,a number of prominent educational and psychological researchers (e.g., Cronbach, Snow, andThorndike) provided very negative reviews of Rosenthal and Jacobson’s (1968a) original research (seeSpitz, 1999).
It is clear from a review of the voluminous literature that the specific effect of teachers’ expectationson children’s intelligence had, over time, been lost and blended together with teacher expectancyeffects on variables other than intelligence (Elashoff & Snow, 1971). Rosenthal resolutely withstoodwithering criticism on these points, and as time passed, further obfuscated the issue of the PygmalionEffect (PE) by not clearly delineating the difference between cognitive effects (which were not clearlyproven over time) and other classroom expectancy effects (e.g., academic achievement). Rosenthaldid, however, bring this important area of study into the classroom.
Many other researchers have continued to examine the teacherstudent expectancy effect. A clearconnection between expectancy effects and IQ has not been established (Brophy, 1983; Jussim,Madon, & Chatman, 1991; Jussim & Eccles, 1995; Raudenbush, 1984; Rosenthal & Rubin, 1978; Spitz,1999). However; expectancy effects and academic achievement do appear to correlate positively.
Expectancy Effects: How Large?
A frequently quoted estimate of the magnitude of Expectancy Effects (EE) in education is that 5% to10% of student achievement performance might be ascribed to the influence of differential teacherexpectations (Brophy, 1983). More recently, average expectancy effect sizes from 0.1 to 0.3 have beenreported, although it is “likely that under certain conditions expectancy effects may be larger orsmaller” (Jussim et al., 1994, p. 324). On first inspection, effect sizes of 0.1 to 0.3 appear to be of littlepractical import. This is wrong. According to Jussim et al. (1994), when discussing students who arethe “targets” of EE, “a naturally occurring effect of ‘only’ .2 means, that on average, of all targets ofhigh expectations, 10% show substantial improvement; and of all targets of low expectations, 10%show substantial decreases in performance” (p. 327). The pragmatic impact of such effects is cogentlyarticulated by Jussim et al. (1994):
One way to highlight the importance of this is to consider the effect as if it were the resultof some largescale social program…We suspect that a program that led 10% of studentswho had been performing below average to perform above average would be viewed ashighly successful; a social policy that undermined students’ performance so that 10% ofthose who had been aboveaverage became below average, would be considered anoutrage. Of course, the figure may be much larger than 10% among more susceptible
children and if expectancy effects do accumulate (p. 327).
To reassure the reader of the importance of what appear to be significant, yet small correlations oreffect sizes, one only needs to be reminded that many significant public and social policy decisionshave been made on the strength of relations between variables that are of the same magnitude orlower than those reported for EE. For example, a special American Psychological Association (APA)Psychological Assessment Work Group (PAWD) provided the following examples:
The reduction of the risk of dying from a heart attack by taking aspirin is based on r = 0.02
The impact of chemotherapy on breast cancer survival; r = .03
The value of antihistamines for reducing sneezes and a runny nose; r = .11
The impact of Viagra on improved sexual functioning; r = .38
Furthermore, much like the longterm insidious effect of longterm exposure to subclinical levels oflead, asbestos, secondhand smoke, and other toxins, some research studies have suggested that evensmall EE can result in larger cumulative effects over time. Small EE could exert a substantial influenceon student achievement, particularly for more vulnerable and “at risk” students (Jussim et al., 1994).
Expectancy Effects and Student Characteristics
In the field of special education, EE was first investigated (in the 1970s and 1980s) with regard to thepotential negative consequences of being labeled “mentally retarded” (see Mercer, 1973). In general,this “stigma” research suggested that being labeled mentally retarded often led to changes in thebehavior of adults who encouraged “learned helplessness” (Yeates & Weisz, 1985). These studiesreported that the attribution for success or failure for a mentally retarded person was more frequentlyassigned to the person’s inherent low ability, while failure attribution for others was more frequentlyassigned to the person’s effort.
Researchers have found that, in general, EE in classrooms are often related to a number of differentstudent characteristics. “Teachers overestimate the achievement of high achievers, underestimate thatof low achievers, and predict least accurately the responses of low achievers” (Gottfredson, Marciniak,Birdseye, & Gottfredson, 1995, p. 156). Although lowachieving students have been found to receivemore learning support, they also are communicated lower expectations via less pressure to achievethan high achieving students (Babad, 1990). Additional student characteristics associated withteacher expectations include race, ethnicity, SES, physical appearance or attractiveness, oral languagepatterns (i.e., use of standard English), prior negative comments or evaluations about a student byother teachers, readiness/maturity, and grouping/tracking effects (Cecil, 1988; Cotton, 2001; Dusek &Joseph, 1983; Gaines & Davis, 1990; Jussim et al., 1994; Kenealy, Neil, & Shaw, 1988; Williams &Muehl, 1978). Similar to the early MRstigma research, some teachers have been found to associatesuccess to inherent ability in the case of high achieving students and luck or chance for perceived lowachievers.
Negative educational EE appear to be differentially more influential for younger students andstudents with lower achievement (Cotton, 2001). Children may also be most vulnerable to teacherexpectation effects at key transition points (e.g., school entry, change of schools, elementary to juniorhigh transition, etc.) (HauserCram, Sirin, & Stapele, 2003). Finally, it is important to recognize thatsome vulnerable or “at risk” students, nevertheless, are more resilient than others and seemimpervious to the deleterious impact of negative EE (Jussim et al., 1994).
As is the case with most documented psychological research effects, sweeping generalizations areinappropriate. The groupbased selffulfilling prophecy effects are moderated by a number of studentspecific characteristics. For example, using data from the Michigan Study of Adolescent LifeTransitions, Eccles (1988), Madon, Jussim, and Eccles (1997) reported that for nearly 100 teachersand more than 1,500 students in sixthgrade public school math classes, EEs were moderated via theinteraction of level of student achievement (as measured by the math section of the MichiganEducational Assessment Program—MEAP), SFP valiance (i.e., teachers having either positive ornegative expectations for student growth), and student achievement domain selfconcepts. Madon etal. (1997) reported that:
High achievers were nearly invulnerable to teacher perceptions that underestimated theirability; high achievers also increased in achievement when teachers overestimated theirpredicted growth.
Low achievers were differentially responsive to teacher’s over or underestimating predictedachievement growth. That is, when teachers underestimated their achievement, low achieversachieved lower; when teachers overestimated their predicted growth, low achievers achievedhigher.
For low achieving students, increases in achievement predicted by teacher overestimates weregreater than decreases predicted by teacher underestimates.
Students with low achievement (i.e., math) selfconcepts were more susceptible to selffulfillingprophecies than students with high achievement selfconcepts.
In general, Madon et al.’s (1997) largescale study suggests that teacher perceptions and expectationshave a greater relative impact on achievement among low achievers than among high achievers. Thatis, “low achievers are more susceptible to selffulfilling prophecies than are high achievers” (p. 792).
Expectancy Effects: The Student’s Perspective
The extant research literature has demonstrated that children, from their first years in school, arehighly sensitive to differential teacher behaviors (Babad, 1990; Cooper & Good, 1983; Gottfredson etal., 1995; Weinstein, 1985). This research has found that students’ sensitivity to differential behaviorscuts across grades (e.g., first graders display as much sensitivity as older children), gender, and abilitylevels.
Research reviews (Babad; 1993; Gottfredson et al., 1995) have suggested that students perceive lowachieving students as typically receiving more vigilance directed towards them, fewer chances, morenegative feedback and direction, more negative affect, and more frequent work and ruleorientedtreatment. In contrast, students typically perceive high achievers as being the recipients of higherexpectations and academic demands, more emotional supports and special privileges, and increasedopportunities to make choices. Furthermore, some studies (Cooper, 1983) have found that “lowexpectation students receive more noneffortcontingent feedback designed to control their behavior;consequently, those students are less likely to develop beliefs in the value of effort, are less persistent,and less successful” (p. 156).
Expectancy Effects: PeertoPeer
If a certain groupbased identity or label has pejorative connotations, peers may behave toward the“target” individual in ways consistent with expected stereotypical behaviors associated with the group
or label. Being labeled as a “student with a disability” or a “special education” student has beendemonstrated to influence peer expectations and social relations (Miller, Clarke, Malcarne, & Lobato,1991; Rothlisberg, Hill, & D’Amato, 1994). For example, in a study of the expectations for studentslabeled mentally retarded, students without disabilities communicated differently with other targetstudents who were either labeled normal or mentally retarded (despite the fact that thecommunication behaviors of the target students were held constant across both groups). Miller et al.(1991) reported that nonretarded children adopted simpler speech when addressing a child describedas having learning problems. Rothlisberg et al. (1994) reported that a student’s willingness to befriendanother child varied as a function of the target child being labeled as being mentally retarded ornormal.
These research studies, and others, suggest that labeling (e.g., special education; mentally retarded;etc.) may result in peers altering their social behavior toward the labeled child based on perceivedacademic and social stereotypes associated with the label. Labeling of students appears to drawattention to the individual’s deficits, rather than his or her academic and social accomplishments andstrengths, which in turn increases the probability of peers adopting lower and more negativeexpectations for the labeled student (Rothlisberg, et al., 1994).
Expectancy Effects: Educator Behaviors
Although the claim that teacher expectancies can raise student intelligence has been effectivelyrebuked, most vocal critics have expressed the belief, supported by research, that expectancy effectsdo influence teachertostudent performance and behavior (Spitz, 1999). “Teachers’ expectations oftheir students are related to students’ subsequent achievement, even when teacher’s expectations donot conform to student’s prior performance” (Carr & KurtzCoates, 1994).
Expectancies can be expressed both verbally and nonverbally. Although most teachers report thatthey can fully control their behavioral affect and deceive students whenever necessary, at times thetwo primary modes of communication can send mixed signals. Communication “leakage” is presentwhen an individual tries to conceal a particular affect (e.g., negative) toward another individual byconsciously controlling their obvious communication behavior (e.g., speech content). But the oppositemessage (i.e., negative affect) can still be transmitted via less controllable communication behavior(e.g., the face and then the body) (Babad, 1993; VanOudenhoven, 1985). Furthermore, research hassuggested that when people try to consciously conceal negative affect and instead transmit falsepositive affect, the deceit is more successful in the controllable channels (e.g., speech content) and notas successful in less controllable channels (e.g., the face and then the body).
The literature on how different types of information, biases, and stereotypes influence the formationof expectations is rich (Babad, 1993; Cotton, 2001; Jussim et al., 1994), with a thorough treatmentbeyond the scope of the current paper. In general, this research suggests that:
Expecters behave (via fine and subtle nuances) in ways that cause expectees to respond inways that would strengthen the expectations. Thus, even if expectations have an initialreality base, the circular process of selfconfirmation is likely to deviate from reality andexaggerate existing differences. This is certainly true for racial or gender stereotypes,which constitute primary bases of teacher expectations. (Babad, 1993, p. 132)
VanOudenhoven (1985) reported that students for which teachers held lower expectations received, inaddition to more encouragement, more “negative, nonverbal evaluative feedback” (p. 760). Ofsignificance was the conclusion that the low teacher expectations were expressed primarily via lesscontrollable nonverbal teacher behavior. In Babad’s review (1993) it was found that “teachers were
not able to conceal their negative affect in the less controllable channels” (p, 136137). For example,extremely small differences in length of sustained eye contact was observed (i.e., more eye contact forhigh versus lowexpectancy students following an inadequate or wrong answer) (Babad, 1993). Evenbrief exposure to a teacher’s face or body movements (e.g., differences in voice inflection) can providea student with enough information to communicate expectancies (Babad, 1993; Babad, Bernieri, &Rosenthal, 1991). Teacher behaviors associated with the communication of low achievementexpectancies to low achievement students have included (Cotton, 2001; Gottfredson et al., 1995):
The provision of fewer opportunities to learn new material.
Less “wait” time provided to answer questions.
Providing answers or calling on someone else.
Inappropriate feedback (more frequent and severe criticism for failure; insincere praise),limited reinforcement (e.g., giving reinforcement that is not contingent on performance), orrewarding more incorrect answers or inappropriate behavior.
Providing less attention and more interaction in private settings.
Providing differential treatment in grading (less frequently giving “the benefit of the doubt”)and personal interactions (e.g., teachers less friendly or responsive; making less eye contact;giving fewer smiles).
Providing briefer and less informative feedback.
Providing less stimulating, and lowerlevel cognitive questions.
Providing less effective (but time consuming) instructional methods.
Expectancy Effects: Why Do They Occur?
Although the original research on expectancy effects was based primarily on studies where educatorswere provided false information regarding student potential, “most researchers have concluded thatteacher expectations are not generally formed on the basis of ‘false conceptions.’” Rather, they arebased on the best information available about the students (Cotton, 2001). Furthermore, even if theinitial expectations a teacher forms for a student are realistic and appropriate, student learning andselfconcept development can be limited as a result of sustained expectation effects (Cotton, 2001).The adverse impact of sustained expectations can occur when teachers continue to engage inbehaviors that result in the maintenance of previously formed low expectations (e.g., by giving lowexpectation students only drill work) (Cotton, 2001).
AffectEffort Theory
Affecteffort theory
SingleIndicator Generalizationn
basing their perceptions of student motivationalaffective characteristics on a unidimensionalevaluation of achievement levels. That is, teachers may “rely on a single indicator, achievement, to
estimate other cognitive and motivational characteristics of their students” (Carr & KurtzCoates,1994).
Cognitive Heuristics
Based on research in cognitive psychology, Jussim et al. (1994) hypothesized that expectancy effectsmay be a function of teachers’ developing and using certain cognitive heuristics (mental “shortcuts”)when confronted with the large mass of information regarding a classroom of students (e.g., labels,test scores, inclass performance, quality of homework, behavior, etc.). Cognitive heuristics are basedon Herbert Simon’s original notion of bounded rationality (Bröder, 2003) where it is hypothesizedthat human decision making is often based on only a small proportion of available information, andthese frugal shortcuts often lead to reasonable (yet imperfect) judgments and evaluations. Accordingto this cognitive model of decisionmaking, the mind is viewed as an adaptive toolbox where humans“are thought to react adaptively to their environment by choosing the appropriate heuristicscontingent on task demands” (Bröder, 2003, p. 611). Three different types of cognitive heuristics havebeen discussed in the context of expectancy effects—representativeness and regression,representativeness and base rates, and availability and expectations.
The representativeness heuristic (based on the assumption that past performance is representative ofthe students’ capabilities and is the best predictor of future performance) does indeed predict futureperformance quite well. When a teacher develops student expectancies based on years of experiencewith beginningtoend of school year achievement patterns, on the average, the teachers’ expectanciesare confirmed. The flaw in excessive reliance on an implicit or explicit pasttofuture achievementrepresentativeness heuristic is the failure of teachers (and most humans) to recognize the lack of theperfect pasttofuture achievement relationship, a phenomena that requires teachers to be“regressive” in expectation formation.
The representativeness heuristic is also manifested in the tendency of humans to focus on morereadily available cheap (in terms of cognitive or mental effort) information while concurrentlyignoring more costly (in terms of information availability and retrievability) empiricallyderived baserate information. The representativenessbase rate heuristic would be evidenced by ignoring the fact(largely due to a lack of information or the fact that too much effort must be expended to secure theinformation) that half of all students at any IQ level demonstrate achievement at or above IQbasedpredicted/expected achievement (see Figure 2 and related text). Instead, readily retrievable personalexperiential information (e.g., history of working with students with certain low test scores) is morelikely used to form new expectancies. As demonstrated in Figure 2, the use of this mental shortcut canresult in the formation of IQbased student expectancies in the absence of all relevant empiricalinformation. The result is a downward bias in academic expectancies for students who are below thenorm in general cognitive ability.
Similarly, the availability heuristic
It is clear that a number of viable, and probably interacting, psychological theories and hypothesismay explain the dynamics of expectancy effects. As described above, theories have focused on boththe affective and cognitive domains of teacher functioning..
Attribution Theory
Certain beliefs about intelligence and learning may lead to lowered expectations for low achievingstudents and students with cognitive disabilities (Cotton, 2001; Lee, 1996). In particular,contemporary social cognitive psychology research has suggested that attribution theory (Graham,
1990, 1991, Weiner, 1979, 1985, 1986) is a “useful framework for exploring teachers’ response tochildren’s academic outcomes, such as success or failure, in the general education classroom” (Clark,1997, p. 69).
Briefly, attribution theory research has demonstrated that individuals (e.g., teachers) tend to attributesuccess or failure for an individual (e.g., students) to one of two different human characteristics—ability or effort. Graham and Weiner’s (Graham & Wiener, 1986; Weiner, 1986) studies found thatthe initial response of many classroom teachers to a negative student outcome is either anger or pity.Furthermore, the elicitation of anger or pity was differentially linked to the degree to which teachersperceived the student as responsible for his or her failure. Typically, when faced with student failure, ateacher pity response was elicited for students of low abilities while anger was the more frequentresponse to high ability students (due to a perceived lack of effort or motivation). Furthermore, theseresearchers found that the anticipation of future failure for students was directly related to theperceived stability of the cause of the student failure. “Failure due to causes that are viewed as stable,such as low ability, will result in a high expectation that failure will recur, whereas failure due tounstable causes, such as effort or task difficulty, will result in a lower expectation of repeated failure”(Clark, 1997, p. 70).
Of interest for students identified and classified according to a medical model of disabilities (e.g.,mental retardation), is Weiner’s (1993) hypothesized sin versus sickness causal attribution foreducational outcomes. Briefly, a “sickness” attribution (and subsequent teacher reactions of high pityand low anger) is often made by teachers to explain the failure of students who are viewed as having arelatively stable (permanent) inherent cause (mental disability) that is outside the control of theindividual student. In contrast, if the educational failure is viewed as related to unstable causes thatare controllable by a student (e.g., motivation, effort), typical teacher responses are more in line witha “sin” causal attribution (resulting in less pity and more anger).
Implicit Theories of Intelligence
More recently, causal attribution research has focused on the Implicit Theories of Intelligence (ITI)that people adopt (Perkins, Tishman, Ritchhart, Donis, & Andrade, 2000). Briefly, ability conceptionis an individual’s beliefs about the nature of a person’s cognitiverelated skills and abilities, includinga personal view on how a person’s skills and abilities operate or work (McGrew, Johnson, Cosio, &Evans, 2004). Two general ability conceptions have been identified in the research literature. A “traitoriented system” (often called the entity view of ability) perceives a learner’s abilities as beingrelatively fixed internal quantities. Since traits are fixed, the result is the implicit or explicit belief thatit cannot be changed via effort (e.g., motivation). The entity view is consistent with the previouslydescribed Burt position that children can only achieve according to the size of their intellectual “jug.”
In contrast, a “processoriented system” (incremental view of ability) is the belief that ability can bedeveloped and that effort and strategies (i.e., noncognitive or conative abilities) are important forlearning. The processoriented ability conception implies a more optimistic view of learners—there isroom for improvement in personal ability via effort and work. In terms of student ability conceptionselfbeliefs, an incremental or process view is associated with higher levels of student intrinsicmotivation and academic selfefficacy (McGrew et al., 2004). An incremental view of abilities isconsistent with the glass/cup/jug halffull or flowing over IQlearning metaphors of Binet and Gump.
performance goals, which are focused on gaining favorable judgments about their competencies. As aresult, entity performance goaloriented learners are more vulnerable to failure and the adaptation ofmaladaptive learning patterns and behaviors. In contrast, learners with a more optimistic malleableview of intelligence (incremental ITI) tend to adopt a learning goalorientationn, an orientation
associated with learners who: (a) are challenged by failure, (b) develop more competence, and (c)adopt more adaptive learning patterns (McGrew et al., 2004).
According to ability conception theory, the ITI adopted by teachers may influence their goals,expectations, and behaviors toward students (Lee, 1996). Entitybased educators who “conceive ofone’s intelligence as fixed tend to document that entity as a performance goal; they regard tests orother measurement opportunities as ways to assess intelligence and, consequently, to judge students’competence in these achievement situations. In contrast, incremental teachers conceive intelligenceas a malleable quality and that development of ability is a learning goal; they consider achievementsituations as opportunities for students to improve their competence, acquire new skills, and increasetheir ability” (Lee, 1996, p. 1).
Using the Teachers’ Implicit Theories of Intelligence Questionnaire as the measure of teacher ITI, Lee(1996) analyzed the behaviors (estimated expectations for target students’ performance on a task) of100 “incremental” and 100 “entity” teachers. Lee (1996) reported that entity and incremental teachersresponded differentially towards students. Entity teachers were more influenced by their perceptionsand expectations than incremental teachers. More specific differences observed between entity andincremental teachers were (Lee, 1996):
Entity teachers evaluated ability based on scores, gave more direct answers, commented morefrequently on nonintellectual aspects of performance (e.g., neatness of writing), or providedless student feedback. In contrast, incremental teachers placed greater emphasis on the effortsof students, gave indirect cues for correct answers, and provided more encouragement tostudents.
Entity and incremental teachers displayed noticeable differences in how they grouped students.Entity teachers more frequently recommended homogeneous ability grouping (57.0%) whencompared to incremental teachers (17.0%). In contrast, incremental teachers tended to preferheterogeneous ability grouping (83.0%).
Entity teachers more frequently viewed student performance as an indication of ability andprovided feedback directly related to outcomes. In contrast, incremental teachers tended to viewincorrect answers as something students could master through effort, and provided feedback toelicit such effort.
Entity teachers focused more on a students’ performance (52%) than incremental teachers(26%) while incremental teachers focused more on learning (74%) than entity teachers (48%).
As a result of an entity view of ability, “teachers’ low expectations will induce students toexpect their selfefficacy to be as low as their teachers do, inhibiting their potential andmotivation for future learning. In addition, this can create motivationally helpless studentswho cannot overcome repeated failures and instead give up too easily. As a result, viciouscycles are created and prophecies of teachers are selffulfilled. It seems obvious thatteachers’ entity beliefs of intelligence are neither beneficial nor desired for any children,especially entity children. (p. 10))
Group Stereotyping
Expectancy effects may also reflect the differential treatment of an individual based on groupmembership stereotypes. Groupbased selffulfilling prophecies differ from individualbased self
fulfilling prophecies and are relevant to the educational practices of grouping, tracking, andinstitutionalized segregated instruction (e.g., separate special education classrooms). Classroom selffulfilling prophecies “may be more powerful for groups because teachers spend more time addressingtheir classes or ability groups as a whole than addressing individual students” (Smith, Jussim, Eccles,VanNoy, Madon, & Palumbo, 1998, p. 534).
Stereotypebased low expectations for “different” students (e.g., students with disabilities, students ofdifferent races/ethnic groups, etc.) is a form of stereotype threat
The moderating influence on selffulfilling prophesies (SFP) visàvis group membership status hasproven to be significant (Smith et al., 1998, p. 532). For example, in a largescale study of 1,701students and 97 teachers in 108 sixgrade math classes, Smith et al. found SFP were strongest whenstudents were grouped within classes. It was hypothesized that teachers may hold relatively fixedperceptions of students in different groups (e.g., high, average, low achievement/ability) because thegrouping labels explicitly emphasize differences between the groups. Consistent with prior research,this largescale study found that teachers interacted more frequently, and provided moreopportunities for demonstrating their knowledge and skills, when working with students in highability groups (in contrast to low ability groups).
Groupbased stereotypical thinking has also been reported to influence the type of instructionstudents receive. Zohar, Degani and Vaaknin (2001) reported that nearly half (45%) of 40 Israeliteachers in their study believed that instruction emphasizing higherorder thinking was lessappropriate for lowachieving students. Although it might be argued that the Zohar et al. (2001) studyreflects a culturespecific instructional practice, the findings mirror prior research studies in the U.S.(Raudenbush, Rowan, & Cheong, 1993). Collectively these research findings suggest that teachers mayimplicitly endorse a hierarchical general theory of learning and instruction, where learning needs toprogress from an emphasis on simple lowerorder cognitive skills to more complex higherorderskills. By extension, lowachieving students (or students with disabilities) are perceived as likely toexperience more difficulty, confusion, and frustration with the more cognitively demanding “thinkingbased” learning. According to Zohar et al. (2001), “lowachieving students may chronically experiencelower order instructional emphasis because educators see these students as ‘stuck’ in the early phasesof the learning process” (p.470).
Probably one of the more potentially insidious forms of stereotypebased expectation formation isthat which results from the attachment of diagnostic labels (e.g., learning disabled, mentally retarded,emotionally disturbed, etc.) to students. Although all forms of social stereotypes (e.g., gender, socialclass, race, ethnicity, etc.) can produce harmful effects, diagnostic educational or medical disabilitylabels almost always have the authoritative stamp of approval by a credible expert (e.g., psychologist,doctor) (Jussim et al., 1994). This major source of lowered teacher expectations has been repeatedlydemonstrated in the special education research literature (e.g., see Rist & Harrell, 1982; Thurlow et al,1983; Ysseldyke & Foster, 1978). Based on the previously summarized Education Week nationalsurvey of teachers (Olson, 2004), lowered expectations for all students with disabilities continues tobe a latent force in many of America’s classrooms, and may be exacerbated by the current wave ofhigh stakes educational accountability.
Beware of Silent, Shifting Standards
Research during the past decade has revealed that groupbased stereotypes can be conceptualized asfunctioning as “standards against which individual members of stereotype groups are judged”(Biernat, 2003; p, 1019). Briefly, stereotyping effects occur when individual group members areevaluated in a direction consistent with groupbased expectations or stereotypes. “For example, a man
is judged a better leader than a woman; a physician is judged more intelligent than a hairdresser…these types of effects certainly indicate that stereotypes have been used to judge individuals and thatthe outcome is assimilation.” The selffulfilling prophesies previously described are examples of thecommonly recognized assimilative stereotype effect.
Research on the “shifting standards model” suggests that assimilative effects alone fail to capture thecomplexity and extent to which stereotypedbased expectations operate in group settings: “Less wellrecognized is the fact that stereotyping can also be manifested in other ways, most notably in counterstereotypical or contrast effects” (Biernat, 2003, p. 1019).
Withincategory standards are typically used when a person evaluates or judges an individual (e.g.,student with mental retardation) of a stereotyped group (e.g., mentally retarded, slow learners,students with cognitive disabilities) on stereotyped dimensions (Biernat, 2003). For example, giventhe stereotype that students with mental retardation are “slower learners” than students of normalintelligence, one is likely to judge the learning capability of a particular student with mentalretardation relative to (lower) standards for students with mental retardation and, the learning abilityof a particular nonretarded student relative to (higher) standards of competence for nonretardedstudents. These withincategory academic competence evaluations of students with and withoutmental retardation “may not be directly comparable, as their meaning is tied to different referents”(Biernat, 2003, p. 1019). “Good” does not mean the same thing for the student with mentalretardation and the student of normal intelligence. Implicit in this example (as well as many otherexamples: men vs. woman, white vs. nonwhite, etc.) is that standards may shift due to thesubjectivity of language. Or, as summarized by Biernat (2003), “such adjectival evaluations have nofixed ties to reality, a point Humpty Dumpty makes in Lewis Carroll’s Through the Looking Glass:‘When I use a word, it means just what I choose it to mean’”(p. 1019).
In contrast, crosscategory evaluations and judgments imply the use of a commonrule scale thatmaintains its meaning across contexts. Many commonrule scales are used to make absolute crosscategory evaluations in education—standardized test scales, grades, class ranks. Commonrule basedevaluations typically produce assimilative stereotype effects (e.g., students with mental retardation, asa group, are expected to score lower on achievement tests than students with normal intelligence).However, because the subjectivity of language may carry withincategory meaning, other (contrast)stereotype effects may be masked or hidden (although operating on individual behavior).
Probably the most pernicious masked effect of the shifting standards model is that “evidentiarystandards are lower for members of the group stereotyped as deficient on an attribute” (Biernat,2003, p. 1022). When an individual (e.g., student with mental retardation) is a member of a groupthat is stereotyped as deficient on a trait or attribute (i.e., intelligence), evidentiary standards orexpectations are often shifted in the direction of leniency, less challenge, and minimal competencies.The shift of evidentiary standards, in turn, often produces behavior in the evaluator in the oppositedirection of the stereotype. This shifting of standards “activates low (patronizing) minimizingstandards that are more readily surpassed, producing a subjective sense of positivity—a ‘wow’ effect.That this positivity is not borne out in outcomes that matter for the target (getting a job or the keyfielding position) suggests that the favorable treatment is more apparent and ephemeral than real”(Biernat, 2003, p. 1025). The essence of this phenomna is captured in the words of Alexa Pochowski,the assistant commissioner for learning services in the Kansas education department, who wasrecently quoted in Education Week as saying:
For too long, we held these students to lower standards…I hate to say it: I think we almostfelt sorry for them.” (Olson, 2004, p. 13)
Support for the negative impact of the potential downshifting in evidentiary standards andexpectations (and, conversely, for the positive impact of more demanding standards andexpectations) was also reported by Pochowski in Education Week (Olson, 2004). After changing statestandards and requirements so that most students in special education participated in stateassessments, the state of Kansas reported that the percent of fifth graders with disabilities who wereproficient in reading increased from 26% in 2000 to nearly 50% in 2003. In math, fourth graders withdisabilities increased in proficiency from 36% to 58% over a four year period.
In summary, for students with cognitive disabilities, expectancy effects can be viewed as a form ofstandardsbased stereotyping. This stereotyping can either produce direct (assimilative) orindirect “hidden” stereotyping effects, both of which can exert negative influences on academicperformance. The silent, subjective shifting (towards lower) evidentiary academic standards (forstudents with disabilities) represents a subtle, yet potentially potent force operating against the goalof “leaving no child behind.”
Education Expectations: Caveats and Concerns
Teachers, like all humans, develop personal beliefs, opinions, and stereotypes. During most teacherpreparation programs, educators are taught to become aware of potential expectancy effects and howto control their overt daytoday teaching behavior to be more equitable, and to refrain fromdispensing differential praise and criticism (Babad, 1993).
Given the popularity of the expectancy effects and selffulfilling prophesies in the educational andpsychological research and popular press, one could be led to believe that these negative influencesare pandemic in school classrooms. This is not the case. Although some researchers have concludedthat differential treatment of students is widespread, most researchers have concluded that themajority of educators (particularly experienced teachers and teachers who are very familiar with theirstudents) form expectations based on the initial available information and “tweak” or adjust theirexpectations and instruction based on changes in student performance.
It is inappropriate to infer that the majority of educators are biased simply because they may holddifferential expectations for some students. Often, differential treatment of students represents theappropriate implementation of individualized adaptive instruction responsive to the individualdifferences in a classroom. That being said, the primary concern from this body of literature is that:
a minority of teachers do: (1) hold unjustifiably low expectations for student achievementon the basis of factors such as race, gender, or socioeconomic status, which have nothingto do with learning potential; or (2) form initial expectations based on appropriate data,but then hold to these expectations so rigidly that changes in student skill or motivationlevels are not noted or addressed. (Cotton, 2001, ¶ 32)
It is important to note that educators who may hold inappropriately low expectations for somestudents “are rarely acting out of malice; indeed, they are often not even aware that their lowexpectations have developed based on specious reasoning” (Cotton, 2001, ¶ 33).
Nevertheless, the literature raises numerous issues that are directly relevant to today’s educationalcontext for students with disabilities in which both IDEA and NCLB are requiring improvedperformance. Particularly for those students with cognitive disabilities, the information on expectancyeffects should cause us much concern. Is it possible that expectancy effects have been holdingstudents back in the past? Are we under the influence of silently shifting standards—especially for
students with cognitive disabilities? These and other questions are ones that states, districts, schools,administrators, and teachers need to ask themselves and others—as our nation strives to improve theperformance of all of its students, including those with disabilities and specifically, those withcognitive disabilities.
References
Aronson, J. (2002). Stereotype threat: Contending and coping with unnerving expectations. In J.Aronson (Ed.), Improving academic achievement: Impact of psychological factors on education (pp.279301). San Diego, CA: Academic Press.
Aronson, J., Quinn, D. M., & Spencer, S. J. (1998). Stereotype threat and the academicunderperformance of minorities and women. In J.K. Swim, & C. Stangor (Eds.), Prejudice: Thetarget’s perspective (pp. 83103).
Babad, E. (1990). Measuring and changing teachers’ differential behavior as perceived by studentsand teachers. Journal of Educational Psychology, 82, 683690.
Babad, E. (1993). Pygmalion: 25 years after interpersonal expectations in the classroom. In P. D.Blanck (Ed.), Interpersonal expectations: Theory, research, and applications. Studies in emotionand social interaction (pp. 125153).
Babad, E., Bernieri, F., &American Educational Research Journal, 28 Rosenthal, R. (1991). Studentsas judges of teachers’ verbal and nonverbal behavior. , 211234.
BeirneSmith, M., Ittenbach, R. F., & Patton, J. R. (1998). Mental Retardation (5th ed.). New Jersey:Simon & Schuster. Biernat, M. (2003). Toward a broader view of social stereotyping. American Psychologist, 58(12),10191027.
Board of Education of the Hendrick Hudson Central School District v. Rowley, 458 U.S.C. 192 (1982).
Bröder, A. (2003). Decision making with the ‘‘adaptive toolbox’’: Influence of environmentalstructure, intelligence, and working memory load. Journal of Experimental Psychology LearningMemory and Cognition, 29(4), 611625.
Brophy, J. (1983). Research on the selffulfilling prophecy and teacher expectations. Journal ofEducational Psychology, 75, 631661.
Burt, C. (1911). Experimental tests of higher mental processes and their relation to generalintelligence. Journal of Experimental Pedagogy and Training, 1, 93112.
Carr, M., & KurtzCoates, B. E. (1994). Is being smart everything? The influence of studentachievement on teachers’ perceptions. British Journal of Educational Psychology, 64(2), 263276.
Carroll, L. (1994). Through the looking glass. New York: Penguin Classics.
Cecil, N. L. (1988). Black Dialect and Academic Success: A Study of Teacher Expectations. ReadingImprovement, 25, 3438.
Clark, M. D. (1997). Teacher response to learning disability: A test of attributional principles. Journal
of Learning Disabilities, 30(1), 6979.
Connell, J. P., & Ilardi, B. C. (1987). Selfsystem concomitants of discrepancies between children’s andteachers’ evaluations of academic competence. Child Development, 58, 12971307.
Cooper, H., & Good, T. (1983). Pygmalion grows up. New York: Longman.
Cotton, K. (1999). Research you can use to improve results. Portland, OR: Northwest RegionalEducational Library.
Cotton, K. (2001, January). Expectations and student outcomes. Retrieved fromhttp://www.nwrel.org/scpd/sirs/4/cu7.html
Dusek, J. B., & Joseph, G. (1983). The bases of teacher expectancies: A metaanalysis. Journal ofEducational Psychology, 75, 327346.
Dweck, C. S., & Leggett, E. L. (1988). A socialcognitive approach to motivation and personality.Psychological Review, 95, 256273.
Eccles, J. S. (1988). Achievement beliefs and the environment. Michigan Study of Adolescent LifeTransitions. Bethesda, MD: National Institute of Child Health and Development (National Institute ofHealth).
Education for All Handicapped Children Act (EHA) of 1975 (PL 94142) 20 U.S.C. §1400 et seq.
Elashoff, J. D., & Snow, R. E. (1971). Pygmalion reconsidered: A case study in statistical inference:Reconsideration of the RosenthalJacobson data on teacher expectancy. Worthington, OH: CharlesA. Jones.
Embretson, S. E. (1996). The new rules of measurement. Psychological Assessment, 8(4), 341349.
Gaines, M. L., & Davis, M. (1990). Accuracy of teacher prediction of elementary studentachievement. Paper presented at the annual meeting of the American Educational ResearchAssociation Boston, MA.
Gottfredson, D. C., Marciniak, E. M., Birdseye, A. T., & Gottfredson, G. D. (1995). Increasing teacherexpectations for student achievement. Journal of Educational Research, 88(3), 155163.
Gozali, J., & Meyen, E. L. (1970). The influence of the teacher expectancy phenomenon on theacademic performances of educable mentally retarded pupils in special classes. Journal of SpecialEducation, 4, 417424.
Graham, S. (1990). The role of production factors in learning disabled students’ compositions 82(4),781791.
Graham, S. (1991). A review of attribution theory in educational contexts. Educational PsychologyReview, 3, 59.
Harris, M. J., Milich, R., Corbitt, E. M., & Hoover, D. W. (1992). Selffulfilling effects of stigmatizinginformation on children’s social interactions. Journal of Personality and Social Psychology, 63(1),4150.
Graham, S., & Weiner, B. (1986). From attribution theory to developmental psychology: A roundtrip
ticket? Social Cognition, 4, 152179.
HauserCram, P., Sirin, S. R., & Stipek, D. (2003). When teachers’ and parents’ values differ:Teachers’ ratings of academic competence in children from lowincome families. Journal ofEducational Psychology, 95(4), 813820.
Improving the Academic Achievement of the Disadvantaged; Final Rule, 68 Fed. Reg. 68,699 (Dec. 9,2003) (to be codified as 34 C.F.R. § 200 et seq.).
Individuals with Disabilities Education Act (IDEA) Amendments of 1990 (PL 101476), 20 U.S.C.S. §1400 et seq.
Individuals with Disabilities Education Act (IDEA) Amendments of 1997 (PL 10517), 20 U.S.C.S. §1400 et seq.
Itskowitz, R., Navon, R., & Strauss, H. (1988). Teachers’ accuracy in evaluating students’ selfimage:Effect of perceived closeness. Journal of Educational Psychology, 80, 337341.
Jussim, L., Madon, S., & Chatman, C. (1991). Teacher expectations and student achievement: Selffulfilling prophecies, biases, and accuracy. L. Heath, & R. S. Tindale (Eds.), Applications of heuristicsand biases to social issues (pp. 303334).
Jussim, L. J., Madon, S., & Chatman, C. (1994). Teacher expectations and student achievement: Selffulfilling prophecies, biases, and accuracy. In L. Heath, & R. S. Tindale (Eds.), Applications ofheuristics and biases to social issues (pp. 303334). New York, NY: Plenum Press.
Jussim, L. J., & Eccles, J. (1995). Are teacher expectations biased by students’ gender, social class, orethnicity? In Y.T. Lee, & L. J. Jussim (Eds.), Stereotype accuracy: Toward appreciating groupdifferences (pp. 245271). Washington, D.C.: American Psychological Association.
Kenealy, P., Neil, F., & Shaw, W. (1988). Influences of children’s physical attractiveness on teacherexpectations. The Journal of Social Psychology, 128(3), 373383.
Lee, K. (1996). A study of teacher responses based on their conceptions of intelligence. Journal ofClassroom Interaction, 31(2), 112.
Madon, S., Jussim, L., & Eccles, J. (1997). In search of the powerful selffulfilling prophecy. Journalof Personality & Social Psychology, 72(4), 791809.
McGrew, K. M., Johnson, D., Cosio, A., & Evans, J. J. (2004). Increasing the chance of no child beingleft behind: Beyond cognitive and achievement abilities. Minneapolis, MN: Institute on CommunityIntegration, University of Minnesota.
Mercer, J. R. (1973). The pluralistic assessment project: Sociocultural effects in clinical assessment.School Psychology Digest, 2, 1018.
Merton, R. K. (1948). The selffulfilling prophecy. Antioch Review, 8, 193210.
Miller, C. T., Clarke, R. T., Malcarne, V. L., & Lobato, D. (1991). Expectations and social interactionsof children with and without mental retardation. Journal of Special Education, 24(4), 454472.
Neisser, U. (1995). Criteria for an ecological self. In P. Rochat (Ed.), The self in infancy: Theory andresearch. Advances in psychology (Vol. xiv, pp. 1734). Amsterdam, Netherlands: North
Holland/Elsevier Science Publ.
Neisser, U., Boodoo, G., Bouchard, T. J. Jr., Boykin, A. W., Brody, N., Ceci, S. J., Halpern, D. F.,Loehlin, J. C., Perloff, R., Sternberg, R. J., & Urbina, S. (1996). Intelligence: Knowns and unknowns.American Psychologist, 51(2), 77101.
No Child Left Behind Act (NCLB) of 2001 (PL 107110), 20 U.S.C. § 1000 et seq
Olson, L. (2004). Enveloping expectations. Education Week (Quality Counts), 23(17), 821.
Perkins, D., Tishman, S., Ritchhart, R., Donis, K., & Andrade, A. (2000). Intelligence in the wild: Adispositional view of intellectual traits. Educational Psychology Review, 12(3), 269293.
Raudenbush, S. W. (1984). Magnitude of teacher expectancy effects on pupil IQ as a function of thecredibility of expectancy induction: A synthesis of findings from 18 experiments. Journal ofEducational Psychology, 76, 8597.
Raudenbush, S. W., Rowan, B., & Cheong, Y. F. (1993). Higher order instructional goals in secondaryschool: Class, teacher and school influences. American Educational Research Journal, 30 (3), 523553.
Reynolds, A. J., & Walberg, H. J. (1992). A structural model of science achievement and attitude: Anextension to high school. Journal of Educational Psychology, 84(3), 371382.
Reschly, D. J. (1988). Assessment issues, placement litigation, and the future of mild mentalretardation classification and programming. Education and Training in Mental Retardation, 23,285301.
Reschly, D. J., & Grimes, J. P. (1992). State department and university cooperation: Evaluation ofcontinuing education in consultation and curriculumbased assessment. School Psychology Review,20(4), 522529.
Rist, R., & Harrell, J. E. (1982). Labeling the learning disabled child: The social ecology of educationalpractice. American Journal of Othopsychiatry, 52, 146160.
Rosenthal, R., & Jacobson, L. (1966). Teachers’ expectancies: Determinants of pupils’ IQ gains.Psychological Reports, 1, 115118.
Rosenthal, R. K., & Jacobson, L. (1968a). Pygmalion in the classroom: Teacher expectation andpupils’ intellectual development. New York: Holt, Rinehart & Winston.
Rosenthal, R., & Jacobson, L. F. (1968b). Teacher expectations for the disadvantaged. ScientificAmerican, 218(4).
Rosenthal, R., & Rubin, D. B. (1978). Interpersonal expectancy effects: The first 345 studies.Behavioral and Brain Sciences, 1, 377386.
Rothlisberg, B. A., Hill, R., & D’Amato, R. C. (1994). Social acceptance by their peers of children withmental retardation. Psychological Reports, 74(1), 239242.
Seaver, W. B. (1973). Effects of naturallyinduced teacher expectancies. Journal of Personality andSocial Psychology, 28, 333342.

Smith, A. E., Jussim, L., Eccles, J., VanNoy, M., Madon, S., & Palumbo, P. (1998). Selffulfillingprophecies, perceptual biases, and accuracy at the individual and group levels. Journal ofExperimental & Social Psychology, 34(6), 530561.
Spitz, H. H. (1999). Beleaguered Pygmalion: A history of the controversy over claims that teacherexpectancy raises intelligence. Intelligence, 27(3), 199234.
Steele, C. M., & Aronson, J. (1995). Stereotype threat and the intellectual test performance of AfricanAmericans. Journal of Personality and Social Psychology, 69, 797811.
Thurlow, M. L., Christensen, S., & Ysseldyke, J. E. (1983). Referral research: An integrativesummary of findings. Minneapolis, MN: University of Minnesota Research Report No. 141.
Thurlow, M., & Wiley, H. I. (2004). Almost there in public reporting of assessment results forstudents with disabilities (Technical Report 39). Minneapolis, MN: University of Minnesota, NationalCenter on Educational Outcomes.
VanOudenhoven, J. P. (1985). Evaluative feedback as a determinant of the Pygmalion effect.Psychological Reports, 57(3, part 1), 755761.
Walberg, H. J., Fraser, B. J., & Welch, W. W. (1986). A test of a model of educational productivityamong senior high school students. Journal of Educational Research, 79(3), 133139.
Weiner, B. (1979). A theory of motivation for some classroom experiences. Journal of EducationalPsychology, 71, 325.
Weiner, B. (1985). An attributional theory of achievement motivation and emotion. PsychologicalReview, 92, 548573.
Weiner, B. (1986). An attributional theory of motivation and emotion. New York: Springer Verlag.
Weiner, B. (1993). On sin versus sickness: A theory of perceived responsibility and social motivation.American Psychologist, 48, 957965.
Weinstein, R. (1985). Student mediation of classroom expectancy effects. In J. Dusek (Ed.), Teacherexpectancies (pp. 329350). Hillsdale, NJ: Erlbaum.
Williams, J. H., & Muehl, S. (1978). Relations among students and teacher perceptions of behavior.Journal of Negro Education, 47, 328336.
Wineburg, S. S. (1987). Does research count in the lives of behavioral scientists? EducationalResearcher, 16(9), 4244.
Woodcock, R. W., McGrew, K. S., & Mather, N. (2001). WoodcockJohnson III. Itasca, IL: RiversidePublishing.
Yeates, K. O., & Weisz, J. R. (1985). On being called “mentally retarded”: Do developmental andprofessional perspectives limit labeling effects? American Journal of Mental Deficiency, 90(3), 349352.
Ysseldyke, J. E., & Foster, G. G. (1978). Bias in teachers’ observations of emotionally disturbed andlearning disabled children. Exceptional Children, 44, 613615.

Zohar, A., Degani, A., & Vaaknin, E. (2001). Teachers’ beliefs about lowachieving students and higherorder thinking. Teaching and Teacher Education, 17, 469485.
Zuroff, D. C., & Rotter, J. B. (1985). A history of the expectancy concept in psychology. In J.B. Dusek(Ed.), Teacher expectancies (pp. 936). Hillsdale, NJ: Erlbaum.
© 2013 by the Regents of the University of Minnesota. The University of Minnesota is an equal opportunity educator and employer.
Online Privacy StatementThis page was last updated on January 03, 2013
NCEO is supported primarily through a Cooperative Agreement (#H326G050007, #H326G110002) with the Research to Practice Division, Office of SpecialEducation Programs, U.S. Department of Education. Additional support for targeted projects, including those on LEP students, is provided by other federal andstate agencies. Opinions expressed in this Web site do not necessarily reflect those of the U.S. Department of Education or Offices within it.