expansion of industrial plantations continues to threaten
TRANSCRIPT
remote sensing
Article
Expansion of Industrial Plantations Continues toThreaten Malayan Tiger Habitat
Varada S Shevade 1 Peter V Potapov 1 Nancy L Harris 2 and Tatiana V Loboda 1
1 Department of Geographical Sciences University of Maryland College Park MD 20742 USApotapovumdedu (PVP) lobodaumdedu (TVL)
2 World Resources Institute 10 G Street NE Suite 800 Washington DC 20002 USA nharriswriorg Correspondence vshevadeterpmailumdedu
Received 28 May 2017 Accepted 5 July 2017 Published 19 July 2017
Abstract Southeast Asia has some of the highest deforestation rates globally with Malaysia beingidentified as a deforestation hotspot The Malayan tiger a critically endangered subspecies of the tigerendemic to Peninsular Malaysia is threatened by habitat loss and fragmentation In this study weestimate the natural forest loss and conversion to plantations in Peninsular Malaysia and specificallyin its tiger habitat between 1988 and 2012 using the Landsat data archive We estimate a total loss of135 Mha of natural forest area within Peninsular Malaysia over the entire study period with 083 Mhalost within the tiger habitat Nearly half (48) of the natural forest loss area represents conversionto tree plantations The annual area of new plantation establishment from natural forest conversionincreased from 20 thousand ha yearminus1 during 1988ndash2000 to 34 thousand ha yearminus1 during 2001ndash2012Large-scale industrial plantations primarily those of oil palm as well as recently cleared landconstitute 80 of forest converted to plantations since 1988 We conclude that industrial plantationexpansion has been a persistent threat to natural forests within the Malayan tiger habitat Expandingoil palm plantations dominate forest conversions while those for rubber are an emerging threat
Keywords Peninsular Malaysia tiger habitat forest loss plantations oil palm rubber
1 Introduction
Malaysia is a megadiverse country [1] and is a part of the Southeast Asian biodiversity hotspot [2]The Malayan tiger Panthera tigris jacksoni is endemic to Peninsular Malaysia and is threatened byhabitat loss in addition to poaching and the illegal trade of tiger parts hunting of tiger prey andretaliatory killings arising from human-wildlife conflicts [3] Following recent reports of a decline inPeninsular Malaysiarsquos tiger population the Malayan tiger is now classified by the International Unionfor Conservation of Nature (IUCN) as a critically endangered species ie a species facing an extremelyhigh risk of extinction in the wild [3] Current estimates suggest a likely population of 250ndash340 adulttigers and an effective breeding population of 80ndash120 tigers indicating a greater than 25 decline inone generation (equivalent to seven years) [3] Additionally repeated population studies at a couple ofsites indicate a 50 and 90 decline in tiger density estimates [3]
Increasing human population in addition to agricultural and infrastructure developmenthave resulted in the reduction of wildland extent forcing tigers to survive in human-dominatedlandscapes [4] Asian countries have the highest population densities in forested areas and a longhistory of agricultural development [5] Southeast Asia has some of the highest deforestation ratesglobally [6] and has a large proportion of cultivatedagricultural land under tree plantations [5]Peninsular Malaysia has a long history of land cover and land use change Expanding agricultureespecially rubber (Hevea brasiliensis) and oil palm (Elaeis guineensis) plantations has been historicallyresponsible for forest reduction in the region [7ndash10] Rubber plantations in Peninsular Malaysia firstappeared in the 1880s [11] and expanded rapidly after a surge in rubber prices during 1905ndash1910 [12]
Remote Sens 2017 9 747 doi103390rs9070747 wwwmdpicomjournalremotesensing
Remote Sens 2017 9 747 2 of 14
Oil palm plantations appeared in Malaysia as early as 1917 [13] and with a drop in rubber prices in the1960s commercial oil palm plantations started replacing those of rubber [12] By the 1940s PeninsularMalaysiarsquos west coastal region was already heavily deforested It had lost half of its original forest areaby the late 1980s while agricultural land had expanded from an estimated 21 to 35 of the land areabetween 1966 and 1982 [14] Agricultural expansion and oil palm production are considered significantthreats to biodiversity and tiger habitat in Peninsular Malaysia [615]
Historically tigers inhabited all forest areas of Peninsular Malaysia [16] Currently mostbreeding tiger populations are restricted to protected areas due to intensive human pressure [17]Rapidly growing economies and expanding markets have put greater pressure on the remaining tigerhabitats [4] As a commitment to doubling wild tiger numbers by 2022 tiger-range countries adoptedthe Global Tiger Recovery Program (GTRP) [18] Under the GTRP Malaysiarsquos National Tiger RecoveryProgram (NTRP) will focus on its National Tiger Recovery Priorities and the tiger recovery strategydescribed in its National Tiger Conservation Action Plan (NTCAP) [19] which has identified thelsquonet loss and gain of forestsrsquo as an indicator for monitoring conservation actions along with otherindicators like tiger occupancy (presence or absence of species at sites within the study area) preyand tiger densities and the use of corridors by tigers [20] While collecting data for most of theseindicators is costly and time consuming monitoring habitats using remotely sensed data may beachieved with minimal investments Remote sensing is an effective tool for change assessment andthe repeatable monitoring of large and remote tracts of land Various remotely sensed datasets havebeen specifically generated to estimate the spatial extent of forest cover and forest loss from regionalto global scales [21ndash25] Landsatrsquos 30 m spatial resolution allows mapping at a scale congruent withmost human activity [25] The Landsat program also features the longest data archive suitable formulti-decadal regional change assessments [26] Remotely sensed forest and forest change productsoften use a biophysical forest definition which includes forestry dynamics and plantation cycles in thequantification of forest and forest loss area [2427] Natural forests and tree plantations offer a differentsuitability as tiger habitats Plantations like those of oil palm have a uniform tree-age structure [13]support fewer species than primary logged or disturbed forests [1328] or even degraded forests [29]and provide poor habitat for tigers [30] Additionally agricultural expansion also impacts tigersthrough access for poaching disruption of connectivity for movement and dispersal and by increasinghuman-tiger conflicts [15] Hence it is important to separate natural forests from plantations whenassessing forest dynamics in the context of tiger habitat
Some studies providing forest loss estimates for Malaysia [1031] use national land use datacompiled by the Food and Agriculture Organization of the United Nations (FAO) or other sources anddo not distinguish between Peninsular Malaysia and Malaysian Borneo which have very differentland cover and land use change dynamics This is partly due to the autonomy of states to make landand forest resource decisions [1532] Previous studies providing forest loss estimates for PeninsularMalaysia [2333] do not focus on tiger habitat and only a recent study by [17] assessed forest loss withinthe global priority tiger conservation landscapes (TCLs) across all tiger-range countries identifyingMalaysiarsquos Taman-Negara-Belum as a TCL with some of the highest forest loss during 2001ndash2014
Given the history of land cover changes in Peninsular Malaysia and the role of plantations in landuse conversion it is important to assess the drivers of forest loss in the region and to quantify the roleof plantation expansion In this study we assess recent forest dynamics in Peninsular Malaysia andconsidering the Malayan tiger as an example of Malaysiarsquos endangered and threatened megafauna wespecifically focus on forest dynamics within Malaysiarsquos tiger landscapes The overarching goal for thisstudy was to quantify the area of natural forest loss and conversion to plantations between 1988 and2012 within Malaysiarsquos tiger habitat The specific objectives of this study were (1) to map PeninsularMalaysiarsquos natural forest in 1988 as a proxy for potential tiger habitat (2) map and quantify naturalforest loss between 1988 and 2012 in Peninsular Malaysia and its tiger habitat and (3) quantify theproportion of the total forest and tiger habitat loss converted to plantations
Remote Sens 2017 9 747 3 of 14
2 Materials and Methods
21 Study Area
Peninsular Malaysia lies on the Malay Peninsula and is bordered by Thailand in the North andSingapore in the South It occupies an area of 132 million ha (Figure 1) The region is equatorialwith influences of the southwest monsoon from May to September and the northeast monsoon fromOctober to March Average day temperatures are around 32 C and average precipitation is around2550 mm with a maximum rainfall of more than 5000 mm on exposed mountains [34] Coastal plainsand lowlands dominate regional topography below a 300 m elevation [34] which are covered withmangroves and peat swamp forests along the coast and lowland dipterocarp forests further inland [35]Mountain ranges dominate the northern and central-western parts of the country [34] Hill and upperdipterocarp forests are found between 300ndash750 m and 750ndash1200 m above sea level respectively whilemontane-oak forests are found between 1200ndash1500 m [35] About 51 of Peninsular Malaysia hasa suitable habitat for tigers however only 29 of its area is considered to have good conservationvalue based on evidence of tiger presence [20] Protected areas represent only 15 of the tiger habitatarea [20] Tiger habitat for the purpose of this study is restricted to Peninsular Malaysiarsquos TigerConservation Landscapes (TCLs) (Figure 1) which include areas with a potential effective habitat andconfirmed tiger occurrence during the preceding years and no knowledge of tiger extirpation [36]
Remote Sens 2017 9 747 3 of 14
2 Materials and Methods
21 Study Area
Peninsular Malaysia lies on the Malay Peninsula and is bordered by Thailand in the North and Singapore in the South It occupies an area of 132 million ha (Figure 1) The region is equatorial with influences of the southwest monsoon from May to September and the northeast monsoon from October to March Average day temperatures are around 32 degC and average precipitation is around 2550 mm with a maximum rainfall of more than 5000 mm on exposed mountains [34] Coastal plains and lowlands dominate regional topography below a 300 m elevation [34] which are covered with mangroves and peat swamp forests along the coast and lowland dipterocarp forests further inland [35] Mountain ranges dominate the northern and central-western parts of the country [34] Hill and upper dipterocarp forests are found between 300ndash750 m and 750ndash1200 m above sea level respectively while montane-oak forests are found between 1200ndash1500 m [35] About 51 of Peninsular Malaysia has a suitable habitat for tigers however only 29 of its area is considered to have good conservation value based on evidence of tiger presence [20] Protected areas represent only 15 of the tiger habitat area [20] Tiger habitat for the purpose of this study is restricted to Peninsular Malaysiarsquos Tiger Conservation Landscapes (TCLs) (Figure 1) which include areas with a potential effective habitat and confirmed tiger occurrence during the preceding years and no knowledge of tiger extirpation [36]
Figure 1 Study area in Peninsular Malaysia showing the Tiger Conservation Landscapes (TCL) [36] percent tree cover for year 2000 [24] and protected areas from the World Database on Protected Areas (WDPA) [37]
Figure 1 Study area in Peninsular Malaysia showing the Tiger Conservation Landscapes (TCL) [36]percent tree cover for year 2000 [24] and protected areas from the World Database on Protected Areas(WDPA) [37]
Remote Sens 2017 9 747 4 of 14
22 Overview
Natural forests are defined as mature naturally regenerated forests that have a minimum areaof 5 ha and have not been completely cleared or replanted in recent history although some signs ofdisturbance like selective logging might be present [27] Natural forest loss includes tree removal dueto logging as well as land use conversion (from agriculture and plantation expansion infrastructuredevelopment etc) To quantify natural forest loss we (1) mapped the natural forest extent forthe year 1988 (2) applied a change detection model to map forest loss between 1988 and 2000 and(3) aggregated the pre-year 2000 forest loss with the existing published Landsat-based Global ForestChange (GFC) tree cover loss product for 2001ndash2012 [24] and assessed the loss within mapped naturalforests (Figure 2) We then overlaid the plantation map obtained from [38] with the 1988ndash2012 naturalforest loss map to estimate the role of plantations in the overall forest loss PCI Geomatica softwarewas used for generating training samples for natural forest and forest loss mapping while ArcGIS wasused for the analysis of forest loss and conversion to plantations
Remote Sens 2017 9 747 4 of 14
22 Overview
Natural forests are defined as mature naturally regenerated forests that have a minimum area of 5 ha and have not been completely cleared or replanted in recent history although some signs of disturbance like selective logging might be present [27] Natural forest loss includes tree removal due to logging as well as land use conversion (from agriculture and plantation expansion infrastructure development etc) To quantify natural forest loss we (1) mapped the natural forest extent for the year 1988 (2) applied a change detection model to map forest loss between 1988 and 2000 and (3) aggregated the pre-year 2000 forest loss with the existing published Landsat-based Global Forest Change (GFC) tree cover loss product for 2001ndash2012 [24] and assessed the loss within mapped natural forests (Figure 2) We then overlaid the plantation map obtained from [38] with the 1988ndash2012 natural forest loss map to estimate the role of plantations in the overall forest loss PCI Geomatica software was used for generating training samples for natural forest and forest loss mapping while ArcGIS was used for the analysis of forest loss and conversion to plantations
Figure 2 Methodology used to map natural forest natural forest loss and plantation expansion
23 Data
We analyzed the entire archive of Landsat 5 Thematic Mapper (TM) and Landsat 7 Enhanced Thematic Mapper (ETM+) images available for the region from 1988 to 2002 The region is covered by 20 WRS-2 footprints The entire archive of available imagery consisting of 1110 processing Level 1 terrain corrected (L1T) images was employed The number of images used from the different Landsat sensors is listed in Table S1 Landsat imagery processing followed the methodology of [24] and is described in detail in [39] where per-pixel raw digital numbers were converted to top of atmosphere reflectance screened for cloudshadowhazewater and following quality assessment were radiometrically normalized and composited into a single clear-surface layer Screening and quality assessment involved using decision tree models to predict the presence of cloud shadow and water to obtain the per-pixel probability of contamination by these features [2439] The observation
Figure 2 Methodology used to map natural forest natural forest loss and plantation expansion
23 Data
We analyzed the entire archive of Landsat 5 Thematic Mapper (TM) and Landsat 7 EnhancedThematic Mapper (ETM+) images available for the region from 1988 to 2002 The region is coveredby 20 WRS-2 footprints The entire archive of available imagery consisting of 1110 processingLevel 1 terrain corrected (L1T) images was employed The number of images used from the differentLandsat sensors is listed in Table S1 Landsat imagery processing followed the methodology of [24]and is described in detail in [39] where per-pixel raw digital numbers were converted to top ofatmosphere reflectance screened for cloudshadowhazewater and following quality assessmentwere radiometrically normalized and composited into a single clear-surface layer Screening and
Remote Sens 2017 9 747 5 of 14
quality assessment involved using decision tree models to predict the presence of cloud shadow andwater to obtain the per-pixel probability of contamination by these features [2439] The observationquality of pixels was recorded and pixels with a high probability of contamination were thenexcluded from processing [2439] Normalization was carried out using Moderate Resolution ImagingSpectroradiometer (MODIS) derived surface reflectance products as normalization targets in order toreduce the variations in reflectance resulting from differences in image dates atmospheric conditionsand surface anisotropy [39] As Peninsular Malaysia is a part of the humid tropics images from theentire year were used for multi-date image compositing in order to generate start or end date (1988or 2000) cloud-free image mosaics using only pixels with the highest quality observations [39] Dueto limited image availability and the very high incidence of cloud cover in this region clear surfaceobservations from adjacent years were used to fill the gaps in both the image composites For theldquocirca 1988rdquo composite 71 of the pixels used were from the 1988ndash1990 interval and for the ldquocirca2000rdquo composite 99 of the pixels used were from the 1999ndash2001 interval
All processed per-pixel cloud-free observations between the earliest observation for the start year(1988) and the latest observation for the last year (2000) were used to create a set of multi-temporalmetrics that was used for natural forest mapping and forest loss detection (Table 1) This multi-temporalmetric set was developed following the methods described in [243940] using two approaches(1) time-sequential reflectance observations by date and (2) ranked (low to high) band reflectancevalues or ranked observations corresponding to the ranked normalized difference vegetation index(NDVI) [41] normalized difference water index (NDWI) [42] values and thermalinfrared band valuesIn addition to the startend date cloud-free image mosaics the means and medians of the first threeobservations and last three observations the maximal values of time-sequential reflectance gain andloss and the slope of linear regression of reflectanceindex values and observation date [2440] weregenerated For the rank-based metrics a set of percentile values and symmetrical and asymmetricalaverages for various percentile range intervals were used [2440] On average about 16 cloud-freeobservations were available per-pixel for the calculation of metrics The first (circa 1988) and last (circa2000) cloud-free image composites along with the mediansmeans of the first three and last threeobservations were used for visual interpretation to generate training samples for mapping
Table 1 Overview of the different multi-temporal metrics used for classification and mapping
Types of Metrics Multi-Temporal Metrics
Image Composites1 First and last cloud-free observations2 Mean and Median of first 3 observations3 Mean and Median of last 3 observations
Rank-based Metrics
1 Percentiles representing minimum 10 25 50 75 90 and maximum for bandreflectance or index (NDVI NDWI) values2 Symmetrical averages for various intervals minimumndashmaximum 10ndash90 25ndash753 Asymmetrical averages for various intervals minimumndash10 10ndash25 25ndash50 50ndash7575ndash90 90-maximum
Trend Analysis Metrics1 Slope of linear regression of band reflectance versus image date2 Standard deviation of band reflectance 1988ndash20003 Maximum lossgain of reflectanceindex value between consecutive observations
We used the GFC tree cover loss product [24] for the years 2001ndash2012 to extend our 1988ndash2000forest loss map This product maps the loss of tree cover taller than 5 m at a resolution equivalent toLandsat data To estimate forest loss converted to plantations we used a plantation map generatedfor Peninsular Malaysia by the World Resources Institute (WRI) [38] This product maps plantationareas in 2014 categorized into large industrial-sized plantations medium-sized and small-sizedmosaic plantations and recently cleared or young plantation classes Large industrial plantations aremonocultures with species information associated with plantation areas while mosaic plantationsinclude some non-plantation areas like other agriculture forest patches and settlements interspersedwith plantations
Remote Sens 2017 9 747 6 of 14
24 Natural Forest Mapping
The 1988 Landsat image mosaic was visually interpreted to determine the training samples fornatural forest (dependent variable) versus all other land cover types The natural forest classificationtraining sample consisted of more than 450000 training pixels Multi-temporal metrics (Table 1) wereused as independent variables to build a bagged decision tree model to map natural forest areas [24]While using ldquobaggingrdquo or bootstrap aggregation the data are divided into a test set which is a randomsample drawn from the training population and a learning set which is the remaining portion of thetraining population [43] We used a test set of 20 of the training data and developed output mapsbased on the median class likelihood from the outputs of several trees
Natural forest patch size was restricted to 5 ha [27] and manual editing of the classification resultswas performed [27] to correct for obvious errors like removing older plantations and including someomitted water-logged forest areas along the coast For this study tiger habitat for Peninsular Malaysiais defined as natural forest area within the TCL Tiger habitat and habitat are used interchangeably inthe rest of the paper
25 Forest Loss Mapping
Forest loss is defined as a temporal or permanent reduction in tree cover density [242744]resulting in a complete or almost complete removal of trees within a 30 m Landsat pixel [40] Itcould result from conversion to agricultureplantations intensive logging or natural disturbancesTraining samples for lsquoforest lossrsquo and lsquono lossrsquo between 1988 and 2000 were created after the visualinterpretation of 1988 and 2000 image mosaics and maximum reflectance composites [40] In totalmore than 510000 pixels were used to train the forest loss classification Forest loss during 1988ndash2000(pre-2000) was mapped in one time-step using a decision tree classifier and multi-temporal metricsForest loss during 2001ndash2012 (post-2000) within mapped natural forest areas was extracted from theGFC product Owing to the increased image availability after the year 2000 as opposed to that in the1980s and 1990s we can estimate post-2000 loss at an annual time-step using the GFC product Allforest loss within the mapped 1988 natural forest mask was considered as natural forest loss (Figure 2)As the pre-2000 and post-2000 forest loss is mapped separately in cases of overlap between the twothe loss year (interval) was attributed to the first detected loss event (pre-2000) However as imageryfrom years 2001 and 2002 had been used to gap-fill the 2000 mosaic in instances of overlap betweenmapped pre-2000 loss and the GFC product loss from either year 2001 or 2002 we attributed loss tothe respective post-2000 year Tiger habitat loss was quantified by assessing forest loss within the tigerhabitat area
26 Sample-Based Adjustment of the Area Estimation
Separate sample-based assessments were performed for the newly developed pre-2000 forest lossand the post-2000 forest loss subset from the GFC product following the methodology used by [40]In this approach the strata for sampling were based on lsquonatural forest lossrsquo and lsquono lossrsquo classesfor both the pre-2000 and post-2000 periods For each forest loss period sample pixels were drawnusing a stratified random sampling design Following the ldquogood practicesrdquo suggested by [45] inorder to balance the area estimates and all accuracies we used a sampling design slightly away fromproportional such that rare strata have a sample size slightly greater than proportional allocation Weused Landsat imagery mosaics for 1988 and 2000 along with composites for 1990 and 1995 for visualassessment of the pre-2000 loss validation samples Landsat images where available (Table S2) theminimum annual NDVI and Google Earth imagery were used in addition to the 2000 and 2012 Landsatmosaics for an assessment of the 2001ndash2012 validation samples Following the visual assessment of allsamples an accuracy assessment of the map and sample-based area estimation of mapped classes wasconducted following the method for the land area change estimation described in [46] Additionallywe followed the same procedure to estimate the forest loss area within the tiger habitat separately
Remote Sens 2017 9 747 7 of 14
using only validation samples within the TCL The accuracy of the plantation map is reported in [38]The overall accuracy of the plantation map is 867 while the producerrsquos and userrsquos accuracies were968 and 788 respectively
Our total natural forest loss and habitat loss area estimates were obtained from the sample-basedarea estimation for pre-2000 and post-2000 The error-adjusted area for natural forest and habitatloss within plantations was estimated by using the proportion of mapped loss within plantationsThe error-adjusted estimates for the annual area of natural forest and habitat loss between 2001and 2012 were obtained by disaggregating the post-2000 sample-based area estimate into annual timescales using the yearly proportion of post-2000 natural forest and habitat loss All areas reported inthe paper are based on error-adjusted area estimates unless categorically noted as ldquomapped areardquo orldquomapped lossrdquo
3 Results
31 Natural Forest Extent and Change from 1988ndash2012
The total natural forest area within Peninsular Malaysia in 1988 was estimated as 716 MhaRoughly 65 of the 1988 natural forest area was within the TCL and is considered as tiger habitat forthe remaining analysis The error-adjusted areas for total forest loss and habitat loss along with theirerror estimates are reported in Table 2 Standard errors for pre-2000 and post-2000 sample-based areaestimates were obtained following [46] while the total error for the sample-based area estimate wasobtained following the method for propagation of error suggested by the Intergovernmental Panel onClimate Change (IPCC) Guidelines [47] Our map (Figure 3) underestimates the area of loss and thesample-based area estimates (Table 2) are higher than the mapped loss for both periods (579568 ha forpre-2000 and 565881 ha for post-2000)
By 2012 the total gross forest loss area in Peninsular Malaysia was estimated to be 135 Mha or19 of its 1988 natural forest area (Figure 3 Table 2) The annual rate of loss has increased between thetwo periods from an average of 49281 ha yearminus1 pre-2000 to 63422 ha yearminus1 post-2000 (Figure 4)Using the GFC product we estimated loss at an annual time step for the post-2000 period This annualloss has been increasing since 2001 and reached a peak at 122167 ha in 2012 (Figure 4)
Plantation expansion is responsible for 651757 ha or 48 of the total natural forest loss The meanannual rate of natural forest converted to plantations has increased from 19970 ha yearminus1 pre-2000 to34344 ha yearminus1 post-2000 (Figure 4) The majority of the forest loss converted to plantations (57loss within plantations) was due to the large industrial plantation expansion Recently cleared landconstitutes 17 and 30 of all pre-2000 and post-2000 forest loss within plantations respectivelyBased on the species information associated with large industrial plantations we estimate that oilpalm dominated plantations constitute about 80 of the total forest loss (1988-2000) converted to thiscategory while the proportion of forest loss converted to large rubber plantations has increased from15 pre-2000 to 25 post-2000
Table 2 Sample-based area (Mha) estimates with 95 confidence intervals for pre-2000 and post-2000total natural forest and habitat loss and loss within plantations by 2014
Study Period Total Loss Total Losswithin Plantations Habitat Loss Habitat Loss
within Plantations
Pre-2000 059 plusmn 011 024 plusmn 005 042 plusmn 011 015 plusmn 004Post-2000 076 plusmn 013 041 plusmn 007 041 plusmn 010 023 plusmn 006
Total 135 plusmn 017 065 plusmn 008 083 plusmn 015 038 plusmn 007
Remote Sens 2017 9 747 8 of 14Remote Sens 2017 9 747 8 of 14
Figure 3 Mapped natural forest remaining in 2013 tiger conservation landscape (TCL) and natural forest loss between 1988ndash2000 (pre-2000) and 2001ndash2012 (post-2000)
Figure 4 Sample-based area (thousand ha) estimates for yearly natural forest and habitat loss and annual rates of total natural forest loss for pre-2000 and post-2000 periods Yearly losses are depicted as solid lines while mean annual rates of loss for the pre-2000 and post-2000 periods are average rates of loss for the respective periods depicted as constant dashed lines
0
20
40
60
80
100
120
140
1988
1989
1990
1991
1992
1993
1994
1995
1996
1997
1998
1999
2000
2001
2002
2003
2004
2005
2006
2007
2008
2009
2010
2011
2012
For
est a
nd ti
ger
habi
tat l
oss
in
Tho
usan
ds o
f H
ecta
res
Pre-2000 Mean annual rate of forest loss Yearly natural forest loss
Post-2000 Mean annual rate of forest loss Yearly tiger habitat loss
Figure 3 Mapped natural forest remaining in 2013 tiger conservation landscape (TCL) and naturalforest loss between 1988ndash2000 (pre-2000) and 2001ndash2012 (post-2000)
Remote Sens 2017 9 747 8 of 14
Figure 3 Mapped natural forest remaining in 2013 tiger conservation landscape (TCL) and natural forest loss between 1988ndash2000 (pre-2000) and 2001ndash2012 (post-2000)
Figure 4 Sample-based area (thousand ha) estimates for yearly natural forest and habitat loss and annual rates of total natural forest loss for pre-2000 and post-2000 periods Yearly losses are depicted as solid lines while mean annual rates of loss for the pre-2000 and post-2000 periods are average rates of loss for the respective periods depicted as constant dashed lines
0
20
40
60
80
100
120
140
1988
1989
1990
1991
1992
1993
1994
1995
1996
1997
1998
1999
2000
2001
2002
2003
2004
2005
2006
2007
2008
2009
2010
2011
2012
For
est a
nd ti
ger
habi
tat l
oss
in
Tho
usan
ds o
f H
ecta
res
Pre-2000 Mean annual rate of forest loss Yearly natural forest loss
Post-2000 Mean annual rate of forest loss Yearly tiger habitat loss
Figure 4 Sample-based area (thousand ha) estimates for yearly natural forest and habitat loss andannual rates of total natural forest loss for pre-2000 and post-2000 periods Yearly losses are depictedas solid lines while mean annual rates of loss for the pre-2000 and post-2000 periods are average ratesof loss for the respective periods depicted as constant dashed lines
Remote Sens 2017 9 747 9 of 14
32 Tiger Habitat Loss and Change from 1988ndash2012
A total of 831571 hectares of tiger habitat (18 of 1988 habitat area) have been lost over the entirestudy period The average annual habitat loss pre-2000 and post-2000 has remained nearly the same(34060 ha and 35237 ha respectively) However the annual habitat area lost has been increasing from2001 to 2012 with an estimated 70692 ha lost in the year 2012 (Figure 4)
Approximately 46 of the total habitat loss has been converted to plantations adding 381808 hato Peninsular Malaysiarsquos land under plantations by 2014 The rate of habitat conversion to plantationshas increased from 12309 ha yearminus1 pre-2000 to 19508 ha yearminus1 post-2000 (Table 2) Large industrialplantations constitute the largest fraction (61 of pre-2000 loss and 49 of post-2000 loss) of theconverted habitat area followed by cleared land (23 of pre-2000 loss and 37 of post-2000 loss)while the remaining converted habitat is within mosaic plantations (Figure 5a) The habitat loss areafrom more recent years has a greater proportion within the recently cleared plantation class (Figure 5b)Large industrial monoculture plantations established within the tiger habitat are dominated by oilpalm 65 of all habitat loss converted to large plantations is now under oil palm while the remaining(35) habitat loss converted to large plantations is under rubber cultivation However the proportionalarea of large industrial plantations under rubber cultivation that has been established from habitat losshas increased between pre-2000 and post-2000 from 29 to 41
Remote Sens 2017 9 747 9 of 14
32 Tiger Habitat Loss and Change from 1988ndash2012
A total of 831571 hectares of tiger habitat (18 of 1988 habitat area) have been lost over the entire study period The average annual habitat loss pre-2000 and post-2000 has remained nearly the same (34060 ha and 35237 ha respectively) However the annual habitat area lost has been increasing from 2001 to 2012 with an estimated 70692 ha lost in the year 2012 (Figure 4)
Approximately 46 of the total habitat loss has been converted to plantations adding 381808 ha to Peninsular Malaysiarsquos land under plantations by 2014 The rate of habitat conversion to plantations has increased from 12309 ha yearminus1 pre-2000 to 19508 ha yearminus1 post-2000 (Table 2) Large industrial plantations constitute the largest fraction (61 of pre-2000 loss and 49 of post-2000 loss) of the converted habitat area followed by cleared land (23 of pre-2000 loss and 37 of post-2000 loss) while the remaining converted habitat is within mosaic plantations (Figure 5a) The habitat loss area from more recent years has a greater proportion within the recently cleared plantation class (Figure 5b) Large industrial monoculture plantations established within the tiger habitat are dominated by oil palm 65 of all habitat loss converted to large plantations is now under oil palm while the remaining (35) habitat loss converted to large plantations is under rubber cultivation However the proportional area of large industrial plantations under rubber cultivation that has been established from habitat loss has increased between pre-2000 and post-2000 from 29 to 41
Figure 5 (a) Percent of total tiger habitat loss pre-2000 (1988ndash2000) and post-2000 (2001ndash2012) within different plantation types by 2014 (b) Sample-based area of habitat loss between 2001 and 2012 within plantations (in 2014) by plantation type
Figure 5 (a) Percent of total tiger habitat loss pre-2000 (1988ndash2000) and post-2000 (2001ndash2012) withindifferent plantation types by 2014 (b) Sample-based area of habitat loss between 2001 and 2012 withinplantations (in 2014) by plantation type
Remote Sens 2017 9 747 10 of 14
33 Accuracy Assessment of 1988ndash2000 and 2001ndash2012 Forest Loss
We performed separate accuracy assessments for natural forest loss and tiger habitat loss forthe 1988ndash2000 interval mapped in this research and 2001ndash2012 loss obtained from the GFC product(Table 3) The overall accuracy for both products exceeds 95 however specific userrsquos and producerrsquosaccuracies for each class vary The lowest producerrsquos accuracies are reported for forest loss classeswithin the TCL (below 60) Userrsquos accuracies are consistently higher with the lowest value (75)reported for the forest loss class in the pre-2000 mapping period
Table 3 Error Matrices for pre-2000 (1988ndash2000) and post-2000 (2001ndash2012) natural forest and habitatlossno loss maps with cell entries depicting the estimated area proportions N is the number of totalsample points used for the assessment
Reference
Loss No Loss Total Userrsquos Producerrsquos Overall
Pre-2000 Forest N = 475
Map
Loss 006 002 008 075 075 096No Loss 002 09 092 098 098
Total 008 092 1
Post-2000 Forest N = 489
Map
Loss 007 001 008 088 063 095No Loss 004 088 092 096 099
Total 012 088 1
Pre-2000 Habitat N = 314
Map
Loss 005 001 006 090 055 095No Loss 004 090 094 096 099
Total 009 091 100
Post-2000 Habitat N = 358
Map
Loss 006 0005 006 092 057 095No Loss 004 090 094 096 099
Total 0096 0904 100
4 Discussion
Sample-based area estimates provide a better estimation of loss area than simple map-basedestimates [46] and have been used to correct for the underestimation of forest loss [4849]Error-adjustment increased the estimated areas of natural forest loss and tiger habitat loss for bothpre-2000 and post-2000 periods Userrsquos and producerrsquos accuracies are not distributed uniformlyalthough the omission error is consistently high for both periods for natural forest and tiger habitat loss
Based on our total estimated gross natural forest loss of 135 Mha it is evident that deforestationcontinues to be a problem for Peninsular Malaysiarsquos forest Our estimated forest loss area from2000ndash2010 of 049 Mha is higher compared to the 044 Mha value reported by [23] This difference canbe attributed to the improved spatial resolution of data used (250 m vs 30 m in this study) and theimplementation of the sample-based unbiased area estimation method We observe an accelerationin forest loss from pre-2000 to post-2000 similar to previous reports across the humid tropics and inAsia [25] Our study adds to a recent study of global tiger habitat [17] and provides a more extensiveassessment of habitat loss within Peninsular Malaysia and the contribution of expanding plantationsHowever we have only mapped forest loss within habitat and have not assessed the quality of theremaining habitat which can be further affected by the fragmentation or creation of greater edge andincreased access Furthermore the estimated conversion of natural forests and habitat to plantations in
Remote Sens 2017 9 747 11 of 14
our study is limited by the plantation dataset used Any undetected or cryptic plantations will resultin an underestimation of the forest area converted to plantations over the study period While anyforest conversion to cryptic plantations is a concern for tiger habitat loss the forest area convertedto these plantations is of relatively low importance when compared with forest conversions to largeindustrial plantations like those of oil palm and rubber
With 48 of all the natural forest lost during 1988ndash2012 converted to plantations by 2014plantation expansion can be considered a major contributor to forest loss in Peninsular MalaysiaLarge industrial plantations constitute more than half of the forest converted to plantations in bothstudy periods Contrary to claims by the Malaysian palm oil industry [5051] our results show thatoil palm plantations have continued to expand at the expense of natural forest areas Our analysisshows that approximately 242000 ha of mapped forest loss between 1988 and 2012 were convertedto industrial oil palm plantations by 2014 Additionally we observe an increased conversion of bothforest and habitat loss to plantations post-2000 primarily due to the observed increase of annual lossafter 2006 especially within tiger habitat The proportion of total loss converted to plantations hasincreased from 40 to 54 between the two periods while the proportion of habitat loss converted toplantations has increased from 35 to 57
Although the conversion of forest and habitat to oil palm plantations has dominated throughoutthe study period the proportion of conversions to large-scale rubber plantations has increasedsignificantly post-2000 Mapped habitat loss converted to rubber plantations has increased by 96between pre-2000 and post-2000 while conversions to oil palm plantations have only increasedby about 14 suggesting that rubber cultivation could be a developing threat for the forests andtiger habitat Other reports also indicate substantial increases in the forest reserve area convertedto rubber plantations between 2005 and 2012 [3] Latex-timber clones rubber trees that can be usedfor both rubber and timber are being propagated across the landscape as a means to expand timberplantations [15] Policies that allow for selectively logged forests under state jurisdiction to be convertedto rubber tree plantations [15] and aggressive plantation schemes by the government [3] continue toendanger Malaysiarsquos forests and tiger habitat
The observed increase in habitat loss under the cleared plantation class could probably beexplained by delays in plantation establishment after forest clearing and that recently establishedplantations could look very similar to land cleared for other land-uses [52] It is important to note thatour analysis focuses on forest loss area that is under plantation in the year 2014 and other intermediaryland uses could exist before plantation establishment Forest conversion has been shown to followinitial logging disturbance in Indonesia [27] In Peninsular Malaysia oil palm plantations are usuallyestablished on degraded previously logged forest or other existing plantations [3133] Moreoverabout 85 of the Malaysian tiger population inhabits forest reserves that have been predominantlyassigned for selective logging [53] It is essential that the role of logging in deforestation and habitatloss in the region be further investigated
5 Conclusions
The Malayan tiger continues to be threatened by habitat loss and fragmentation despite Malaysiarsquosrelatively large area under forest cover [54] Our study maps the natural forest for Peninsular Malaysiafor circa 1988 and the forest loss between 1988 and 2000 and aggregates our forest loss with the GFCglobal forest loss product to produce a consistent forest loss dataset from 1988 to 2012 for the regionWe find that natural forest loss continues within Peninsular Malaysia specifically within its tigerhabitat The conversion of forests to plantations within the region is responsible for about half of allthe deforestation Furthermore we find that the contribution of plantations to the total area of naturalforest loss has increased from pre-2000 to post-2000 Large industrial plantations and recently clearedland are the major contributors of land-use conversion While large industrial plantations continue tobe dominated by oil palm conversion to rubber plantations has been on the rise In this work we havequantified the total loss of habitat but have not assessed more subtle changes in habitat quality that
Remote Sens 2017 9 747 12 of 14
result from natural forest conversion Our map product enables studying the spatial distribution andpatterns of natural forest loss within Peninsular Malaysia and its tiger habitat
Supplementary Materials The following are available online at wwwmdpicom2072-429297747s1Table S1 Image numbers per year and per Landsat sensor used for mapping Table S2 Landsat images usedfor validation
Author Contributions VS PP and TL conceived and designed the experiments VS performed theexperiments VS PP and TL analyzed the data PP and NH contributed reagentsmaterialsanalysis toolsVS PP NH and TL wrote the paper
Conflicts of Interest The authors declare no conflict of interest
References
1 Convention on Biodiversity Diversity (CBD) Malaysia Country Profile Available online httpswwwcbdintcountriesprofiledefaultshtmlcountry=myfacts (accessed on 10 December 2015)
2 Myers N Mittermeier RA Mittermeier CG Da Fonseca GA Kent J Biodiversity hotspots forconservation priorities Nature 2000 403 853ndash858 [CrossRef] [PubMed]
3 Kawanishi K Panthera tigris ssp jacksoni The IUCN Red List of Threatened Species 2015ET136893A50665029 2015 Available online httpdxdoiorg102305IUCNUK2015-2RLTST136893A50665029en (accessed on 10 October 2016)
4 Seidensticker J Saving wild tigers A case study in biodiversity loss and challenges to be met for recoverybeyond 2010 Integr Zool 2010 5 285ndash299 [CrossRef] [PubMed]
5 Gibbs HK Ruesch AS Achard F Clayton MK Holmgren P Ramankutty N Foley JA Tropicalforests were the primary sources of new agricultural land in the 1980s and 1990s Proc Natl Acad Sci USA2010 107 16732ndash16737 [CrossRef] [PubMed]
6 Sodhi SN Posa RCM Lee MT Bickford D Koh PL Brook WB The state and conservation ofSoutheast Asian biodiversity Biodivers Conserv 2010 19 317ndash328 [CrossRef]
7 Kummer DM Turner BL The human causes of deforestation in Southeast Asia Bioscience 1994 44323ndash328 [CrossRef]
8 Abdullah SA Nakagoshi N Forest fragmentation and its correlation to human land use change in thestate of Selangor peninsular Malaysia For Ecol Manag 2007 241 39ndash48 [CrossRef]
9 Abdullah SA Hezri AA From forest landscape to agricultural landscape in the developing tropicalcountry of Malaysia Pattern process and their significance on policy Environ Manag 2008 42 907ndash917[CrossRef] [PubMed]
10 Koh LP Wilcove DS Is oil palm agriculture really destroying tropical biodiversity Conserv Lett 2008 160ndash64 [CrossRef]
11 Food and Agriculture Organization of the United Nations (FAO) Case Study of Tropical Forest Plantations inMalaysia by DBA Krishnapillay Forest Plantations Working Paper 23 FAO Rome Italy 2002 unpublishedAvailable online httpwwwfaoorgdocumentscardenc8ac53512-c384-5b5a-baf4-f6d137e3a421(accessed on 11 July 2017)
12 Byerlee D The Fall and Rise Again of Plantations in Tropical Asia History Repeated Land 2014 3 574ndash597[CrossRef]
13 Fitzherbert EB Struebig MJ Morel A Danielsen F Bruumlhl CA Donald PF Phalan B How will oilpalm expansion affect biodiversity Trends Ecol Evol 2008 23 538ndash545 [CrossRef] [PubMed]
14 Brookfield H Byron Y Deforestation and timber extraction in Borneo and the Malay Peninsula The recordsince 1965 Glob Environ Chang 1990 1 42ndash56 [CrossRef]
15 Clements R Rayan DM Zafir AWA Venkataraman A Alfred R Payne J Ambu L Sharma DSKTrio under threat Can we secure the future of rhinos elephants and tigers in Malaysia Biodivers Conserv2010 19 1115ndash1136 [CrossRef]
16 Kawanishi K Yatim SH Abu Hashim AK Topani R Distribution and potential population size of thetiger in Peninsular Malaysia J Wildl Park 2003 21 29ndash50
17 Joshi AR Dinerstein E Wikramanayake E Anderson ML Olson D Jones BS Seidensticker JLumpkin S Hansen MC Sizer NC et al Tracking changes and preventing loss in critical tiger habitatSci Adv 2016 2 e1501675 [CrossRef] [PubMed]
Remote Sens 2017 9 747 13 of 14
18 World Bank (Washington DC USA) Global Tiger Recovery Program (2010ndash2022) Available online httpdocumentsworldbankorgcurateden874191468331048098Global-tiger-recovery-program-2010-2022(accessed on 27 June 2017)
19 Global Tiger Recovery Program (GTRP) Global Tiger Recovery Program Volume 2 Draft 31 July 2010Washington DC USA 2010 Available online httpadminindiaenvironmentportalorginfilesGTRP-Volume-2-July-31pdf (accessed on 27 June 2017)
20 Department of Wildlife and National Parks Peninsular Malaysia (DWNP) National Tiger Action Plan forMalaysia 2008ndash2020 DWNP Kuala Lumpur Malaysia 2008
21 Hansen MC Stehman SV Potapov PV Loveland TR Townshend JR DeFries RS Pittman KWArunarwati B Stolle F Steininger MK et al Humid tropical forest clearing from 2000 to 2005 quantifiedby using multitemporal and multiresolution remotely sensed data Proc Natl Acad Sci USA 2008 1059439ndash9444 [CrossRef] [PubMed]
22 Hansen MC Stehman SV Potapov PV Quantification of global gross forest cover loss Proc Natl AcadSci USA 2010 107 8650ndash8655 [CrossRef] [PubMed]
23 Miettinen J Shi C Liew SC Deforestation rates in insular Southeast Asia between 2000 and 2010Glob Chang Biol 2011 17 2261ndash2270 [CrossRef]
24 Hansen MC Potapov PV Moore R Hancher M Turubanova SA Tyukavina A Thau DStehman SV Goetz SJ Loveland TR et al High-resolution global maps of 21st-century forest coverchange Science 2013 342 850ndash853 [CrossRef] [PubMed]
25 Kim D Sexton JO Townshend JR Accelerated deforestation in the humid tropics from the 1990s to the2000s Geophys Res Lett 2015 42 3495ndash3501 [CrossRef] [PubMed]
26 Cohen WB Goward SN Landsatrsquos role in ecological applications of remote sensing Bioscience 2004 54535ndash545 [CrossRef]
27 Margono BA Potapov PV Turubanova S Stolle F Hansen MC Primary forest cover loss in Indonesiaover 2000ndash2012 Nat Clim Chang 2014 4 730ndash735 [CrossRef]
28 Srinivas A Koh LP Oil palm expansion drives avifaunal decline in the Pucallpa region of PeruvianAmazonia Glob Ecol Conserv 2016 7 183ndash200 [CrossRef]
29 Peh KSH Sodhi NS De Jong J Sekercioglu CH Yap CAM Lim SLH Conservation value ofdegraded habitats for forest birds in southern Peninsular Malaysia Divers Distrib 2006 12 572ndash581[CrossRef]
30 Maddox T The Conservation of Tigers and Other Wildlife in Oil Palm Plantations Jambi Province SumatraIndonesia Zoological Society of London (ZSL) London UK 2007
31 Wicke S Sikkema R Dornburg V Faaij A Exploring land use changes and the role of palm oil productionin Indonesia and Malaysia Land Use Policy 2011 28 193ndash206 [CrossRef]
32 McMorrow J Talip MA Decline of forest area in Sabah Malaysia Relationship to state policies land codeand land capability Glob Environ Chang 2001 11 217ndash230 [CrossRef]
33 Gunarso P Hartoyo M Agus F Killeen T Oil Palm and Land Use Change in Indonesia Malaysia andPapua New Guinea Reports from the Technical Panels of the 2nd Greenhouse Gas Working Group of theRoundtable on Sustainable Palm Oil (RSPO) RSPO Kuala Lumpur Malaysia 2013 pp 29ndash64 Availableonline httpwwwrspoorgkey-documentssupplementary-materials (accessed on 20 June 2016)
34 Food and Agriculture Organization of the United Nations (FAO) Countries Geography Malaysia 2012Available online httpwwwfaoorgforestrycountry18310enmys (accessed on 22 June 2017)
35 Forestry Department of Peninsular Malaysia (FDPM) Forest Types 2016 Available online httpswwwforestrygovmyindexphpen2016-06-07-02-31-392016-06-07-02-35-17forest-type (accessed on22 June 2017)
36 Sanderson E Forrest J Loucks C Ginsberg J Dinerstein E Seidensticker J Leimgruber P Songer MHeydlauff A OrsquoBrien T et al Setting Priorities for the Conservation and Recovery of Wild Tigers 2005ndash2015 TheTechnical Assessment World Wildlife Fund Washington DC USA Wildlife Conservation Society New YorkNY USA Smithsonian and National Fish and Wildlife Foundation Washington DC USA 2006
37 UNEP-WCMC and IUCN Protected Planet The World Database on Protected Areas (WDPA) UNEP-WCMCCambridge UK 2016 Available online wwwprotectedplanetnet (accessed on 10 February 2016)
Remote Sens 2017 9 747 14 of 14
38 Petersen R Aksenov D Goldman E Sargent S Harris N Manisha A Esipova E Shevade VLoboda T Mapping Tree Plantations with Multispectral Imagery Preliminary Results for Seven Tropical CountriesTechnical Note World Resources Institute Washington DC USA 2016 Available online httpwwwwriorgpublicationmapping-tree-plantations (accessed on 23 September 2016)
39 Potapov PV Turubanova SA Hansen MC Adusei B Broich M Altstatt A Mane L Justice COQuantifying forest cover loss in Democratic Republic of the Congo 2000ndash2010 with Landsat ETM+ dataRemote Sens Environ 2012 122 106ndash116 [CrossRef]
40 Potapov PV Turubanova SA Tyukavina A Krylov AM McCarty JL Radeloff VC Hansen MCEastern Europersquos forest cover dynamics from 1985 to 2012 quantified from the full Landsat archiveRemote Sens Environ 2015 159 28ndash43 [CrossRef]
41 Tucker CJ Red and photographic infrared linear combinations for monitoring vegetation Remote SensEnviron 1979 8 127ndash150 [CrossRef]
42 Xiao X Zhang Q Braswell B Urbanski S Boles S Wofsy SC Moore B Ojima D Modeling grossprimary production of a deciduous broadleaf forest using satellite images and climate data Remote SensEnviron 2004 91 256ndash270 [CrossRef]
43 Breiman L Bagging predictors Mach Learn 1996 24 123ndash140 [CrossRef]44 Giree N Stehman SV Potapov P Hansen MC A sample-based forest monitoring strategy using Landsat
AVHRR and MODIS data to estimate gross forest cover loss in Malaysia between 1990 and 2005 Remote Sens2013 5 1842ndash1855 [CrossRef]
45 Olofsson P Foody GM Herold M Stehman SV Woodcock CE Wulder MA Good practices forestimating area and assessing accuracy of land change Remote Sens Environ 2014 148 42ndash57 [CrossRef]
46 Olofsson P Foody GM Stehman SV Woodcock CE Making better use of accuracy data in land changestudies Estimating accuracy and area and quantifying uncertainty using stratified estimation Remote SensEnviron 2013 129 122ndash131 [CrossRef]
47 Intergovernmental Panel on Climate Change (IPCC) 2006 IPCC Guidelines for National Greenhouse GasInventories Prepared by the National Greenhouse Gas Inventories Programme Eggleston HS Buendia LMiwa K Ngara T Tanabe K Eds Institute for Global Environmental Strategies Hayama Japan 2006
48 Tyukavina A Stehman SV Potapov PV Turubanova SA Baccini A Goetz SJ Laporte NTHoughton RA Hansen MC National-scale estimation of gross forest aboveground carbon loss Acase study of the Democratic Republic of the Congo Environ Res Lett 2013 8 044039 [CrossRef]
49 Potapov PV Dempewolf J Talero Y Hansen MC Stehman SV Vargas C Rojas EJ Castillo DMendoza E Calderoacuten A et al National satellite-based humid tropical forest change assessment in Peru insupport of REDD+ implementation Environ Res Lett 2014 9 124012 [CrossRef]
50 Sheil D Casson A Meijaard E van Nordwijk M Gaskell J Sunderland-Groves J Wertz KKanninen M The Impacts and Opportunities of Oil Palm in Southeast Asia What Do We Know and WhatDo We Need to Know Occasional Paper No 51 Center for International Forestry Research (CIFOR) BogorIndonesia 2009
51 Gaveau DL Sheil D Husnayaen MAS Arjasakusuma S Ancrenaz M Pacheco P Meijaard ERapid conversions and avoided deforestation Examining four decades of industrial plantation expansion inBorneo Sci Rep 2016 6 32017 [CrossRef] [PubMed]
52 Koh LP Miettinen J Liew SC Ghazoul J Remotely sensed evidence of tropical peatland conversion tooil palm Proc Natl Acad Sci USA 2011 108 5127ndash5132 [CrossRef] [PubMed]
53 Rayan DM Linkie M Conserving tigers in Malaysia A science-driven approach for eliciting conservationpolicy change Biol Conserv 2015 184 18ndash26 [CrossRef]
54 Rayan DM Mohamad SW The importance of selectively logged forests for tiger Panthera tigrisconservation A population density estimate in Peninsular Malaysia Oryx 2009 43 48ndash51 [CrossRef]
copy 2017 by the authors Licensee MDPI Basel Switzerland This article is an open accessarticle distributed under the terms and conditions of the Creative Commons Attribution(CC BY) license (httpcreativecommonsorglicensesby40)
- Introduction
- Materials and Methods
-
- Study Area
- Overview
- Data
- Natural Forest Mapping
- Forest Loss Mapping
- Sample-Based Adjustment of the Area Estimation
-
- Results
-
- Natural Forest Extent and Change from 1988ndash2012
- Tiger Habitat Loss and Change from 1988ndash2012
- Accuracy Assessment of 1988ndash2000 and 2001ndash2012 Forest Loss
-
- Discussion
- Conclusions
-

Remote Sens 2017 9 747 3 of 14
2 Materials and Methods
21 Study Area
Peninsular Malaysia lies on the Malay Peninsula and is bordered by Thailand in the North andSingapore in the South It occupies an area of 132 million ha (Figure 1) The region is equatorialwith influences of the southwest monsoon from May to September and the northeast monsoon fromOctober to March Average day temperatures are around 32 C and average precipitation is around2550 mm with a maximum rainfall of more than 5000 mm on exposed mountains [34] Coastal plainsand lowlands dominate regional topography below a 300 m elevation [34] which are covered withmangroves and peat swamp forests along the coast and lowland dipterocarp forests further inland [35]Mountain ranges dominate the northern and central-western parts of the country [34] Hill and upperdipterocarp forests are found between 300ndash750 m and 750ndash1200 m above sea level respectively whilemontane-oak forests are found between 1200ndash1500 m [35] About 51 of Peninsular Malaysia hasa suitable habitat for tigers however only 29 of its area is considered to have good conservationvalue based on evidence of tiger presence [20] Protected areas represent only 15 of the tiger habitatarea [20] Tiger habitat for the purpose of this study is restricted to Peninsular Malaysiarsquos TigerConservation Landscapes (TCLs) (Figure 1) which include areas with a potential effective habitat andconfirmed tiger occurrence during the preceding years and no knowledge of tiger extirpation [36]
Remote Sens 2017 9 747 3 of 14
2 Materials and Methods
21 Study Area
Peninsular Malaysia lies on the Malay Peninsula and is bordered by Thailand in the North and Singapore in the South It occupies an area of 132 million ha (Figure 1) The region is equatorial with influences of the southwest monsoon from May to September and the northeast monsoon from October to March Average day temperatures are around 32 degC and average precipitation is around 2550 mm with a maximum rainfall of more than 5000 mm on exposed mountains [34] Coastal plains and lowlands dominate regional topography below a 300 m elevation [34] which are covered with mangroves and peat swamp forests along the coast and lowland dipterocarp forests further inland [35] Mountain ranges dominate the northern and central-western parts of the country [34] Hill and upper dipterocarp forests are found between 300ndash750 m and 750ndash1200 m above sea level respectively while montane-oak forests are found between 1200ndash1500 m [35] About 51 of Peninsular Malaysia has a suitable habitat for tigers however only 29 of its area is considered to have good conservation value based on evidence of tiger presence [20] Protected areas represent only 15 of the tiger habitat area [20] Tiger habitat for the purpose of this study is restricted to Peninsular Malaysiarsquos Tiger Conservation Landscapes (TCLs) (Figure 1) which include areas with a potential effective habitat and confirmed tiger occurrence during the preceding years and no knowledge of tiger extirpation [36]
Figure 1 Study area in Peninsular Malaysia showing the Tiger Conservation Landscapes (TCL) [36] percent tree cover for year 2000 [24] and protected areas from the World Database on Protected Areas (WDPA) [37]
Figure 1 Study area in Peninsular Malaysia showing the Tiger Conservation Landscapes (TCL) [36]percent tree cover for year 2000 [24] and protected areas from the World Database on Protected Areas(WDPA) [37]
Remote Sens 2017 9 747 4 of 14
22 Overview
Natural forests are defined as mature naturally regenerated forests that have a minimum areaof 5 ha and have not been completely cleared or replanted in recent history although some signs ofdisturbance like selective logging might be present [27] Natural forest loss includes tree removal dueto logging as well as land use conversion (from agriculture and plantation expansion infrastructuredevelopment etc) To quantify natural forest loss we (1) mapped the natural forest extent forthe year 1988 (2) applied a change detection model to map forest loss between 1988 and 2000 and(3) aggregated the pre-year 2000 forest loss with the existing published Landsat-based Global ForestChange (GFC) tree cover loss product for 2001ndash2012 [24] and assessed the loss within mapped naturalforests (Figure 2) We then overlaid the plantation map obtained from [38] with the 1988ndash2012 naturalforest loss map to estimate the role of plantations in the overall forest loss PCI Geomatica softwarewas used for generating training samples for natural forest and forest loss mapping while ArcGIS wasused for the analysis of forest loss and conversion to plantations
Remote Sens 2017 9 747 4 of 14
22 Overview
Natural forests are defined as mature naturally regenerated forests that have a minimum area of 5 ha and have not been completely cleared or replanted in recent history although some signs of disturbance like selective logging might be present [27] Natural forest loss includes tree removal due to logging as well as land use conversion (from agriculture and plantation expansion infrastructure development etc) To quantify natural forest loss we (1) mapped the natural forest extent for the year 1988 (2) applied a change detection model to map forest loss between 1988 and 2000 and (3) aggregated the pre-year 2000 forest loss with the existing published Landsat-based Global Forest Change (GFC) tree cover loss product for 2001ndash2012 [24] and assessed the loss within mapped natural forests (Figure 2) We then overlaid the plantation map obtained from [38] with the 1988ndash2012 natural forest loss map to estimate the role of plantations in the overall forest loss PCI Geomatica software was used for generating training samples for natural forest and forest loss mapping while ArcGIS was used for the analysis of forest loss and conversion to plantations
Figure 2 Methodology used to map natural forest natural forest loss and plantation expansion
23 Data
We analyzed the entire archive of Landsat 5 Thematic Mapper (TM) and Landsat 7 Enhanced Thematic Mapper (ETM+) images available for the region from 1988 to 2002 The region is covered by 20 WRS-2 footprints The entire archive of available imagery consisting of 1110 processing Level 1 terrain corrected (L1T) images was employed The number of images used from the different Landsat sensors is listed in Table S1 Landsat imagery processing followed the methodology of [24] and is described in detail in [39] where per-pixel raw digital numbers were converted to top of atmosphere reflectance screened for cloudshadowhazewater and following quality assessment were radiometrically normalized and composited into a single clear-surface layer Screening and quality assessment involved using decision tree models to predict the presence of cloud shadow and water to obtain the per-pixel probability of contamination by these features [2439] The observation
Figure 2 Methodology used to map natural forest natural forest loss and plantation expansion
23 Data
We analyzed the entire archive of Landsat 5 Thematic Mapper (TM) and Landsat 7 EnhancedThematic Mapper (ETM+) images available for the region from 1988 to 2002 The region is coveredby 20 WRS-2 footprints The entire archive of available imagery consisting of 1110 processingLevel 1 terrain corrected (L1T) images was employed The number of images used from the differentLandsat sensors is listed in Table S1 Landsat imagery processing followed the methodology of [24]and is described in detail in [39] where per-pixel raw digital numbers were converted to top ofatmosphere reflectance screened for cloudshadowhazewater and following quality assessmentwere radiometrically normalized and composited into a single clear-surface layer Screening and
Remote Sens 2017 9 747 5 of 14
quality assessment involved using decision tree models to predict the presence of cloud shadow andwater to obtain the per-pixel probability of contamination by these features [2439] The observationquality of pixels was recorded and pixels with a high probability of contamination were thenexcluded from processing [2439] Normalization was carried out using Moderate Resolution ImagingSpectroradiometer (MODIS) derived surface reflectance products as normalization targets in order toreduce the variations in reflectance resulting from differences in image dates atmospheric conditionsand surface anisotropy [39] As Peninsular Malaysia is a part of the humid tropics images from theentire year were used for multi-date image compositing in order to generate start or end date (1988or 2000) cloud-free image mosaics using only pixels with the highest quality observations [39] Dueto limited image availability and the very high incidence of cloud cover in this region clear surfaceobservations from adjacent years were used to fill the gaps in both the image composites For theldquocirca 1988rdquo composite 71 of the pixels used were from the 1988ndash1990 interval and for the ldquocirca2000rdquo composite 99 of the pixels used were from the 1999ndash2001 interval
All processed per-pixel cloud-free observations between the earliest observation for the start year(1988) and the latest observation for the last year (2000) were used to create a set of multi-temporalmetrics that was used for natural forest mapping and forest loss detection (Table 1) This multi-temporalmetric set was developed following the methods described in [243940] using two approaches(1) time-sequential reflectance observations by date and (2) ranked (low to high) band reflectancevalues or ranked observations corresponding to the ranked normalized difference vegetation index(NDVI) [41] normalized difference water index (NDWI) [42] values and thermalinfrared band valuesIn addition to the startend date cloud-free image mosaics the means and medians of the first threeobservations and last three observations the maximal values of time-sequential reflectance gain andloss and the slope of linear regression of reflectanceindex values and observation date [2440] weregenerated For the rank-based metrics a set of percentile values and symmetrical and asymmetricalaverages for various percentile range intervals were used [2440] On average about 16 cloud-freeobservations were available per-pixel for the calculation of metrics The first (circa 1988) and last (circa2000) cloud-free image composites along with the mediansmeans of the first three and last threeobservations were used for visual interpretation to generate training samples for mapping
Table 1 Overview of the different multi-temporal metrics used for classification and mapping
Types of Metrics Multi-Temporal Metrics
Image Composites1 First and last cloud-free observations2 Mean and Median of first 3 observations3 Mean and Median of last 3 observations
Rank-based Metrics
1 Percentiles representing minimum 10 25 50 75 90 and maximum for bandreflectance or index (NDVI NDWI) values2 Symmetrical averages for various intervals minimumndashmaximum 10ndash90 25ndash753 Asymmetrical averages for various intervals minimumndash10 10ndash25 25ndash50 50ndash7575ndash90 90-maximum
Trend Analysis Metrics1 Slope of linear regression of band reflectance versus image date2 Standard deviation of band reflectance 1988ndash20003 Maximum lossgain of reflectanceindex value between consecutive observations
We used the GFC tree cover loss product [24] for the years 2001ndash2012 to extend our 1988ndash2000forest loss map This product maps the loss of tree cover taller than 5 m at a resolution equivalent toLandsat data To estimate forest loss converted to plantations we used a plantation map generatedfor Peninsular Malaysia by the World Resources Institute (WRI) [38] This product maps plantationareas in 2014 categorized into large industrial-sized plantations medium-sized and small-sizedmosaic plantations and recently cleared or young plantation classes Large industrial plantations aremonocultures with species information associated with plantation areas while mosaic plantationsinclude some non-plantation areas like other agriculture forest patches and settlements interspersedwith plantations
Remote Sens 2017 9 747 6 of 14
24 Natural Forest Mapping
The 1988 Landsat image mosaic was visually interpreted to determine the training samples fornatural forest (dependent variable) versus all other land cover types The natural forest classificationtraining sample consisted of more than 450000 training pixels Multi-temporal metrics (Table 1) wereused as independent variables to build a bagged decision tree model to map natural forest areas [24]While using ldquobaggingrdquo or bootstrap aggregation the data are divided into a test set which is a randomsample drawn from the training population and a learning set which is the remaining portion of thetraining population [43] We used a test set of 20 of the training data and developed output mapsbased on the median class likelihood from the outputs of several trees
Natural forest patch size was restricted to 5 ha [27] and manual editing of the classification resultswas performed [27] to correct for obvious errors like removing older plantations and including someomitted water-logged forest areas along the coast For this study tiger habitat for Peninsular Malaysiais defined as natural forest area within the TCL Tiger habitat and habitat are used interchangeably inthe rest of the paper
25 Forest Loss Mapping
Forest loss is defined as a temporal or permanent reduction in tree cover density [242744]resulting in a complete or almost complete removal of trees within a 30 m Landsat pixel [40] Itcould result from conversion to agricultureplantations intensive logging or natural disturbancesTraining samples for lsquoforest lossrsquo and lsquono lossrsquo between 1988 and 2000 were created after the visualinterpretation of 1988 and 2000 image mosaics and maximum reflectance composites [40] In totalmore than 510000 pixels were used to train the forest loss classification Forest loss during 1988ndash2000(pre-2000) was mapped in one time-step using a decision tree classifier and multi-temporal metricsForest loss during 2001ndash2012 (post-2000) within mapped natural forest areas was extracted from theGFC product Owing to the increased image availability after the year 2000 as opposed to that in the1980s and 1990s we can estimate post-2000 loss at an annual time-step using the GFC product Allforest loss within the mapped 1988 natural forest mask was considered as natural forest loss (Figure 2)As the pre-2000 and post-2000 forest loss is mapped separately in cases of overlap between the twothe loss year (interval) was attributed to the first detected loss event (pre-2000) However as imageryfrom years 2001 and 2002 had been used to gap-fill the 2000 mosaic in instances of overlap betweenmapped pre-2000 loss and the GFC product loss from either year 2001 or 2002 we attributed loss tothe respective post-2000 year Tiger habitat loss was quantified by assessing forest loss within the tigerhabitat area
26 Sample-Based Adjustment of the Area Estimation
Separate sample-based assessments were performed for the newly developed pre-2000 forest lossand the post-2000 forest loss subset from the GFC product following the methodology used by [40]In this approach the strata for sampling were based on lsquonatural forest lossrsquo and lsquono lossrsquo classesfor both the pre-2000 and post-2000 periods For each forest loss period sample pixels were drawnusing a stratified random sampling design Following the ldquogood practicesrdquo suggested by [45] inorder to balance the area estimates and all accuracies we used a sampling design slightly away fromproportional such that rare strata have a sample size slightly greater than proportional allocation Weused Landsat imagery mosaics for 1988 and 2000 along with composites for 1990 and 1995 for visualassessment of the pre-2000 loss validation samples Landsat images where available (Table S2) theminimum annual NDVI and Google Earth imagery were used in addition to the 2000 and 2012 Landsatmosaics for an assessment of the 2001ndash2012 validation samples Following the visual assessment of allsamples an accuracy assessment of the map and sample-based area estimation of mapped classes wasconducted following the method for the land area change estimation described in [46] Additionallywe followed the same procedure to estimate the forest loss area within the tiger habitat separately
Remote Sens 2017 9 747 7 of 14
using only validation samples within the TCL The accuracy of the plantation map is reported in [38]The overall accuracy of the plantation map is 867 while the producerrsquos and userrsquos accuracies were968 and 788 respectively
Our total natural forest loss and habitat loss area estimates were obtained from the sample-basedarea estimation for pre-2000 and post-2000 The error-adjusted area for natural forest and habitatloss within plantations was estimated by using the proportion of mapped loss within plantationsThe error-adjusted estimates for the annual area of natural forest and habitat loss between 2001and 2012 were obtained by disaggregating the post-2000 sample-based area estimate into annual timescales using the yearly proportion of post-2000 natural forest and habitat loss All areas reported inthe paper are based on error-adjusted area estimates unless categorically noted as ldquomapped areardquo orldquomapped lossrdquo
3 Results
31 Natural Forest Extent and Change from 1988ndash2012
The total natural forest area within Peninsular Malaysia in 1988 was estimated as 716 MhaRoughly 65 of the 1988 natural forest area was within the TCL and is considered as tiger habitat forthe remaining analysis The error-adjusted areas for total forest loss and habitat loss along with theirerror estimates are reported in Table 2 Standard errors for pre-2000 and post-2000 sample-based areaestimates were obtained following [46] while the total error for the sample-based area estimate wasobtained following the method for propagation of error suggested by the Intergovernmental Panel onClimate Change (IPCC) Guidelines [47] Our map (Figure 3) underestimates the area of loss and thesample-based area estimates (Table 2) are higher than the mapped loss for both periods (579568 ha forpre-2000 and 565881 ha for post-2000)
By 2012 the total gross forest loss area in Peninsular Malaysia was estimated to be 135 Mha or19 of its 1988 natural forest area (Figure 3 Table 2) The annual rate of loss has increased between thetwo periods from an average of 49281 ha yearminus1 pre-2000 to 63422 ha yearminus1 post-2000 (Figure 4)Using the GFC product we estimated loss at an annual time step for the post-2000 period This annualloss has been increasing since 2001 and reached a peak at 122167 ha in 2012 (Figure 4)
Plantation expansion is responsible for 651757 ha or 48 of the total natural forest loss The meanannual rate of natural forest converted to plantations has increased from 19970 ha yearminus1 pre-2000 to34344 ha yearminus1 post-2000 (Figure 4) The majority of the forest loss converted to plantations (57loss within plantations) was due to the large industrial plantation expansion Recently cleared landconstitutes 17 and 30 of all pre-2000 and post-2000 forest loss within plantations respectivelyBased on the species information associated with large industrial plantations we estimate that oilpalm dominated plantations constitute about 80 of the total forest loss (1988-2000) converted to thiscategory while the proportion of forest loss converted to large rubber plantations has increased from15 pre-2000 to 25 post-2000
Table 2 Sample-based area (Mha) estimates with 95 confidence intervals for pre-2000 and post-2000total natural forest and habitat loss and loss within plantations by 2014
Study Period Total Loss Total Losswithin Plantations Habitat Loss Habitat Loss
within Plantations
Pre-2000 059 plusmn 011 024 plusmn 005 042 plusmn 011 015 plusmn 004Post-2000 076 plusmn 013 041 plusmn 007 041 plusmn 010 023 plusmn 006
Total 135 plusmn 017 065 plusmn 008 083 plusmn 015 038 plusmn 007
Remote Sens 2017 9 747 8 of 14Remote Sens 2017 9 747 8 of 14
Figure 3 Mapped natural forest remaining in 2013 tiger conservation landscape (TCL) and natural forest loss between 1988ndash2000 (pre-2000) and 2001ndash2012 (post-2000)
Figure 4 Sample-based area (thousand ha) estimates for yearly natural forest and habitat loss and annual rates of total natural forest loss for pre-2000 and post-2000 periods Yearly losses are depicted as solid lines while mean annual rates of loss for the pre-2000 and post-2000 periods are average rates of loss for the respective periods depicted as constant dashed lines
0
20
40
60
80
100
120
140
1988
1989
1990
1991
1992
1993
1994
1995
1996
1997
1998
1999
2000
2001
2002
2003
2004
2005
2006
2007
2008
2009
2010
2011
2012
For
est a
nd ti
ger
habi
tat l
oss
in
Tho
usan
ds o
f H
ecta
res
Pre-2000 Mean annual rate of forest loss Yearly natural forest loss
Post-2000 Mean annual rate of forest loss Yearly tiger habitat loss
Figure 3 Mapped natural forest remaining in 2013 tiger conservation landscape (TCL) and naturalforest loss between 1988ndash2000 (pre-2000) and 2001ndash2012 (post-2000)
Remote Sens 2017 9 747 8 of 14
Figure 3 Mapped natural forest remaining in 2013 tiger conservation landscape (TCL) and natural forest loss between 1988ndash2000 (pre-2000) and 2001ndash2012 (post-2000)
Figure 4 Sample-based area (thousand ha) estimates for yearly natural forest and habitat loss and annual rates of total natural forest loss for pre-2000 and post-2000 periods Yearly losses are depicted as solid lines while mean annual rates of loss for the pre-2000 and post-2000 periods are average rates of loss for the respective periods depicted as constant dashed lines
0
20
40
60
80
100
120
140
1988
1989
1990
1991
1992
1993
1994
1995
1996
1997
1998
1999
2000
2001
2002
2003
2004
2005
2006
2007
2008
2009
2010
2011
2012
For
est a
nd ti
ger
habi
tat l
oss
in
Tho
usan
ds o
f H
ecta
res
Pre-2000 Mean annual rate of forest loss Yearly natural forest loss
Post-2000 Mean annual rate of forest loss Yearly tiger habitat loss
Figure 4 Sample-based area (thousand ha) estimates for yearly natural forest and habitat loss andannual rates of total natural forest loss for pre-2000 and post-2000 periods Yearly losses are depictedas solid lines while mean annual rates of loss for the pre-2000 and post-2000 periods are average ratesof loss for the respective periods depicted as constant dashed lines
Remote Sens 2017 9 747 9 of 14
32 Tiger Habitat Loss and Change from 1988ndash2012
A total of 831571 hectares of tiger habitat (18 of 1988 habitat area) have been lost over the entirestudy period The average annual habitat loss pre-2000 and post-2000 has remained nearly the same(34060 ha and 35237 ha respectively) However the annual habitat area lost has been increasing from2001 to 2012 with an estimated 70692 ha lost in the year 2012 (Figure 4)
Approximately 46 of the total habitat loss has been converted to plantations adding 381808 hato Peninsular Malaysiarsquos land under plantations by 2014 The rate of habitat conversion to plantationshas increased from 12309 ha yearminus1 pre-2000 to 19508 ha yearminus1 post-2000 (Table 2) Large industrialplantations constitute the largest fraction (61 of pre-2000 loss and 49 of post-2000 loss) of theconverted habitat area followed by cleared land (23 of pre-2000 loss and 37 of post-2000 loss)while the remaining converted habitat is within mosaic plantations (Figure 5a) The habitat loss areafrom more recent years has a greater proportion within the recently cleared plantation class (Figure 5b)Large industrial monoculture plantations established within the tiger habitat are dominated by oilpalm 65 of all habitat loss converted to large plantations is now under oil palm while the remaining(35) habitat loss converted to large plantations is under rubber cultivation However the proportionalarea of large industrial plantations under rubber cultivation that has been established from habitat losshas increased between pre-2000 and post-2000 from 29 to 41
Remote Sens 2017 9 747 9 of 14
32 Tiger Habitat Loss and Change from 1988ndash2012
A total of 831571 hectares of tiger habitat (18 of 1988 habitat area) have been lost over the entire study period The average annual habitat loss pre-2000 and post-2000 has remained nearly the same (34060 ha and 35237 ha respectively) However the annual habitat area lost has been increasing from 2001 to 2012 with an estimated 70692 ha lost in the year 2012 (Figure 4)
Approximately 46 of the total habitat loss has been converted to plantations adding 381808 ha to Peninsular Malaysiarsquos land under plantations by 2014 The rate of habitat conversion to plantations has increased from 12309 ha yearminus1 pre-2000 to 19508 ha yearminus1 post-2000 (Table 2) Large industrial plantations constitute the largest fraction (61 of pre-2000 loss and 49 of post-2000 loss) of the converted habitat area followed by cleared land (23 of pre-2000 loss and 37 of post-2000 loss) while the remaining converted habitat is within mosaic plantations (Figure 5a) The habitat loss area from more recent years has a greater proportion within the recently cleared plantation class (Figure 5b) Large industrial monoculture plantations established within the tiger habitat are dominated by oil palm 65 of all habitat loss converted to large plantations is now under oil palm while the remaining (35) habitat loss converted to large plantations is under rubber cultivation However the proportional area of large industrial plantations under rubber cultivation that has been established from habitat loss has increased between pre-2000 and post-2000 from 29 to 41
Figure 5 (a) Percent of total tiger habitat loss pre-2000 (1988ndash2000) and post-2000 (2001ndash2012) within different plantation types by 2014 (b) Sample-based area of habitat loss between 2001 and 2012 within plantations (in 2014) by plantation type
Figure 5 (a) Percent of total tiger habitat loss pre-2000 (1988ndash2000) and post-2000 (2001ndash2012) withindifferent plantation types by 2014 (b) Sample-based area of habitat loss between 2001 and 2012 withinplantations (in 2014) by plantation type
Remote Sens 2017 9 747 10 of 14
33 Accuracy Assessment of 1988ndash2000 and 2001ndash2012 Forest Loss
We performed separate accuracy assessments for natural forest loss and tiger habitat loss forthe 1988ndash2000 interval mapped in this research and 2001ndash2012 loss obtained from the GFC product(Table 3) The overall accuracy for both products exceeds 95 however specific userrsquos and producerrsquosaccuracies for each class vary The lowest producerrsquos accuracies are reported for forest loss classeswithin the TCL (below 60) Userrsquos accuracies are consistently higher with the lowest value (75)reported for the forest loss class in the pre-2000 mapping period
Table 3 Error Matrices for pre-2000 (1988ndash2000) and post-2000 (2001ndash2012) natural forest and habitatlossno loss maps with cell entries depicting the estimated area proportions N is the number of totalsample points used for the assessment
Reference
Loss No Loss Total Userrsquos Producerrsquos Overall
Pre-2000 Forest N = 475
Map
Loss 006 002 008 075 075 096No Loss 002 09 092 098 098
Total 008 092 1
Post-2000 Forest N = 489
Map
Loss 007 001 008 088 063 095No Loss 004 088 092 096 099
Total 012 088 1
Pre-2000 Habitat N = 314
Map
Loss 005 001 006 090 055 095No Loss 004 090 094 096 099
Total 009 091 100
Post-2000 Habitat N = 358
Map
Loss 006 0005 006 092 057 095No Loss 004 090 094 096 099
Total 0096 0904 100
4 Discussion
Sample-based area estimates provide a better estimation of loss area than simple map-basedestimates [46] and have been used to correct for the underestimation of forest loss [4849]Error-adjustment increased the estimated areas of natural forest loss and tiger habitat loss for bothpre-2000 and post-2000 periods Userrsquos and producerrsquos accuracies are not distributed uniformlyalthough the omission error is consistently high for both periods for natural forest and tiger habitat loss
Based on our total estimated gross natural forest loss of 135 Mha it is evident that deforestationcontinues to be a problem for Peninsular Malaysiarsquos forest Our estimated forest loss area from2000ndash2010 of 049 Mha is higher compared to the 044 Mha value reported by [23] This difference canbe attributed to the improved spatial resolution of data used (250 m vs 30 m in this study) and theimplementation of the sample-based unbiased area estimation method We observe an accelerationin forest loss from pre-2000 to post-2000 similar to previous reports across the humid tropics and inAsia [25] Our study adds to a recent study of global tiger habitat [17] and provides a more extensiveassessment of habitat loss within Peninsular Malaysia and the contribution of expanding plantationsHowever we have only mapped forest loss within habitat and have not assessed the quality of theremaining habitat which can be further affected by the fragmentation or creation of greater edge andincreased access Furthermore the estimated conversion of natural forests and habitat to plantations in
Remote Sens 2017 9 747 11 of 14
our study is limited by the plantation dataset used Any undetected or cryptic plantations will resultin an underestimation of the forest area converted to plantations over the study period While anyforest conversion to cryptic plantations is a concern for tiger habitat loss the forest area convertedto these plantations is of relatively low importance when compared with forest conversions to largeindustrial plantations like those of oil palm and rubber
With 48 of all the natural forest lost during 1988ndash2012 converted to plantations by 2014plantation expansion can be considered a major contributor to forest loss in Peninsular MalaysiaLarge industrial plantations constitute more than half of the forest converted to plantations in bothstudy periods Contrary to claims by the Malaysian palm oil industry [5051] our results show thatoil palm plantations have continued to expand at the expense of natural forest areas Our analysisshows that approximately 242000 ha of mapped forest loss between 1988 and 2012 were convertedto industrial oil palm plantations by 2014 Additionally we observe an increased conversion of bothforest and habitat loss to plantations post-2000 primarily due to the observed increase of annual lossafter 2006 especially within tiger habitat The proportion of total loss converted to plantations hasincreased from 40 to 54 between the two periods while the proportion of habitat loss converted toplantations has increased from 35 to 57
Although the conversion of forest and habitat to oil palm plantations has dominated throughoutthe study period the proportion of conversions to large-scale rubber plantations has increasedsignificantly post-2000 Mapped habitat loss converted to rubber plantations has increased by 96between pre-2000 and post-2000 while conversions to oil palm plantations have only increasedby about 14 suggesting that rubber cultivation could be a developing threat for the forests andtiger habitat Other reports also indicate substantial increases in the forest reserve area convertedto rubber plantations between 2005 and 2012 [3] Latex-timber clones rubber trees that can be usedfor both rubber and timber are being propagated across the landscape as a means to expand timberplantations [15] Policies that allow for selectively logged forests under state jurisdiction to be convertedto rubber tree plantations [15] and aggressive plantation schemes by the government [3] continue toendanger Malaysiarsquos forests and tiger habitat
The observed increase in habitat loss under the cleared plantation class could probably beexplained by delays in plantation establishment after forest clearing and that recently establishedplantations could look very similar to land cleared for other land-uses [52] It is important to note thatour analysis focuses on forest loss area that is under plantation in the year 2014 and other intermediaryland uses could exist before plantation establishment Forest conversion has been shown to followinitial logging disturbance in Indonesia [27] In Peninsular Malaysia oil palm plantations are usuallyestablished on degraded previously logged forest or other existing plantations [3133] Moreoverabout 85 of the Malaysian tiger population inhabits forest reserves that have been predominantlyassigned for selective logging [53] It is essential that the role of logging in deforestation and habitatloss in the region be further investigated
5 Conclusions
The Malayan tiger continues to be threatened by habitat loss and fragmentation despite Malaysiarsquosrelatively large area under forest cover [54] Our study maps the natural forest for Peninsular Malaysiafor circa 1988 and the forest loss between 1988 and 2000 and aggregates our forest loss with the GFCglobal forest loss product to produce a consistent forest loss dataset from 1988 to 2012 for the regionWe find that natural forest loss continues within Peninsular Malaysia specifically within its tigerhabitat The conversion of forests to plantations within the region is responsible for about half of allthe deforestation Furthermore we find that the contribution of plantations to the total area of naturalforest loss has increased from pre-2000 to post-2000 Large industrial plantations and recently clearedland are the major contributors of land-use conversion While large industrial plantations continue tobe dominated by oil palm conversion to rubber plantations has been on the rise In this work we havequantified the total loss of habitat but have not assessed more subtle changes in habitat quality that
Remote Sens 2017 9 747 12 of 14
result from natural forest conversion Our map product enables studying the spatial distribution andpatterns of natural forest loss within Peninsular Malaysia and its tiger habitat
Supplementary Materials The following are available online at wwwmdpicom2072-429297747s1Table S1 Image numbers per year and per Landsat sensor used for mapping Table S2 Landsat images usedfor validation
Author Contributions VS PP and TL conceived and designed the experiments VS performed theexperiments VS PP and TL analyzed the data PP and NH contributed reagentsmaterialsanalysis toolsVS PP NH and TL wrote the paper
Conflicts of Interest The authors declare no conflict of interest
References
1 Convention on Biodiversity Diversity (CBD) Malaysia Country Profile Available online httpswwwcbdintcountriesprofiledefaultshtmlcountry=myfacts (accessed on 10 December 2015)
2 Myers N Mittermeier RA Mittermeier CG Da Fonseca GA Kent J Biodiversity hotspots forconservation priorities Nature 2000 403 853ndash858 [CrossRef] [PubMed]
3 Kawanishi K Panthera tigris ssp jacksoni The IUCN Red List of Threatened Species 2015ET136893A50665029 2015 Available online httpdxdoiorg102305IUCNUK2015-2RLTST136893A50665029en (accessed on 10 October 2016)
4 Seidensticker J Saving wild tigers A case study in biodiversity loss and challenges to be met for recoverybeyond 2010 Integr Zool 2010 5 285ndash299 [CrossRef] [PubMed]
5 Gibbs HK Ruesch AS Achard F Clayton MK Holmgren P Ramankutty N Foley JA Tropicalforests were the primary sources of new agricultural land in the 1980s and 1990s Proc Natl Acad Sci USA2010 107 16732ndash16737 [CrossRef] [PubMed]
6 Sodhi SN Posa RCM Lee MT Bickford D Koh PL Brook WB The state and conservation ofSoutheast Asian biodiversity Biodivers Conserv 2010 19 317ndash328 [CrossRef]
7 Kummer DM Turner BL The human causes of deforestation in Southeast Asia Bioscience 1994 44323ndash328 [CrossRef]
8 Abdullah SA Nakagoshi N Forest fragmentation and its correlation to human land use change in thestate of Selangor peninsular Malaysia For Ecol Manag 2007 241 39ndash48 [CrossRef]
9 Abdullah SA Hezri AA From forest landscape to agricultural landscape in the developing tropicalcountry of Malaysia Pattern process and their significance on policy Environ Manag 2008 42 907ndash917[CrossRef] [PubMed]
10 Koh LP Wilcove DS Is oil palm agriculture really destroying tropical biodiversity Conserv Lett 2008 160ndash64 [CrossRef]
11 Food and Agriculture Organization of the United Nations (FAO) Case Study of Tropical Forest Plantations inMalaysia by DBA Krishnapillay Forest Plantations Working Paper 23 FAO Rome Italy 2002 unpublishedAvailable online httpwwwfaoorgdocumentscardenc8ac53512-c384-5b5a-baf4-f6d137e3a421(accessed on 11 July 2017)
12 Byerlee D The Fall and Rise Again of Plantations in Tropical Asia History Repeated Land 2014 3 574ndash597[CrossRef]
13 Fitzherbert EB Struebig MJ Morel A Danielsen F Bruumlhl CA Donald PF Phalan B How will oilpalm expansion affect biodiversity Trends Ecol Evol 2008 23 538ndash545 [CrossRef] [PubMed]
14 Brookfield H Byron Y Deforestation and timber extraction in Borneo and the Malay Peninsula The recordsince 1965 Glob Environ Chang 1990 1 42ndash56 [CrossRef]
15 Clements R Rayan DM Zafir AWA Venkataraman A Alfred R Payne J Ambu L Sharma DSKTrio under threat Can we secure the future of rhinos elephants and tigers in Malaysia Biodivers Conserv2010 19 1115ndash1136 [CrossRef]
16 Kawanishi K Yatim SH Abu Hashim AK Topani R Distribution and potential population size of thetiger in Peninsular Malaysia J Wildl Park 2003 21 29ndash50
17 Joshi AR Dinerstein E Wikramanayake E Anderson ML Olson D Jones BS Seidensticker JLumpkin S Hansen MC Sizer NC et al Tracking changes and preventing loss in critical tiger habitatSci Adv 2016 2 e1501675 [CrossRef] [PubMed]
Remote Sens 2017 9 747 13 of 14
18 World Bank (Washington DC USA) Global Tiger Recovery Program (2010ndash2022) Available online httpdocumentsworldbankorgcurateden874191468331048098Global-tiger-recovery-program-2010-2022(accessed on 27 June 2017)
19 Global Tiger Recovery Program (GTRP) Global Tiger Recovery Program Volume 2 Draft 31 July 2010Washington DC USA 2010 Available online httpadminindiaenvironmentportalorginfilesGTRP-Volume-2-July-31pdf (accessed on 27 June 2017)
20 Department of Wildlife and National Parks Peninsular Malaysia (DWNP) National Tiger Action Plan forMalaysia 2008ndash2020 DWNP Kuala Lumpur Malaysia 2008
21 Hansen MC Stehman SV Potapov PV Loveland TR Townshend JR DeFries RS Pittman KWArunarwati B Stolle F Steininger MK et al Humid tropical forest clearing from 2000 to 2005 quantifiedby using multitemporal and multiresolution remotely sensed data Proc Natl Acad Sci USA 2008 1059439ndash9444 [CrossRef] [PubMed]
22 Hansen MC Stehman SV Potapov PV Quantification of global gross forest cover loss Proc Natl AcadSci USA 2010 107 8650ndash8655 [CrossRef] [PubMed]
23 Miettinen J Shi C Liew SC Deforestation rates in insular Southeast Asia between 2000 and 2010Glob Chang Biol 2011 17 2261ndash2270 [CrossRef]
24 Hansen MC Potapov PV Moore R Hancher M Turubanova SA Tyukavina A Thau DStehman SV Goetz SJ Loveland TR et al High-resolution global maps of 21st-century forest coverchange Science 2013 342 850ndash853 [CrossRef] [PubMed]
25 Kim D Sexton JO Townshend JR Accelerated deforestation in the humid tropics from the 1990s to the2000s Geophys Res Lett 2015 42 3495ndash3501 [CrossRef] [PubMed]
26 Cohen WB Goward SN Landsatrsquos role in ecological applications of remote sensing Bioscience 2004 54535ndash545 [CrossRef]
27 Margono BA Potapov PV Turubanova S Stolle F Hansen MC Primary forest cover loss in Indonesiaover 2000ndash2012 Nat Clim Chang 2014 4 730ndash735 [CrossRef]
28 Srinivas A Koh LP Oil palm expansion drives avifaunal decline in the Pucallpa region of PeruvianAmazonia Glob Ecol Conserv 2016 7 183ndash200 [CrossRef]
29 Peh KSH Sodhi NS De Jong J Sekercioglu CH Yap CAM Lim SLH Conservation value ofdegraded habitats for forest birds in southern Peninsular Malaysia Divers Distrib 2006 12 572ndash581[CrossRef]
30 Maddox T The Conservation of Tigers and Other Wildlife in Oil Palm Plantations Jambi Province SumatraIndonesia Zoological Society of London (ZSL) London UK 2007
31 Wicke S Sikkema R Dornburg V Faaij A Exploring land use changes and the role of palm oil productionin Indonesia and Malaysia Land Use Policy 2011 28 193ndash206 [CrossRef]
32 McMorrow J Talip MA Decline of forest area in Sabah Malaysia Relationship to state policies land codeand land capability Glob Environ Chang 2001 11 217ndash230 [CrossRef]
33 Gunarso P Hartoyo M Agus F Killeen T Oil Palm and Land Use Change in Indonesia Malaysia andPapua New Guinea Reports from the Technical Panels of the 2nd Greenhouse Gas Working Group of theRoundtable on Sustainable Palm Oil (RSPO) RSPO Kuala Lumpur Malaysia 2013 pp 29ndash64 Availableonline httpwwwrspoorgkey-documentssupplementary-materials (accessed on 20 June 2016)
34 Food and Agriculture Organization of the United Nations (FAO) Countries Geography Malaysia 2012Available online httpwwwfaoorgforestrycountry18310enmys (accessed on 22 June 2017)
35 Forestry Department of Peninsular Malaysia (FDPM) Forest Types 2016 Available online httpswwwforestrygovmyindexphpen2016-06-07-02-31-392016-06-07-02-35-17forest-type (accessed on22 June 2017)
36 Sanderson E Forrest J Loucks C Ginsberg J Dinerstein E Seidensticker J Leimgruber P Songer MHeydlauff A OrsquoBrien T et al Setting Priorities for the Conservation and Recovery of Wild Tigers 2005ndash2015 TheTechnical Assessment World Wildlife Fund Washington DC USA Wildlife Conservation Society New YorkNY USA Smithsonian and National Fish and Wildlife Foundation Washington DC USA 2006
37 UNEP-WCMC and IUCN Protected Planet The World Database on Protected Areas (WDPA) UNEP-WCMCCambridge UK 2016 Available online wwwprotectedplanetnet (accessed on 10 February 2016)
Remote Sens 2017 9 747 14 of 14
38 Petersen R Aksenov D Goldman E Sargent S Harris N Manisha A Esipova E Shevade VLoboda T Mapping Tree Plantations with Multispectral Imagery Preliminary Results for Seven Tropical CountriesTechnical Note World Resources Institute Washington DC USA 2016 Available online httpwwwwriorgpublicationmapping-tree-plantations (accessed on 23 September 2016)
39 Potapov PV Turubanova SA Hansen MC Adusei B Broich M Altstatt A Mane L Justice COQuantifying forest cover loss in Democratic Republic of the Congo 2000ndash2010 with Landsat ETM+ dataRemote Sens Environ 2012 122 106ndash116 [CrossRef]
40 Potapov PV Turubanova SA Tyukavina A Krylov AM McCarty JL Radeloff VC Hansen MCEastern Europersquos forest cover dynamics from 1985 to 2012 quantified from the full Landsat archiveRemote Sens Environ 2015 159 28ndash43 [CrossRef]
41 Tucker CJ Red and photographic infrared linear combinations for monitoring vegetation Remote SensEnviron 1979 8 127ndash150 [CrossRef]
42 Xiao X Zhang Q Braswell B Urbanski S Boles S Wofsy SC Moore B Ojima D Modeling grossprimary production of a deciduous broadleaf forest using satellite images and climate data Remote SensEnviron 2004 91 256ndash270 [CrossRef]
43 Breiman L Bagging predictors Mach Learn 1996 24 123ndash140 [CrossRef]44 Giree N Stehman SV Potapov P Hansen MC A sample-based forest monitoring strategy using Landsat
AVHRR and MODIS data to estimate gross forest cover loss in Malaysia between 1990 and 2005 Remote Sens2013 5 1842ndash1855 [CrossRef]
45 Olofsson P Foody GM Herold M Stehman SV Woodcock CE Wulder MA Good practices forestimating area and assessing accuracy of land change Remote Sens Environ 2014 148 42ndash57 [CrossRef]
46 Olofsson P Foody GM Stehman SV Woodcock CE Making better use of accuracy data in land changestudies Estimating accuracy and area and quantifying uncertainty using stratified estimation Remote SensEnviron 2013 129 122ndash131 [CrossRef]
47 Intergovernmental Panel on Climate Change (IPCC) 2006 IPCC Guidelines for National Greenhouse GasInventories Prepared by the National Greenhouse Gas Inventories Programme Eggleston HS Buendia LMiwa K Ngara T Tanabe K Eds Institute for Global Environmental Strategies Hayama Japan 2006
48 Tyukavina A Stehman SV Potapov PV Turubanova SA Baccini A Goetz SJ Laporte NTHoughton RA Hansen MC National-scale estimation of gross forest aboveground carbon loss Acase study of the Democratic Republic of the Congo Environ Res Lett 2013 8 044039 [CrossRef]
49 Potapov PV Dempewolf J Talero Y Hansen MC Stehman SV Vargas C Rojas EJ Castillo DMendoza E Calderoacuten A et al National satellite-based humid tropical forest change assessment in Peru insupport of REDD+ implementation Environ Res Lett 2014 9 124012 [CrossRef]
50 Sheil D Casson A Meijaard E van Nordwijk M Gaskell J Sunderland-Groves J Wertz KKanninen M The Impacts and Opportunities of Oil Palm in Southeast Asia What Do We Know and WhatDo We Need to Know Occasional Paper No 51 Center for International Forestry Research (CIFOR) BogorIndonesia 2009
51 Gaveau DL Sheil D Husnayaen MAS Arjasakusuma S Ancrenaz M Pacheco P Meijaard ERapid conversions and avoided deforestation Examining four decades of industrial plantation expansion inBorneo Sci Rep 2016 6 32017 [CrossRef] [PubMed]
52 Koh LP Miettinen J Liew SC Ghazoul J Remotely sensed evidence of tropical peatland conversion tooil palm Proc Natl Acad Sci USA 2011 108 5127ndash5132 [CrossRef] [PubMed]
53 Rayan DM Linkie M Conserving tigers in Malaysia A science-driven approach for eliciting conservationpolicy change Biol Conserv 2015 184 18ndash26 [CrossRef]
54 Rayan DM Mohamad SW The importance of selectively logged forests for tiger Panthera tigrisconservation A population density estimate in Peninsular Malaysia Oryx 2009 43 48ndash51 [CrossRef]
copy 2017 by the authors Licensee MDPI Basel Switzerland This article is an open accessarticle distributed under the terms and conditions of the Creative Commons Attribution(CC BY) license (httpcreativecommonsorglicensesby40)
- Introduction
- Materials and Methods
-
- Study Area
- Overview
- Data
- Natural Forest Mapping
- Forest Loss Mapping
- Sample-Based Adjustment of the Area Estimation
-
- Results
-
- Natural Forest Extent and Change from 1988ndash2012
- Tiger Habitat Loss and Change from 1988ndash2012
- Accuracy Assessment of 1988ndash2000 and 2001ndash2012 Forest Loss
-
- Discussion
- Conclusions
-

Remote Sens 2017 9 747 4 of 14
22 Overview
Natural forests are defined as mature naturally regenerated forests that have a minimum areaof 5 ha and have not been completely cleared or replanted in recent history although some signs ofdisturbance like selective logging might be present [27] Natural forest loss includes tree removal dueto logging as well as land use conversion (from agriculture and plantation expansion infrastructuredevelopment etc) To quantify natural forest loss we (1) mapped the natural forest extent forthe year 1988 (2) applied a change detection model to map forest loss between 1988 and 2000 and(3) aggregated the pre-year 2000 forest loss with the existing published Landsat-based Global ForestChange (GFC) tree cover loss product for 2001ndash2012 [24] and assessed the loss within mapped naturalforests (Figure 2) We then overlaid the plantation map obtained from [38] with the 1988ndash2012 naturalforest loss map to estimate the role of plantations in the overall forest loss PCI Geomatica softwarewas used for generating training samples for natural forest and forest loss mapping while ArcGIS wasused for the analysis of forest loss and conversion to plantations
Remote Sens 2017 9 747 4 of 14
22 Overview
Natural forests are defined as mature naturally regenerated forests that have a minimum area of 5 ha and have not been completely cleared or replanted in recent history although some signs of disturbance like selective logging might be present [27] Natural forest loss includes tree removal due to logging as well as land use conversion (from agriculture and plantation expansion infrastructure development etc) To quantify natural forest loss we (1) mapped the natural forest extent for the year 1988 (2) applied a change detection model to map forest loss between 1988 and 2000 and (3) aggregated the pre-year 2000 forest loss with the existing published Landsat-based Global Forest Change (GFC) tree cover loss product for 2001ndash2012 [24] and assessed the loss within mapped natural forests (Figure 2) We then overlaid the plantation map obtained from [38] with the 1988ndash2012 natural forest loss map to estimate the role of plantations in the overall forest loss PCI Geomatica software was used for generating training samples for natural forest and forest loss mapping while ArcGIS was used for the analysis of forest loss and conversion to plantations
Figure 2 Methodology used to map natural forest natural forest loss and plantation expansion
23 Data
We analyzed the entire archive of Landsat 5 Thematic Mapper (TM) and Landsat 7 Enhanced Thematic Mapper (ETM+) images available for the region from 1988 to 2002 The region is covered by 20 WRS-2 footprints The entire archive of available imagery consisting of 1110 processing Level 1 terrain corrected (L1T) images was employed The number of images used from the different Landsat sensors is listed in Table S1 Landsat imagery processing followed the methodology of [24] and is described in detail in [39] where per-pixel raw digital numbers were converted to top of atmosphere reflectance screened for cloudshadowhazewater and following quality assessment were radiometrically normalized and composited into a single clear-surface layer Screening and quality assessment involved using decision tree models to predict the presence of cloud shadow and water to obtain the per-pixel probability of contamination by these features [2439] The observation
Figure 2 Methodology used to map natural forest natural forest loss and plantation expansion
23 Data
We analyzed the entire archive of Landsat 5 Thematic Mapper (TM) and Landsat 7 EnhancedThematic Mapper (ETM+) images available for the region from 1988 to 2002 The region is coveredby 20 WRS-2 footprints The entire archive of available imagery consisting of 1110 processingLevel 1 terrain corrected (L1T) images was employed The number of images used from the differentLandsat sensors is listed in Table S1 Landsat imagery processing followed the methodology of [24]and is described in detail in [39] where per-pixel raw digital numbers were converted to top ofatmosphere reflectance screened for cloudshadowhazewater and following quality assessmentwere radiometrically normalized and composited into a single clear-surface layer Screening and
Remote Sens 2017 9 747 5 of 14
quality assessment involved using decision tree models to predict the presence of cloud shadow andwater to obtain the per-pixel probability of contamination by these features [2439] The observationquality of pixels was recorded and pixels with a high probability of contamination were thenexcluded from processing [2439] Normalization was carried out using Moderate Resolution ImagingSpectroradiometer (MODIS) derived surface reflectance products as normalization targets in order toreduce the variations in reflectance resulting from differences in image dates atmospheric conditionsand surface anisotropy [39] As Peninsular Malaysia is a part of the humid tropics images from theentire year were used for multi-date image compositing in order to generate start or end date (1988or 2000) cloud-free image mosaics using only pixels with the highest quality observations [39] Dueto limited image availability and the very high incidence of cloud cover in this region clear surfaceobservations from adjacent years were used to fill the gaps in both the image composites For theldquocirca 1988rdquo composite 71 of the pixels used were from the 1988ndash1990 interval and for the ldquocirca2000rdquo composite 99 of the pixels used were from the 1999ndash2001 interval
All processed per-pixel cloud-free observations between the earliest observation for the start year(1988) and the latest observation for the last year (2000) were used to create a set of multi-temporalmetrics that was used for natural forest mapping and forest loss detection (Table 1) This multi-temporalmetric set was developed following the methods described in [243940] using two approaches(1) time-sequential reflectance observations by date and (2) ranked (low to high) band reflectancevalues or ranked observations corresponding to the ranked normalized difference vegetation index(NDVI) [41] normalized difference water index (NDWI) [42] values and thermalinfrared band valuesIn addition to the startend date cloud-free image mosaics the means and medians of the first threeobservations and last three observations the maximal values of time-sequential reflectance gain andloss and the slope of linear regression of reflectanceindex values and observation date [2440] weregenerated For the rank-based metrics a set of percentile values and symmetrical and asymmetricalaverages for various percentile range intervals were used [2440] On average about 16 cloud-freeobservations were available per-pixel for the calculation of metrics The first (circa 1988) and last (circa2000) cloud-free image composites along with the mediansmeans of the first three and last threeobservations were used for visual interpretation to generate training samples for mapping
Table 1 Overview of the different multi-temporal metrics used for classification and mapping
Types of Metrics Multi-Temporal Metrics
Image Composites1 First and last cloud-free observations2 Mean and Median of first 3 observations3 Mean and Median of last 3 observations
Rank-based Metrics
1 Percentiles representing minimum 10 25 50 75 90 and maximum for bandreflectance or index (NDVI NDWI) values2 Symmetrical averages for various intervals minimumndashmaximum 10ndash90 25ndash753 Asymmetrical averages for various intervals minimumndash10 10ndash25 25ndash50 50ndash7575ndash90 90-maximum
Trend Analysis Metrics1 Slope of linear regression of band reflectance versus image date2 Standard deviation of band reflectance 1988ndash20003 Maximum lossgain of reflectanceindex value between consecutive observations
We used the GFC tree cover loss product [24] for the years 2001ndash2012 to extend our 1988ndash2000forest loss map This product maps the loss of tree cover taller than 5 m at a resolution equivalent toLandsat data To estimate forest loss converted to plantations we used a plantation map generatedfor Peninsular Malaysia by the World Resources Institute (WRI) [38] This product maps plantationareas in 2014 categorized into large industrial-sized plantations medium-sized and small-sizedmosaic plantations and recently cleared or young plantation classes Large industrial plantations aremonocultures with species information associated with plantation areas while mosaic plantationsinclude some non-plantation areas like other agriculture forest patches and settlements interspersedwith plantations
Remote Sens 2017 9 747 6 of 14
24 Natural Forest Mapping
The 1988 Landsat image mosaic was visually interpreted to determine the training samples fornatural forest (dependent variable) versus all other land cover types The natural forest classificationtraining sample consisted of more than 450000 training pixels Multi-temporal metrics (Table 1) wereused as independent variables to build a bagged decision tree model to map natural forest areas [24]While using ldquobaggingrdquo or bootstrap aggregation the data are divided into a test set which is a randomsample drawn from the training population and a learning set which is the remaining portion of thetraining population [43] We used a test set of 20 of the training data and developed output mapsbased on the median class likelihood from the outputs of several trees
Natural forest patch size was restricted to 5 ha [27] and manual editing of the classification resultswas performed [27] to correct for obvious errors like removing older plantations and including someomitted water-logged forest areas along the coast For this study tiger habitat for Peninsular Malaysiais defined as natural forest area within the TCL Tiger habitat and habitat are used interchangeably inthe rest of the paper
25 Forest Loss Mapping
Forest loss is defined as a temporal or permanent reduction in tree cover density [242744]resulting in a complete or almost complete removal of trees within a 30 m Landsat pixel [40] Itcould result from conversion to agricultureplantations intensive logging or natural disturbancesTraining samples for lsquoforest lossrsquo and lsquono lossrsquo between 1988 and 2000 were created after the visualinterpretation of 1988 and 2000 image mosaics and maximum reflectance composites [40] In totalmore than 510000 pixels were used to train the forest loss classification Forest loss during 1988ndash2000(pre-2000) was mapped in one time-step using a decision tree classifier and multi-temporal metricsForest loss during 2001ndash2012 (post-2000) within mapped natural forest areas was extracted from theGFC product Owing to the increased image availability after the year 2000 as opposed to that in the1980s and 1990s we can estimate post-2000 loss at an annual time-step using the GFC product Allforest loss within the mapped 1988 natural forest mask was considered as natural forest loss (Figure 2)As the pre-2000 and post-2000 forest loss is mapped separately in cases of overlap between the twothe loss year (interval) was attributed to the first detected loss event (pre-2000) However as imageryfrom years 2001 and 2002 had been used to gap-fill the 2000 mosaic in instances of overlap betweenmapped pre-2000 loss and the GFC product loss from either year 2001 or 2002 we attributed loss tothe respective post-2000 year Tiger habitat loss was quantified by assessing forest loss within the tigerhabitat area
26 Sample-Based Adjustment of the Area Estimation
Separate sample-based assessments were performed for the newly developed pre-2000 forest lossand the post-2000 forest loss subset from the GFC product following the methodology used by [40]In this approach the strata for sampling were based on lsquonatural forest lossrsquo and lsquono lossrsquo classesfor both the pre-2000 and post-2000 periods For each forest loss period sample pixels were drawnusing a stratified random sampling design Following the ldquogood practicesrdquo suggested by [45] inorder to balance the area estimates and all accuracies we used a sampling design slightly away fromproportional such that rare strata have a sample size slightly greater than proportional allocation Weused Landsat imagery mosaics for 1988 and 2000 along with composites for 1990 and 1995 for visualassessment of the pre-2000 loss validation samples Landsat images where available (Table S2) theminimum annual NDVI and Google Earth imagery were used in addition to the 2000 and 2012 Landsatmosaics for an assessment of the 2001ndash2012 validation samples Following the visual assessment of allsamples an accuracy assessment of the map and sample-based area estimation of mapped classes wasconducted following the method for the land area change estimation described in [46] Additionallywe followed the same procedure to estimate the forest loss area within the tiger habitat separately
Remote Sens 2017 9 747 7 of 14
using only validation samples within the TCL The accuracy of the plantation map is reported in [38]The overall accuracy of the plantation map is 867 while the producerrsquos and userrsquos accuracies were968 and 788 respectively
Our total natural forest loss and habitat loss area estimates were obtained from the sample-basedarea estimation for pre-2000 and post-2000 The error-adjusted area for natural forest and habitatloss within plantations was estimated by using the proportion of mapped loss within plantationsThe error-adjusted estimates for the annual area of natural forest and habitat loss between 2001and 2012 were obtained by disaggregating the post-2000 sample-based area estimate into annual timescales using the yearly proportion of post-2000 natural forest and habitat loss All areas reported inthe paper are based on error-adjusted area estimates unless categorically noted as ldquomapped areardquo orldquomapped lossrdquo
3 Results
31 Natural Forest Extent and Change from 1988ndash2012
The total natural forest area within Peninsular Malaysia in 1988 was estimated as 716 MhaRoughly 65 of the 1988 natural forest area was within the TCL and is considered as tiger habitat forthe remaining analysis The error-adjusted areas for total forest loss and habitat loss along with theirerror estimates are reported in Table 2 Standard errors for pre-2000 and post-2000 sample-based areaestimates were obtained following [46] while the total error for the sample-based area estimate wasobtained following the method for propagation of error suggested by the Intergovernmental Panel onClimate Change (IPCC) Guidelines [47] Our map (Figure 3) underestimates the area of loss and thesample-based area estimates (Table 2) are higher than the mapped loss for both periods (579568 ha forpre-2000 and 565881 ha for post-2000)
By 2012 the total gross forest loss area in Peninsular Malaysia was estimated to be 135 Mha or19 of its 1988 natural forest area (Figure 3 Table 2) The annual rate of loss has increased between thetwo periods from an average of 49281 ha yearminus1 pre-2000 to 63422 ha yearminus1 post-2000 (Figure 4)Using the GFC product we estimated loss at an annual time step for the post-2000 period This annualloss has been increasing since 2001 and reached a peak at 122167 ha in 2012 (Figure 4)
Plantation expansion is responsible for 651757 ha or 48 of the total natural forest loss The meanannual rate of natural forest converted to plantations has increased from 19970 ha yearminus1 pre-2000 to34344 ha yearminus1 post-2000 (Figure 4) The majority of the forest loss converted to plantations (57loss within plantations) was due to the large industrial plantation expansion Recently cleared landconstitutes 17 and 30 of all pre-2000 and post-2000 forest loss within plantations respectivelyBased on the species information associated with large industrial plantations we estimate that oilpalm dominated plantations constitute about 80 of the total forest loss (1988-2000) converted to thiscategory while the proportion of forest loss converted to large rubber plantations has increased from15 pre-2000 to 25 post-2000
Table 2 Sample-based area (Mha) estimates with 95 confidence intervals for pre-2000 and post-2000total natural forest and habitat loss and loss within plantations by 2014
Study Period Total Loss Total Losswithin Plantations Habitat Loss Habitat Loss
within Plantations
Pre-2000 059 plusmn 011 024 plusmn 005 042 plusmn 011 015 plusmn 004Post-2000 076 plusmn 013 041 plusmn 007 041 plusmn 010 023 plusmn 006
Total 135 plusmn 017 065 plusmn 008 083 plusmn 015 038 plusmn 007
Remote Sens 2017 9 747 8 of 14Remote Sens 2017 9 747 8 of 14
Figure 3 Mapped natural forest remaining in 2013 tiger conservation landscape (TCL) and natural forest loss between 1988ndash2000 (pre-2000) and 2001ndash2012 (post-2000)
Figure 4 Sample-based area (thousand ha) estimates for yearly natural forest and habitat loss and annual rates of total natural forest loss for pre-2000 and post-2000 periods Yearly losses are depicted as solid lines while mean annual rates of loss for the pre-2000 and post-2000 periods are average rates of loss for the respective periods depicted as constant dashed lines
0
20
40
60
80
100
120
140
1988
1989
1990
1991
1992
1993
1994
1995
1996
1997
1998
1999
2000
2001
2002
2003
2004
2005
2006
2007
2008
2009
2010
2011
2012
For
est a
nd ti
ger
habi
tat l
oss
in
Tho
usan
ds o
f H
ecta
res
Pre-2000 Mean annual rate of forest loss Yearly natural forest loss
Post-2000 Mean annual rate of forest loss Yearly tiger habitat loss
Figure 3 Mapped natural forest remaining in 2013 tiger conservation landscape (TCL) and naturalforest loss between 1988ndash2000 (pre-2000) and 2001ndash2012 (post-2000)
Remote Sens 2017 9 747 8 of 14
Figure 3 Mapped natural forest remaining in 2013 tiger conservation landscape (TCL) and natural forest loss between 1988ndash2000 (pre-2000) and 2001ndash2012 (post-2000)
Figure 4 Sample-based area (thousand ha) estimates for yearly natural forest and habitat loss and annual rates of total natural forest loss for pre-2000 and post-2000 periods Yearly losses are depicted as solid lines while mean annual rates of loss for the pre-2000 and post-2000 periods are average rates of loss for the respective periods depicted as constant dashed lines
0
20
40
60
80
100
120
140
1988
1989
1990
1991
1992
1993
1994
1995
1996
1997
1998
1999
2000
2001
2002
2003
2004
2005
2006
2007
2008
2009
2010
2011
2012
For
est a
nd ti
ger
habi
tat l
oss
in
Tho
usan
ds o
f H
ecta
res
Pre-2000 Mean annual rate of forest loss Yearly natural forest loss
Post-2000 Mean annual rate of forest loss Yearly tiger habitat loss
Figure 4 Sample-based area (thousand ha) estimates for yearly natural forest and habitat loss andannual rates of total natural forest loss for pre-2000 and post-2000 periods Yearly losses are depictedas solid lines while mean annual rates of loss for the pre-2000 and post-2000 periods are average ratesof loss for the respective periods depicted as constant dashed lines
Remote Sens 2017 9 747 9 of 14
32 Tiger Habitat Loss and Change from 1988ndash2012
A total of 831571 hectares of tiger habitat (18 of 1988 habitat area) have been lost over the entirestudy period The average annual habitat loss pre-2000 and post-2000 has remained nearly the same(34060 ha and 35237 ha respectively) However the annual habitat area lost has been increasing from2001 to 2012 with an estimated 70692 ha lost in the year 2012 (Figure 4)
Approximately 46 of the total habitat loss has been converted to plantations adding 381808 hato Peninsular Malaysiarsquos land under plantations by 2014 The rate of habitat conversion to plantationshas increased from 12309 ha yearminus1 pre-2000 to 19508 ha yearminus1 post-2000 (Table 2) Large industrialplantations constitute the largest fraction (61 of pre-2000 loss and 49 of post-2000 loss) of theconverted habitat area followed by cleared land (23 of pre-2000 loss and 37 of post-2000 loss)while the remaining converted habitat is within mosaic plantations (Figure 5a) The habitat loss areafrom more recent years has a greater proportion within the recently cleared plantation class (Figure 5b)Large industrial monoculture plantations established within the tiger habitat are dominated by oilpalm 65 of all habitat loss converted to large plantations is now under oil palm while the remaining(35) habitat loss converted to large plantations is under rubber cultivation However the proportionalarea of large industrial plantations under rubber cultivation that has been established from habitat losshas increased between pre-2000 and post-2000 from 29 to 41
Remote Sens 2017 9 747 9 of 14
32 Tiger Habitat Loss and Change from 1988ndash2012
A total of 831571 hectares of tiger habitat (18 of 1988 habitat area) have been lost over the entire study period The average annual habitat loss pre-2000 and post-2000 has remained nearly the same (34060 ha and 35237 ha respectively) However the annual habitat area lost has been increasing from 2001 to 2012 with an estimated 70692 ha lost in the year 2012 (Figure 4)
Approximately 46 of the total habitat loss has been converted to plantations adding 381808 ha to Peninsular Malaysiarsquos land under plantations by 2014 The rate of habitat conversion to plantations has increased from 12309 ha yearminus1 pre-2000 to 19508 ha yearminus1 post-2000 (Table 2) Large industrial plantations constitute the largest fraction (61 of pre-2000 loss and 49 of post-2000 loss) of the converted habitat area followed by cleared land (23 of pre-2000 loss and 37 of post-2000 loss) while the remaining converted habitat is within mosaic plantations (Figure 5a) The habitat loss area from more recent years has a greater proportion within the recently cleared plantation class (Figure 5b) Large industrial monoculture plantations established within the tiger habitat are dominated by oil palm 65 of all habitat loss converted to large plantations is now under oil palm while the remaining (35) habitat loss converted to large plantations is under rubber cultivation However the proportional area of large industrial plantations under rubber cultivation that has been established from habitat loss has increased between pre-2000 and post-2000 from 29 to 41
Figure 5 (a) Percent of total tiger habitat loss pre-2000 (1988ndash2000) and post-2000 (2001ndash2012) within different plantation types by 2014 (b) Sample-based area of habitat loss between 2001 and 2012 within plantations (in 2014) by plantation type
Figure 5 (a) Percent of total tiger habitat loss pre-2000 (1988ndash2000) and post-2000 (2001ndash2012) withindifferent plantation types by 2014 (b) Sample-based area of habitat loss between 2001 and 2012 withinplantations (in 2014) by plantation type
Remote Sens 2017 9 747 10 of 14
33 Accuracy Assessment of 1988ndash2000 and 2001ndash2012 Forest Loss
We performed separate accuracy assessments for natural forest loss and tiger habitat loss forthe 1988ndash2000 interval mapped in this research and 2001ndash2012 loss obtained from the GFC product(Table 3) The overall accuracy for both products exceeds 95 however specific userrsquos and producerrsquosaccuracies for each class vary The lowest producerrsquos accuracies are reported for forest loss classeswithin the TCL (below 60) Userrsquos accuracies are consistently higher with the lowest value (75)reported for the forest loss class in the pre-2000 mapping period
Table 3 Error Matrices for pre-2000 (1988ndash2000) and post-2000 (2001ndash2012) natural forest and habitatlossno loss maps with cell entries depicting the estimated area proportions N is the number of totalsample points used for the assessment
Reference
Loss No Loss Total Userrsquos Producerrsquos Overall
Pre-2000 Forest N = 475
Map
Loss 006 002 008 075 075 096No Loss 002 09 092 098 098
Total 008 092 1
Post-2000 Forest N = 489
Map
Loss 007 001 008 088 063 095No Loss 004 088 092 096 099
Total 012 088 1
Pre-2000 Habitat N = 314
Map
Loss 005 001 006 090 055 095No Loss 004 090 094 096 099
Total 009 091 100
Post-2000 Habitat N = 358
Map
Loss 006 0005 006 092 057 095No Loss 004 090 094 096 099
Total 0096 0904 100
4 Discussion
Sample-based area estimates provide a better estimation of loss area than simple map-basedestimates [46] and have been used to correct for the underestimation of forest loss [4849]Error-adjustment increased the estimated areas of natural forest loss and tiger habitat loss for bothpre-2000 and post-2000 periods Userrsquos and producerrsquos accuracies are not distributed uniformlyalthough the omission error is consistently high for both periods for natural forest and tiger habitat loss
Based on our total estimated gross natural forest loss of 135 Mha it is evident that deforestationcontinues to be a problem for Peninsular Malaysiarsquos forest Our estimated forest loss area from2000ndash2010 of 049 Mha is higher compared to the 044 Mha value reported by [23] This difference canbe attributed to the improved spatial resolution of data used (250 m vs 30 m in this study) and theimplementation of the sample-based unbiased area estimation method We observe an accelerationin forest loss from pre-2000 to post-2000 similar to previous reports across the humid tropics and inAsia [25] Our study adds to a recent study of global tiger habitat [17] and provides a more extensiveassessment of habitat loss within Peninsular Malaysia and the contribution of expanding plantationsHowever we have only mapped forest loss within habitat and have not assessed the quality of theremaining habitat which can be further affected by the fragmentation or creation of greater edge andincreased access Furthermore the estimated conversion of natural forests and habitat to plantations in
Remote Sens 2017 9 747 11 of 14
our study is limited by the plantation dataset used Any undetected or cryptic plantations will resultin an underestimation of the forest area converted to plantations over the study period While anyforest conversion to cryptic plantations is a concern for tiger habitat loss the forest area convertedto these plantations is of relatively low importance when compared with forest conversions to largeindustrial plantations like those of oil palm and rubber
With 48 of all the natural forest lost during 1988ndash2012 converted to plantations by 2014plantation expansion can be considered a major contributor to forest loss in Peninsular MalaysiaLarge industrial plantations constitute more than half of the forest converted to plantations in bothstudy periods Contrary to claims by the Malaysian palm oil industry [5051] our results show thatoil palm plantations have continued to expand at the expense of natural forest areas Our analysisshows that approximately 242000 ha of mapped forest loss between 1988 and 2012 were convertedto industrial oil palm plantations by 2014 Additionally we observe an increased conversion of bothforest and habitat loss to plantations post-2000 primarily due to the observed increase of annual lossafter 2006 especially within tiger habitat The proportion of total loss converted to plantations hasincreased from 40 to 54 between the two periods while the proportion of habitat loss converted toplantations has increased from 35 to 57
Although the conversion of forest and habitat to oil palm plantations has dominated throughoutthe study period the proportion of conversions to large-scale rubber plantations has increasedsignificantly post-2000 Mapped habitat loss converted to rubber plantations has increased by 96between pre-2000 and post-2000 while conversions to oil palm plantations have only increasedby about 14 suggesting that rubber cultivation could be a developing threat for the forests andtiger habitat Other reports also indicate substantial increases in the forest reserve area convertedto rubber plantations between 2005 and 2012 [3] Latex-timber clones rubber trees that can be usedfor both rubber and timber are being propagated across the landscape as a means to expand timberplantations [15] Policies that allow for selectively logged forests under state jurisdiction to be convertedto rubber tree plantations [15] and aggressive plantation schemes by the government [3] continue toendanger Malaysiarsquos forests and tiger habitat
The observed increase in habitat loss under the cleared plantation class could probably beexplained by delays in plantation establishment after forest clearing and that recently establishedplantations could look very similar to land cleared for other land-uses [52] It is important to note thatour analysis focuses on forest loss area that is under plantation in the year 2014 and other intermediaryland uses could exist before plantation establishment Forest conversion has been shown to followinitial logging disturbance in Indonesia [27] In Peninsular Malaysia oil palm plantations are usuallyestablished on degraded previously logged forest or other existing plantations [3133] Moreoverabout 85 of the Malaysian tiger population inhabits forest reserves that have been predominantlyassigned for selective logging [53] It is essential that the role of logging in deforestation and habitatloss in the region be further investigated
5 Conclusions
The Malayan tiger continues to be threatened by habitat loss and fragmentation despite Malaysiarsquosrelatively large area under forest cover [54] Our study maps the natural forest for Peninsular Malaysiafor circa 1988 and the forest loss between 1988 and 2000 and aggregates our forest loss with the GFCglobal forest loss product to produce a consistent forest loss dataset from 1988 to 2012 for the regionWe find that natural forest loss continues within Peninsular Malaysia specifically within its tigerhabitat The conversion of forests to plantations within the region is responsible for about half of allthe deforestation Furthermore we find that the contribution of plantations to the total area of naturalforest loss has increased from pre-2000 to post-2000 Large industrial plantations and recently clearedland are the major contributors of land-use conversion While large industrial plantations continue tobe dominated by oil palm conversion to rubber plantations has been on the rise In this work we havequantified the total loss of habitat but have not assessed more subtle changes in habitat quality that
Remote Sens 2017 9 747 12 of 14
result from natural forest conversion Our map product enables studying the spatial distribution andpatterns of natural forest loss within Peninsular Malaysia and its tiger habitat
Supplementary Materials The following are available online at wwwmdpicom2072-429297747s1Table S1 Image numbers per year and per Landsat sensor used for mapping Table S2 Landsat images usedfor validation
Author Contributions VS PP and TL conceived and designed the experiments VS performed theexperiments VS PP and TL analyzed the data PP and NH contributed reagentsmaterialsanalysis toolsVS PP NH and TL wrote the paper
Conflicts of Interest The authors declare no conflict of interest
References
1 Convention on Biodiversity Diversity (CBD) Malaysia Country Profile Available online httpswwwcbdintcountriesprofiledefaultshtmlcountry=myfacts (accessed on 10 December 2015)
2 Myers N Mittermeier RA Mittermeier CG Da Fonseca GA Kent J Biodiversity hotspots forconservation priorities Nature 2000 403 853ndash858 [CrossRef] [PubMed]
3 Kawanishi K Panthera tigris ssp jacksoni The IUCN Red List of Threatened Species 2015ET136893A50665029 2015 Available online httpdxdoiorg102305IUCNUK2015-2RLTST136893A50665029en (accessed on 10 October 2016)
4 Seidensticker J Saving wild tigers A case study in biodiversity loss and challenges to be met for recoverybeyond 2010 Integr Zool 2010 5 285ndash299 [CrossRef] [PubMed]
5 Gibbs HK Ruesch AS Achard F Clayton MK Holmgren P Ramankutty N Foley JA Tropicalforests were the primary sources of new agricultural land in the 1980s and 1990s Proc Natl Acad Sci USA2010 107 16732ndash16737 [CrossRef] [PubMed]
6 Sodhi SN Posa RCM Lee MT Bickford D Koh PL Brook WB The state and conservation ofSoutheast Asian biodiversity Biodivers Conserv 2010 19 317ndash328 [CrossRef]
7 Kummer DM Turner BL The human causes of deforestation in Southeast Asia Bioscience 1994 44323ndash328 [CrossRef]
8 Abdullah SA Nakagoshi N Forest fragmentation and its correlation to human land use change in thestate of Selangor peninsular Malaysia For Ecol Manag 2007 241 39ndash48 [CrossRef]
9 Abdullah SA Hezri AA From forest landscape to agricultural landscape in the developing tropicalcountry of Malaysia Pattern process and their significance on policy Environ Manag 2008 42 907ndash917[CrossRef] [PubMed]
10 Koh LP Wilcove DS Is oil palm agriculture really destroying tropical biodiversity Conserv Lett 2008 160ndash64 [CrossRef]
11 Food and Agriculture Organization of the United Nations (FAO) Case Study of Tropical Forest Plantations inMalaysia by DBA Krishnapillay Forest Plantations Working Paper 23 FAO Rome Italy 2002 unpublishedAvailable online httpwwwfaoorgdocumentscardenc8ac53512-c384-5b5a-baf4-f6d137e3a421(accessed on 11 July 2017)
12 Byerlee D The Fall and Rise Again of Plantations in Tropical Asia History Repeated Land 2014 3 574ndash597[CrossRef]
13 Fitzherbert EB Struebig MJ Morel A Danielsen F Bruumlhl CA Donald PF Phalan B How will oilpalm expansion affect biodiversity Trends Ecol Evol 2008 23 538ndash545 [CrossRef] [PubMed]
14 Brookfield H Byron Y Deforestation and timber extraction in Borneo and the Malay Peninsula The recordsince 1965 Glob Environ Chang 1990 1 42ndash56 [CrossRef]
15 Clements R Rayan DM Zafir AWA Venkataraman A Alfred R Payne J Ambu L Sharma DSKTrio under threat Can we secure the future of rhinos elephants and tigers in Malaysia Biodivers Conserv2010 19 1115ndash1136 [CrossRef]
16 Kawanishi K Yatim SH Abu Hashim AK Topani R Distribution and potential population size of thetiger in Peninsular Malaysia J Wildl Park 2003 21 29ndash50
17 Joshi AR Dinerstein E Wikramanayake E Anderson ML Olson D Jones BS Seidensticker JLumpkin S Hansen MC Sizer NC et al Tracking changes and preventing loss in critical tiger habitatSci Adv 2016 2 e1501675 [CrossRef] [PubMed]
Remote Sens 2017 9 747 13 of 14
18 World Bank (Washington DC USA) Global Tiger Recovery Program (2010ndash2022) Available online httpdocumentsworldbankorgcurateden874191468331048098Global-tiger-recovery-program-2010-2022(accessed on 27 June 2017)
19 Global Tiger Recovery Program (GTRP) Global Tiger Recovery Program Volume 2 Draft 31 July 2010Washington DC USA 2010 Available online httpadminindiaenvironmentportalorginfilesGTRP-Volume-2-July-31pdf (accessed on 27 June 2017)
20 Department of Wildlife and National Parks Peninsular Malaysia (DWNP) National Tiger Action Plan forMalaysia 2008ndash2020 DWNP Kuala Lumpur Malaysia 2008
21 Hansen MC Stehman SV Potapov PV Loveland TR Townshend JR DeFries RS Pittman KWArunarwati B Stolle F Steininger MK et al Humid tropical forest clearing from 2000 to 2005 quantifiedby using multitemporal and multiresolution remotely sensed data Proc Natl Acad Sci USA 2008 1059439ndash9444 [CrossRef] [PubMed]
22 Hansen MC Stehman SV Potapov PV Quantification of global gross forest cover loss Proc Natl AcadSci USA 2010 107 8650ndash8655 [CrossRef] [PubMed]
23 Miettinen J Shi C Liew SC Deforestation rates in insular Southeast Asia between 2000 and 2010Glob Chang Biol 2011 17 2261ndash2270 [CrossRef]
24 Hansen MC Potapov PV Moore R Hancher M Turubanova SA Tyukavina A Thau DStehman SV Goetz SJ Loveland TR et al High-resolution global maps of 21st-century forest coverchange Science 2013 342 850ndash853 [CrossRef] [PubMed]
25 Kim D Sexton JO Townshend JR Accelerated deforestation in the humid tropics from the 1990s to the2000s Geophys Res Lett 2015 42 3495ndash3501 [CrossRef] [PubMed]
26 Cohen WB Goward SN Landsatrsquos role in ecological applications of remote sensing Bioscience 2004 54535ndash545 [CrossRef]
27 Margono BA Potapov PV Turubanova S Stolle F Hansen MC Primary forest cover loss in Indonesiaover 2000ndash2012 Nat Clim Chang 2014 4 730ndash735 [CrossRef]
28 Srinivas A Koh LP Oil palm expansion drives avifaunal decline in the Pucallpa region of PeruvianAmazonia Glob Ecol Conserv 2016 7 183ndash200 [CrossRef]
29 Peh KSH Sodhi NS De Jong J Sekercioglu CH Yap CAM Lim SLH Conservation value ofdegraded habitats for forest birds in southern Peninsular Malaysia Divers Distrib 2006 12 572ndash581[CrossRef]
30 Maddox T The Conservation of Tigers and Other Wildlife in Oil Palm Plantations Jambi Province SumatraIndonesia Zoological Society of London (ZSL) London UK 2007
31 Wicke S Sikkema R Dornburg V Faaij A Exploring land use changes and the role of palm oil productionin Indonesia and Malaysia Land Use Policy 2011 28 193ndash206 [CrossRef]
32 McMorrow J Talip MA Decline of forest area in Sabah Malaysia Relationship to state policies land codeand land capability Glob Environ Chang 2001 11 217ndash230 [CrossRef]
33 Gunarso P Hartoyo M Agus F Killeen T Oil Palm and Land Use Change in Indonesia Malaysia andPapua New Guinea Reports from the Technical Panels of the 2nd Greenhouse Gas Working Group of theRoundtable on Sustainable Palm Oil (RSPO) RSPO Kuala Lumpur Malaysia 2013 pp 29ndash64 Availableonline httpwwwrspoorgkey-documentssupplementary-materials (accessed on 20 June 2016)
34 Food and Agriculture Organization of the United Nations (FAO) Countries Geography Malaysia 2012Available online httpwwwfaoorgforestrycountry18310enmys (accessed on 22 June 2017)
35 Forestry Department of Peninsular Malaysia (FDPM) Forest Types 2016 Available online httpswwwforestrygovmyindexphpen2016-06-07-02-31-392016-06-07-02-35-17forest-type (accessed on22 June 2017)
36 Sanderson E Forrest J Loucks C Ginsberg J Dinerstein E Seidensticker J Leimgruber P Songer MHeydlauff A OrsquoBrien T et al Setting Priorities for the Conservation and Recovery of Wild Tigers 2005ndash2015 TheTechnical Assessment World Wildlife Fund Washington DC USA Wildlife Conservation Society New YorkNY USA Smithsonian and National Fish and Wildlife Foundation Washington DC USA 2006
37 UNEP-WCMC and IUCN Protected Planet The World Database on Protected Areas (WDPA) UNEP-WCMCCambridge UK 2016 Available online wwwprotectedplanetnet (accessed on 10 February 2016)
Remote Sens 2017 9 747 14 of 14
38 Petersen R Aksenov D Goldman E Sargent S Harris N Manisha A Esipova E Shevade VLoboda T Mapping Tree Plantations with Multispectral Imagery Preliminary Results for Seven Tropical CountriesTechnical Note World Resources Institute Washington DC USA 2016 Available online httpwwwwriorgpublicationmapping-tree-plantations (accessed on 23 September 2016)
39 Potapov PV Turubanova SA Hansen MC Adusei B Broich M Altstatt A Mane L Justice COQuantifying forest cover loss in Democratic Republic of the Congo 2000ndash2010 with Landsat ETM+ dataRemote Sens Environ 2012 122 106ndash116 [CrossRef]
40 Potapov PV Turubanova SA Tyukavina A Krylov AM McCarty JL Radeloff VC Hansen MCEastern Europersquos forest cover dynamics from 1985 to 2012 quantified from the full Landsat archiveRemote Sens Environ 2015 159 28ndash43 [CrossRef]
41 Tucker CJ Red and photographic infrared linear combinations for monitoring vegetation Remote SensEnviron 1979 8 127ndash150 [CrossRef]
42 Xiao X Zhang Q Braswell B Urbanski S Boles S Wofsy SC Moore B Ojima D Modeling grossprimary production of a deciduous broadleaf forest using satellite images and climate data Remote SensEnviron 2004 91 256ndash270 [CrossRef]
43 Breiman L Bagging predictors Mach Learn 1996 24 123ndash140 [CrossRef]44 Giree N Stehman SV Potapov P Hansen MC A sample-based forest monitoring strategy using Landsat
AVHRR and MODIS data to estimate gross forest cover loss in Malaysia between 1990 and 2005 Remote Sens2013 5 1842ndash1855 [CrossRef]
45 Olofsson P Foody GM Herold M Stehman SV Woodcock CE Wulder MA Good practices forestimating area and assessing accuracy of land change Remote Sens Environ 2014 148 42ndash57 [CrossRef]
46 Olofsson P Foody GM Stehman SV Woodcock CE Making better use of accuracy data in land changestudies Estimating accuracy and area and quantifying uncertainty using stratified estimation Remote SensEnviron 2013 129 122ndash131 [CrossRef]
47 Intergovernmental Panel on Climate Change (IPCC) 2006 IPCC Guidelines for National Greenhouse GasInventories Prepared by the National Greenhouse Gas Inventories Programme Eggleston HS Buendia LMiwa K Ngara T Tanabe K Eds Institute for Global Environmental Strategies Hayama Japan 2006
48 Tyukavina A Stehman SV Potapov PV Turubanova SA Baccini A Goetz SJ Laporte NTHoughton RA Hansen MC National-scale estimation of gross forest aboveground carbon loss Acase study of the Democratic Republic of the Congo Environ Res Lett 2013 8 044039 [CrossRef]
49 Potapov PV Dempewolf J Talero Y Hansen MC Stehman SV Vargas C Rojas EJ Castillo DMendoza E Calderoacuten A et al National satellite-based humid tropical forest change assessment in Peru insupport of REDD+ implementation Environ Res Lett 2014 9 124012 [CrossRef]
50 Sheil D Casson A Meijaard E van Nordwijk M Gaskell J Sunderland-Groves J Wertz KKanninen M The Impacts and Opportunities of Oil Palm in Southeast Asia What Do We Know and WhatDo We Need to Know Occasional Paper No 51 Center for International Forestry Research (CIFOR) BogorIndonesia 2009
51 Gaveau DL Sheil D Husnayaen MAS Arjasakusuma S Ancrenaz M Pacheco P Meijaard ERapid conversions and avoided deforestation Examining four decades of industrial plantation expansion inBorneo Sci Rep 2016 6 32017 [CrossRef] [PubMed]
52 Koh LP Miettinen J Liew SC Ghazoul J Remotely sensed evidence of tropical peatland conversion tooil palm Proc Natl Acad Sci USA 2011 108 5127ndash5132 [CrossRef] [PubMed]
53 Rayan DM Linkie M Conserving tigers in Malaysia A science-driven approach for eliciting conservationpolicy change Biol Conserv 2015 184 18ndash26 [CrossRef]
54 Rayan DM Mohamad SW The importance of selectively logged forests for tiger Panthera tigrisconservation A population density estimate in Peninsular Malaysia Oryx 2009 43 48ndash51 [CrossRef]
copy 2017 by the authors Licensee MDPI Basel Switzerland This article is an open accessarticle distributed under the terms and conditions of the Creative Commons Attribution(CC BY) license (httpcreativecommonsorglicensesby40)
- Introduction
- Materials and Methods
-
- Study Area
- Overview
- Data
- Natural Forest Mapping
- Forest Loss Mapping
- Sample-Based Adjustment of the Area Estimation
-
- Results
-
- Natural Forest Extent and Change from 1988ndash2012
- Tiger Habitat Loss and Change from 1988ndash2012
- Accuracy Assessment of 1988ndash2000 and 2001ndash2012 Forest Loss
-
- Discussion
- Conclusions
-
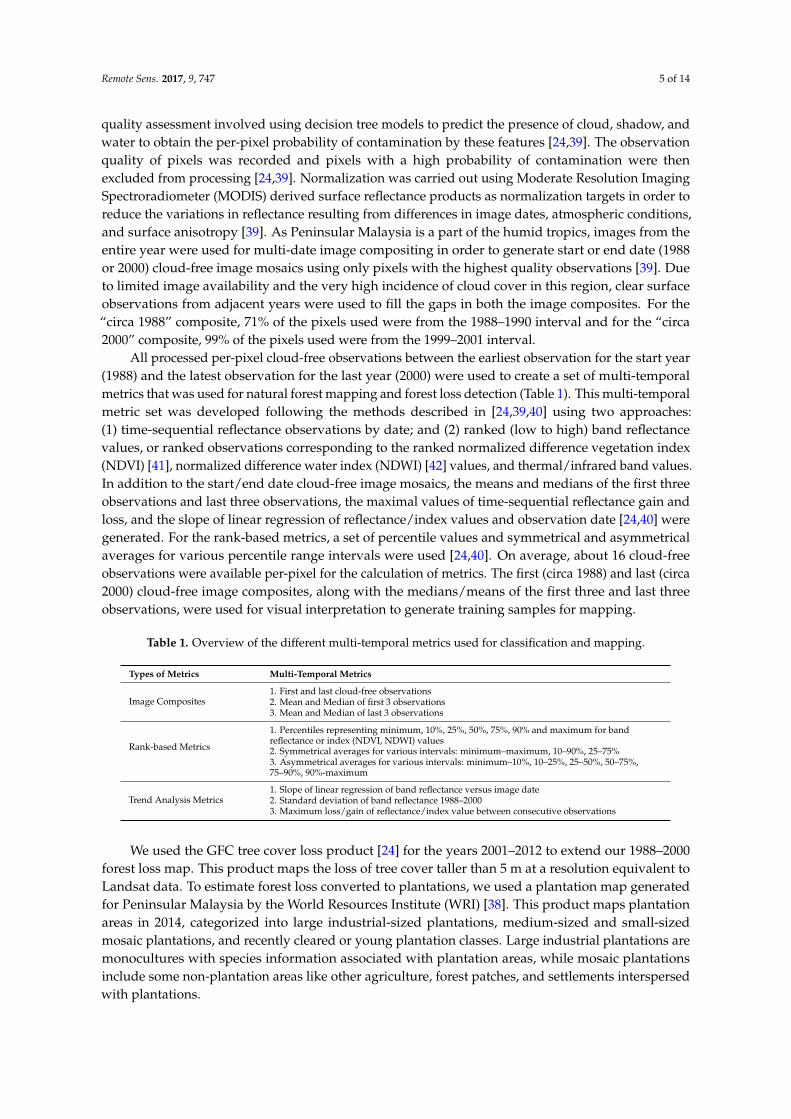
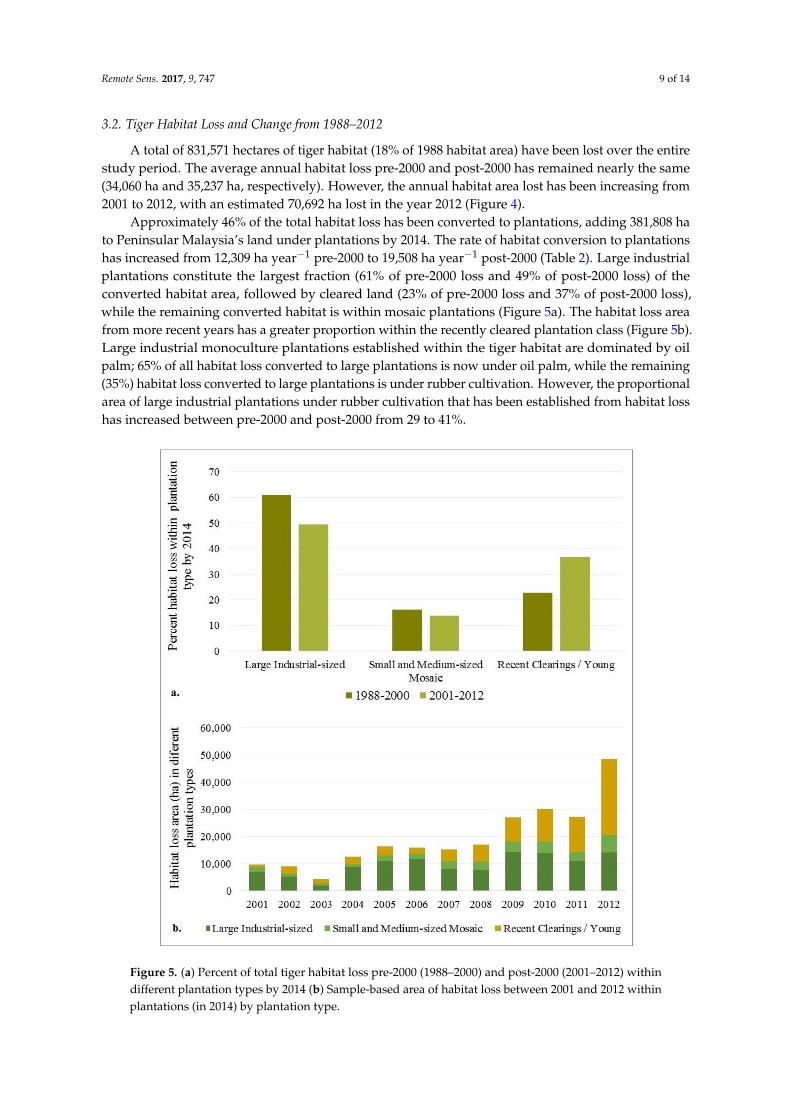
Remote Sens 2017 9 747 9 of 14
32 Tiger Habitat Loss and Change from 1988ndash2012
A total of 831571 hectares of tiger habitat (18 of 1988 habitat area) have been lost over the entirestudy period The average annual habitat loss pre-2000 and post-2000 has remained nearly the same(34060 ha and 35237 ha respectively) However the annual habitat area lost has been increasing from2001 to 2012 with an estimated 70692 ha lost in the year 2012 (Figure 4)
Approximately 46 of the total habitat loss has been converted to plantations adding 381808 hato Peninsular Malaysiarsquos land under plantations by 2014 The rate of habitat conversion to plantationshas increased from 12309 ha yearminus1 pre-2000 to 19508 ha yearminus1 post-2000 (Table 2) Large industrialplantations constitute the largest fraction (61 of pre-2000 loss and 49 of post-2000 loss) of theconverted habitat area followed by cleared land (23 of pre-2000 loss and 37 of post-2000 loss)while the remaining converted habitat is within mosaic plantations (Figure 5a) The habitat loss areafrom more recent years has a greater proportion within the recently cleared plantation class (Figure 5b)Large industrial monoculture plantations established within the tiger habitat are dominated by oilpalm 65 of all habitat loss converted to large plantations is now under oil palm while the remaining(35) habitat loss converted to large plantations is under rubber cultivation However the proportionalarea of large industrial plantations under rubber cultivation that has been established from habitat losshas increased between pre-2000 and post-2000 from 29 to 41
Remote Sens 2017 9 747 9 of 14
32 Tiger Habitat Loss and Change from 1988ndash2012
A total of 831571 hectares of tiger habitat (18 of 1988 habitat area) have been lost over the entire study period The average annual habitat loss pre-2000 and post-2000 has remained nearly the same (34060 ha and 35237 ha respectively) However the annual habitat area lost has been increasing from 2001 to 2012 with an estimated 70692 ha lost in the year 2012 (Figure 4)
Approximately 46 of the total habitat loss has been converted to plantations adding 381808 ha to Peninsular Malaysiarsquos land under plantations by 2014 The rate of habitat conversion to plantations has increased from 12309 ha yearminus1 pre-2000 to 19508 ha yearminus1 post-2000 (Table 2) Large industrial plantations constitute the largest fraction (61 of pre-2000 loss and 49 of post-2000 loss) of the converted habitat area followed by cleared land (23 of pre-2000 loss and 37 of post-2000 loss) while the remaining converted habitat is within mosaic plantations (Figure 5a) The habitat loss area from more recent years has a greater proportion within the recently cleared plantation class (Figure 5b) Large industrial monoculture plantations established within the tiger habitat are dominated by oil palm 65 of all habitat loss converted to large plantations is now under oil palm while the remaining (35) habitat loss converted to large plantations is under rubber cultivation However the proportional area of large industrial plantations under rubber cultivation that has been established from habitat loss has increased between pre-2000 and post-2000 from 29 to 41
Figure 5 (a) Percent of total tiger habitat loss pre-2000 (1988ndash2000) and post-2000 (2001ndash2012) within different plantation types by 2014 (b) Sample-based area of habitat loss between 2001 and 2012 within plantations (in 2014) by plantation type
Figure 5 (a) Percent of total tiger habitat loss pre-2000 (1988ndash2000) and post-2000 (2001ndash2012) withindifferent plantation types by 2014 (b) Sample-based area of habitat loss between 2001 and 2012 withinplantations (in 2014) by plantation type
Remote Sens 2017 9 747 10 of 14
33 Accuracy Assessment of 1988ndash2000 and 2001ndash2012 Forest Loss
We performed separate accuracy assessments for natural forest loss and tiger habitat loss forthe 1988ndash2000 interval mapped in this research and 2001ndash2012 loss obtained from the GFC product(Table 3) The overall accuracy for both products exceeds 95 however specific userrsquos and producerrsquosaccuracies for each class vary The lowest producerrsquos accuracies are reported for forest loss classeswithin the TCL (below 60) Userrsquos accuracies are consistently higher with the lowest value (75)reported for the forest loss class in the pre-2000 mapping period
Table 3 Error Matrices for pre-2000 (1988ndash2000) and post-2000 (2001ndash2012) natural forest and habitatlossno loss maps with cell entries depicting the estimated area proportions N is the number of totalsample points used for the assessment
Reference
Loss No Loss Total Userrsquos Producerrsquos Overall
Pre-2000 Forest N = 475
Map
Loss 006 002 008 075 075 096No Loss 002 09 092 098 098
Total 008 092 1
Post-2000 Forest N = 489
Map
Loss 007 001 008 088 063 095No Loss 004 088 092 096 099
Total 012 088 1
Pre-2000 Habitat N = 314
Map
Loss 005 001 006 090 055 095No Loss 004 090 094 096 099
Total 009 091 100
Post-2000 Habitat N = 358
Map
Loss 006 0005 006 092 057 095No Loss 004 090 094 096 099
Total 0096 0904 100
4 Discussion
Sample-based area estimates provide a better estimation of loss area than simple map-basedestimates [46] and have been used to correct for the underestimation of forest loss [4849]Error-adjustment increased the estimated areas of natural forest loss and tiger habitat loss for bothpre-2000 and post-2000 periods Userrsquos and producerrsquos accuracies are not distributed uniformlyalthough the omission error is consistently high for both periods for natural forest and tiger habitat loss
Based on our total estimated gross natural forest loss of 135 Mha it is evident that deforestationcontinues to be a problem for Peninsular Malaysiarsquos forest Our estimated forest loss area from2000ndash2010 of 049 Mha is higher compared to the 044 Mha value reported by [23] This difference canbe attributed to the improved spatial resolution of data used (250 m vs 30 m in this study) and theimplementation of the sample-based unbiased area estimation method We observe an accelerationin forest loss from pre-2000 to post-2000 similar to previous reports across the humid tropics and inAsia [25] Our study adds to a recent study of global tiger habitat [17] and provides a more extensiveassessment of habitat loss within Peninsular Malaysia and the contribution of expanding plantationsHowever we have only mapped forest loss within habitat and have not assessed the quality of theremaining habitat which can be further affected by the fragmentation or creation of greater edge andincreased access Furthermore the estimated conversion of natural forests and habitat to plantations in
Remote Sens 2017 9 747 11 of 14
our study is limited by the plantation dataset used Any undetected or cryptic plantations will resultin an underestimation of the forest area converted to plantations over the study period While anyforest conversion to cryptic plantations is a concern for tiger habitat loss the forest area convertedto these plantations is of relatively low importance when compared with forest conversions to largeindustrial plantations like those of oil palm and rubber
With 48 of all the natural forest lost during 1988ndash2012 converted to plantations by 2014plantation expansion can be considered a major contributor to forest loss in Peninsular MalaysiaLarge industrial plantations constitute more than half of the forest converted to plantations in bothstudy periods Contrary to claims by the Malaysian palm oil industry [5051] our results show thatoil palm plantations have continued to expand at the expense of natural forest areas Our analysisshows that approximately 242000 ha of mapped forest loss between 1988 and 2012 were convertedto industrial oil palm plantations by 2014 Additionally we observe an increased conversion of bothforest and habitat loss to plantations post-2000 primarily due to the observed increase of annual lossafter 2006 especially within tiger habitat The proportion of total loss converted to plantations hasincreased from 40 to 54 between the two periods while the proportion of habitat loss converted toplantations has increased from 35 to 57
Although the conversion of forest and habitat to oil palm plantations has dominated throughoutthe study period the proportion of conversions to large-scale rubber plantations has increasedsignificantly post-2000 Mapped habitat loss converted to rubber plantations has increased by 96between pre-2000 and post-2000 while conversions to oil palm plantations have only increasedby about 14 suggesting that rubber cultivation could be a developing threat for the forests andtiger habitat Other reports also indicate substantial increases in the forest reserve area convertedto rubber plantations between 2005 and 2012 [3] Latex-timber clones rubber trees that can be usedfor both rubber and timber are being propagated across the landscape as a means to expand timberplantations [15] Policies that allow for selectively logged forests under state jurisdiction to be convertedto rubber tree plantations [15] and aggressive plantation schemes by the government [3] continue toendanger Malaysiarsquos forests and tiger habitat
The observed increase in habitat loss under the cleared plantation class could probably beexplained by delays in plantation establishment after forest clearing and that recently establishedplantations could look very similar to land cleared for other land-uses [52] It is important to note thatour analysis focuses on forest loss area that is under plantation in the year 2014 and other intermediaryland uses could exist before plantation establishment Forest conversion has been shown to followinitial logging disturbance in Indonesia [27] In Peninsular Malaysia oil palm plantations are usuallyestablished on degraded previously logged forest or other existing plantations [3133] Moreoverabout 85 of the Malaysian tiger population inhabits forest reserves that have been predominantlyassigned for selective logging [53] It is essential that the role of logging in deforestation and habitatloss in the region be further investigated
5 Conclusions
The Malayan tiger continues to be threatened by habitat loss and fragmentation despite Malaysiarsquosrelatively large area under forest cover [54] Our study maps the natural forest for Peninsular Malaysiafor circa 1988 and the forest loss between 1988 and 2000 and aggregates our forest loss with the GFCglobal forest loss product to produce a consistent forest loss dataset from 1988 to 2012 for the regionWe find that natural forest loss continues within Peninsular Malaysia specifically within its tigerhabitat The conversion of forests to plantations within the region is responsible for about half of allthe deforestation Furthermore we find that the contribution of plantations to the total area of naturalforest loss has increased from pre-2000 to post-2000 Large industrial plantations and recently clearedland are the major contributors of land-use conversion While large industrial plantations continue tobe dominated by oil palm conversion to rubber plantations has been on the rise In this work we havequantified the total loss of habitat but have not assessed more subtle changes in habitat quality that
Remote Sens 2017 9 747 12 of 14
result from natural forest conversion Our map product enables studying the spatial distribution andpatterns of natural forest loss within Peninsular Malaysia and its tiger habitat
Supplementary Materials The following are available online at wwwmdpicom2072-429297747s1Table S1 Image numbers per year and per Landsat sensor used for mapping Table S2 Landsat images usedfor validation
Author Contributions VS PP and TL conceived and designed the experiments VS performed theexperiments VS PP and TL analyzed the data PP and NH contributed reagentsmaterialsanalysis toolsVS PP NH and TL wrote the paper
Conflicts of Interest The authors declare no conflict of interest
References
1 Convention on Biodiversity Diversity (CBD) Malaysia Country Profile Available online httpswwwcbdintcountriesprofiledefaultshtmlcountry=myfacts (accessed on 10 December 2015)
2 Myers N Mittermeier RA Mittermeier CG Da Fonseca GA Kent J Biodiversity hotspots forconservation priorities Nature 2000 403 853ndash858 [CrossRef] [PubMed]
3 Kawanishi K Panthera tigris ssp jacksoni The IUCN Red List of Threatened Species 2015ET136893A50665029 2015 Available online httpdxdoiorg102305IUCNUK2015-2RLTST136893A50665029en (accessed on 10 October 2016)
4 Seidensticker J Saving wild tigers A case study in biodiversity loss and challenges to be met for recoverybeyond 2010 Integr Zool 2010 5 285ndash299 [CrossRef] [PubMed]
5 Gibbs HK Ruesch AS Achard F Clayton MK Holmgren P Ramankutty N Foley JA Tropicalforests were the primary sources of new agricultural land in the 1980s and 1990s Proc Natl Acad Sci USA2010 107 16732ndash16737 [CrossRef] [PubMed]
6 Sodhi SN Posa RCM Lee MT Bickford D Koh PL Brook WB The state and conservation ofSoutheast Asian biodiversity Biodivers Conserv 2010 19 317ndash328 [CrossRef]
7 Kummer DM Turner BL The human causes of deforestation in Southeast Asia Bioscience 1994 44323ndash328 [CrossRef]
8 Abdullah SA Nakagoshi N Forest fragmentation and its correlation to human land use change in thestate of Selangor peninsular Malaysia For Ecol Manag 2007 241 39ndash48 [CrossRef]
9 Abdullah SA Hezri AA From forest landscape to agricultural landscape in the developing tropicalcountry of Malaysia Pattern process and their significance on policy Environ Manag 2008 42 907ndash917[CrossRef] [PubMed]
10 Koh LP Wilcove DS Is oil palm agriculture really destroying tropical biodiversity Conserv Lett 2008 160ndash64 [CrossRef]
11 Food and Agriculture Organization of the United Nations (FAO) Case Study of Tropical Forest Plantations inMalaysia by DBA Krishnapillay Forest Plantations Working Paper 23 FAO Rome Italy 2002 unpublishedAvailable online httpwwwfaoorgdocumentscardenc8ac53512-c384-5b5a-baf4-f6d137e3a421(accessed on 11 July 2017)
12 Byerlee D The Fall and Rise Again of Plantations in Tropical Asia History Repeated Land 2014 3 574ndash597[CrossRef]
13 Fitzherbert EB Struebig MJ Morel A Danielsen F Bruumlhl CA Donald PF Phalan B How will oilpalm expansion affect biodiversity Trends Ecol Evol 2008 23 538ndash545 [CrossRef] [PubMed]
14 Brookfield H Byron Y Deforestation and timber extraction in Borneo and the Malay Peninsula The recordsince 1965 Glob Environ Chang 1990 1 42ndash56 [CrossRef]
15 Clements R Rayan DM Zafir AWA Venkataraman A Alfred R Payne J Ambu L Sharma DSKTrio under threat Can we secure the future of rhinos elephants and tigers in Malaysia Biodivers Conserv2010 19 1115ndash1136 [CrossRef]
16 Kawanishi K Yatim SH Abu Hashim AK Topani R Distribution and potential population size of thetiger in Peninsular Malaysia J Wildl Park 2003 21 29ndash50
17 Joshi AR Dinerstein E Wikramanayake E Anderson ML Olson D Jones BS Seidensticker JLumpkin S Hansen MC Sizer NC et al Tracking changes and preventing loss in critical tiger habitatSci Adv 2016 2 e1501675 [CrossRef] [PubMed]
Remote Sens 2017 9 747 13 of 14
18 World Bank (Washington DC USA) Global Tiger Recovery Program (2010ndash2022) Available online httpdocumentsworldbankorgcurateden874191468331048098Global-tiger-recovery-program-2010-2022(accessed on 27 June 2017)
19 Global Tiger Recovery Program (GTRP) Global Tiger Recovery Program Volume 2 Draft 31 July 2010Washington DC USA 2010 Available online httpadminindiaenvironmentportalorginfilesGTRP-Volume-2-July-31pdf (accessed on 27 June 2017)
20 Department of Wildlife and National Parks Peninsular Malaysia (DWNP) National Tiger Action Plan forMalaysia 2008ndash2020 DWNP Kuala Lumpur Malaysia 2008
21 Hansen MC Stehman SV Potapov PV Loveland TR Townshend JR DeFries RS Pittman KWArunarwati B Stolle F Steininger MK et al Humid tropical forest clearing from 2000 to 2005 quantifiedby using multitemporal and multiresolution remotely sensed data Proc Natl Acad Sci USA 2008 1059439ndash9444 [CrossRef] [PubMed]
22 Hansen MC Stehman SV Potapov PV Quantification of global gross forest cover loss Proc Natl AcadSci USA 2010 107 8650ndash8655 [CrossRef] [PubMed]
23 Miettinen J Shi C Liew SC Deforestation rates in insular Southeast Asia between 2000 and 2010Glob Chang Biol 2011 17 2261ndash2270 [CrossRef]
24 Hansen MC Potapov PV Moore R Hancher M Turubanova SA Tyukavina A Thau DStehman SV Goetz SJ Loveland TR et al High-resolution global maps of 21st-century forest coverchange Science 2013 342 850ndash853 [CrossRef] [PubMed]
25 Kim D Sexton JO Townshend JR Accelerated deforestation in the humid tropics from the 1990s to the2000s Geophys Res Lett 2015 42 3495ndash3501 [CrossRef] [PubMed]
26 Cohen WB Goward SN Landsatrsquos role in ecological applications of remote sensing Bioscience 2004 54535ndash545 [CrossRef]
27 Margono BA Potapov PV Turubanova S Stolle F Hansen MC Primary forest cover loss in Indonesiaover 2000ndash2012 Nat Clim Chang 2014 4 730ndash735 [CrossRef]
28 Srinivas A Koh LP Oil palm expansion drives avifaunal decline in the Pucallpa region of PeruvianAmazonia Glob Ecol Conserv 2016 7 183ndash200 [CrossRef]
29 Peh KSH Sodhi NS De Jong J Sekercioglu CH Yap CAM Lim SLH Conservation value ofdegraded habitats for forest birds in southern Peninsular Malaysia Divers Distrib 2006 12 572ndash581[CrossRef]
30 Maddox T The Conservation of Tigers and Other Wildlife in Oil Palm Plantations Jambi Province SumatraIndonesia Zoological Society of London (ZSL) London UK 2007
31 Wicke S Sikkema R Dornburg V Faaij A Exploring land use changes and the role of palm oil productionin Indonesia and Malaysia Land Use Policy 2011 28 193ndash206 [CrossRef]
32 McMorrow J Talip MA Decline of forest area in Sabah Malaysia Relationship to state policies land codeand land capability Glob Environ Chang 2001 11 217ndash230 [CrossRef]
33 Gunarso P Hartoyo M Agus F Killeen T Oil Palm and Land Use Change in Indonesia Malaysia andPapua New Guinea Reports from the Technical Panels of the 2nd Greenhouse Gas Working Group of theRoundtable on Sustainable Palm Oil (RSPO) RSPO Kuala Lumpur Malaysia 2013 pp 29ndash64 Availableonline httpwwwrspoorgkey-documentssupplementary-materials (accessed on 20 June 2016)
34 Food and Agriculture Organization of the United Nations (FAO) Countries Geography Malaysia 2012Available online httpwwwfaoorgforestrycountry18310enmys (accessed on 22 June 2017)
35 Forestry Department of Peninsular Malaysia (FDPM) Forest Types 2016 Available online httpswwwforestrygovmyindexphpen2016-06-07-02-31-392016-06-07-02-35-17forest-type (accessed on22 June 2017)
36 Sanderson E Forrest J Loucks C Ginsberg J Dinerstein E Seidensticker J Leimgruber P Songer MHeydlauff A OrsquoBrien T et al Setting Priorities for the Conservation and Recovery of Wild Tigers 2005ndash2015 TheTechnical Assessment World Wildlife Fund Washington DC USA Wildlife Conservation Society New YorkNY USA Smithsonian and National Fish and Wildlife Foundation Washington DC USA 2006
37 UNEP-WCMC and IUCN Protected Planet The World Database on Protected Areas (WDPA) UNEP-WCMCCambridge UK 2016 Available online wwwprotectedplanetnet (accessed on 10 February 2016)
Remote Sens 2017 9 747 14 of 14
38 Petersen R Aksenov D Goldman E Sargent S Harris N Manisha A Esipova E Shevade VLoboda T Mapping Tree Plantations with Multispectral Imagery Preliminary Results for Seven Tropical CountriesTechnical Note World Resources Institute Washington DC USA 2016 Available online httpwwwwriorgpublicationmapping-tree-plantations (accessed on 23 September 2016)
39 Potapov PV Turubanova SA Hansen MC Adusei B Broich M Altstatt A Mane L Justice COQuantifying forest cover loss in Democratic Republic of the Congo 2000ndash2010 with Landsat ETM+ dataRemote Sens Environ 2012 122 106ndash116 [CrossRef]
40 Potapov PV Turubanova SA Tyukavina A Krylov AM McCarty JL Radeloff VC Hansen MCEastern Europersquos forest cover dynamics from 1985 to 2012 quantified from the full Landsat archiveRemote Sens Environ 2015 159 28ndash43 [CrossRef]
41 Tucker CJ Red and photographic infrared linear combinations for monitoring vegetation Remote SensEnviron 1979 8 127ndash150 [CrossRef]
42 Xiao X Zhang Q Braswell B Urbanski S Boles S Wofsy SC Moore B Ojima D Modeling grossprimary production of a deciduous broadleaf forest using satellite images and climate data Remote SensEnviron 2004 91 256ndash270 [CrossRef]
43 Breiman L Bagging predictors Mach Learn 1996 24 123ndash140 [CrossRef]44 Giree N Stehman SV Potapov P Hansen MC A sample-based forest monitoring strategy using Landsat
AVHRR and MODIS data to estimate gross forest cover loss in Malaysia between 1990 and 2005 Remote Sens2013 5 1842ndash1855 [CrossRef]
45 Olofsson P Foody GM Herold M Stehman SV Woodcock CE Wulder MA Good practices forestimating area and assessing accuracy of land change Remote Sens Environ 2014 148 42ndash57 [CrossRef]
46 Olofsson P Foody GM Stehman SV Woodcock CE Making better use of accuracy data in land changestudies Estimating accuracy and area and quantifying uncertainty using stratified estimation Remote SensEnviron 2013 129 122ndash131 [CrossRef]
47 Intergovernmental Panel on Climate Change (IPCC) 2006 IPCC Guidelines for National Greenhouse GasInventories Prepared by the National Greenhouse Gas Inventories Programme Eggleston HS Buendia LMiwa K Ngara T Tanabe K Eds Institute for Global Environmental Strategies Hayama Japan 2006
48 Tyukavina A Stehman SV Potapov PV Turubanova SA Baccini A Goetz SJ Laporte NTHoughton RA Hansen MC National-scale estimation of gross forest aboveground carbon loss Acase study of the Democratic Republic of the Congo Environ Res Lett 2013 8 044039 [CrossRef]
49 Potapov PV Dempewolf J Talero Y Hansen MC Stehman SV Vargas C Rojas EJ Castillo DMendoza E Calderoacuten A et al National satellite-based humid tropical forest change assessment in Peru insupport of REDD+ implementation Environ Res Lett 2014 9 124012 [CrossRef]
50 Sheil D Casson A Meijaard E van Nordwijk M Gaskell J Sunderland-Groves J Wertz KKanninen M The Impacts and Opportunities of Oil Palm in Southeast Asia What Do We Know and WhatDo We Need to Know Occasional Paper No 51 Center for International Forestry Research (CIFOR) BogorIndonesia 2009
51 Gaveau DL Sheil D Husnayaen MAS Arjasakusuma S Ancrenaz M Pacheco P Meijaard ERapid conversions and avoided deforestation Examining four decades of industrial plantation expansion inBorneo Sci Rep 2016 6 32017 [CrossRef] [PubMed]
52 Koh LP Miettinen J Liew SC Ghazoul J Remotely sensed evidence of tropical peatland conversion tooil palm Proc Natl Acad Sci USA 2011 108 5127ndash5132 [CrossRef] [PubMed]
53 Rayan DM Linkie M Conserving tigers in Malaysia A science-driven approach for eliciting conservationpolicy change Biol Conserv 2015 184 18ndash26 [CrossRef]
54 Rayan DM Mohamad SW The importance of selectively logged forests for tiger Panthera tigrisconservation A population density estimate in Peninsular Malaysia Oryx 2009 43 48ndash51 [CrossRef]
copy 2017 by the authors Licensee MDPI Basel Switzerland This article is an open accessarticle distributed under the terms and conditions of the Creative Commons Attribution(CC BY) license (httpcreativecommonsorglicensesby40)
- Introduction
- Materials and Methods
-
- Study Area
- Overview
- Data
- Natural Forest Mapping
- Forest Loss Mapping
- Sample-Based Adjustment of the Area Estimation
-
- Results
-
- Natural Forest Extent and Change from 1988ndash2012
- Tiger Habitat Loss and Change from 1988ndash2012
- Accuracy Assessment of 1988ndash2000 and 2001ndash2012 Forest Loss
-
- Discussion
- Conclusions
-
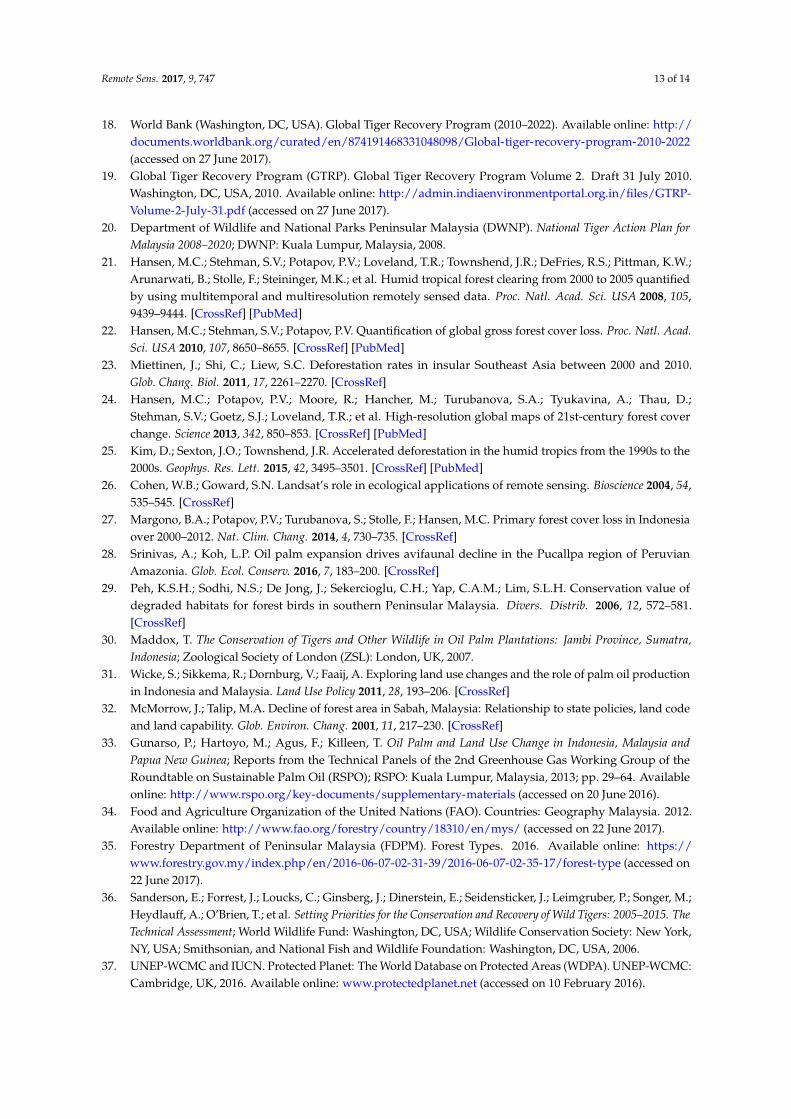