expanding the customer base for dcs in the oil, gas & chemicals … · 3 expanding the customer...
TRANSCRIPT

Supervisor: Evangelos Bourelos Graduate School
Jón Ingi Skarphéðinsson & Vivian Mohan
Master Degree Project in Innovation and Industrial Management
Expanding the customer base for DCS in the Oil, Gas & Chemicals
market in Sweden
A Case Study of ABB

2
3
Expanding the customer base for DCS in the Oil, Gas & Chemicals market in
Sweden
-A Case study at ABB
By
Jón Ingi Skarphéðinsson and Vivian Mohan
School of Business, Economics and Law, University of Gothenburg, Vasagatan, 1
P.O. Box 600, SE 40530, Gothenburg, Sweden
And
ABB AB, Business Centre,
Mölndal, Lunnagårdsgatan 4, 431 90, Gothenburg
All rights reserved.
No part of this thesis may be reproduced without written permission by the author or ABB
Business Centre
Contacts:

4
Abstract
From research, firms that want to expand its customer base and acquire new customers need to
have an acquisition strategy with a team that supports this process. Any businesses motive is to
generate profit by creating customers. The main purpose of this research is to examine the
market for ABB and how it can acquire new customers. Results from theory supported by semi-
structured interviews show that ABB Sweden is currently missing out on acquiring new
customers in the OGC market. With an innovative product that has greater value compared to its
competitors, ABB can become a preferred supplier in the Swedish market. For this to happen, the
BU (business unit) needs to tweak its business model, implement further the new CRM software
and use it more effectively and most importantly, acquire additional human resource. The
acquisition funnel has six stages that comprises of prospecting, approach, presenting offer,
overcome objections, close deal and follow up. ABB uses this process currently but not
efficiently as there is one industry manager for the BU that cannot handle the herculean task
alone. The final recommendations to ABB Sweden’s Industrial Automation divisions, Control
Technologies Business Unit is to add additional human resource that can help with acquisition
strategy and the industry manager by making the aftermarket sales more effective and efficient.

5
Acknowledgments
It is vital to point out the source of our ambition as without them, we might have not embarked
on this journey to pursue academic excellence.
I, Jón Ingi Skarphéðinsson, would like to thank my thesis partner Vivian Mohan for many long
and often frustrating hours but in the end a successful partnership, this would have been
impossible without you. My family, especially my parents, who have been pillars of support
throughout my whole life. You have always put my interests above yours, you are my role
models and I am proud to be your son as I would not be half the man I am today without you
two. Finally, I would like to thank my girlfriend Dagný, who supports me an all my endeavours,
one cannot find a better friend and a better mother, me and our kids are lucky to have you.
I, Vivian Mohan would like to convey my deepest thanks to my parents, especially my mother
who after my father’s passing supported me since high school and encouraged me to pursue
education to further my knowledge, my Swedish parents (Anders & Lisbeth) who supported me
and inspired me during my education in Sweden. Finally, but not the least, Jón Ingi, my thesis
partner who endured the long hours and our creative discussion sessions that usually veered from
topic and supported me in writing this thesis. I want to convey my thanks for the support,
inspiration and aspiration you have provided me and hope to personify greatness of knowing
things and hope to be as wise as you are.
We are very grateful for the support and supervision provided by Evangelos Bourelos at the
institute for Innovation and Entrepreneurship and assistant lecturer, Department of Economics
and society, School of Business, Economics and Law. He was helpful throughout the whole
process, providing us with feedbacks and suggestions so that the research could be improved.
We would also like to thank ABB and our supervisors Andreas K. Johansson & Magnus
Högstedt for choosing us and giving us the opportunity to write this master’s thesis for ABB
Sweden. Moreover, they assisted us to gain valuable internal information and helped us to
connect with actors involved in the industry and ABB’s workings. The knowledge acquired from
the both of them is invaluable and an asset that will help us in the future. We would also like to
thank all the ABB employees who allocated valuable time during our data collection and
interview process.
Jón Ingi Skarphéðinsson
Vivian Mohan
June 2017, Gothenburg
6
Table of Contents
1. Introduction .............................................................................................................. 10
1.1. Background of the Topic ................................................................................................. 10 1.2. ABB’s background and offering ..................................................................................... 10
1.2.1. Historical Background and Structure ....................................................................................................... 10 1.2.2. The Product – ABB Ability 800xA ............................................................................................................ 11
1.3. The Emergence of the Research Question and Purpose ................................................ 13 1.4. Delimitations .................................................................................................................... 14 1.5. Disposition of the Research ............................................................................................. 15
2. Literature Review ..................................................................................................... 16
2.1. Business Model ................................................................................................................ 17
2.2. Customer Retention.......................................................................................................... 19 2.2.1. The Conversion Model.............................................................................................................................. 22
2.3. Customer Acquisition ....................................................................................................... 24 2.3.1. Acquisition Funnel .................................................................................................................................... 26 2.3.2. Growth Matrix .......................................................................................................................................... 29 2.3.3. ACTMAN .................................................................................................................................................. 30
3. Methodology ............................................................................................................. 32
3.1. Research Design ............................................................................................................... 32 3.1.1. Research Structure and Process ............................................................................................................... 32 3.1.2. Epistemological and Ontological Position ............................................................................................... 32 3.1.3. Case Study ................................................................................................................................................ 33 3.1.4. Employing a Qualitative Research Strategy ............................................................................................. 33 3.1.5. Inductive approach ................................................................................................................................... 34
3.2. Data Collection ................................................................................................................. 35 3.2.1. Secondary Data ........................................................................................................................................ 35 3.2.2. Primary Data ............................................................................................................................................ 36
3.3. Research Quality .............................................................................................................. 38 3.3.1. Reliability ................................................................................................................................................. 38 3.3.2. Validity ..................................................................................................................................................... 39 3.3.3. Ethics ........................................................................................................................................................ 40 3.3.4. Methodological limitations ....................................................................................................................... 40
4. Market Analysis ....................................................................................................... 42
4.1. World of Oil, Gas and Chemicals .................................................................................... 42 4.1.1. World Oil Market, Turbulence and Global Outlook ................................................................................. 42 4.1.2. World Gas Market, Developments and Expectations ............................................................................... 45 4.1.3. World Chemical Market, Current State and Outlook ............................................................................... 48
4.2. The Swedish Market......................................................................................................... 49 4.2.1. Oil Market ................................................................................................................................................ 49 4.2.2. Gas Market ............................................................................................................................................... 54 4.2.3. Chemicals ................................................................................................................................................. 58 4.2.4. The Government’s aim and goals ............................................................................................................. 61 4.2.5. Segmentation and Value Chain ................................................................................................................ 64
4.3. Companies Operating in the Swedish Market ................................................................ 66 4.3.1. Preem........................................................................................................................................................ 66 4.3.2. Lundin Petroleum AB ............................................................................................................................... 68 4.3.3. Tethys Oil AB ............................................................................................................................................ 70 4.3.4. PA Resources ............................................................................................................................................ 71 4.3.5. ST1 Group ................................................................................................................................................ 72
7
4.3.6. Borealis .................................................................................................................................................... 73 4.3.7. AkzoNobel ................................................................................................................................................. 74 4.3.8. Perstorp AB .............................................................................................................................................. 76 4.3.9. Nynas AB .................................................................................................................................................. 77 4.3.10. INEOS Compounds .............................................................................................................................. 78 4.3.11. Kemira Kemi AB .................................................................................................................................. 79 4.3.12. Tikkurila Sverige AB ............................................................................................................................ 81
4.4. Outlook for automation ................................................................................................... 82
5. Empirical Findings ................................................................................................... 86
5.1. Semi-structured Interviews .............................................................................................. 86 5.1.1. The Case Company ................................................................................................................................... 86 5.1.2. Current set of products and services ........................................................................................................ 87 5.1.3. Current Customer Retention and Acquisition Activities ........................................................................... 89
5.2. Summary from Interviews ............................................................................................... 96
6. Analysis ..................................................................................................................... 97
6.1. Supplier Power ................................................................................................................. 98 6.2. ABB Business Model ..................................................................................................... 100 6.3. Customer Retention........................................................................................................ 103
6.3.1. The Conversion Model............................................................................................................................ 105 6.4. Customer Acquisition ..................................................................................................... 105
6.4.1. Ansoff’s Matrix ....................................................................................................................................... 106 6.4.2. ACTMAN ................................................................................................................................................ 107 6.4.3. Sales Funnel ........................................................................................................................................... 109
7. Conclusions and Recommendations ..................................................................... 112
7.1. Recommendations .......................................................................................................... 115 7.1.1. Sub-question 1: How can ABB retain their current customers within this segment? ............................. 115 7.1.2. Sub-question 2: How can ABB acquire new customers within this segment? ........................................ 116
7.2. Theoretical contribution ................................................................................................ 118 7.3. Limitations ...................................................................................................................... 119
7.4. Future Research ............................................................................................................. 119
8. References ............................................................................................................... 121
Appendix ......................................................................................................................... 135

8
Figures
Figure 1 – Disposition of the research ........................................................................................................................ 15
Figure 2 – Customer acquisition process .................................................................................................................... 26
Figure 3 - Acquisition funnel ....................................................................................................................................... 28
Figure 4 – Ansoffs Growth Matrix ............................................................................................................................... 29
Figure 5 – Daily brent crude oil prices ....................................................................................................................... 43
Figure 6 – Crude oil price forecast ............................................................................................................................. 45
Figure 7 - Natural Gas Prices ..................................................................................................................................... 47
Figure 8 – Sweden’s oil supply infrastructure ............................................................................................................. 51
Figure 9 – Crude oil import......................................................................................................................................... 52
Figure 10 – Import and export of refined petroleum products .................................................................................... 53
Figure 11 – Consumption and import of natural gas .................................................................................................. 55
Figure 12 – Origin of imported natural gas ................................................................................................................ 56
Figure 13 – Sweden’s gas supply infrastructure ......................................................................................................... 57
Figure 14 – Import and export of chemicals and chemical products .......................................................................... 59
Figure 15 – Number of chemical products used by sector .......................................................................................... 61
Figure 16 – Use of fossil fuel in different sectors ........................................................................................................ 62
Figure 17 – Crude oil value chain ............................................................................................................................... 65
Figure 18 – Natural gas value chain ........................................................................................................................... 66
Figure 19 - Preem financials ....................................................................................................................................... 68
Figure 20 - Lundin financials ...................................................................................................................................... 69
Figure 21- Tethys financials ........................................................................................................................................ 70
Figure 22 - PA Resources financials ........................................................................................................................... 71
Figure 23 - St1 financials ............................................................................................................................................ 73
Figure 24 - Borealis financials .................................................................................................................................... 74
Figure 25 - Akzonobel financials ................................................................................................................................. 75
Figure 26 - Perstorp OXO financials .......................................................................................................................... 76
Figure 27 - Nynas AB financials ................................................................................................................................. 78
Figure 28 - INEOS financials ...................................................................................................................................... 79
Figure 29 - Kemira Kemi AB financials ...................................................................................................................... 80
Figure 30 - Tikkurila financials ................................................................................................................................... 81
Figure 31 – Transformation output from refineries .................................................................................................... 83
Figure 32 – Outlook for the DCS market .................................................................................................................... 84
Figure 33 – Supplier power ......................................................................................................................................... 98
Figure 34 – Acquisition funnel example .................................................................................................................... 110

9
Tables
Table 1 – Most used chemical substances ................................................................................................................... 60
Table 2 – Preem financials .......................................................................................................................................... 67
Table 3 – Lundin financials ......................................................................................................................................... 69
Table 4 – Tethys financials .......................................................................................................................................... 70
Table 5 – PA Resources financials .............................................................................................................................. 71
Table 6 – St1 financials ............................................................................................................................................... 72
Table 7 – Borealis financials ....................................................................................................................................... 74
Table 8 – Akzonobel financials .................................................................................................................................... 75
Table 9 – Perstorp OXO financials ............................................................................................................................. 76
Table 10 – Nynas AB financials ................................................................................................................................... 77
Table 11 – INEOS financials ....................................................................................................................................... 79
Table 12 – Kemira Kemi AB financials ....................................................................................................................... 80
Table 13 – Tikkurila financials .................................................................................................................................... 81
Table 14 – Expansions and investments in Swede ....................................................................................................... 84

10
1. Introduction
The purpose of this chapter is to introduce the readers to the research project. The chapter starts
by introducing the research topic which is followed by the case company in focus and its
product. Additionally, the chapter aims to describe the purpose of the research and states the
research question and sub questions. Finally, delimitations and dispositions are presented in this
thesis.
1.1. Background of the Topic
Since 1990’s, customer relationship management (CRM) has been used often in marketing
literature. However, scholars have yet to define it in consensus (Buttle, 2009; Richards & Jones,
2008). Several definitions of CRM consist of few core features like: customer acquisition,
customer retention and maximizing customers long-term value (Jackson, 2005; Ngai, Xiu &
Chau, 2009). According to Buttle (2009), previous literature distinguished CRM into four types:
strategic, operational, analytical and collaborative. From research, majority of the literature on
CRM focuses on customer retention and fails to focus on customer acquisition (Sohnchen &
Albers, 2010). This is due to the fact that retention is much cheaper compared to acquiring new
customers. For a firm in the growing market it is important to have acquisition process
(Villanueva et al., 2008). In this case the automation of Chemical, Oil & Gas (OGC) industry is
growing. In a business market, i.e. B2B sales, there are relatively few customers, hence the loss
of even one customer could have big consequences (Blythe, 2009).
1.2. ABB’s background and offering
1.2.1. Historical Background and Structure
ABB (ASEA Brown Boveri) is a Swedish-Swiss multinational corporation that operates
primarily in robotics and the power and automation technology areas and is headquartered in
Zurich, Switzerland. ABB is a result of a merger of Swedish corporation Allmanna Svenska
Elektriska Aktiebolaget (ASEA) and the Swiss company Brown, Boveri and Cie (BBC) during
1988. BBC later absorbed Maschinenfabrik Oerlikon in 1967. During 2016, the company was
ranked 286th largest in-terms of revenue in the Fortune Global 500 list.

11
The organisational structure of ABB has four division’s being Power Grids,
Electrification Products, Robotics and Motion Division and Industrial Automation. ABB is the
world's largest manufacturer of electricity grids. Its core business being power and automation
technologies. ABB is one of the limited large businesses that has successfully implemented the
matrix structure in its organisation (New.abb.com, 2017).
For this research, the focus is on Industrial Automation (IA) division and specifically the
control technologies, which is ABB Sweden’s (From here referred to as ABB) Business unit
(BU) and a fragment of the IA division. The purpose of the BU is to provide customers with
systems for control, plant optimization, and industry-specific automation applications. Industrial
automation’s focus is to provide customers with products and solutions for instrumentation and
optimization of industrial processes. The industries served include oil & gas, power, chemicals
and pharmaceuticals, paper & pulp, metals and minerals, marine and turbocharging. Benefits of
this include improved asset productivity and energy savings. The focus of this research is on the
OGC market in Sweden (New.abb.com, 2017).
1.2.2. The Product – ABB Ability 800xA
ABB’s main automation offering to the Oil & Gas and Chemical market is the ABB Ability
system 800xA (Where xA stands for Extended Automation). This is a collaborative process
automation system that offers all major industrial process manufacturing facilities globally. The
product was introduced in 2004 and is a DCS system (Distributed Control System) that mainly
serves automation. Firms operating manufacturing with assembly lines where there is need for
high reliability and ease of programming and process fault diagnosis, used and still uses
Programmable Logic Controllers (PLC). PLC’s can range from small devices with tens of inputs
and outputs (I/O) in a housing integral with the processor, to a large modular device with number
of I/O that are frequently networked to other PLC and SCADA (Supervisory control and data
acquisition) systems.
PLC’s are a simpler variant of DCS system. Firms are increasingly moving from PLC
systems to DCS systems as it is more advanced and is more in line to serve Industry 4.0
(Growthmarkets-oil.com, 2017). Since PLC can be designed by the customer and needs to be
programmed and create a software and has only one program, it is more expensive and risky.
DCS systems are already available and there is no need to build it or can be additionally

12
supported with the existing system, it is a cheaper option. ABB ability 800xA system is ready to
serve Industry 4.0. Industry 4.0 is today and tomorrow, where smart equipment ecosystems
powered by Industrial Internet of Things (IIOT) and enabled by cloud computing. The 800xA is
the one for IIOT that is the lone automation platform that merges the ability to engineer,
commission and execute automation strategies for process, power management, electrical and
safety in the same redundant, reliable system. Recently at the ABB Automation & Power World
exhibition and fair in Houston, Texas, held in March 2017, ABB introduced an addition to its
automation platform ABB Ability system 800xA, a redundant Ethernet based single channel I/O
system named Select I/O. This new product aims to support the project execution model named
Intelligent Projects, where the aim is to provide improvement in efficiency in automation
products. The Select I/O will allow the user to install standard cabinets in the early stages of the
project and then select they type of I/O later. This new product allows users to save resources by
not having to adopt labor intensive marshaling panels by using digitally marshalling signals.
Using the Select I/O will allow users to minimize the impact of late changes and allow project
tasks to be done in parallels (ABB, 2017). Competitors like Emerson and Honeywell have
similar products in the market. Especially Emerson has Charms I/O and was introduced in 2009-
2010 (Charms I/O Cards Deal Straight (Signals) for Users, 2017). ABB has entered the market
late with this product. This can be a disadvantage or an advantage.
Comparing to other systems supplied by competitors, the extent of integration offered by
most automation suppliers extends only as far as select set of fieldbus technologies and loosely
integrated, bolted-on applications. This implies that competitor’s solutions can be severely
limited in functionality and delivered business value. The 800xA is an automation platform that
includes a full complement of integration capabilities. The product has more than a dozen
communications protocol interfaces to ABB’s AC 800M controller base along with pre-
integrated interfaces to multiple automation systems from ABB and other suppliers. This means
that with the possibility of integration looks for a range of third party software applications,
800xA is ready for current and future automation integration challenges. ABB’s control systems
are designed for continuous evolution and firm’s goal is to protect customers’ intellectual
investment, evolution services are hence available that provide competence and cost-effective
solutions for evolving the installed base of ABB and third-party control systems to 800xA
(System 800xA Solutions Handbook, n.d.).

13
The information presented here was gathered from employee knowledge and internally
published documents.
1.3. The Emergence of the Research Question and Purpose
When conducting the market analysis, there was no clear research question in place initially as
the researchers had not yet identified the problems facing the BU under consideration, being
Control Technologies for OGC at ABB Sweden. Later in the process when meeting with
employees, problems surrounding customer acquisition and difficulties in connection to
expanding their current pool of customers surfaced. Strategy was then set in place for the
research. The research was to become a single case study on how this specific BU of ABB
Sweden, supplying automation solutions within the OGC industry in Sweden, can expand their
customer base.
Main research question: How can ABB, expand their customer base in the Oil & Gas and
Chemical industry in Sweden using existing products?
Sub-question 1: How can ABB retain their current customers within this segment?
Sub-question 2: How can ABB acquire new customers within this segment?
The purpose of this research is thus to figure out how ABB can expand their current customer
base and offer suggestions regarding how the organization can accomplish this by investigating
what the organization is doing currently and review what the literature on customer retention and
customer acquisition suggests.
In past literature, this subject has been mostly covered by focusing exclusively on how
organizations can acquire customers through marketing strategies and new product development.
Currently there is discussion on co-creation and new product development to attract new
customers. For this research, the focus is on how to expand the customer base using existing
products within an existing market and at the same time emphasizing customer retention. This is
due to the nature of the market under consideration. Few big organizations make up most of the
customer side and supplier side of the market and any lost customer can have a significant
impact on the future performance of the organizations. This research thus focuses on how these

14
organizations should work towards the acquisition processes while not jeopardizing their
relationship with current customers.
1.4. Delimitations
The main objective of this thesis is to examine a specific business unit within ABB which
operates within the Swedish marketspace. The thesis aims to understand current activities within
this business unit and identify how the customer base can be expanded by using an existing
product. This is done by conducting interviews, analysing the market and its major players in
Sweden and reviewing relevant literature. Ways to expand the customer base through either new
product development or new market entry were not investigated as requested by the case
company. Due to the small size of the BU, there are limited number of people with extensive
knowledge of its operations that severely limited the number of internal interviews conducted to
three. Furthermore, due to time and contact constraints, interviews with ABB’s customers were
not conducted.
15
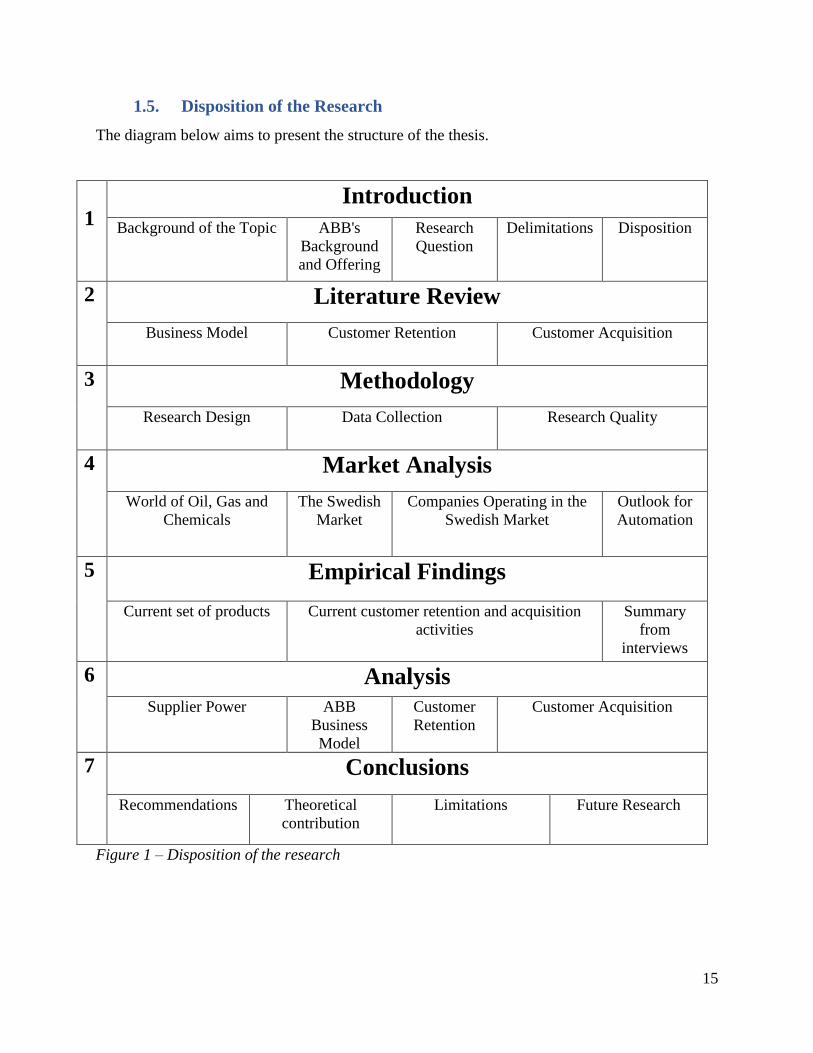
1.5. Disposition of the Research
The diagram below aims to present the structure of the thesis.
1 Introduction
Background of the Topic ABB's
Background
and Offering
Research
Question
Delimitations Disposition
2 Literature Review
Business Model Customer Retention Customer Acquisition
3 Methodology
Research Design Data Collection Research Quality
4 Market Analysis
World of Oil, Gas and
Chemicals
The Swedish
Market
Companies Operating in the
Swedish Market
Outlook for
Automation
5 Empirical Findings
Current set of products Current customer retention and acquisition
activities
Summary
from
interviews
6 Analysis
Supplier Power ABB
Business
Model
Customer
Retention
Customer Acquisition
7 Conclusions
Recommendations Theoretical
contribution
Limitations Future Research
Figure 1 – Disposition of the research

16
2. Literature Review
In this chapter, literature regarding customer retention and customer acquisition will be
presented along with relevant theoretical models that can help to answer the research question
and sub-questions.
Before beginning to understand how a firm can retain or acquire customers in a market, it is
important to understand what potential customer are looking for in a supplier. Similar to
consumer market in a B2B setting, firms also research on potential suppliers before contacting
them. It said that nearly 80% conduct research about supplier firms. Process of buying in
industrial markets has been researched since 1960’s, where interest was focused on behaviour of
buyers during 1970’s (Malaval, 2001). There are eight separate steps according to Robinson,
Faris & Wind (1967, p. 14):
• Recognise and anticipate problem (need) and general solution
• Determine characteristics and quantity required
• Describe the characteristics and quantity of the item needed
• Search and qualify the source
• Acquire and analyse the proposals
• Evaluate proposals and select suppliers
• Select an order routine
• Feedback of performance and evaluation
This process describes how companies look for suppliers and it usually begins with identifying
needs by companies, then the amount required, research about the products, screen suppliers,
evaluate the proposal submitted by suppliers, selecting how the product/service is delivered, and
finally giving feedback and scoring suppliers. In theory, buyers should be able to evaluate the
product and supplier individually. But in practise, integration is crucial and hence not possible
for buyers to separate the two.
Brand name is crucial as to some extent everyone runs into brands in their daily life.
Brands can be recognised by name, type of logo, symbol or even a particular design. But this is
not what makes it interesting in a B2B sense. The idea of value added is what brings a company
under consideration. As long as brands bring a customer added value, it is viewed as a source of

17
value for the company (brand equity). According to Keller (2003, p.3), “Brand is a name, term,
sign or symbol, or design, or a combination of these that is intended to identify goods and
services of one seller or group of sellers”. But few can argue that this definition is more suitable
to an age when brands were used when commercial corporation started. At the end of 19th
century, manufacturers increasingly started using their name where the objective was not mainly
to convince people that their product was superior but rather to have people see them in a new
light (Riezebos, 2003).
Brand strategies can have a larger potential in cases where consumers cannot judge the
quality of the purchase in advance thoroughly and also when it relates to a product that can have
effects on consumer’s personal identity (Riezebos, 2003). In a supplier market, it is important for
actors to differentiate its product so that there is competitive advantage (Egan et. al., 1992).
Trends like just in time management and others have led to decrease in number of suppliers per
manufacturer (El-Ansary, 1986, in Egan et al. 1992). Hence, to gain or maintain the limited
supplier relationships, it is crucial for companies to have suitable images both regarding the
company and the product.
Research by De Chernatony and Mc Donald (1998) suggests that business customers are
affected by feelings when deciding on a technologically advanced product and when there is big
financial risk. Other researchers have found that when suppliers are evaluated by buyers for
components and complex products, price is considered a minor factor while importance is on
quality, delivery and performance history (Dickson, 1966, in Blomback, 2005). This indicates
that there is more importance on corporate image of suppliers and could be connected to the need
for safety in long-term purchase, this is further argued by Johnston & Lewein (1996). They argue
that perception of a supplier is important when additional risk is perceived during purchase.
2.1. Business Model
Here we will discuss business models and pinpoint which building blocks we will be focusing on
for this project. The literature concerning business models presented here is to act as an
introduction to the following literature review as to understand how ABB does business.
To define a business model, it describes the rationale of how an organization creates, delivers,
and captures value. The business model can be best described using 9 basic blocks that show

18
how a company intends to make money. The 9 blocks cover 4 areas of a business: customers,
offerings, infrastructure and financial growth. Business model is similar to a blueprint for a
company’s strategy that can be implemented with the help of organizational structures, process
and systems (Osterwalder A. & Pigneur Y., 2010).
The 9 building blocks are:
• Customer Segments - where an organization serves one or many customer segments.
• Value Propositions - with this companies look to solve customer problems and satisfy
customer needs with the help of value proposition.
• Channels - with the help of communication, distribution and sales channel, value
proposition is delivered to customers.
• Customer Relationships - Relationships with customers are made and maintained with
each customer.
• Revenue Streams - it is a result due to value proposition that has been successfully
offered to customers.
• Key Resources - The assets that are required to offer and deliver elements that were said
before.
• Key activities - Carrying out various key activities
• Key Partnership - Few activities are outsourced and few resources are gained outside
the enterprise.
• Cost structure - Elements in business model which leads to cost structure.
According to Osterwalder & Pigneur, (2010) there are five types of customer relationships:
Personal Assistance - Based on human interaction, where customers can communicate with a
representative to receive assistance when product/service is sold or completed. This can take
place at point of sale, using call centers, emails or other means.
Dedicated personal assistance - Involves devoting a representative specifically to one customer.
This shows a deep and close form of relationship that usually develop due to long duration. For a

19
business-to-business transaction, a key account manager who maintains relationship with
customers is key.
Self-service - This is where a company maintains no direct relationship with its customers. The
necessary means of information or assistance is provided where customers can access
themselves.
Communities - More and more, companies make use of user communities where it can be more
involved with its customers/prospective customers and help build connection between
community members. Several companies manage communities online that allow customers and
users to exchange knowledge and solve each other’s problems. With the help of communities,
companies can also better understand its customers.
Co-creation - Many companies are moving farther away from traditional relationship of
customer-vendor to co-create value with its customers.
To answer the research question of how the BU of ABB can expand its customer base, the
customer relationship block in business model will be focused on. Every company should define
relationship type it would like to establish with every customer segment. Relationship could vary
from personal to being automated. Customer relationship could be steered due to a company’s
motivation of: Acquiring customers, retaining customers and boosting sales. The focus of the
literature review will thus be on existing literature regarding customer retention and customer
acquisition.
2.2. Customer Retention
Customers usually generate increasing profits over time for a company, making them more
valuable the longer they stay. Operating costs to serve return customers declines over time and
more interestingly return customers tend to refer the company to others as well. Purchases by
long serving customers also go up over time along with the fact that loyal customers are often
prepared to pay a price premium (Reichheld and Sasser, 1990). Depending on which research
you look at and within which industry, acquiring a new customer is anywhere between five to 25

20
times more expensive than retaining an existing customer as you do not need to spend time and
resources going out to find new customers (Gallo, 2014). Jill Avery, a senior lecturer at Harvard
Business School, notes that if a company wants to keep its customers it is essential to understand
on a deep level why the ones that leave decide to do so and figure out the underlying reasons for
it. Common mistake made by managers is to fail to realize that high churn rate can be caused by
poor customer acquisition efforts where a lot of effort is put into attracting the wrong kind of
customer (Gallo, 2014). This connection between high churn rate and acquisition even stretches
into the high turnover of executives. Krug & Aguilera (2005) note that an average of 68%
acquired firms’ executives depart within five years following the acquisitions putting extra
pressure on retention activities of the company in order to continue to develop the relationship
because of the change of executive.
According to Anderson & Mittal (2000), customer retention is basically a net present
value proposition due to the nature of the relationship development between the two parties.
Retained customers are a revenue-producing asset to firms although profits may be negative for
the first period due to the cost of acquiring the customer. Customer may thus only become
profitable to serve over time hence the net present value connection. Reichheld (1996) notes how
firms’ ability to retain customers is a measurement of how well it can create value for its
customers. In the business-to-business (B2B) context where individual customers can be
responsible for a significant portion of revenues a stronger focus on customer retention has
proven to be an important source of value for firms (Anderson et al., 2001; Gupta, Lehmann, &
Stuart, 2004). B2B customer relationships are recognized as more stable than business-to-
consumer (B2C) in general and tend to be long-lasting (Sjoberg, 1994; Håkansson, 1982). The
“interaction-approach” developed by the IPM group empathizes this view and notes that markets
aren’t made up of many individual insignificant customers nor simply of actions of suppliers.
Instead, the process consists of interactions between active buyers and sellers creating a complex
offering, to which both parties may contribute and which may be developed between them. In
short, every transaction is a part of a relationship which may be complex and long-established
(Ford, 2004). Many researchers argue that customer retention is strategically imperative for firms
(see Anderson & Mittal, 2000) which leads to the never-ending question of how one can
understand customer retention and which factors contribute toward increasing retention. In an
attempt to shed some light on this matter the link between marketing and service operations and

21
the business customers’ subsequent re-patronage behavior was examined by Bolton, Lemon, &
Bramlett (2006). The service contract renewal decision in the high-technology support service
industry was examined using a longitudinal, multi-country, cross-sectional data base and
highlights the importance of developing dynamic models of customer decision making (Bolton,
Lemon, & Bramlett, 2006). Spiros Gounaris set out for a similar journey where he investigated
the role of trust and commitment on the behavioral intentions in regard to existing relations
(Gounaris, 2005).
According to Berry (2002) the concept of relationship marketing was first introduced in
1983 and from that point the concept has been changing and there doesn’t seem to be a unity in
the literature concerning relationship marketing and its factors. Most researchers involved in
relationship marketing focus their literature around creation and nurturance of long-term
relationship with customers to some extent but there doesn’t seem to be a united point of view
regarding customer retention (Berry, 2002; Gummersson, 2002; Lee & Jun, 2007; Kaur, Sharma,
& Mahajan, 2012). Henning-Thurau (2000) analyzed customer retention using a linear model
which indicates that between customer satisfaction and customer retention there is the important
factor of relationship quality. Henning-Thurau & Klee (1997) note that customer retention
describes a stage reached in the customer relationship life cycle where the customer becomes
satisfied and realizes that deeper relationship with the supplier would be in his interest.
Long run positive relationship between customer satisfaction (CS) and financial
performance of a company has been well documented. Anderson et al. (1994) showed how CS
increases loyalty of customers and thus increasing customer retention as highly satisfied
customers tend to repurchase or continue to consume the current service offered. A new research
also shows evidence in favor that overall satisfaction positively influences customer retention
(see Ruiz Diaz, 2017). Cumulative CS is an overall evaluation based on the total purchase and
consumption experience with a particular good or service over time. This positive relationship
between CS and profits, and by extension between customer retention and profits showcases the
importance for a company to nurture their current customers as their value tends to go up over
time (Anderson et al., 1994). Some have labeled satisfaction measurements a “trap” as the
satisfaction does not always transition efficiently into increased profits and more focus proposed
on customer retention. According to Anderson & Mittal (2000), this would be a mistake as the
connection between satisfaction and customer retention is clear although they do note that the

22
relationship is not linear. In this research, the view that customer satisfaction acts as a central
determinant and translates into customer retention is embraced. This view is accepted by many
researchers (see Hennig-Thurau & Klee, 1997). Many practical and theoretical models of
customer retention have looked at CS as a key determinant in the customer decisions whether or
not to continue with given product or service relationship (see Bolton, 1998; Rust and Zahorik,
1993; Zeithaml et al., 1996).
2.2.1. The Conversion Model
This model can be used efficiently by companies both as a retention strategy and for customer
acquisition. The basic premise of the conversion model, developed by Jan Hofmeyr and
presented by Buttle and Maklan (2015, pp.62-63), is that uncommitted customers are more likely
to switch to another provider. Commitment here is a function of satisfaction with a brand,
product, service or offer. Involvement is considered low if the usage context of the product or
service is relatively unimportant to customer. Customers are segmented into four different
subsets within two clusters containing either committed customers or uncommitted customers in
order to match their commitment level:
Committed Customers Uncommitted Customers
Entrenched Unlikely to switch in the
foreseeable future
Shallow Lower commitment than average,
and some of them are already
considering alternatives
Average Unlikely to switch in the short
term but may switch in the
medium future
Convertible Most likely group to defect
The problem here is to how exactly to measure the commitment of each customer (Buttle and
Maklan (2015, pp.62-63). Henning-Thurau & Klee (1997) define commitment in their work as a
customer’s long-term ongoing orientation toward supplier relationship which is grounded on
both emotional bond to the relationship and on the sheer conviction that by remaining in the

23
relationship he (the customer) will yield higher net benefits compared to termination of the
relationship. Additionally, they note that trust and overall quality of the relationship between
customer and supplier is the main ingredients for commitment between the two parties. The term
commitment can still be found in significantly varying conceptualizations (Young & Denize,
1995). In the conversion model, it is suggested that measuring the commitment can be achieved
by asking the following four questions where x stands for the product or the service:
1. How happy are you with x?
2. Is this relationship something you care about?
3. Is there any other x that appeals to you?
4. If so, how different is the one x from the other?
Similar segmentation can also be used for non-customers where four different subsets are listed
within two clusters of either open non-customers or unavailable non-customers:
Open non-customers Unavailable non-customers
Available Prefer the alternative to their current offer
though they have not yet switched, and are
ready to switch
Weakly Prefer their current
offerings over
alternatives
Ambivalent As attracted to the alternative as they are to
their current offerings
Strongly Strong preference for
their current offerings
These profiles, if conducted effectively, can be used to guide both customer acquisition and
retention strategies. It is suggested that if the number of open non-customers is greater than the
number of uncommitted customers the company should focus strongly on customer acquisition.
Different strategies are needed for different groups in order to maximize the customer
base. Companies need to nurture their current relationships with committed customers and find a
way to enrich and enhance their customer experience. At the same time a different approach is
required by uncommitted customers. The company needs to investigate why the commitment

24
level is low and address the causes. Causes can vary as the customer could belong to the low-
involvement category, or the issue can be related to below-pair customer experience.
Whether companies should appeal to open non-customers depends heavily on the
potential value they can generate. There can be many potential reasons why some market
segments are composed of unavailable non-customers. These non-customers may have tried your
offer before and were not satisfied; they may be heavily committed to their current supplier or
brand; they may find your offer unappealing; or, they are simply unaware of your offer.
Advertising and other forms of customer communications can help with the last problem,
allowing you to shift these non-customers from unavailable over to the open cluster. Regarding
the others, a customer research might reveal what it is that customers do not like about your
offerings and provide some clues about how to improve their experience (Buttle and Maklan
(2015, pp.62-63).
2.3. Customer Acquisition
For any company, the main purpose is to create customers (Drucker, 1973). Searching for correct
customers that generate profits could be defined as customer acquisition (Kotler & Armstrong,
2009). Previous research shows that there is exhaustive qualitative and knowledge regarding
sales process (Shapiro, 1974). But within the literature and articles, the emphasis is on the latter
stages which is cross or up-selling (Akcura & Srinivasan, 2005; Pepper & Rogers 1999) or
retaining customers (Gupta et al., 2004). There is limited research on acquiring new customers or
the initial stages, where for B2B it involves sales of complex products, services like machines or
enterprise software and mainly sold to one specific customer. Customer acquisition is needed for
all companies that begin a business, expand, provide products & services, and is effective in
instances where switching costs are relatively low and repeat purchases are rare. According to
Jobber (2010), companies currently decide to segment customers so that the focus is on the
customers that they can acquire and satisfy the best so as to generate profits. After the process of
segmentation of customers, it is crucial for companies to understand the consumers.
Acquiring new customers for their projects has numerous stages that can be prospecting,
presenting the initial product, to selling (Johnston & Marshall 2006 p.626 f.; Dwyer et al., 2000;
Moncrief & Marshall 2005). Process of acquiring new customers involves a classic pipeline
problem (Ding & Eliashberg, 2002). These pipelines are represented with the help of a flow of

25
projects where different stages of sales process eliminate few projects and others are successful.
Hence, numerous customer acquisition projects need to be funded and started so as to achieve
final sales. Therefore, the hurdle for managers is to find the number of projects that need to be
funded at each stage of selling process as it depends on the probability of transition from each
stage to the next and finally successfully selling.
Companies seem to have shifted their focus from the issue of customer acquisition in
recent migration of thought to management of customer retention. Customer acquisition is
important for any company and demands attention as the first stage of the customer life-cycle.
From previous research by many authors, companies are not particularly skilled at managing
customer acquisition process and an example is that less than half of the companies have a
dedicated customer acquisition plan. According to Ang & Buttle (2006), one variable
distinguishes companies that excel in customer acquisition, which is that they have a dedicated
budget for customer acquisition activities. Other variables are that they have an executive present
for customer acquisition, with an understanding of the economics of customer acquisition and
deployment of CRM technologies to support customer acquisition.
The idea of customer life-cycle is less prevalent and a number of customer management
researchers have developed a conceptual framework of the customer's journey like Christopher,
Payne & Ballantyne (1991) and Ang & Buttle (2002).
According to Levitt (1986), customers are assets that need to be acquired before they can
be managed so that there is profit for the company. In a mature and competitive market,
customer retention is clearly an important objective, but customer acquisition is still very
important for companies in several contexts like for: entering a new geographical market,
customer segment, launching a new product, new business segment, exploiting new application
for existing products or services, marketing products and services that are low in involvement,
repeat purchases are infrequent and switching costs are low. Additionally, when there is a growth
potential for a market, it is strategically important for all stakeholders to grow the aggregate
market size compared to protecting their own customer base through putting efforts in customer
retention.
Customer acquisition is key for companies even if customer retention is favored by them
and maintained as a core strategy. Ang & Buttle (2006) observed that annually, 25% or more
customers of companies need to be replaced. In a business-to-business context, corporate

26
customers could be lost because of acquisition by other companies that have a long-established
supplier preference or stopping production of goods and services where input was required or
ending trade. Hence, it is understood that when there is no well-developed, focused and
successful customer acquisition strategy, it is irrelevant to have a customer retention and
development strategy.
Customers have little time, energy or interest to establish strong brand relationship (ref
Dowling in Ang & Buttle, 2006). Few customers switch brands frequently or portfolio shoppers
and other customers are interested in fulfilling their need compared to continuity. Indicated by
Goodwin & Ball (2003), there can be a considerable amount of economic gain by focusing on
acquiring customers. They calculated that companies that have a 16.7% of market share enjoy 5
times the revenue impact by an increase of 1% in acquiring compared to a 1% increase in
retaining customers.
Looking through literature, there is little to no evidence regarding management practices like
planning, budgeting or the deployment of technologies that help with customer acquisition.
According to Blattberg et al (2001), there is no claim by management to actually acquire
customers but only strategically act about it.
2.3.1. Acquisition Funnel
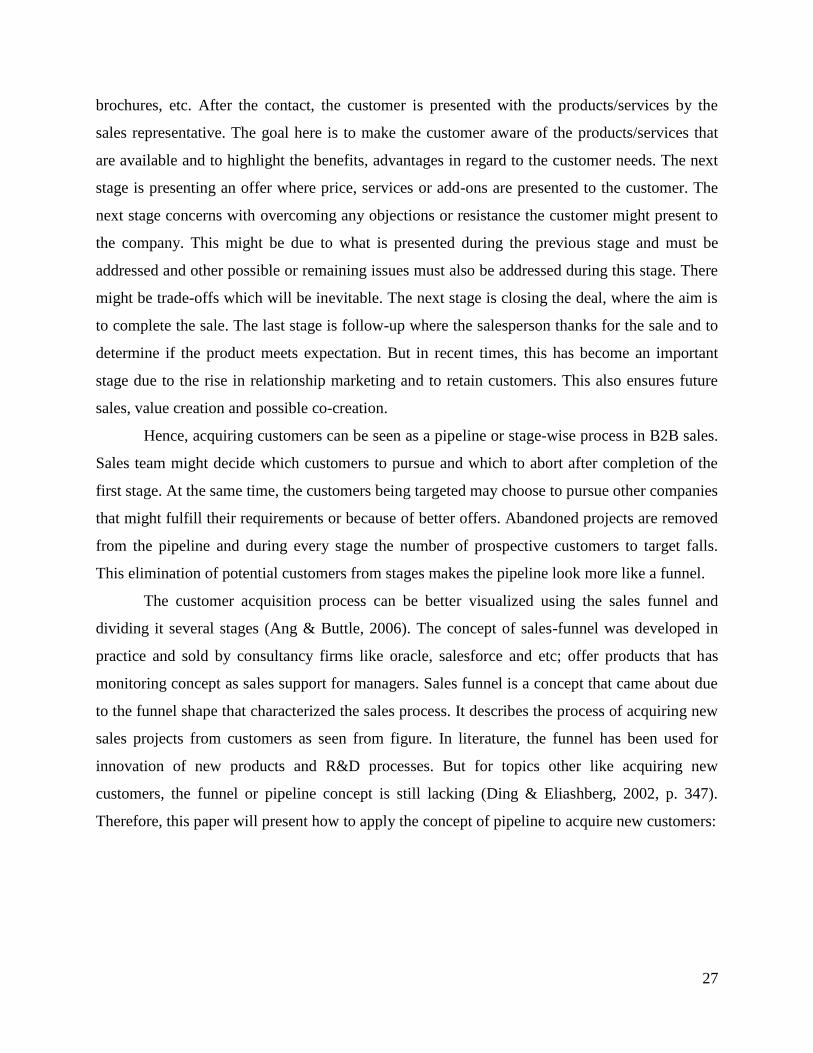
The acquisition process consists of numerous stages (Moncrief & Marshall, 2005). It describes
what companies must complete successfully so as to close a sale with a prospective customer.
Figure 2 – Customer acquisition process (Adapted from Moncrief & Marshall, 2005).
The figure shows the stages of customer acquisition for B2B. In the first stage of prospect,
customers are identified and evaluated using public information gathered from sources like
internet, internal sources or from sales and marketing department. The second step is
approaching the customer where the aim is to contact which can be done via e-mail, telephone,
27
brochures, etc. After the contact, the customer is presented with the products/services by the
sales representative. The goal here is to make the customer aware of the products/services that
are available and to highlight the benefits, advantages in regard to the customer needs. The next
stage is presenting an offer where price, services or add-ons are presented to the customer. The
next stage concerns with overcoming any objections or resistance the customer might present to
the company. This might be due to what is presented during the previous stage and must be
addressed and other possible or remaining issues must also be addressed during this stage. There
might be trade-offs which will be inevitable. The next stage is closing the deal, where the aim is
to complete the sale. The last stage is follow-up where the salesperson thanks for the sale and to
determine if the product meets expectation. But in recent times, this has become an important
stage due to the rise in relationship marketing and to retain customers. This also ensures future
sales, value creation and possible co-creation.
Hence, acquiring customers can be seen as a pipeline or stage-wise process in B2B sales.
Sales team might decide which customers to pursue and which to abort after completion of the
first stage. At the same time, the customers being targeted may choose to pursue other companies
that might fulfill their requirements or because of better offers. Abandoned projects are removed
from the pipeline and during every stage the number of prospective customers to target falls.
This elimination of potential customers from stages makes the pipeline look more like a funnel.
The customer acquisition process can be better visualized using the sales funnel and
dividing it several stages (Ang & Buttle, 2006). The concept of sales-funnel was developed in
practice and sold by consultancy firms like oracle, salesforce and etc; offer products that has
monitoring concept as sales support for managers. Sales funnel is a concept that came about due
to the funnel shape that characterized the sales process. It describes the process of acquiring new
sales projects from customers as seen from figure. In literature, the funnel has been used for
innovation of new products and R&D processes. But for topics other like acquiring new
customers, the funnel or pipeline concept is still lacking (Ding & Eliashberg, 2002, p. 347).
Therefore, this paper will present how to apply the concept of pipeline to acquire new customers:
28
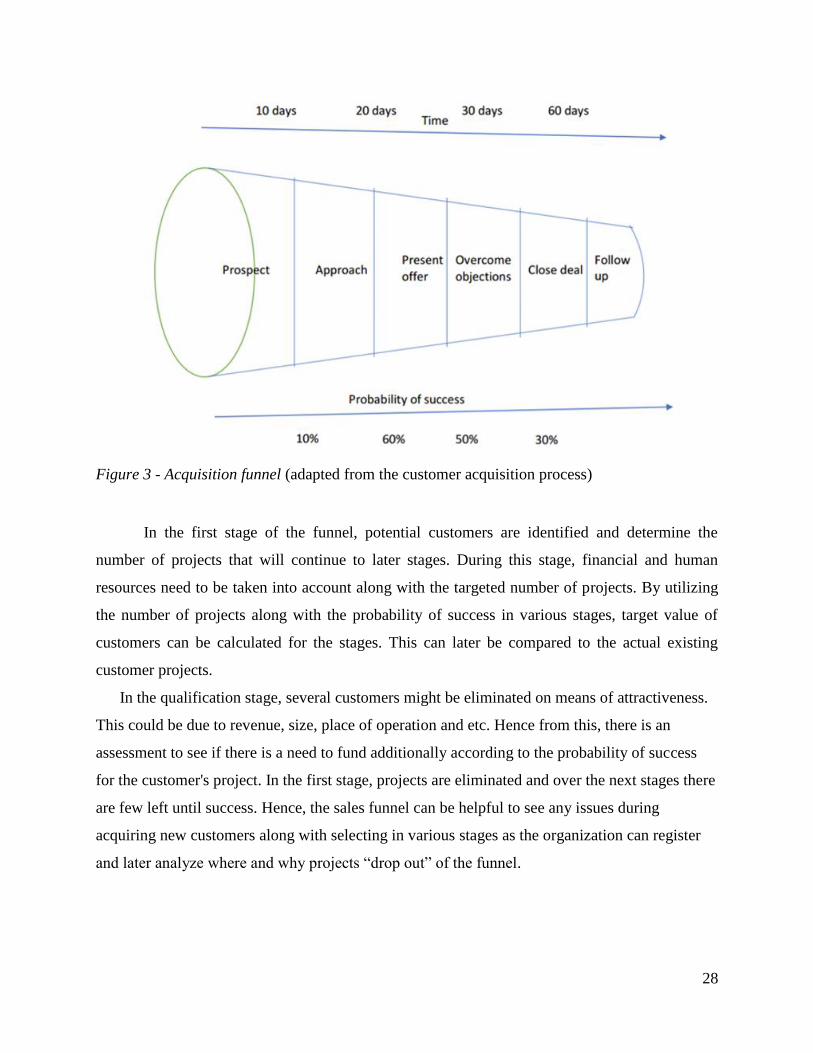
Figure 3 - Acquisition funnel (adapted from the customer acquisition process)
In the first stage of the funnel, potential customers are identified and determine the
number of projects that will continue to later stages. During this stage, financial and human
resources need to be taken into account along with the targeted number of projects. By utilizing
the number of projects along with the probability of success in various stages, target value of
customers can be calculated for the stages. This can later be compared to the actual existing
customer projects.
In the qualification stage, several customers might be eliminated on means of attractiveness.
This could be due to revenue, size, place of operation and etc. Hence from this, there is an
assessment to see if there is a need to fund additionally according to the probability of success
for the customer's project. In the first stage, projects are eliminated and over the next stages there
are few left until success. Hence, the sales funnel can be helpful to see any issues during
acquiring new customers along with selecting in various stages as the organization can register
and later analyze where and why projects “drop out” of the funnel.

29
2.3.2. Growth Matrix
Known as “Four ways to grow a Business Model” or “Ansoff Product-Market Growth matrix”,
the matrix was made by the strategist Igor Ansoff to help companies focus on options for
business growth (Simister, 2011). There are four Growth options of the matrix proposed by
Ansoff:
Market Penetration Strategy - current products and current markets
Product Development Strategy - new products and new markets
Market Development Strategy - current products and new markets
Diversification - new products and new markets
Figure 4 – Ansoffs Growth Matrix (Simister, 2011)
To answer the research question, the focus will be on the first option of the matrix that is Market
Penetration. This is preferred by numerous companies as it is considered safe and the main focus
is on selling existing products to:
• Existing customers
30
• Customers that are similar to existing ones but are buying from competitors and
• Customers that have that have not been targeted and/or have a need but are not buying
from the company
The main emphasis is on increasing market share by using promotions, effective marketing and
creating more value for customers (Doyle, C, 2011)
2.3.3. ACTMAN
A customer acquisition approach with a 6-phase approach to acquiring customers called
ACTMAN (Acquisition Tactical Management) was developed by Blattberg et al. (2001) and
presented by Ang & Buttle (2006). The 6 critical elements help companies manage for more
efficient and effective customer acquisition and include:
Targeting - Companies need to target customers (i) that recognize there is a need or desire for
the company's offerings and also (ii) customers that have not yet identified their need for the
offering, but will benefit due to the company’s offerings and products. The second group
customers will be difficult to acquire as the company providing product/services will have to use
vehicles of marketing like suggestive advertisement or sampling. There are 3 methods to target
customers:
• Individual customer targeting
• Segmented targeting &
• Self-selection targeting, where customers identify themselves by responding to the
company’s offerings.
Awareness building and Positioning- When customers are gathering information to decide on
purchasing products, companies should have appropriate management of critical step of
awareness building and position the product/service so the customer can consider them.
Companies need to be aware that if positioning and awareness creation promises something
extravagant, then customers will request to try the product. However, the retention might drop
because of dissatisfaction. Hence, companies need to balance positioning initially against its
products abilities so as to deliver the benefits that were promised. If this is not done, then the

31
company can risk destroying potential customer equity from retention and other additional sales
or services.
Acquisition pricing - Pricing due to acquisition can influence a lot regarding retention pricing.
This acts as a reference for future prices for customers. If retention prices are higher than
reference prices, the customers might not purchase the product/service. Because of this the
company’s pricing strategy has to include how it will manage change in price of acquisition to
retention. If customers are attracted due to low acquisition price and higher retention price, then
a large number of first time buyers would be lost.
Product trial - Several companies see product trial an important strategic objective. This is
which signifies a shift from which customers move from evaluating or consideration to
purchasing the product/service. This is done so that the company can demonstrate to its
customers that the customer that the product/service meets their needs.
Product design - A company’s capability to meet customer needs and expectation depends on
the research and development that manages product/service design and operational staff that
controls production and delivery.
Post-purchase service - This is crucial for any company in addition to marketing communication
that influences significantly experience of using and satisfaction by customers. The customer
services team is significant as it manages the post-purchase servicing.

32
3. Methodology
This chapter describes and motivates the methodological considerations taken to conduct this
master thesis. The description below could be interpreted as a picture of chronological process;
however, this is not the case. When writing this thesis, it was an iterative process where theory
and empirical chapter was developed simultaneously. This means chapter one was not
necessarily written first and the conclusion presented finally but not necessarily last.
3.1. Research Design
3.1.1. Research Structure and Process
In the beginning of the process a market research was performed where the space in which the
current and potential customers of ABB were operating within was analysed. This section of the
research helps the researchers to realize the market conditions facing ABB and the challenges
and opportunities facing the organization within this industry. During this process, the problems
facing ABB came to light which led to the emergence of the research question as described in the
introduction.
After the research question was identified, and two sub-questions constructed, the
researchers decided upon an appropriate methodology and literature review was conducted with
the focus on customer retention and customer acquisition.
The initial literature review uncovered few theoretical models of interest for this case
study. The next step was to collect empirical data in the form of semi-structured interviews in
order to shed some light on how customer acquisition and customer retention is currently
conducted at ABB. The data from these interviews were then transcribed and main inputs
documented and split into two main clusters: Current set of products and services, and Current
customer retention and acquisition activities.
Lastly the empirical data was analysed in relation to the specified models uncovered in
the literature review which led to conclusions and recommendations for ABB.
3.1.2. Epistemological and Ontological Position
Organizations and the people within them are considered in this research which indicates that the
project lies within the social sciences rather than natural sciences. Thus, the required strategy
33
needs to respect the differences between people and the objects of the natural science. The
research requires the researchers to gather and interpret empirical data gathered during the
process through communication to individuals. These principles are in line with the
epistemological position of interpretivism which is, according to Bryman & Bell (2011), suitable
for studies in social sciences which requires the researcher to subjectively interpret the empirical
data to some extent.
This project follows a constructivist perspective regarding its ontological position.
Individual behaviour, opinions and experiences play a significant role in this project while the
assumption is that the environment is in constant change and depends on the individuals which
act within it, which indicates that a constructivist perspective is appropriate here (Bryman &
Bell, 2011).
3.1.3. Case Study
It is important to consider what the research aims to answer before choosing the appropriate
research method. According to Yin (2009), a case study is appropriate if the question one aims to
answer seeks to explain some present circumstance (e.g. “how” or “why” some social
phenomenon works). In this research, the aim is to answer: How can ABB, expand their customer
base in the Oil & Gas and Chemical industry in Sweden using existing products? This fit well
with a case study and since the researchers have been granted access to ABB’s personnel and
their knowledge it was decided to conduct a single case study and seek to answer the identified
question by conducting interviews and comparing them to past literature.
There are some draw-backs of case studies, just like any other research method.
Commonly named draw-backs are; hard to generalize from a single case, time consuming, bias
toward the organization in focus. On the other hand, case studies can provide the researcher with
deeper knowledge than many other research methods and in many cases information that
otherwise would not be accessible (Yin, 2009).
3.1.4. Employing a Qualitative Research Strategy
Empirical research methods are a part of research method where empirical data is collected to
answer a particular research question and used mainly for academic research and could also be
used to answer practical questions (Moody, 2002).

34
According to Bryman & Bell (2011), a case study can consist of a quantitative,
qualitative or a mixed research strategy. While the quantitative approach samples information
through numbers, the qualitative approach does so through words. For this case study, qualitative
research method was employed where qualitative data in the form of text, images, sounds etc. are
used, which are drawn from observations, interviews and documented evidences. It is then
analysed using qualitative data analysis method. Qualitative approach was chosen as it goes well
with a single case study where the case can be thoroughly examined through observations of
current activities and deeper information gathered through interviews with employees.
According to Yin (1994), no research method is completely qualitative or quantitative in
practise. An example is that a survey can collect qualitative data when using open ended
questions along with quantitative data when using close ended questions; observations of
behaviours with response time measures and accuracy could be included in an experiment;
quantitative data can be included in a case study with qualitative data (statistics and interviews).
3.1.5. Inductive approach
The two most common research approaches are deductive- and inductive approach. The
deductive viewpoint refers to looking at a phenomenon in relation to existing theory with the aim
of re-shaping it. The deductive approach is often associated with a quantitative research approach
(Bryman & Bell, 2011).
For this research, inductive approach was adopted. Just like deductive approach often
goes with quantitative approach, qualitative strategy is often associated with inductive approach
of relationship between theory and research. The motive behind inductive approach is generation
of new theory, that includes existing theories and empirical findings (Bryman & Bell, 2011).
Hence using the existing literature and theories on customer retention and customer acquisition
and empirical findings will create a solid foundation to develop a way to expand the customer
base and increase market share.

35
3.2. Data Collection
Data for this thesis was mainly collected in two ways. Primarily being literature review and case
study of the company in focus, where semi-structured interviews were conducted.
3.2.1. Secondary Data
Secondary data refers to data which is collected by someone other than the author.
3.2.1.1. Literature Review
A systematic literature review has emerged as a focus of interest for two main reasons according
to Bryman & Bell (2011). First, it has been suggested that reviews of the literature often tend to
reflect the biases of the researchers. A systematic literature review decreases these risks of bias.
Second, there has been a movement towards evidence based solutions and systematic literature
review is seen as a cornerstone of evidence-based approaches which purpose is to provide advice
based on all available evidence. Systematic literature review helps the researchers to minimize
the risk of research bias which was the main reason for the approach being used as a foundation
for the literature review in this research project.
Bryman & Bell (2011) suggest that the first step in the systematic literature review
process is to specify an answerable research question. Next, the stakeholders are identified and
set up regular meetings where boundaries of the review are set, including criteria for inclusion
and exclusion of studies, and later to monitor the progress. In this research, there are two main
stakeholders apart from the researchers involved, being the Control Technologies BU at ABB
and the supervisor at the Institute of Innovation and Entrepreneurship at University of
Gothenburg.
One of the most important activities of the systematic literature review is to define a list
of keywords which enables the researchers to conduct a systematic search for relevant theories
and literature available (Bryman & Bell, 2011). Examples of selected keywords for this research
are; CRM, customer retention, customer development, retaining customers, B2B relationships,
market penetration, acquiring customers, customer life cycle. These keywords, among others,
were used separately or in different combinations in order to improve the results. Examples of
search engines used for the literature review in this research are; Google, google scholar, Orbis,
Ebis, ABB BIS and Gothenburg university bibliotek website. Additionally, the reference lists of
many of the relevant articles found were reviewed in order to strengthen the literature review.

36
After the identification of relevant keywords and the search criteria and research scope has
been defined the systematic literature review is to be conducted. This involves carrying out a
comprehensive and unbiased search which has a base in the previously identified keywords and
falls within the research scope and search criteria. Literature on customer retention and customer
acquisition is explored until no additional relevant theories emerge (Bryman & Bell, 2011).
3.2.1.2. Market Data
For market analysis, data regarding import and export of goods, prices and supply infrastructure
was collected through various sources including but not limited to; Google Scholar, Orbis, Ebis,
ABB Business Intelligence Portal (BIS), Marketline, KEMI, Statistics Sweden, European
Statistics, Energy Information Agency, and Energymarknads Inspektioner.
3.2.2. Primary Data
Data which is collected for a specific research by the researcher himself is considered to be
primary data. Commonly used techniques to obtain such data is through interviews, observations
and questionnaires (Bryman, 2012).
3.2.2.1. Semi-Structured Interviews
The primary data used in this research was collected using semi-structured interviews. Semi-
structured interviews were chosen as it allows researchers to ask follow-up questions and allow
the respondents to drift to some extent from the original question. This provides flexibility that
will permit the interviewees to express experiences and opinions that can add value to the
research while still covering the subject at hand. Still, the interview structure is of vital
importance as it allows researchers to guarantee comparison between interviews and enables the
researchers to conduct relevant analysis and comparison of the data gathered from various
sources (Bryman & Bell, 2011).
For this project, four interviews were conducted with three different people. All
respondents had knowledge of the subject at hand and each of them were able to offer a different
perspective. As the respondents decided to remain anonymous, their position will be described
vaguely and be named respondent with a letter following (e.g. Respondent A). Attempts were
made to conduct more interviews but the BU in focus in quite small which then limits the
number of people possessing relevant knowledge of the BU’s activities. The initial plan was to
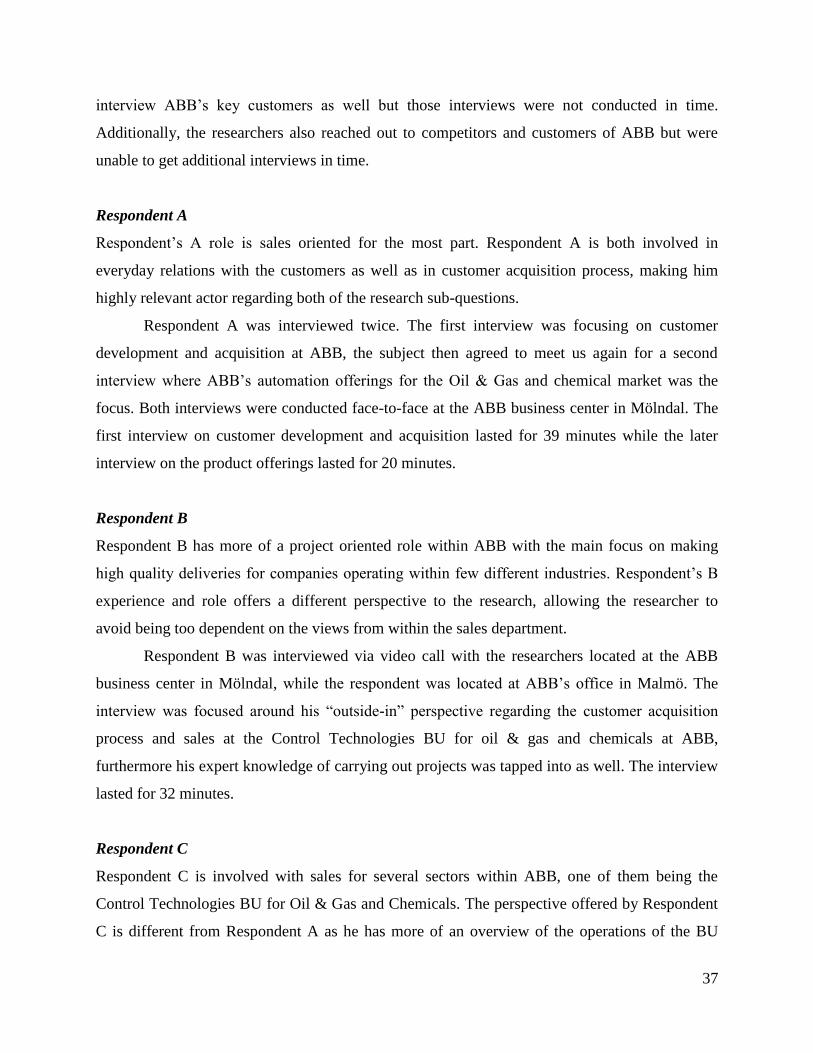
37
interview ABB’s key customers as well but those interviews were not conducted in time.
Additionally, the researchers also reached out to competitors and customers of ABB but were
unable to get additional interviews in time.
Respondent A
Respondent’s A role is sales oriented for the most part. Respondent A is both involved in
everyday relations with the customers as well as in customer acquisition process, making him
highly relevant actor regarding both of the research sub-questions.
Respondent A was interviewed twice. The first interview was focusing on customer
development and acquisition at ABB, the subject then agreed to meet us again for a second
interview where ABB’s automation offerings for the Oil & Gas and chemical market was the
focus. Both interviews were conducted face-to-face at the ABB business center in Mölndal. The
first interview on customer development and acquisition lasted for 39 minutes while the later
interview on the product offerings lasted for 20 minutes.
Respondent B
Respondent B has more of a project oriented role within ABB with the main focus on making
high quality deliveries for companies operating within few different industries. Respondent’s B
experience and role offers a different perspective to the research, allowing the researcher to
avoid being too dependent on the views from within the sales department.
Respondent B was interviewed via video call with the researchers located at the ABB
business center in Mölndal, while the respondent was located at ABB’s office in Malmö. The
interview was focused around his “outside-in” perspective regarding the customer acquisition
process and sales at the Control Technologies BU for oil & gas and chemicals at ABB,
furthermore his expert knowledge of carrying out projects was tapped into as well. The interview
lasted for 32 minutes.
Respondent C
Respondent C is involved with sales for several sectors within ABB, one of them being the
Control Technologies BU for Oil & Gas and Chemicals. The perspective offered by Respondent
C is different from Respondent A as he has more of an overview of the operations of the BU

38
while Respondent A is constantly involved with direct communications with the customers. This
increases the credibility of the research as it provides the researchers with different perspectives
of the sales efforts of the BU, including customer development and customer acquisition.
Respondent C was initially supposed to be interviewed via video call but due to
technological difficulties, the interview was conducted through phone with the researchers
located at the ABB business center in Mölndal and the respondent at ABB’s office in Stockholm.
The interview had a similar focus as the interview with respondent A, touching mainly upon
customer acquisition and customer development activities of the automation for Oil & Gas and
Chemicals. The main difference was the before described perspective difference between the
two. The interview lasted for 31 minutes.
3.3. Research Quality
The quality of a research can be evaluated by two concepts, reliability and validity. These two
concepts will be discussed along with ethical implications and limitations of the chosen
methodology.
3.3.1. Reliability
Reliability of a research is a measurement of how replicable the research is. This is a challenge
for a qualitative research since it is often heavily reliant on the researcher’s point of view and
vulnerable to personal bias. Reliability suggests that other researchers should be able to conduct
the same study and arrive at the same result. The concept of reliability can be divided into
internal reliability and external reliability (Bryman & Bell, 2011).
Internal reliability is based on what the members of the research team agree upon and
what they see and hear. In activities such as interpretation and transcription of data where more
than one observer is involved there is a possibility that lack of consistency in their decisions
emerges. This lack of consistency can affect the reliability of the research in a negative manner
(Bryman & Bell, 2011). In order to increase the internal reliability of the research the interviews
were recorded by both researchers and transcribed. The transcription was verified by both
researchers and then sent to the respondents where they had a chance to modify their answers to
prevent misinterpretation. Additionally, the entire process of the research was conducted in

39
collaboration of both researchers and every decision was made jointly which in turn increases the
internal reliability.
External reliability stands for the degree to which a study can be replicated. This criterion
is very difficult to meet in a qualitative research as the social setting and the circumstances from
when the initial study was conducted is impossible to perfectly replicate (Bryman & Bell, 2011).
In an attempt to make the research replicable, the researchers have described and motivated the
steps of the research and all respondents from the conducted interviews received the same
questions asked in the same order.
3.3.2. Validity
The term validity refers to weather the researchers are measuring, identifying, or observing what
they say that they are. Validity can also be divided into internal validity and external validity
(Bryman & Bell, 2011).
Internal validity measures if there is a good match between researchers’ observations and
theoretical ideas developed (Bryman & Bell, 2011). Regarding the observations made by the
researchers, it is important to point out that the researchers are aware of the possibility that
respondents might have, in some cases, presented the company more positively because of the
fact that they are all employed by ABB. The internal validity is vital for qualitative research as
the researchers make their own interpretations and conclusions which can affect the objectivity
of the research according to Bryman & Bell (2011). One way to reduce this risk is to transcribe
the data attained by the researchers and have it verified by all participants of given interview,
being the researchers and the respondent. This was done in this research in order to prevent any
misinterpretation from the interviews as it was acknowledged by the researchers that the
interviews were conducted in English which is the second language of all participants.
External validity refers to the degree to which findings can be generalized across social
settings (Bryman & Bell, 2011). According to Yin (2009) the concern of generalizability of case
studies has been around for a long time as single case studies tend to focus on a specific
phenomenon, for this case a single BU within large organization is the focal point. This tends to
limit the scope of the research and reducing the generalizability. For this research, the aim is not
to generalize the findings for an entire population, but rather conduct an in-depth analysis of the
case of ABB and identify how they can expand their customer base within Sweden using their

40
current products. This research could still be viable for similar organizations operating in similar
industry and facing problems in expanding their customer base, given that the organization finds
similarities between their situation and the situation presented here.
3.3.3. Ethics
When conducting a research, ethical considerations must be considered as it is important for the
researchers to realize what potential impact their study can have (Bryman & Bell, 2011). As this
research aims to identify how ABB can expand their customer base, three employees of ABB
were interviewed. It is essential that these participants, and ABB, are not harmed or deceived in
any way or form by the researchers and the publication of the research. Many steps were taken to
ensure that the research was conducted in an ethical manner. First off, the researchers signed a
non-disclosure agreement with ABB at the beginning of the research. Any sensitive information
collected by the researchers were presented to ABB and permission of its use issued by the
organization. Furthermore, respondents were offered anonymity which all of them accepted as
well as the chance to review the transcription of the conducted interviews and correct any
potential misunderstanding.
During the research work the researchers had access to ABB’s Business Centre in
Mölndal where they were provided with a desk and support from ABB personnel when needed.
It is of relevance to note that the researchers are aware of potential bias due to the fact that a lot
of time was spent with and around ABB employees.
3.3.4. Methodological limitations
There is always a risk of subjectivism in qualitative research approach, as the researchers must
gather data through interviews so their preferences could very well affect the outcome to some
extent. This also limits the replicability of the research even if certain steps were made by the
researcher to increase the replicability, such as describing the whole process to their best
abilities. A multiple-case study would enable the conclusions to be more easily generalizable and
offer different perspectives to the research while also enabling comparisons between the cases.
Quantitative approach would most likely not present the researcher with the opportunity to gain
deep enough understanding of the subject at hand and would thus not be appropriate in this case.
One limitation to the chosen methodology is language related as interviews were conducted in

41
English which is not the first language of any of the respondents, this can influence the responses
given by respondents.

42
4. Market Analysis
In this chapter, a market analysis is conducted of Oil & Gas and Chemical market in Sweden.
This is the market space in which ABB’s customers conduct their activities. The market analysis
will give the researchers a better idea of how the market looks like and which customers the BU
under focus is trying to retain and acquire.
4.1. World of Oil, Gas and Chemicals
This chapter will provide a brief introduction of the state of world’s oil, gas and chemicals.
Recent developments will be mentioned along with potential future development. The aim of this
chapter is to act as an introduction for the following chapters which is more focused on the
situation in Sweden and give the reader some idea regarding the direction and state of the global
market.
4.1.1. World Oil Market, Turbulence and Global Outlook
Oil accounts for over 30 percent of the world’s total energy supply and is an established
dominant source of energy worldwide with crude oil being the world’s most traded commodity.
The global oil market’s supply and demand is affected by many factor such as general economic
growth, production levels, storage levels, geopolitical and security factors in addition to weather
effects which can affect the production. Many uncertainties surround the oil market but despite
that, prices have remained relatively stable until the sharp decline which began during the
summer of 2014 (Swedish Energy Agency, 2015).

43
Figure 5 – Daily brent crude oil prices (Quandl, 2017)
The world market for oil has hit a significant turbulence in recent years. Oil prices
plummeted in the period between summer of 2014 and beginning of the year 2016 where the
price had dropped down to about 30$ per barrel. Prices hadn’t been that low since late 2003
establishing this time period as a historic downturn.
This downturn was caused by many factors that included, but not limited to, the OPEC’s
strategy led by Saudi Arabia to protect market share rather than keeping a balance between
supply and consumption causing growing inventory levels of crude oil and refined products
worldwide, the US tight oil revolution, lifting of sanctions on Iran, and slower than expected
world oil demand growth due to a worldwide economic downturn (Deloitte, 2016a). The fact that
US production of oil has increased, by around a factor of two compared to 2009 is also a notable
event affecting global prices (MarketLine, 2016).
Global consumption of petroleum and other liquid fuels has been increasing and the
growth in 2016 was driven by non-member countries of the Organization for Economic Co-
operation and Development (OECD). The main reason for continued consumption growth is
according to U.S. Energy Information Administration (EIA) and the World Bank, where a rise in
non-OECD consumption with both China and India being large factors in this predicted

44
continued growth (U.S. Energy Information Administration, 2017; World Bank, 2017). China’s
consumption growth is driven by increased use of jet fuel, gasoline, and Hydrocarbon Gas
Liquids (HGL), while India’s growth is due to increased use of transportation fuels and of
naphtha and ethane (U.S. Energy Information Administration, 2017).
EIA projects an increase in both production and consumption of crude oil through 2018
with consumption expected to increase at a faster rate than production which results in tightening
global balance. There was a production increase in the fourth quarter of 2016 which was likely
related to the then upcoming agreement on production cuts. On November 30th 2016, the
member states of the Petroleum Exporting Countries (OPEC) agreed to reduce oil production in
the first half of 2017. In the following month of December, additional 11 non-OPEC countries
also agreed to reduce production over the same time period. This agreement is a joint effort
toward rebalancing the oil market as inventory has been building up in recent years due to
overproduction. EIA still expects production to increase in countries not covered by this
agreement most notably Libya and Nigeria. Global inventory builds are still expected to continue
in 2017 and 2018 but at a slower rate than in 2016. The current excess global oil supply and
inventory is expected to limit significant upward oil price pressures in 2017 while some upward
price pressures are expected to emerge in 2018 as by mid-2018 global crude oil balances are
expected to tighten (U.S. Energy Information Administration, 2017).
This forecast by EIA is vulnerable to changes in the global economics and geopolitical
events as these factors have the potential to put either stronger or weaker upward or downward
pressure on oil prices than anticipated in this forecast. Additionally, the effectiveness and
duration of the currently agreed upon production cuts by both the OPEC-members and non-
OPEC members could influence prices in either direction (U.S. Energy Information
Administration, 2017). There is also uncertainty regarding potentially continuing efficiency gains
and cost reductions achieved by non-OPEC producers as well as new and upcoming projects
coming online despite the global crude glut in recent years. These projects were commissioned
when the oil was $100+/bbl and were too far along to be stopped. These projects and potential
continued efficiency gains could result in additional supply which in turn could put downward
pressure on prices (Deloitte, 2016a).
Deloitte reports that OPEC, apart from Iran, is expected to continue to produce at current
levels for the next five years. Iran is then expected to be back at pre-sanction production levels

45
by the end of 2017. In recent years, major cutbacks in new projects occurred. The sheer number
of deferred projects and the required time to develop new ones is expected to eventually lead to
some shortfall in future production (Deloitte, 2016a).
Figure 6 – Crude oil price forecast (Deloitte, 2016b)
4.1.2. World Gas Market, Developments and Expectations
Natural gas accounts for just over 20% of the primary global energy consumption. Its role within
the global energy mix has gotten bigger in recent times, to a great extent due to a rapid
development of shale gas production in the USA (Swedish Energy Agency, 2015).
Worldwide consumption of gas grew by +1.7% in 2015, which is a significant increase
compared to 2014 but remained below the 10-year average of 2.3%. Middle East recorded the
strongest regional growth, while Europe and Eurasian consumption declined by 0.3%. When
looking at gas market, the report will mainly be focusing on natural gas (DRY and LIQUID).
According to EIA, dry natural gas production fell 1.8% in 2016 compared to 2015. But for 2017
and 2018 it is predicted to increase (U.S. Energy Information Administration, 2017).
Natural gas grows faster than both oil and coal and growth is projected to be 1.6% p.a.
between 2015 and 2035. The increase in conventional gas production is mainly led by Middle
East, Russia and Australia. Largest sectors contributing to growth is the industrial sector
(combusted and non-combusted use), followed by the power sector. Whilst dependence of import

46
for Europe and China grows, the increased diversity of supplies associated with rapid expansion
of LNG helps to support gas consumption. In Europe, domestic production will decline sharply (-
3.2% p.a.) as existing fields mature and are not replaced. Because of this, share of imported gas
consumption is expected to rise from 50% in 2015 to nearly 80% by 2035 (BP, 2017).
Future market for gas will be shaped by global economic developments, global gas
demographic trends, oil market developments and implementation of national and international
energy and environmental policies. By 2040, worldwide consumption is projected to increase to
203 trillion cubic feet (TCF) (GEFC secretariat, 2017).
During 2014, natural gas accounted for 25% of the energy used worldwide and LNG
accounted for 10% of global natural gas consumption. During 2005 to 2014, LNG trade
increased by an average of 6%/year. There has been a strong growth in overall global LNG trade
over the past ten years that was accompanied by an even stronger growth in LNG trade on spot
and short-term markets. World trade of LNG is projected to double by 2040 to almost 29 TCF.
Most of this increase in liquefaction capacity will occur in Australia and North America, where
new projects are planned or under construction and many of which will be operational in the
coming decade (US Energy information administration, 2017).
World production of natural gas supplies will increase due to projected growth by 2040. Much of
the increase in supply is projected to come from non-OECD countries that account for 73% of
the total increase in world natural gas production for 2040.
Trade of natural gas globally is undergoing a rapid transformation. During 2000 to 2012,
trade of global LNG more than doubled and is projected to grow when new liquefaction comes
online. World LNG flows adjusted rapidly during 2011 and 2012 to accommodate a surge in
Japans demand for LNG due to the Fukushima disaster. But in the future, as nuclear capacity is
restored in Japan, LNG market worldwide is expected to loosen due to growing supply and
weakening demand (Atradiuscollections.com, 2017).
The global trade of gas is way less intergraded and more regional focused than oil trade.
The supply situation varies depending on different development levels of the infrastructure in
different regions. Historically, trade between regional markets has not occurred to great extent
which in turn isolates various markets. While the majority of natural gas supplied to Asia is LNG
arriving via cargo ships a large proportion of natural gas supply in Europe comes from Russia via

47
pipelines. Due to this regional focus, there are considerable price differences between markets
(Swedish Energy Agency, 2015).
Figure 7 - Natural Gas Prices (World Bank, 2017).
Gas prices are traditionally separated into three markets: North American, Asian and European,
where each have their own characteristics. In North America, prices for gas is determined at hubs
due to supply and demand dynamics. In Asia, long-term contracts dominate the gas market that
are often linked to oil price. In Continental Europe, trade of gas is used similarly to focus mainly
on long-term oil-indexed contracts in the past, but more and more moving to arrangements that
allow prices to be set by gas-to-gas competition that accounts for around half of gas trade in
Europe today (Swedish Energy Agency, 2015).
During 2014-2015, the price declined significantly and the price seems to have reached a
turning point in all three regional markets, with a slight increase during 2016. However, prices in
Europe and Japan were still lower in December 2016 compared to beginning of 2017. This is due
to abundant supply of liquefied natural gas, slowing demand growth, low oil prices and
availability of shale gas in North America (Atradiuscollections.com, 2017).

48
4.1.3. World Chemical Market, Current State and Outlook
The chemical sector produces various products and supplies to almost all sectors in the economy.
Chemicals are essential components of power-generation and storage systems, from nuclear to
wind power and fuel cells. Chemicals, power and construct transport infrastructure and help
increase fuel efficiency in transport and heating. Chemicals provide essential functionalities in
food production (e.g crop protection), packaging and conservation. Chemicals also show
usefulness in security applications, medical treatment and diagnostics technologies, hygiene and
cosmetics ad they are an essential part of modern textiles, dyes in print and painting, computers,
mobile phones and communication devices. It also plays a vital role in leisure and sporting goods
and fashion.
Previous decade has witnessed a dramatic progress in chemical knowledge. The changing
world presents new opportunities and threats for chemical industry and the firms operating in it.
The most significant trends are globalisation, progress in telecommunication and data transfer,
limited resources (soil, energy and water) and worldwide population growth with aging societies
(Suschem, 2004).
World chemicals turnover was valued at 3,534 billion euros in 2015. Global sales grew
by 14,0 per cent. This was largely driven by emerging economies, most notably China. Growth
in basic chemicals that makes up two-thirds of the industry also benefited due to the uplift in oil
and gas prices. The EU chemical industry ranks second, only behind the US market. Various
firms in the chemical industry faced a difficult operating environment during 2015 due to
contracting or slow growing end-markets and geographies. Decrease in commodity prices in
agriculture, metals and energy put demand pressure on chemical firms to these markets (Ey.com,
2016).
Future growth will be driven by developing markets. Global chemical firms have been
trying to tap into this booming sector, but most have found themselves to lose in a head to head
rivalry with the local players for both supply and demand reason. To succeed, firms in the
chemical industry need to innovate effectively and must understand the cost and product
preferences of the entire downstream value chain and not only immediate customers. By 2020,
an estimated 50 billion devices around the globe will be connected to the internet. Two thirds
will be sensors, actuators and newly invented intelligent devices that monitor, control, analyse
and optimize the world. With the arrival of internet of things, there is a transformational shift in

49
the industry. Firms in the chemical industry have invested billions in automation and information
technologies and these investments have increased reliability, reduced costs and created greater
operational efficiencies in production and supply chain management (Ey.com, 2016).
4.2. The Swedish Market
The chapter will present analysis of the Swedish Oil & Gas and Chemical market. The chapter is
split into five sub-chapters, covering; the oil market, the gas market; the chemical market, the
government’s aim and goals, and the segmentation and value chain.
4.2.1. Oil Market
4.2.1.1. Oil Supply Infrastructure
There are three companies that make up the refining industry in Sweden. Preem operates the two
largest refineries out of Gothenburg and Lysekil while St1 operates the third largest refinery
which was formerly operated by Shell until its acquisition at the end of 2010. Furthermore,
Nynäs Refining operates two small refineries which are specialized in bitumen and lubricants
(International Energy Agency, 2014).
Sweden’s five refineries possess a combined refining capacity of roughly 435 kb/d
(kilobarrel per day). The refining industry is very concentrated on the west coast of Sweden as
three refineries are located in Gothenburg (Preem, St1 and Nynäs Refining) and account together
for about 45% of the country’s total refining capacity. Preem’s other refinery is in Lysekil, which
is just north of Gothenburg, is the largest refinery in the country accounting for almost half of the
total capacity. The fifth refinery operated by Nynäs is located south of Stockholm, at Nyanshamn
(International Energy Agency, 2014).
There are three main ports in Sweden for crude oil import and refinery feedstocks
necessary to sufficiently supply the country’s refineries. The individual capacity per port
commensurate with the capacities of the refineries they serve with the total port capacity of
roughly 450 kb/d (International Energy Agency, 2014).
Import flows of refined products is directed primarily through six main ports with three
of them located in the Stockholm area which could be explained by both the high population in
that area and the fact that the refineries in Sweden are clustered at the west coast. The total
combined import capacity of these six ports is over 190 kb/d of refined products. Due to

50
Sweden’s relatively small market size and sparse population, the oil distribution infrastructure is
focused on road distribution rather than pipelines with around 800 road tankers carrying out
secondary distribution to consumers and retail outlets (International Energy Agency, 2014).
Approximately 30 coastal and inland storage facilities are located in Sweden with a combined
total oil storage capacity of 15.2 mcm (million cubic meters), or nearly 96 mb (million barrels).
Major depots are obviously located in Gothenburg and Lysekil due to the refining activities
conducted there, other major depots are in Gävle, Stockholm, Norrköping and Malmö. The
combined storage capacity at these six locations is nearly 65 mb (10.3 mcm). The remaining
storage capacity (31mb) is spread over 22 storage sites all over the country. Storage facilities
play an essential role in domestic distribution from both import terminals and refineries in
Sweden (International Energy Agency, 2014).

51
Figure 8 – Sweden’s oil supply infrastructure (International Energy Agency, 2014)

52
4.2.1.2. Import dependency and net export of refined products
Sweden does not produce any crude oil of its own and is thus completely dependent on imports
and the year 2016 saw Sweden import just over 19 million tons of crude oil. In 2016 imported
crude oil from Russia accounted for 41,77% of all crude oil import in Sweden while 37,48%
came from the North Sea (4,1% Denmark, 10,22% UK, and 23,17% Norway). The imported
volume of crude oil from the North Sea and Russia accounted for just under 80% of all crude oil
imports to Sweden for the year 2016 (Statistikdatabasen, 2017b). The fact that such a big portion
of the crude oil import comes from the North Sea and Russia is a natural consequence of
Sweden’s geographical position. Russia’s has been increasing their crude oil exports across the
Baltic Sea in the past decade while crude oil production in the North Sea declined in the same
period (Swedish Energy Agency, 2015).
Figure 9 – Crude oil import (Statistikdatabasen, 2017b).
The volume of imported crude oil has been relatively stable over the past 20 years. The import of
crude oil will most likely remain stable in the near future as it is heavily dependent of the
refineries in Sweden as they want to produce at maximum capacity. Sweden possesses a
relatively large refinery industry and the fact that it has the capacity to produce larger volume of

53
transport fuels and other refined oil products than consumed within the country makes Sweden a
net exporter of refined oil products. This underline’s how the crude oil import volume is
dependent on the refineries rather than domestic consumption. Despite this fact some of the
transport fuel consumed in Sweden is originated abroad and imported to Sweden. This is due to
the fact that some distributors of transport fuel do not have their own refinery capacity and are
thus forced to import from other suppliers (Swedish Energy Agency, 2015).
Figure 10 – Import and export of refined petroleum products (Statistikdatabasen, 2017b).
Figure 10 shows the development regarding import and export of refined petroleum
products in Sweden for the past 20 years. The left axis indicated the volume of imported and
exported products while the right axis represents the net export of refined products. Both import
and export have been increasing and show a general positive trend with the export increasing at
higher pace than import. This results in increasing net export demonstrated by the green line
using the right axis as a measure.

54
Transport fuel production in Sweden is concentrated to the west coast which makes it
desirable to import from Finland as it may carry lower transportation costs on the Swedish east
coast (Swedish Energy Agency, 2015). When looking at data from Statistics Sweden we see that
imports of refined petroleum products from Finland accounts for just under 25% for the time
period 1995-2016. However, for the past two years Denmark has overtaken Finland in imported
volume. Other notable origins of imported refined products are Russia, UK, Netherlands and
Germany (Statistikdatabasen, 2017b).
On the export side the UK is the most common destination for refined petroleum products
from Sweden as in 2016 18% of the total export headed to the UK. Other notable destinations
were Norway, Netherlands, Germany, Finland and Denmark. Export to these countries accounted
for just under 60% of the total export volume of refined petroleum products from Sweden
(Statistikdatabasen, 2017b).
4.2.2. Gas Market
4.2.2.1. Import Dependency, consumption and company operations
Natural gas plays a minor role in Sweden. In the Swedish market segment, crude oil accounts for
97% while natural gas accounts for just about 3% of the segment. Roughly 80% of the total gas
use is consumed by 30 large consumers. This includes 9 cogeneration plants (CHP and district
heating) that accounts for 55% of all gas use in Sweden. 2% of the gas use is directly from
households in Sweden. Although natural gas is used by both industrial consumers and household
consumers the focus of this report is more on the industrial consumers as majority of
consumption is performed by the industry by, for example, production of various products in the
petrochemical industry on the west coast of Sweden and for district heating (Energimarknads
inspektionen, 2016).
There is no indigenous production of gas in Sweden making the country completely
dependent on imports. The entire consumed volume of natural gas must be imported from or
through Denmark via the Dragör pipeline. Sweden is not directly linked to continental Europe
but via Denmark, which is linked with the European gas transmission. Sweden does have bio gas
production as during 2009, 135 mcm was produced, mainly coming from sewage plants in
Stockholm area (Energimarknads inspektionen, 2016).
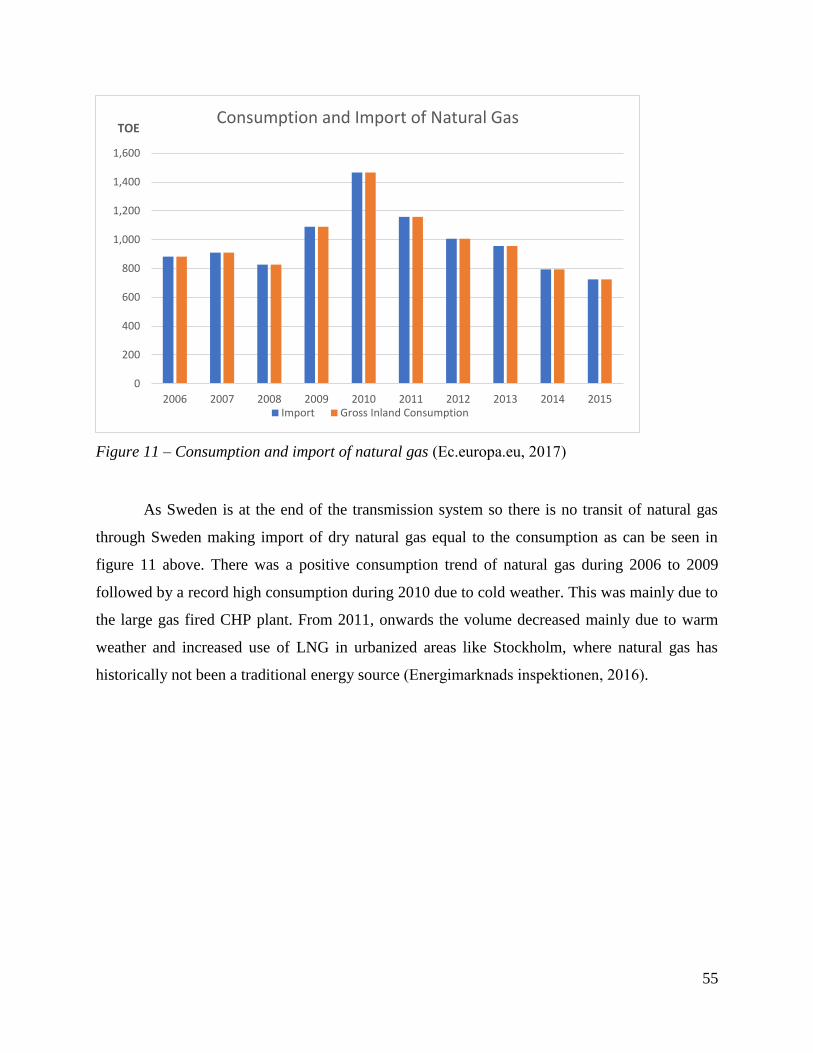
55
Figure 11 – Consumption and import of natural gas (Ec.europa.eu, 2017)
As Sweden is at the end of the transmission system so there is no transit of natural gas
through Sweden making import of dry natural gas equal to the consumption as can be seen in
figure 11 above. There was a positive consumption trend of natural gas during 2006 to 2009
followed by a record high consumption during 2010 due to cold weather. This was mainly due to
the large gas fired CHP plant. From 2011, onwards the volume decreased mainly due to warm
weather and increased use of LNG in urbanized areas like Stockholm, where natural gas has
historically not been a traditional energy source (Energimarknads inspektionen, 2016).
0
200
400
600
800
1,000
1,200
1,400
1,600
2006 2007 2008 2009 2010 2011 2012 2013 2014 2015
TOEConsumption and Import of Natural Gas
Import Gross Inland Consumption

56
Figure 12 – Origin of imported natural gas (Statistikdatabasen, 2017b).
Looking at the origin of the imported gas in Sweden we can see that as expected the vast
majority comes from Denmark. The other notable origins are Germany and Norway. Norway is
the biggest source of imported LNG in Sweden and the imported volume presented in figure 12
is almost only LNG as import of dry natural gas is very dependent on the Dragör pipeline from
Denmark as mentioned before (Statistikdatabasen, 2017b). Import of dry natural gas from
Germany is also feasible as the Danish gas transmission grid is connected to the German grid at
Ellund right by the Danish-German border (International Energy Agency, 2014).
There are currently two firms operating in the wholesale market of natural gas in Sweden,
E.On Gashandel Sverige and Dong Energy AB. The retail market is more competitive with four
active suppliers where E.On Gashandel Sverige AB, Dong Energy AB and Goteborgs Energi
hold approximately 90% market share between them (Energimarknads inspektionen, 2016).
4.2.2.2. Gas Supply Infrastructure
As mentioned before all the consumed volume of natural gas is imported via the Dragör pipeline
which is where the Swedish transmission system for natural gas begins. The whole network
consists of 26,000 km of distribution lines and approximately 620 km of transmission lines. The
0%
10%
20%
30%
40%
50%
60%
70%
80%
90%
100%1
99
5
19
96
19
97
19
98
19
99
20
00
20
01
20
02
20
03
20
04
20
05
20
06
20
07
20
08
20
09
20
10
20
11
20
12
20
13
20
14
20
15
20
16
Origin of Imported Natural Gas
Denmark Germany Norway Other

57
main pipeline is called trunk pipeline. From the trunk, many branches lead off to various
consumption areas. Metering and control (MC) stations are connected to branched lines in 39
different locations, these stations are responsible for metering the gas and reduce pressure. Local
distribution systems are then connected to each of these MC stations in order to distribute the
product to the end customers. Nyashamn terminal, south of Stockholm, receives liquefied natural
gas (LNG), it has been in operation since 2011 but is not connected to the gas transmission
system in southwest Sweden. The terminal has the capacity to supply 6 mcm/d (International
Energy Agency, 2014).
Figure 13 – Sweden’s gas supply infrastructure (International Energy Agency, 2014)
Construction and enlargement of the natural gas infrastructure in Sweden must be done
on commercial basis. The Swedish government does not finance or own any part of the Swedish
gas transmission grid or the Swedish gas distribution networks. Permission to build gas
transmission pipelines (high-pressure), storages or LNG facilities are solely awarded by the

58
Swedish government and applicants for such a permit have among other things to show a
satisfying business plan to obtain the permit (Energimarknads inspektionen, 2016).
There is only one storage facility in Sweden which is used for meeting peak demand. It is
located at Skallen and possesses a total working capacity of 9 mcm (International Energy
Agency, 2016) and a withdrawal capacity of 0.6 to mcm/d corresponding to about 10% to 20%
of the gas demand in Sweden under winter conditions. This variation depends on the pressure in
the storage facility and the trunk pipeline. There is currently no storage in Sweden to provide for
seasonal swings in natural gas demand so there is a dependence on the assistance of storage
facilities at Stenlille, Denmark in that regard (International Energy Agency, 2014). Since Sweden
is vulnerable to gas supply disruption, one possible route for diversification was investigated
through the Skanled pipeline running from Norway. However, there are no current plans to
implement this pipeline. Currently, Sweden is exempt from N-1 obligation which is set out by
Regulation 994/2010 that measures to safeguard gas supply security. During 2012,
Energimarknadsinspektionen (Ei) published a National Preventative Action Plan and a National
Emergency Plan. The plan includes market based methods to minimize the possible negative
effects on numerous scales and divides responsibility for meeting demand for natural gas
(European Commission, 2014, Energymarknadsinspektionen, 2013).
4.2.3. Chemicals
4.2.3.1. Swedish chemical market
Chemicals market in Sweden has fluctuated between decline and sluggish growth in recent years
(2014). During 2012, revenues in chemical market was $17.2 billion. In 2014, the performance
of the market was forecasted to decline further but with a slower pace, with an expected market
value of $15.6bn by end of 2017. In Sweden, the commodity chemicals are the largest segment
of chemical market that accounts for 44,3 % of the market's total value (Statistikdatabasen,
2017c).
European firms in the chemical industry have been facing low sales growth in the past
few years due to high cost of production that is leading to shift in manufacturing base to
emerging countries and decelerating capacity addition in chemicals. Number of chemical players
have been shutting down operations due to high cost of manufacturing owing to high feedstocks
and labour costs. Despite all this Europe offers strong and stable business environments as the

59
region provides powerful infrastructure and highly efficient public institutions that facilitate
legally stable environment for business operations (Ey.com, 2016).
The chemical industry in Sweden is mainly located in and around three metropolitan
areas, Stockholm/Uppsala, Goteborg and Malmo/Lund. But there is also small cluster of
companies in cities in northern Sweden like Sundsvall. The companies around Stockholm and
Uppsala is heavily populated with production and development of pharmaceutical products,
reagents, etc. This is because the area is an important hub for Pharmaceutical and Life Science
industry.
In Vastra Goteland and around Goteborg, the majority of companies have their main
activities within the production and development of basic chemicals and Refinery. However,
Development and Production of Pharmaceuticals products and reagents etc. is also significant. In
Stenungsund, the region has the largest cluster of chemical companies in Sweden producing
mainly plastic and basic chemicals. The largest RME-plant is also located here which is owned
and run by Perstorp group.
The third cluster region, Malmö/Lund has companies that produce and develop chemicals
in Pharmaceutical products, reagents, etc. and Basic chemicals, but with a slight emphasis on
development of chemicals products. In this region, Lund University is a strong public actor
related to the chemical industry with strong competencies in agriculture biotechnology and bio
refinery process development (VINNOVA, 2016).
Figure 14 – Import and export of chemicals and chemical products (Statistikdatabasen, 2017a)
0
10000000
20000000
30000000
40000000
50000000
60000000
70000000
80000000
90000000
100000000
2010 2011 2012 2013 2014 2015 2016
Import vs Export of Chemicals and Chemical products in SEK
Import Export

60
Sweden is a net importer of chemical products when using value as an indicator. We can still see
that the gap between import and export is shrinking indicating that some advancements have
been made in the Swedish chemical industry.
4.2.3.2. Chemical products and substances used
The majority of raw materials utilized in the chemical market are derived from oil and natural
gas. The main suppliers of these raw materials are large-scale, multi-national oil and gas
companies, of which there are relatively small number supplying many different industries. For
other chemicals, minerals and sea water are among the most important inputs. An example is
sodium chloride can be formed when evaporating sea water or by obtaining from halite mines.
This is then used in the production of sodium carbonate, sodium hydroxide, and chlorine etc. for
base chemicals, sulfur is the main ingredient for making sulfuric acid and can also be obtained
by mining. So, supply of raw materials can depend on either oil and gas companies or mining
companies (MarketLine, 2014).
Table 1 – Most used chemical substances (Www3.kemi.se, 2013)
Chemical substance Number of products
Water 30,995
Titanium dioxide 5,926
Xylene 5,754
1,2-Benzoisothiazol-3-one 4,519
Isopropanol 4,223
2-Methyl-3(2H)-isothiazolone 3,862
Butylacetate 3,390
5-Chloro-2-methyl-3(2H)-isothiazolone
mixture with 2-methyl-3(2H)-isothiazolone 3,380
Carbon black 3 333
Medium aromatic solvent naphtha 3 280
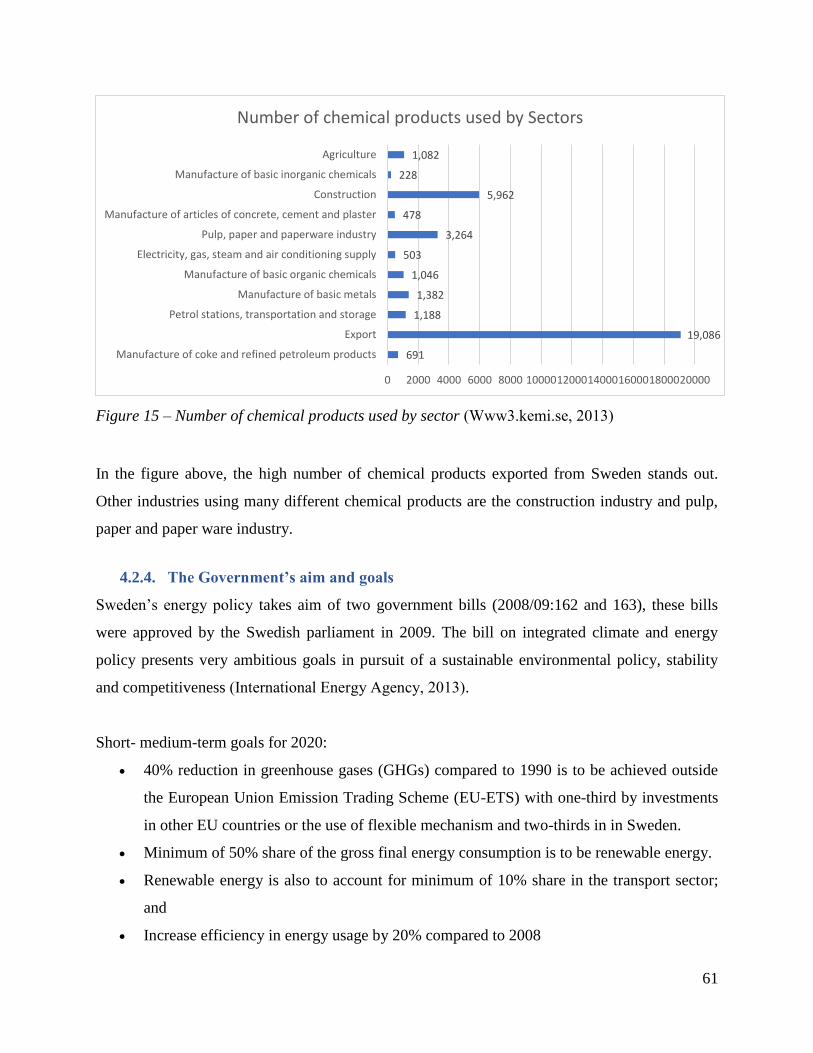
61
Figure 15 – Number of chemical products used by sector (Www3.kemi.se, 2013)
In the figure above, the high number of chemical products exported from Sweden stands out.
Other industries using many different chemical products are the construction industry and pulp,
paper and paper ware industry.
4.2.4. The Government’s aim and goals
Sweden’s energy policy takes aim of two government bills (2008/09:162 and 163), these bills
were approved by the Swedish parliament in 2009. The bill on integrated climate and energy
policy presents very ambitious goals in pursuit of a sustainable environmental policy, stability
and competitiveness (International Energy Agency, 2013).
Short- medium-term goals for 2020:
• 40% reduction in greenhouse gases (GHGs) compared to 1990 is to be achieved outside
the European Union Emission Trading Scheme (EU-ETS) with one-third by investments
in other EU countries or the use of flexible mechanism and two-thirds in in Sweden.
• Minimum of 50% share of the gross final energy consumption is to be renewable energy.
• Renewable energy is also to account for minimum of 10% share in the transport sector;
and
• Increase efficiency in energy usage by 20% compared to 2008
691
19,086
1,188
1,382
1,046
503
3,264
478
5,962
228
1,082
0 2000 4000 6000 8000 100001200014000160001800020000
Manufacture of coke and refined petroleum products
Export
Petrol stations, transportation and storage
Manufacture of basic metals
Manufacture of basic organic chemicals
Electricity, gas, steam and air conditioning supply
Pulp, paper and paperware industry
Manufacture of articles of concrete, cement and plaster
Construction
Manufacture of basic inorganic chemicals
Agriculture
Number of chemical products used by Sectors

62
Priorities for the long-term:
• Sweden aims to phase out fossil fuels in heating by 2020.
• Sweden’s vehicle stock is independent of fossil fuels by 2030.
• Commitment toward the development of a third pillar in electricity supply, next to hydro
and nuclear power. The aim is to reduce vulnerability and increase security of electricity
supply through wind and other renewable power production.
• The vision for 2050 is that Sweden will possess a sustainable and resource-efficient
energy supply with zero net emissions of GHGs.
In figure 16 below we can see the development of fossil fuel usage (oil, coal and natural
gas/town gas) in different sectors within Sweden in relation to total energy use.
Figure 16 – Use of fossil fuel in different sectors (Energimyndigheten, 2016)
We can see that usage of fossil fuels has been demonstrating a negative trend in every sector
presented in the image above. The most notable difference can be observed for usage for district
heating a change from 71% in 1983 to 9% in 2014. The transport sector has always been
dominated by fossil fuel usage and the decline there is not as steep as for the other sectors and
starts later. Fossil fuel usage in the transport sector is still down to 84% from 97% in 1983.

63
Technological and infrastructural blockages have caused a lack of alternatives from the
traditional fossil fuel engine cars available for the public and in many cases a sufficient
infrastructure is lacking for alternative fuel cars.
It is hard to predict if the government’s aim and goals will be successful at this point in
time and from this limited data. We can still see that the general trend regarding fossil fuel usage
is negative and has been for a long time. We see no reason for that to change in the near future
and it is possible that the government incentives are affecting and will continue to negatively
affect the consumption of fossil fuel in Sweden and reduce GHGs emissions.
Weather the government’s efforts are bearing fruit or not it seems obvious that
environmental awareness among the public is increasing. If we look for example at the
automotive industry which is faced with tough challenges in the near future due to increasing
environmental concerns among the public as a KPMG’s (2014) study revealed how 92% of
consumers consider fuel efficient vehicles while 73% look to eco-friendly products. More
interestingly a staggering 47% of consumers wanted an alternative fuel automobile. The industry
has been hugely affected by dark predictions regarding man made global warming as the industry
is in the eyes of the public somewhat of an embodiment of the global warming crisis. These
percentages have been increasing and are expected to continue to increase.
Increased levels of environmental awareness are pushing organizations toward more
environmentally friendly solutions which is likely to become the main reason for a changing
landscape of the fossil fuel market in the future as in the end it is the consumer that drives the
supply.
It is still worth pointing out that it is unlikely that imported volume of crude oil and
refined petroleum product volume in Sweden will change drastically despite lower national
consumption due to the fact that Sweden is a net exporter of refined products.
Government Strategy regarding Chemicals
In 2014, Riksdag which is the national legislature and supreme decision making body in Sweden,
adopted a strategy for how to achieve “A non-toxic Environment” which is an environmental
quality objective based on the bill 2013/14:39 ‘Towards a toxin-free everyday environment – a
platform for chemicals policy’. This is an important part of the strategy to achieve the

64
environmental quality objective, where the focus is on measures to protect children’s and young
people’s health (Regeringskansliet, 2015).
4.2.5. Segmentation and Value Chain
The petroleum industry spans all the way from finding and producing crude oil and natural gas
down to the end consumer of the finalized product. The industry is generally divided into three
segments: upstream, midstream and downstream. Sometimes known as the exploration and
production sector (E&P) the upstream industry includes activities such as searching for potential
underground or underwater natural gas fields or crude oil, drilling and operating the wells in
order to bring the natural gas or the crude oil to the surface (Psac.ca, n.d.).
Processing, storing, wholesale marketing and transportation of commodities such as
crude oil, natural gas liquid natural gas (LNG) is a part of the midstream activities.
Transportation of these commodities is conducted in various forms, for example: via pipeline,
rail, barge, tanker and truck. A vital link between the petroleum producing areas, which are often
remote and the population is provided by the midstream activities (Psac.ca, n.d.).
Downstream activities include petrochemical plants, oil refineries, petroleum products
distributors, natural gas distribution companies and retail outlets. Wherever consumers are
located this industry in involved and reaches the consumers by provides thousands of products
such as diesel, gasoline, heating oil, jet fuel, fertilizers, plastics, natural gas and propane to name
a few (Psac.ca, n.d.).
It is important to realize and have a clear view regarding the segmentation of the industry
as different players operating within different segments are not affected in the same way
regarding market developments within the petroleum industry. Following figure explains the
crude oil value chain.

65
Figure 17 – Crude oil value chain (moga.saoga.org.za, n.d.).
In Sweden, the chemicals sector falls under the downstream section of the crude oil value chain.
Raw materials are obtained during refining process for production of base chemicals, paints and
varnishes and other petro-chemical products. Nynas AB, manufacturer of petrochemicals has
refineries in Gothenburg and near Stockholm that differentiates it from other oil refineries as it
concentrates on manufacturing bitumen, Napthenic Speciality Products and other petro
chemicals.

66
Figure 18 – Natural gas value chain (moga.saoga.org.za, n.d.).
4.3. Companies Operating in the Swedish Market
Here the main companies operating within the Swedish market are introduced briefly. For this
research, the companies selected are based on KPI’s that measure their turnover, income and
profitability. Few companies have been excluded as they do not operate in Sweden even though
the companies are Swedish with headquarters located in Sweden and other companies that might
not require the product as they do not have production facilities in Sweden. This is due to the
fact that the product serves for production, storage and transport of OGC.
4.3.1. Preem
Overview
Preem refines and sells gasoline, diesel, heating oils and renewable fuels both to companies and
consumers in Sweden. Preem is the largest fuel company in Sweden providing a nationwide
service network to both private and commercial traffic. Their two refineries in Gothenburg and

67
Lysekil are among Europe's most environmentally friendly and modern refining facilities. With a
refining capacity of more than 18 million metric tons of crude oil, Preem accounts for a
staggering 80% of the Swedish refinery capacity and 30% of the Nordic refinery capacity. The
fact that just over two-thirds (69%) of this production is exported makes Preem the third largest
export company in Sweden. About 95% of Preem's exported volume in 2015 went to other
European countries (Preem, 2016).
The Refinery business segment manufactures end products for consumers from the
materials provided by Supply and Trading segment. Daily production optimization enables
production to be adapted based on changes in the margins between sale prices and raw material
prices (Preem, 2016).
Preem AB at a glance
Table 2 – Preem financials (Orbis, 2016)
Year 2010 2011 2012 2013 2014 2015
Turnover (th USD) 11,568,703 13,351,772 16,225,075 12,424,734 10,959,336 7,860,866
Net Income (th USD) 198,957 26,859 324,852 -223,544 -381,304 101,412
Profit Margin % 2.35 0.28 2.47 -1.97 1.67 0.86

68
Figure 19 - Preem financials (Orbis, 2016)
4.3.2. Lundin Petroleum AB
Overview
Lundin petroleum is an independent oil and gas exploration and production firm, whose main
focus is on operations in Norway, with a portfolio of assets in Norway, Malaysia, France, the
Netherlands and Russia. It was founded in May 2001 and is headquartered in Stockholm,
Sweden. Lundin explores, develops and produces oil and gas, and develops other energy
resources. It maintains a portfolio of oil and gas production assets and development projects in
various countries with exposure to exploration opportunities. The company has existing and
probable reserves of 743.5 million barrels of oil equivalent (MMboe) and net production of
72,600 barrels of oil equivalent per day (boepd) during 2016 (Lundin Petroleum, 2017).
Lundin has around 61 licenses with activities spread between exploration, appraisal,
development and production in Norway, the Barents Sea and the areas of Jan Mayen, and holds
around 12 exploration licenses in Malaysia. Its first major acquisition was during 2002, when it
acquired Coparex International from BNP Paribas, adding exploration and production assets in
198957 26859 324852
-223544
-381304101412
2.35
0.28
2.47
-1.97
1.67
0.86
-2.5
-2
-1.5
-1
-0.5
0
0.5
1
1.5
2
2.5
3
-2,000,000
0
2,000,000
4,000,000
6,000,000
8,000,000
10,000,000
12,000,000
14,000,000
16,000,000
18,000,000
2010 2011 2012 2013 2014 2015
Revenues & Profitability
Turnover (th USD) Net Income (th USD) Profit Margin %

69
France, Netherlands, Tunisia, Venezuela, Indonesia and Albania to existing portfolio
(Quotes.wsj.com, 2017). By acquiring this, Lundin changed from a pure exploration firm to a
key E&P player with production exceeding 16,000 boepd.
Lundin Petroleum’s activities are concentrated outside Sweden. Production, exploration
and development is concentrated in France, East Malaysia, Norway and Russia. Its subsidiaries
include: Lundin Energy AB, Lundin Norway AS, Lundin Petroleum SA, Lundin Russia BV,
Mintley Caspian Ltd, Lundin Petroleum BV, Lundin Netherlands BV, Lundin Holdings SA, and
Lundin Marine BV (Reuters, 2017).
Lundin Petroleum at a glance
Table 3 – Lundin financials (Orbis, 2016)
Year 2010 2011 2012 2013 2014 2015
Turnover ( th USD) 799,643 1,269,515 134,142 1,132,000 785,200 569,300
Net Income (th
USD) 511,875 160,137 108,161 77,600 (427,200) (861,700)
Profit Margin % 47.69 57.48 38.83 25.44 -87.25
Figure 20 - Lundin financials (Orbis, 2016)
47.6957.48
38.83
25.44
-87.25
-100
-80
-60
-40
-20
0
20
40
60
80
(1,000,000)
(500,000)
-
500,000
1,000,000
1,500,000
2010 2011 2012 2013 2014 2015
Revenues & Profitability
Turnover (th USD) Net Income (th USD) Profit Margin %

70
4.3.3. Tethys Oil AB
Tethys Oil is a Swedish energy company mainly focused on exploration and production of oil
and natural gas. The firms core area is in Oman, where it has one of the largest onshore oil and
gas license-holder with license interests in three onshore blocks. The firm also has licenses in
Lithuania and France. In Oman and France, the licenses are for commercial oil production
(Tethysoil.com, 2017).
Tethys at a glance
Table 4 – Tethys financials (Orbis, 2016)
Year 2011 2012 2013 2014 2015
Turnover ( th USD) 15,034 89,791 102,302 135,202 107,217
Net Income (th USD) 10,034 48,301 37,400 45,240 23,457
Profit Margin % 66.74 53.79 36.56 33.46 21.88
Figure 21- Tethys financials (Orbis, 2016)
15034
89791
102302
135202
107217
10034
48301
3740045240
23457
66.74
53.79
36.5633.46
21.88
0
10
20
30
40
50
60
70
80
0
20,000
40,000
60,000
80,000
100,000
120,000
140,000
160,000
2011 2012 2013 2014 2015
Revenues & Profitability
Turnover (th USD) Net Income (th USD) Profit Margin %
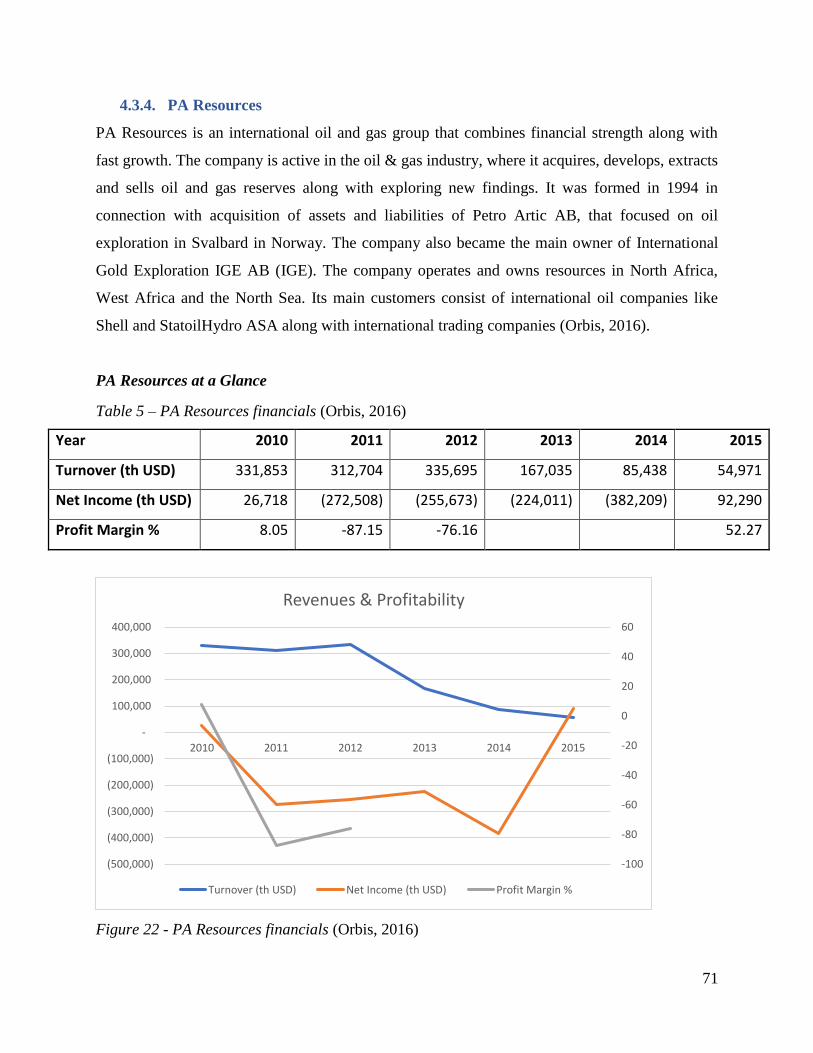
71
4.3.4. PA Resources
PA Resources is an international oil and gas group that combines financial strength along with
fast growth. The company is active in the oil & gas industry, where it acquires, develops, extracts
and sells oil and gas reserves along with exploring new findings. It was formed in 1994 in
connection with acquisition of assets and liabilities of Petro Artic AB, that focused on oil
exploration in Svalbard in Norway. The company also became the main owner of International
Gold Exploration IGE AB (IGE). The company operates and owns resources in North Africa,
West Africa and the North Sea. Its main customers consist of international oil companies like
Shell and StatoilHydro ASA along with international trading companies (Orbis, 2016).
PA Resources at a Glance
Table 5 – PA Resources financials (Orbis, 2016)
Year 2010 2011 2012 2013 2014 2015
Turnover (th USD) 331,853 312,704 335,695 167,035 85,438 54,971
Net Income (th USD) 26,718 (272,508) (255,673) (224,011) (382,209) 92,290
Profit Margin % 8.05 -87.15 -76.16 52.27
Figure 22 - PA Resources financials (Orbis, 2016)
-100
-80
-60
-40
-20
0
20
40
60
(500,000)
(400,000)
(300,000)
(200,000)
(100,000)
-
100,000
200,000
300,000
400,000
2010 2011 2012 2013 2014 2015
Revenues & Profitability
Turnover (th USD) Net Income (th USD) Profit Margin %

72
4.3.5. ST1 Group
St1 Group focuses on developing and refining liquid fuels. The refinery is located in
Gothenburg, on the west coast of Sweden. It has a modern, energy efficient oil refinery that was
purchased from Shell that operated previously. It employs around 200 industry experts, where
the refinery’s products include petrol, sulphur free MK-1 diesel and other distillates as well as
liquid gas. Most of the products are sold through St1’s own network in Sweden and Finland. The
plant in Gothenburg uses Etanolix, which is a technology developed by St1 and has been
integrated to the plant, where the product is advanced bioethanol for transport from local bakery
waste and process residues. Even though the refinery had to shut down for service, during 2015 it
produced an excellent utilisation rate and the firm constructed new distillation unit and launched
marine fuels during that year (St1 Group, 2017).
St1 at a glance
Table 6 – St1 financials (Orbis, 2016)
Year 2010 2011 2012 2013 2014 2015
Turnover (USD) 90,777,198 81,533,895 87,493,121 87,971,142 76,908,588 59,419,604
Net Income (USD) (1,148,733) 4,791 1,993,389 2,265,949 577,256 440,480
Profit Margin % -1.73 0.03 3.12 3.01 1.02 0.99

73
Figure 23 - St1 financials (Orbis, 2016)
4.3.6. Borealis
Borealis is a leading supplier of innovative solutions of base chemicals, manure and polyolefins.
The firm employs unique technologies like Borstar and BorrelTM with 50 years of experience in
pololefin. The company provides support for the infrastructure (pipe systems and power and
communications cables), automotive and advancing packaging sectors. Along with this, Borealis
also offers a wide range of base chemicals from melamine and manure to phenol and acetone.
Its facility in Stenungsund includes a cracker and three polyethylene plant along with centre for
research and development. In Sweden, it is the only polyethylene manufacturer and its facility is
located 50 KM north of Gothenburg. The cracker plant is one of Europe’s most flexible where
four raw materials can be used during the cracking process (naphtha, ethane, propane and
butane). The cracker plants capacity is 620,000 tons per year and the capacity of its polyethylene
plant is 750,000 tonnes per year. The raw materials for the cracking process is delivered to
Borealis by boats to Stenungsund harbour.
During spring of 2010, the company made an invest for its new high-pressure LDPE
production plant in Stenungsund, which costed SEK 4 billion and allows the company to support
-2
-1
0
1
2
3
4
(20,000,000)
-
20,000,000
40,000,000
60,000,000
80,000,000
100,000,000
2010 2011 2012 2013 2014 2015
Profitability & Revenues
Turnover (USD) Net Income (USD) Profit Margin %

74
and provide for infrastructure segment. The plant has a capacity of 350,000 tonnes per year and
is energy efficient and has less negative environmental impact (Borealisgroup.com, 2017).
Borealis at a glance
Table 7 – Borealis financials (Orbis, 2016)
Year 2010 2011 2012 2013 2014 2015
Turnover (th USD) 749,849 419,573 441,505 406,144 300,185 277,005
Net Income (th USD) 141,318 69,305 82,242 23,793 (2,811) 950
Profit Margin % 22.07 19.4 22.95 17.88 2.72 4.15
Figure 24 - Borealis financials (Orbis, 2016)
4.3.7. AkzoNobel
AkzoNobel is a leading global paint and coatings company and manufacturer of major speciality
chemicals. The company is headquartered in Amsterdam, Netherlands. The company has a long
and distinguished history, dating back to 1646. The company supplies decorative paints,
performance coatings and speciality chemicals. In the decorative paints, the company supplies
22.07
19.4
22.95
17.88
2.724.15
0
5
10
15
20
25
(100,000)
-
100,000
200,000
300,000
400,000
500,000
600,000
700,000
800,000
2010 2011 2012 2013 2014 2015
Profit & Revenue
Turnover (USD) Net Income (USD) Profit Margin %
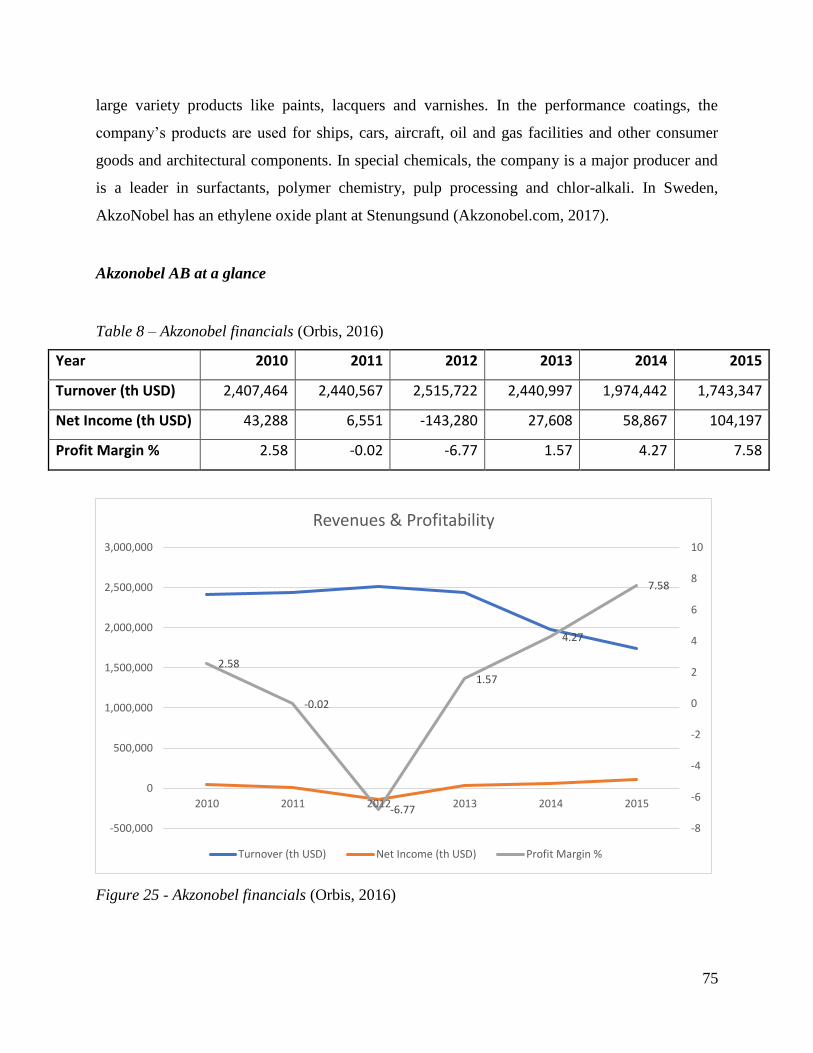
75
large variety products like paints, lacquers and varnishes. In the performance coatings, the
company’s products are used for ships, cars, aircraft, oil and gas facilities and other consumer
goods and architectural components. In special chemicals, the company is a major producer and
is a leader in surfactants, polymer chemistry, pulp processing and chlor-alkali. In Sweden,
AkzoNobel has an ethylene oxide plant at Stenungsund (Akzonobel.com, 2017).
Akzonobel AB at a glance
Table 8 – Akzonobel financials (Orbis, 2016)
Year 2010 2011 2012 2013 2014 2015
Turnover (th USD) 2,407,464 2,440,567 2,515,722 2,440,997 1,974,442 1,743,347
Net Income (th USD) 43,288 6,551 -143,280 27,608 58,867 104,197
Profit Margin % 2.58 -0.02 -6.77 1.57 4.27 7.58
Figure 25 - Akzonobel financials (Orbis, 2016)
2.58
-0.02
-6.77
1.57
4.27
7.58
-8
-6
-4
-2
0
2
4
6
8
10
-500,000
0
500,000
1,000,000
1,500,000
2,000,000
2,500,000
3,000,000
2010 2011 2012 2013 2014 2015
Revenues & Profitability
Turnover (th USD) Net Income (th USD) Profit Margin %

76
4.3.8. Perstorp AB
Perstorp Holdings AB is the parent company of Perstorp group. The company holds leading
position in speciality chemicals mainly for customers in coating, plastic-processing and
automotive industries. Its production facility is at Stenungsund and also including the unit in Nol
20 km south of Stenungsund. The plant at Stenungsund was commissioned in 1980 and currently
is the largest production unit in Scandinavia manufacturing bio fuels, RME, rape seed methyl
ester (Perstorp.com, 2017).
Perstorp OXO AB at a glance
Table 9 – Perstorp OXO financials (Orbis, 2016)
Year 2010 2011 2012 2013 2014 2015
Turnover (th USD) 558,527 568,339 567,343 584,677 505,572 416,309
Net Income (th USD) 34,305 31,677 20,733 29,323 20,295 12,268
Profit Margin % 8.89 8.25 4.01 5.01 4.01 2.95
Figure 26 - Perstorp OXO financials (Orbis, 2016)
8.898.25
4.01
5.01
4.01
2.95
0
1
2
3
4
5
6
7
8
9
10
-
100,000
200,000
300,000
400,000
500,000
600,000
700,000
2010 2011 2012 2013 2014 2015
Profitability & Revenue
Turnover (th USD) Net Income (th USD) Profit Margin %

77
4.3.9. Nynas AB
Nynas Ab is a manufacturer of speciality napthenic oils and bitumen products. During 2013, the
Swedish market accounted for 10% of its revenue. It is owned by Neste Oil and PDVSA. Its
refinery in Nynashamn was built in 1928. The company has two refineries in Sweden located in
Nynashamn and Gothenburg (Nynas.com, 2017). Nynas is a strong global company within a
niche market. Its specialisation in Napthenic Speciality Products (NSP) and bitumen sets it apart
from other oil companies that offer oil as a source of energy. In 2015 Nynas opened an adhesive
lab and said it plans to invest in further expanding its polymer compounding and testing
capacities. In 2012, a new modern sulphur recovery plant was opened in Nynashamn and marks
an important step in improving the refinery’s reliability and reducing sulphur emissions to one
fifth (Nynas AB, 2017).
Nynas AB at a Glance
Table 10 – Nynas AB financials (Orbis, 2016)
Year 2010 2011 2012 2013 2014 2015
Turnover (th USD) 3,144,322 3,450,571 3,872,965 3,087,254 3,024,701 2,003,625
Net Income (th USD) 62,802 45,371 -5,273 -47,542 36,049 41,051
Profit Margin % 2.89 1.91 -0.21 -1.44 1.99 2.75

78
Figure 27 - Nynas AB financials (Orbis, 2016)
4.3.10. INEOS Compounds
INEOS is a privately owned multinational chemicals company, headquartered in London UK.
Measuring sales revenue, it is in the top ten chemicals manufacturers. The company has a
production site in Helsingborg, which is part of the INEOS Compounds group. The site
manufacturers PVC (Polyvinyl Chloride) Compounds and capacity is 22,000 tonnes. The
products manufactured here are mainly delivered to the Nordic market along with rigid and
flexible pellets and in powder form called “dry blend”. The PVC produced is mainly for building
and construction, PVC cables and sheathing, PVC medical products, PVC packaging, PVC hose
and tubing and speciality PVC.
Since 2016, INOVYN is 100% owned by INEOS. The production plant in Stenungsund
producs soda liqur, PVC and hydrochloric acid. In 2017, a new chlorine factory will be built
instead of the current one that uses mercury technology. The facility consists of three stages:
first, chlorine and sodium hydroxide are prepared from saline and electricity. After this vinyl
chloride of chlorine and ethylene and finally PVC of vinyl chloride. The production is
continuous with planned maintenance shutdowns.
2.89
1.91
-0.21
-1.44
1.99
2.75
-2
-1.5
-1
-0.5
0
0.5
1
1.5
2
2.5
3
3.5
-500,000
0
500,000
1,000,000
1,500,000
2,000,000
2,500,000
3,000,000
3,500,000
4,000,000
4,500,000
2010 2011 2012 2013 2014 2015
Revenues & Profitability
Turnover (th USD) Net Income (th USD) Profit Margin %

79
INEOS at a glance
Table 11 – INEOS financials (Orbis, 2016)
Year 2010 2011 2012 2013 2014 2015
Turnover (USD) 38,644,560 36,203,523 33,488,662 28,942,839 28,387,792 22,861,932
Net Income (USD) 2,797,466 1,978,454 1,401,799 416,420 1,409,275 -596,152
Profit Margin % 9.17 6.98 5.22 1.96 6.24 -2.57
Figure 28 - INEOS financials (Orbis, 2016)
4.3.11. Kemira Kemi AB
Kemira is a global chemicals firm that serves customers in water-intensive industries. The
company was formerly known as Boliden Kemi AB and during 1989, Kemira Oyj acquired and
changed its name to Kemira Kemi AB. The company was founded in 1972 and is based in
Helsingborg. The main focus for the company is on pulp & paper, oil and gas, mining and water
treatment to best improve its customers water, energy and raw materials efficiency. Its products
are used in pulp & paper industry, water treatment chemicals, feed phosphates for animal
9.17
6.98
5.22
1.96
6.24
-2.57
-4
-2
0
2
4
6
8
10
-5,000,000
0
5,000,000
10,000,000
15,000,000
20,000,000
25,000,000
30,000,000
35,000,000
40,000,000
45,000,000
2010 2011 2012 2013 2014 2015
Revenues & Profitability
Turnover (USD) Net Income (USD) Profit Margin %

80
production, raw materials for detergent industry, calcium chloride for road maintenance and
potassium sulphate for fertilizers production (Kemira, 2017).
Kemira Kemi AB at a glance
Table 12 – Kemira Kemi AB financials (Orbis, 2016)
Year 2010 2011 2012 2013 2014 2015
Turnover (USD) 273,025,335 143,879,673 138,058,269 132,320,439 103,146,082 98,450,383
Net Income (USD) 30,402,384 24,681,679 11,223,000 6,382,515 7,109,066 8,766,941
Profit Margin % 9.03 7.39 5.77 12.03 12.82 11.79
Figure 29 - Kemira Kemi AB financials (Orbis, 2016)
9.03
7.39
5.77
12.0312.82
11.79
0
2
4
6
8
10
12
14
0
50,000,000
100,000,000
150,000,000
200,000,000
250,000,000
300,000,000
2010 2011 2012 2013 2014 2015
Revenues & Profitability
Turnover (USD) Net Income (USD) Profit Margin %

81
4.3.12. Tikkurila Sverige AB
Tikkurila is a leading paint company in Sweden, which is a part of the international group
Tikkurila group. It was founded in 1865 and the headquarters for Sweden is located in
Stockholm. It has one state of the art facility production in Nykvarn. It has a strong brand
portfolio that includes market leading brands like Alcro, Beckers and Palett & Co for
professionals and consumers. For industrial customers, the firm offers solutions that includes
high functionality and quality under its brand name Tikkurila (Tikkurilagroup.com, 2017).
During 2012, Sweden accounted for 23% of its revenue and during 2015 Sweden accounted for
26% of its revenue.
Tikkurila at a glance
Table 13 – Tikkurila financials (Orbis, 2016)
Year 2010 2011 2012 2013 2014 2015
Turnover (th USD) 205,954 202,808 219,448 235,777 195,538 188,885
Net Income (th USD) 23,346 18,547 19,869 19,872 20,140 15,609
Profit Margin % 14.4 12.28 12.79 11.38 12.8 10.59
Figure 30 - Tikkurila financials (Orbis, 2016)
14.4
12.2812.79
11.38
12.8
10.59
0
2
4
6
8
10
12
14
16
0
50,000
100,000
150,000
200,000
250,000
2010 2011 2012 2013 2014 2015
Revenues & Profitability
Turnover (th USD) Net Income (th USD) Profit Margin %

82
4.4. Outlook for automation
This section will explain why industrial automation market is attractive and investigate the
growth for the market for the coming years. The growth is based on global automation reports
for process automation and focusing on control technologies and software to independently
operate and monitor a mechanised system of industrial processes.
Since Sweden is heavily dependent on imports, the industrial automation market for Oil & Gas
and Chemicals in Sweden depends on the price of crude oil and the investments made by firms
operating in this sector. During 2012, process automation market globally was estimated to be
$83bn. For process automation in oil, gas and chemicals, demand is broad-based across all major
geographies. After the drop-in oil prices, the investment slowed down by firms operating in this
sector. However, this macro pause offers an attractive entry point for ABB, as the momentum
will slowly pick up from 2017 and continue to grow in 2018 to 2020 (ARC, DCS Market, 2015).
The automation market has grown 6% p.a. Since 2003, which is roughly ~1.7x global
industrial production. Looking at process automation, the growth has been 4.9% which is ~1.4x
global industrial production. The key end-market for ABB and its Control Technologies BU in
focus is Oil, Gas and Chemicals firms. The market accounts for 17% (Oil and gas) and 12%
(Chemicals). The low oil prices have stimulated an increased plant investments by firms
operating in this sector. In Sweden, there has been efforts to increase and develop domestic
refinery and chemical processing capacity. The production from refineries has been relatively
stable and could be said that they are operating at capacity and need to expand to meet demand
or in Sweden’s case to export (Credit Suisse, 2013). The transformation output from refineries in
terms of thousand tonnes of oil equivalent(TOE) is represented in the graph below:

83
Figure 31 – Transformation output from refineries (Ec.europa.eu, 2016)
20,153
18,202
21,24920,614 21,028
19,893
21,750
17,817
20,22121,115
0
5,000
10,000
15,000
20,000
25,000
2006 2007 2008 2009 2010 2011 2012 2013 2014 2015
Transformation output from Refinaries (TOE)

84
There have been announcement of expansion or investments by firms operating in Sweden to
expand capacity or improve its current equipment.
Table 14 – Expansions and investments in Sweden
Company Project Year Capacity Location Capital Invested
Preem Isomerization Process 2015 Lysekil 355 M SEK
Preem VDU expansion 2016 lysekil 1.5 B SEK
Borealis High-pressure LDPE 2010 350,000 Stenungsund 4 B SEK
Borealis Cracker furnace expansion 2016 Stenungsund 160 M Euro
St1 Storage facility acquisition 2016 Gothenburg N.A
Perstorp Valerox 2015 Stenungsund N.A
Nynas Modern sulphur recovery plant 2012 Nynashamn 600 M SEK
The outlook for DCS market looks positive according to experts and consultants. For 2017, it is
expected have a slight decline. But for coming years 2018-2020, it is expected to have a +4%
CAGR (Best guessed estimate) according to ARC review (ARC Advisory Group, 2016a).
Figure 32 – Outlook for the DCS market (ARC Advisory Group, 2016a)

85
In the refining industry, Honeywell has long dominated the market and had captured a third of
the global market by 2015 (ARC Advisory Group, 2016b). Emerson, with its DeltaV process
automation system was fourth largest globally during 2015. Similarly, in the chemicals industry,
Emerson was second globally. In Sweden, the main players are Emerson, Honeywell, ABB,
Siemens & Schneider Electricals (Not very prominent but still active). The suppliers that are
large and diversified have access to greater bargaining power in the market. For example,
Honeywell and ABB have a wide portfolio to cater to the Oil & Gas market in Sweden. Both
these firms can provide products and services for offshore, processing, refining, petrochemicals,
purification & measurement, sensors & switches and automation. In Sweden, there is a limited
number of players that supply such wide range of products and combined with high demand
from small player operating in the Oil & Gas and Chemicals market makes it competitive for
suppliers.
The demand for services remains the fastest growing segment in the DCS market. Firstly,
there is project service which includes installing, configuring and commissioning DCS.
Secondly, operations service better known as aftermarket services that includes post-installation
and facilities planning services provided by the DCS supplier. Currently with the emergence of
Industry 4.0, there is also demand for Big Data analysis that is generated with the utilisation of
DCS systems. When suppliers provide these services, it could help ABB attract new customers
and also gain more market share (ARC Advisory Group, 2016b).
For customers to consider ABB as a supplier, it is necessary to go beyond technology. When
suppliers present more value along with importance of technology, it can benefit it in being
considered as a preferred supplier. Things that can help are:
• Expertise of sales executive in the location,
• Type of sales channel used,
• Industry experience,
• Stability and financial strength of the supplier,
• Presence of a project team to execute the project,
• Project engineering experience and
• Total cost ownership.
(ARC Advisory Group, 2016b)

86
5. Empirical Findings
The section aims to present the main results from the semi-structured interviews conducted with
ABB personnel. The interview topics were around customer retention, acquisition and the
connection to theory used in this report
5.1. Semi-structured Interviews
Throughout the conducted interviews there were two main themes that surfaced frequently.
These themes were; current set of products and services, and current customer retention and
acquisition activities. The subject of these themes influences both the customer retention and
customer acquisition process of the company. When ABB is referred to within this chapter the
authors are referring to the BU under investigation not the whole organization.
5.1.1. The Case Company
The case company in this research is the Oil & Gas and Chemical sector of the industrial
automation business unit of ABB Sweden. The purpose of this business unit is to sell automation
solutions to the organizations operating within the Oil & Gas and Chemical market in Sweden.
ABB utilizes a matrix structure so many people are involved in various aspects of this specific
business unit. There are still two main employees which are involved in most projects and
communications with customers, one of which being a project manager and the other an industry
manager. The industry managers’ day to day activities involve selling automation solutions to the
process industry within Oil & Gas and Chemical market in Sweden, handle the offerings
delivered to customers, both for power and automation, and coordinate activities regarding
current and potential customers. The project manager acts as a support for the industry manager
as well as carrying out different projects for the customers. As mentioned earlier ABB utilizes a
matrix structure so both of these employers receive cross divisional support from within ABB
when needed. Specific project teams are formed matching the necessary knowledge needed for
each project. The same can be said for acquiring customers, when a specific project or
opportunity is identified a capture team is assembles, given that the opportunity is big enough.
Different salespersons with different skills from ABB are then collected and if the opportunity
lies within the Oil & Gas and Chemical market the industry manager often leads the capture

87
team. There is thus no sales team working directly under the industry manager but a team is
rather assembled aiming at each project and/or opportunity each time.
5.1.2. Current set of products and services
Whether a company wants to retain their current customers or attract and acquire new ones, what
the product brings to the table is essential. If the product is to appeal to certain customer it must
possess some features that the customer values. This can be achieved in many different ways, for
example through flexibility, price, and quality to names a few.
ABB’s automation platform, the ABB Ability system 800xA, is extremely advanced and
very suitable for the Oil & Gas and Chemical market. All respondents agree that ABB’s
offerings are strong and both Respondent B and Respondent C identify ABB’s automation
platform, the 800xA, as one of the strengths of the BU along with a good general knowledge of
DCS systems.
Respondent C: “I think we have the best DCS system or platform on the market where you can
integrate all the systems in the industry, that is one of our greatest strengths.”
Although most of the features offered by the 800xA system can be matched by comparable
systems from competitors there is one advantage to the 800xA system which is its flexibility.
The 800xA system offers the possibility integrate the system with more variety of systems and
equipment in the industry compared to similar platforms offered by competitors. As can be seen
in the quote above Respondent C feels that this flexibility regarding integration is one of ABB’s
greatest strengths in this industry. Respondent A notes when asked if the current sets of products
and offerings are sufficient to serve the Swedish market that aftermarket sales is something that
ABB needs to improve on.
Respondent A: “I think when talking about product delivery and so on, I think we are quite in
line but we have some work to do in the aftermarket if we are talking about the field services and
so on we have some things to shape up within the Swedish organization. Because it is really
important to have good aftermarket services as that is the biggest revenue so we have to do a bit
better in that regard.”

88
Understandably, safety systems are important for the Oil & Gas market, namely for the
refineries. This is different from most of the other industries according to Respondent B as in
industries like pharmaceuticals, food & beverage and chemicals the process control, including
batch control and the activation of different items on site. All of this is of course included in the
Oil & Gas industry but safety systems are more emphasized there in comparison to other
industries. The ABB Ability system 800xA can contain many different modules, such as
Advanced process control (APC) and condition monitoring for example. According to
Respondent A there is a possible opportunity in the future regarding telecommunications which
is a module which can be adopted by the ABB Ability system 800xA. This module can allow the
controllers to know where people are located and the possibility of notifying these persons
quickly for safety purposes. This module is widely used in the upstream and offshore industry.
As Sweden is exclusively downstream focused this technology has not been utilized as of yet.
Today the refineries have some lighter systems to handle these things but future adaption of this
system is a possibility as the demand for safety is always rising according to Respondent A.
When asked about opportunities for the BU Respondent A notes that developing the skill
of selling solutions rather than the raw product is something that ABB is focusing on. Combine
different products from different parts of ABB into a complete integrated solution. This
development originated from the customer side as ten to fifteen years back customers had their
own skilled people working on integration so the customers were only buying pure products.
Today it is becoming rare that the customer possesses these skilled people for integration so they
are increasingly relying on the supplier to conduct the integration phase. This development
requires extensive cooperation between different parts of ABB and for ABB to employ people
with this specific skillset. ABB’s size and product range can certainly be considered a strength in
this regard, given that cooperation between different parts of the organization is effective and
promotes cross-selling. Respondent B also mentioned this emerging trend from the customer
side:
Respondent B: “Some customers want to do the planning by themselves which means that they
buy pure automations, instrumentation, they are doing installation, then they do the coordination
themselves. But customers are increasingly requiring having process design and process

89
automation in one package. Then we have some challenge as we don't have any process design
knowledge in my organization or within ABB to counter that.”
According to Respondent B, ABB is lacking in regard to process design knowledge which in his
opinion can hinder ABB’s ability to provide the customer with the whole package solution which
he needs. This seems to be one area that ABB needs to improve in if they are to be efficient in
acquiring new customers.
5.1.3. Current Customer Retention and Acquisition Activities
The market for automation systems in the OGC industry is rather concentrated on few big
players. Sales depend on capturing and reaching agreement for big projects from, mostly, these
big organizations that make up for most of the market so sales activities is mainly up to the
investments and upcoming projects of these organizations as a product like the 800xA does not
come cheap and requires significant commitment for both parties involved. In the form of
implementation and service from the supplier side and in form of future investment for the
customer side as it is expensive to change platforms later on so investments in automation
platforms tent to be long term.
Customer retention
That being said, these big customers engage in new projects regularly so in order for a supplier to
capture a given project it is important to engage in and maintain a good customer relationship.
Customer retention activities at ABB are thus concentrated on customer visits, follow ups
regarding the product and service for the automation platforms, while also utilizing events to
reach customers. Events are set up regularly with customers where ABB’s solutions are
presented to the customer. While products are shown individually ABB tries to show how
different products from ABB can work together. These events are hosted at the customers site,
making them important for customers which are not willing to travel for ABB’s major events
according to Respondent A. When asked if there is a formal process and/or guidelines regarding
customer relationship development:
Respondent A: “we have an account master plan, we are setting up a document for each for our
accounts which we have identified as our major accounts. In this document, we have set up a

90
player's map and a thing called customer wallet where we identify how much of the market or
the installed base our customers account for. There are different segments within this plan
including deepening our relationship with the customers and so on. This plan is divided down
specifically for each customer.”
To the same question, Respondent C believes that there is a general process regarding customer
relationship development and that the Industry manager is mostly responsible for it. He then adds
that he believes that the relationship with the current big customers is strong and that the industry
manager is doing an excellent job in that regard. This view seems to be shared by all the
respondents as Respondent A mentions how the industry manager spends one day each week at
one of their biggest customer site along with a number of visits and interactions with many other
customers. Still, when Respondent C is asked if smaller customers get their required attention, as
the industry manager is the sole person responsible for the customer development, he notes that
extra resources would be needed to carry that out effectively and for the industry manager to be
able to visit more customers.
Every organization needs to utilize different channels in order to reach their customers
and to deliver their product or service efficiently and to the customer’s liking. The main channels
utilized by ABB are, according to Respondent C:
Respondent C: “We have the project which is one sales channel and we are working directly
with the end customer. And then we have system integrators which is also directly to the end
customers but buys products directly from ABB. Then you have OEM (original equipment
manufacturer), wholesales, and technical distributors (not common in Sweden). These are the
different sales channels we have in Sweden, but the biggest one for the chemical sector is
projects.”
Respondent A received the question was asked if he believed if the current channels still work
for the Swedish market as the Swedish market is somewhat developed, his answer was more
focused on the communication channels:
91
Respondent A: there are new people coming into the customer organizations all the time so we
have to address these new people coming in and there is always this need of communicating the
new developments to the old ones in the customer organizations so of course there is a need for
ongoing communication with the customers all the time. Regarding contacting new customers
there is the same principles, new people are coming in constantly both for existing customers
and noncustomers and there is always this need for good communication. Sometimes new
customers enter the Swedish market that we have to contact and reach in some way. We are
working a lot with the web in this regard but we could be better on the web because ABB is a big
organization and sometimes we are a bit slow in adopting the new technologies and we are still
in this process of developing the web communication with the customers, we have a better web
now but it could be even better as we could make it more interactive with new customers in the
Swedish market connecting with our groups and twitter accounts and so on. I think there is a
huge opportunity to work with this channel to communicate with the customers.
New CRM system - Salesforce
In the year 2015, ABB shifted to Salesforce which is a web-based CRM system. Before ABB
had a local CRM system for the Swedish market and no global system for the whole ABB.
Respondent A emphasized the benefits of having a global system compared to the previous
situation where many local systems were used, and to support his argument he points out that
many of their customers operate globally which allows ABB to coordinate their activities
regarding customers more efficiently on a global level. With the help of this, ABB can gather its
customer’s information in a single, integrated platform. With the gathered information, ABB
sales department can understand which product was sold to which customer and when.
There are two main customer development functions used by ABB within the salesforce,
the first being a Net Promoter Score (NPS) while the other is a green card/red card customer
feedback score. For the NPS customers are asked how likely they are to refer ABB to a friend
(other businesses) on the scale of 1-10 where customers selecting 9-10 are considered promoters
which is then integrated into Salesforce where it measures customer satisfaction and gathers
feedback from its customers. This is used as a customer relationship measurement and is
supposed to give an indication of how well the relationship development is going. The other
function is a sort of customer feedback activity where customers are asked to rank ABB as a

92
supplier and give ABB one green card, for something that they are doing well, and one red card,
for something that needs improving. All red cards are followed up and acted upon as they are
marked down as a customer complaint and therefore placed on a “must be resolved” list.
When Respondent C was asked if this change has affected him in a positive manner he
agrees but notes that he still needs the right figures and opportunities in the system so he’s able
to do his job more efficiently. This is lacking a bit according to him while he also states that it is
still a new tool for the sales resources and it can be hard to understand. This can indicate that the
implementation process of the system is not going too well and when asked if the
implementation process of the system needs to be more coordinated in order for the system to
start performing to its full potential he agrees before adding:
Respondent C: “I think the system is now more product sales focused not project sales focused
and that’s really different. We need some change in salesforce so we feel like this is our
environment for projects not for products.”
Respondent B had no particular opinion on the new system as it is more sales concentrated and
he is mostly involved in the project execution phase. He notes that he himself does not enter any
data into the salesforce but rather only extracts the information necessary for him to plan
accordingly regarding project execution.
Customer acquisition – Human resources
When the discussion moved over to the current customer acquisition activities the lines became
quite blurry. Respondent A notes that regarding acquisition ABB has some key performance
indicators regarding how to successfully establish new relationships with customers before
adding:
Respondent A: “We have categorized customer as A, B or C customers depending on their
potential looking at revenues and EBITA and so on and thus identify interesting customers. This
is still a bit special for the chemical market here in Sweden as the competitors are quite few and
we have already established contact with most of them and only small players that we have no
contact with. We still have these key performance indexes and a plan to establish new contacts.”

93
Furthermore, Respondent A mentions that there is a general marketing budget in place which is
used for acquiring new customers among general marketing activities. He notes that the budget
does not always accommodate his plans but in general the budget is good. Although Respondent
A does note that these processes are in place and key performance indicators have been
identified, Respondent C responses indicate that these processes are not currently being utilized
by ABB:
Respondent C: “Yes, we have a target for every sales resource and business unit but I don’t think
we have a specific target right now as we have so much to do with our existing customers. The
industry manager is having a hard time visiting our current customers right now so we are not
actively looking for new customers right now, I mean yeah, a couple each year but in general we
have enough volume from our existing customers. But in the future, we need to expand and hire a
project manager or a system engineer and maybe some sales resource.”
Although the Respondents B and C agree that a high-quality capture teams can be assembled
when an opportunity is identified they seem to agree that the current efforts regarding acquisition
at the BU are little to none as can be seen by Respondent’s C comments above. Respondent B is
not as involved in the acquisition process but points out that he suspects that he suspects that the
industry manager does not have enough support. He still had one suggestion regarding customer
acquisition for ABB:
Respondent B: “Maybe you could set up more top management meetings, it is always requested
that you aim to become the preferred supplier for the customer. But any major investment,
despite the local factory wants to do business with ABB, the top management of the company,
which can be located either here in Sweden or the US or the UK for example, maybe they do not
have ABB as a preferred supplier. I think approaching through the top management is one way
to bring in new business. Convincing the customers headquarters to mark ABB as a preferred
supplier.”
When asked if he believes that there is a lack of focus by ABB on the people in charge he agrees.

94
When Respondent A received, the question regarding weaknesses for the BU his answer is in
line with both of the other respondents mentioning how ABB is quite small for the Chemical, Oil
& Gas in Sweden and one weakness is how they can struggle to execute larger projects locally in
Sweden. In an attempt to counter this struggle ABB is establishing cooperation with ABB in
Denmark, Norway and the UK. While admitting that not having to rely on cooperation with other
countries and instead have large organization locally would be a strength Respondent A still
identifies the possibility of making this cooperation as efficient as possible the main opportunity
for the BU as it can help them to strengthen their position in the local market. Respondent B
agrees that there is a lot of knowledge in Norway for example as the oil market there is big. He
still mentions that he feels like ABB needs to build up this knowledge locally in Gothenburg, but
to do that they need to make sure that they bring in the business.
Respondent B: “today we are dependent on the organization in Denmark and Norway to make
the deliveries. A main part is in connection with the high integrity controls but there is much
more automation in our refineries outside of this high integrity. I would say there is a possibility
to grow the business. Maybe set up some capture team to understand what is needed on site and
to try to find information in different ways.”
All respondents agree that the current human resources available for the BU are strong.
Respondent B thinks that the overall knowledge is strong and mentioned knowledge of using the
DCS systems process control specifically. Respondent C did note that internal knowledge about
safety systems and the system that ABB has to offer is one of the organization's’ strength for this
industry while also adding that the overall industry knowledge is good and the human resources
in Gothenburg, being the industry manager and the project manager, are very strong. Respondent
A notes that sales support available to the BU through the organization are strong as well as the
capture teams created consist of people possessing different skills in order to be able to execute
the project at hand.
Even if the human resources, both available as a support for the BU and within the BU
itself, are strong according to the respondents they still mention multiple times that more
resources are necessary. When asked about the weaknesses of the BU Respondent C only

95
mentions the lack of resources noting that an extra project manager and then maybe one system
leader in the future are needed in order to support and help the current resources in the BU.
When confronted with the same question Respondent B mentions that ABB’s price level is one
weakness before adding that when big orders are coming in ABB tend to struggle due to lack of
manpower noting that a data center delivery which is currently being delivered is requiring ABB
to hire a large number of people from outside of ABB in order to deliver. Respondent B holds,
like mentioned before, a more project oriented role and is thus talking about lack of human
resources on the project side rather than sales side in this case although he later expresses his
concerns regarding the sales resources. When asked if the lone industry manager is enough to
scan the market efficiently for new opportunities Respondent A notes that a person only has
100% of its time available so some opportunities are probably lost while adding that the industry
manager is not completely alone as there is somewhat of an informal system within ABB where
different sales people find opportunities and notifies the relevant industry manager. When
Respondent C was faced with the same question the reply was as follows:
Respondent C: “Not right now when looking at the new customer side we are working with our
existing customer. In order to increase our volume and acquire new customers we need more
resources. It could be a project manager or a system engineer to support our industry manager
so he can be out and visiting existing and new customers.”
The response from Respondent B was similar as he notes that sales resources are limited and that
there is ongoing business in the Oil & Gas industry which ABB is not a part of so the customer
acquisition activities tend to struggle because of lack of manpower. This is further emphasized
by Respondent C:
Respondent C: “I think we need one more salesperson or someone who can support the industry
manager. If we look at acquisition or the bidding phase, the industry manager is responsible
from the start to the end so there are many responsibilities resting on his shoulders.”

96
He then notes that the project manager supports the industry manager in the bidding phase,
technical strategy, how the system should be built and so on. Respondent B also agrees that ABB
are probably missing out on opportunities due to the insufficient resources.
5.2. Summary from Interviews
• All Respondents agree that ABB’s current product and offerings are strong and two
Respondents identified the 800xA platform as one of the strengths of the BU.
• Respondent A mentioned that increased focus is needed in aftermarket services.
• Customers are increasingly demanding “whole-package” solutions where the supplier
takes care of the integration for the customer. Respondent B mentioned in this context
that ABB is lacking process design knowledge.
• Retention activities are concentrated on customer visits, follow ups regarding the product
and service for the automation platforms, while also utilizing events to reach customers.
• ABB shifted to a new global CRM system recently called salesforce which replaced
previous systems which was a local system. Respondents A and C, who are involved in
sales, both see many possibilities for this new system.
• Respondent C still mentions how he feels like the implementation process of the system
needs to be more coordinated
• Customer acquisition processes are in place at the BU according to Respondent A, it is
still noted by Respondent C that these processes are not being utilized as of now due to
lack of human resources.
• Respondent B believes that there needs to be more focus on top management at potential
customers in order to convince them to make ABB a preferred supplier.
• The BU is dependent on the ABB organizations in Norway and Denmark to carry out big
projects due to lack of human resources.
• All Respondent agree that ABB might be missing out on opportunities as more support is
needed for the industry manager to continually scan the market.
• Throughout all the interviews it can be understood that all Respondents feel like the
current human resources are very capable. Yet, Respondents, especially Respondent B
and C, mention multiple times that there are more resources needed if the BU is to grow
and be able to effectively acquire new customers.
97
6. Analysis
The sections aim is to present and compare results of theoretical framework and empirical
findings from semi-structured interviews. The aim is to prove results and differences to theories
compared to the case company. The analysis will start by how ABB can become a preferred
supplier, supplier power in Swedish market, business model and its current customer retention
and acquisition strategy.
As seen from literature by Robinson, Faris & Wind (1967), customers in B2B setting using the 8
steps, identify their needs and research about potential suppliers. Most customers that contact
ABB Sweden have done their due diligence as respondent B mentions in the interview.
Additionally, product is one that stands out compared to its competitors as Respondent C
mentions during interview. The delivery channel currently used is projects as respondent C
mentions: "We have the project which is one sales channel and we are working directly with the
end customer for chemicals". But this is not as efficient as it could be as respondent B mentions
“today we are dependent on the organization in Denmark and Norway to make the deliveries".
This is an issue as it delays and can lead to negative impact about ABB as a brand. Similarly,
respondent A says “We are quite small in Sweden for Chemical Oil & Gas as there is a weakness
in the regard of executing larger projects locally here in Sweden. In order to counter this
weakness, we are trying to establish cooperation with other organizations in Denmark, Norway
and the UK and so on. Large organization locally would also be a strength but we do not have
that at the moment”. ABB currently makes use of its CRM to gather feedback from its customers
by using green card/red card customer feedback score. All red cards are followed up and acted
upon as they are marked down as a customer complaint and therefore placed on a “must be
resolved” list.
In a consumer market, brand often draws on personality of buyers and aims to generate
value through image or self-esteem. However, as seen earlier, when customer buy products like
800xA, the importance is on quality and how ABB can provide industry knowledge to better
serve customers (referred to as brand). The importance placed by companies operating in
Sweden is on quality, delivery and performance history. Additionally, there is more importance
on aftermarket sales and support. But currently ABB is not able to execute this. As respondent A
mentions: "We have some work to do in the aftermarket if we are talking about the field services

98
and so on we have some things to shape up within the Swedish organization. Because it is really
important to have good aftermarket services as that is the biggest revenue so we have to do a bit
better in that regard.” So, for ABB to be a preferred supplier there are areas that needs
improvement, so that it is perceived as a supplier that is safe in the long-term.
6.1. Supplier Power
Figure 33 – Supplier power
The radar diagram presented in figure 33 shows the importance of the eight factors that
customers view important when selecting a supplier. A score of 1 would mean that the customer

99
does not value that factor with great importance and similarly a score of 5 would mean the
customer values that factor the most.
Major suppliers for automation in control technologies within the Oil, Gas and Chemicals
in Sweden are Emerson, Honeywell, ABB, Siemens and Schneider Electricals. There are other
players but not as active in the market. Typically, the suppliers are large and have highly
diversified companies which grants them greater bargaining power within the market. Honeywell
and ABB for example has wide portfolio catering to the worldwide oil and gas market for
Sweden. Both the companies cater to offshore, processing, refining, petrochemicals, purification
& measurement sensors & switches and automation. The suppliers that cater such wide range of
products are limited, which combined with high demand from small players in Swedish Oil &
Gas and Chemicals market makes it a competitive market for suppliers.
Supplier power is highly affected by price of commodities. When the price of oil and gas
is high, companies will explore deposits that were previously believed to be expensive. This will
increase the supplier's revenue. However, when prices fall, investments in exploration, refining
and drilling also fall that increases competition among supplier’s. There has been a continued
global fall in price of crude oil which continued in 2016 that limited exploration. Companies like
Preem and St1 have backward integrated in the oil and gas industry and others use third-party
service companies to supplement their own activities. This in addition to importance of supplier
revenues with oil and gas market reduces the power of suppliers within the oil, gas and chemical
industry.
Within suppliers, there are also human resource providers like landowners or
government. Few of these can exert strong bargaining power because of their size. Even though
there are firms that provide specialist equipment, it can be hard to assure required reserves since
oil and gas is a nonrenewable resource. This implies that government, landowners and others that
are similar can also be seen as suppliers and they can be in a strong position. Hence the position
of suppliers in the oil, gas and chemicals is moderate.
When companies operating in OGC sector choose suppliers, like any other company in a
B2B transaction, they research their potential suppliers. They vet them on multiple levels. The
size of the supplier is one criteria they look at. The size can explain knowledge, expertise,
offerings, that comprise the brand, delivery time and most important price and quality. Looking
at the suppliers in the Swedish market, brand power plays an important role. Names like ABB

100
which is a Swedish and Swiss organization with rich history gives an advantage. ABB has a wide
range of product offerings that can cater to the whole value chain when a company is integrated.
With its rich knowledge and expertise this gives it an advantage over its suppliers, yet it is
currently ranked 3rd in the market. Another supplier that is a competitor is Honeywell, which
also has wide range of product offerings.
The quality of products offered by the three biggest players (Emerson, Honeywell and
ABB) are high. The companies have expertise and knowledge that can help companies reduce
production costs and increase efficiency. An advantage with ABB’s offerings is the expertise and
knowledge within the field and its offerings that combines its offerings. The automation products
offered by the companies are nearly similar and only differ on the basis of specific features.
Hence the quality of the product needs to be high and is considered important by customers.
The cost of the product is an important factor when companies purchase equipment from
suppliers. Since the product is more of a system that is packaged to cater the needs of the
customer, it is difficult to compare the offerings by different suppliers. In the case of ABB, the
800xA is a system that is packaged to the needs of customers. It is flexible and versatile that can
be implemented to existing system in place. This means that if a customer wants to upgrade its
existing system it can do so without spending too much with the 800xA. This gives it an edge
over its competitors.
Switching costs is very important as it can decide if a customer can be acquired or retained.
It is the fixed cost that is incurred by a buyer when changing suppliers, as the buyer’s
specification of product, equipment and purchasing cycle is closely linked to current supplier’s
products and operations. Since suppliers for control technologies in automation offer similar
products, there is comparable prices, leading to low switching costs. But looking at ABB’s
800xA, it is a unique product that provides additional functions and benefits for users. The main
being that 800xA can be implemented with the existing system by the customer making it lower
switching cost for customer. This gives ABB an advantage over its competitors.
6.2. ABB Business Model
For the BU of Process Automation and Control technologies within ABB Sweden’s Industrial
Automation Division, the purpose is to provide solutions, products and services for process
control, safety, instrumentation, plant electrification and energy management for key process
101
industries like Chemicals, oil & gas, marine, mining, minerals, metals, cement, and pulp and
paper.
Value Proposition - ABB mainly offers two value propositions, being innovation and
brand/status. The firm has been innovation minded since the beginning. During 2014, ABB filed
for 450 patents with the European Patent Office (EPO) and was recognized by Reuters as one of
2014’s top 100 global innovators. For the oil and gas industry, it introduced the world's first
power-from-shore solution for an offshore rig. In 2016, ABB introduced ABB Ability which was
developed with Microsoft that provides common technologies for enabling device, edge and
cloud application delivery. 800xA system became a part of ABB Ability and this platform
enables customers to integrate and aggregate data securely, along with predictive analytics were
generated insights can help companies drive performance and improve productivity.
Recently ABB has strategically collaborated with IBM Watson Internet of Things (IoT)
cognitive capability, where by using it unlocks new value for customers within the utilities,
industry and transport and infrastructure. With the help of this, customers can benefit using
IBM’s expertise in artificial intelligence and machine learning along with industry verticals. This
is in line to the development of Industry 4.0 where the aim is to use sensors and advance
technology over IoT to communicate not only with human operators but with sensors to improve
performance throughout the value chain in real time.
Additionally, with the launch of select I/O, there is additional value proposition for
customers in the Swedish market. But the delayed launch of the new product offered by ABB
can hinder it to penetrate the existing market and acquire new customers. This is due to the fact
that Emerson has a similar product that was launched in 2009 and started delivering mid 2010.
However, there is also debate that late entrants can capture customers by exploiting what buyers
have learnt through their experience from pioneers. Buyers learning is crucial and an expensive
task. In a way, it can be said that ABB has the opportunity define or redefine the market in which
it competes with Emerson. Rather than leaving the future purely to chance, ABB can create new
advantages and value for its customers (Shankar and Carpenter, 2017).
Channels - ABB’s main channel to the Oil & Gas and chemicals companies are its direct sales
team. The company serves existing customers through its sales representatives that set up capture
teams to execute projects. The company promotes its offerings through its website, seminars,

102
workshops, exhibitions and conferences. ABB organizes events where it showcases its products
where sales executives communicate with prospective customers. As respondent A mentions
during interview there are events where sales persons meet up with customers and present all
solutions to customers at their site. He further goes to mentions the advantages of the events
organized as they give opportunities to keep contact with customers as few are not willing to
travel to major events organized by ABB. This event is on a yearly basis where products are
presented individually and also how various products offered by ABB can work together. During
the event, success stories are shared with customer to give them a perspective of the range of
products offered and the positive outcomes from them. This is an effective channel to reach
prospective customers where it builds relationships and improving on this would lead to
prospective customers realizing the need to adopt the 800xA system. ABB also uses different
channels when providing product/services to its customer as respondent c mentions: “We have
the project which is one sales channel and we are working directly with the end customer. And
then we have system integrators which is also directly to the end customers but buys products
directly from ABB. Then you have OEM (original equipment manufacturer), wholesales, and
technical distributors (not common in Sweden). These are the different sales channels we have in
Sweden, but the biggest one for the chemical sector is projects.”
Customer relationship - The nature of ABB’s customer relationship is mainly that of a self-
service. The customers utilize ABB’s products while having limited interaction with the
company’s employees. ABB’s website has various self-help resources that includes white papers,
case studies, videos, and answers to frequently asked questions. This being said, for OGC
companies, there is a dedicated sales representative that works closely with customers to offer
products and services in the form of regular visits, phone and email support. This also serves as
personal assistance where the industry manager is engaged with the customer to provide
knowledge and service to the customer. But being the sole person for the job, this becomes a
disadvantage as all the players cannot be satisfied.
There is also an element of community where there are forums in which customers can
connect and interact. The division uses certain methods to have a good relationship with its
customers as respondent A mentions that the BU uses an account master plan. Individual
documents are created for identified major accounts by players. The document contains
103
information where the players are mapped and a “customer wallet” where the installed base
customers market accounts for. In this plan, there are different segments like strengthening and
deepening relationships with existing customers and so on. But as from interview by respondent
A, ABB is still slow in developing and using web based communities and channels.
6.3. Customer Retention
According to the conducted interviews it seems like ABB is developing a strong relationship
with their core customers. This is a critical success factor when catering to a market consisted of
rather few but large organizations which is the case here and in the B2B context in general as
individual customers can be responsible for a significant portion of revenues (Anderson et al.,
2001; Gupta, Lehmann, & Stuart, 2004). It is thus important for ABB to develop their
relationship and build up trust and mutual understanding as according to Anderson & Mittal
(2000) customer retention can be compared to a net present value proposition. If the relationship
is nurtured, more sales can be expected over time although the initial investment can be negative
due to the acquisition cost. ABB’s ability to retain their current customers seems to be quite
developed, at least for their core customers, which, according to Reichheld (1996), would
indicate that ABB is successfully creating value for their customers. This is in line with Sjöberg
(1994) and Håkansson, (1982) who note that B2B customer relationships are recognized as more
stable than B2C relationships and tend to be long-lasting. The “interaction-approach” developed
by the IPM group according to Ford (2004) seems to be accurate for this case study. The theory
describes the marketplace as a process of interaction between active buyers and sellers operating
within the marketspace creating a complex offering which both parties contribute to. An example
of this in this study can be how the Industry manager spends one day per week at a major
customer's site, this industry manager provides the customer with a service and support and in
turn the relationship becomes stronger and the industry manager acquires additional knowledge
through his stay at the customer site which he can adopt to other projects and customers.
There seems to be a clear plan in place at ABB regarding their current relationships with
core customers: “we have an account master plan, we are setting up a document for each for our
accounts which we have identified as our major accounts. In this document, we have set up a
player's map and a thing called customer wallet where we identify how much of the market or
the installed base our customers account for. There are different segments within this plan

104
including deepening our relationship with the customers and so on. This plan is divided down
specifically for each customer.” - Respondent A, which is essential for ABB given their
difficulties regarding customer acquisition. Retaining and building up their relationships with
current customers can also support their acquisition process regarding acquiring new projects
carried out by these same customers. Still, we can see from the interviews that it seems to be a
lack of focus on smaller customers. While all Respondents agree that the industry manager is
doing a fine job regarding their big customers, smaller customers are somewhat left out and that
is purely due to lack of resources according to Respondent C who states multiple times
throughout the interview that the industry manager needs additional support in the form of extra
human resource. The regular events hosted by ABB where the products are taken to the customer
site are still a great tool and should help to maintain the relationship with smaller customers
which do not attend ABB’s bigger events but from the data collected for this case study it seems
like additional focus is still needed.
Respondents A and C agree that the new CRM system is a positive step for the
organization while Respondent B does not use the system that extensively as he is more project
oriented. This new system allows ABB to coordinate their activities regarding a specific
customer globally. Respondent A pointed out that many of their customers operate globally just
like ABB so the possibility to gather data from different countries regarding the same customer
is a great improvement for ABB. One aspect of developing customer relationship is consistency.
This new CRM system has the possibility to coordinate ABB’s activities toward their customers
and be seen by the customer as a solid unit which acts as one. This can help ABB reach the
customer retention stage in the customer relationship life-cycle as identified by Henning-Thurau
& Klee (1997), the customer retention stage is when a customer becomes satisfied with the
supplier relationship and realizes that a deeper and stronger relationship would be in his interest.
Respondent C still noted that he felt like the implementation process of the system is not
coordinated enough and sales resources are not always putting in all the necessary data into the
system in time. It goes without saying that an organization can have all sorts of system but it
does not matter how good a system is or how powerful if the implementation of given system is
not efficient.

105
6.3.1. The Conversion Model
As discussed above, Anderson & Mittal (2000) suggest that retaining customers can be viewed
as a net present value proposition. Similar claim is made by Anderson et al. (2001) where the
link between customer satisfaction and profits were investigated. ABB currently utilizes a few
tools in order to map their customer satisfaction and get feedback, the green card/red card
function as well as the NPS mentioned before are such tools and it seems clear that ABB realizes
the importance of customer satisfaction and retention.
The conversion model works in a similar fashion as these customer feedback tools
currently utilized by ABB as the basic premise of the model is that uncommitted customers are
more likely to switch to another supplier. The green card/red card function and the NPS helps
ABB to explore how satisfied customers are and thus how committed they are to ABB through
rating and feedback regarding what is going well and what is lacking. What the conversion
model suggests but is currently not included in the process at ABB is the focus on other offerings
available to the customer. The model suggests that the supplier is to ask a customer: “Is there any
other x that appeals to you?” with x being the product/service, this is then followed up with the
question: “If so, how different is the one x from the other?”. This seems like a small thing but by
using these questions the supplier can not only more efficiently map the commitment level of a
given customer but also figure out why the customer is not committed and act on it if necessary.
As described earlier, the market under consideration here consists of few but big
organizations on the customer side and on the supply side which makes it imperative for
suppliers to monitor and gather feedback from their customers in order to detect if a customer is
not committed to them and is thinking about switching suppliers. Tools such as the conversion
model and similar customer feedback tools are extremely useful for organizations operating
within this market environment.
6.4. Customer Acquisition
As discussed in literature, aim of any company is to create customers that will help generate
profits and described as customer acquisition (Drucker, 1973; Kotler & Armstrong, 2009). ABB
segments its customers according to KPI’s as mentioned to respondent A, so that it can focus on
them and acquire customers so as to best satisfy it to generate profits (Jobber, 2010). But after
this process of segmentation, it is key that customers are understood. The process of acquisition
106
goes through numerous stages as represented in the customer acquisition process according to
Moncrief & Marshall (2005). Therefore, the project of customer acquisition needs to be funded
adequately so that results are achieved in the form of sales. Less than half of the companies have
an acquisition plan and this is also the case at ABB, where there is currently a process of
acquisition but it is not utilized or team in place as respondent A and C mention and focus is on
current customers due to lack of resources. To excel at customer acquisition, a main variable is
having an acquisition budget. In the case of ABB, there is a marketing budget but not an
acquisition budget as respondent A mentions. But ABB has a good understanding of the industry,
unfortunately not using its current CRM system to its full extent as respondent C mentions.
Since there is a potential growth in the automation of OGC market globally, it is key that
ABB have an acquisition strategy and team in place so that it can focus on capturing new
potential customers. But as respondent A and C mention, there is no acquisition team in place
that can assist this process, which is similar to what Levitte (1986) mentions about capturing
market when there is a growth potential for the market. In a B2B context, as Ang & Buttle
(2006) mention that without an acquisition strategy in place, potential customers could be lost to
competitors and potentially become preferred suppliers. As respondent B mentions similarly that
ABB could be losing potential customers due to this. Even though revenue from repeat or
existing customers accounts for 80% of a firm, without an acquisition strategy, developing
relations and retention would be for nothing without an acquisition strategy.
6.4.1. Ansoff’s Matrix
To answer the research question on new customer acquisition, the area of market penetration is
focused. According to Ansoff, market penetration is when a firm makes an effort to increase
sales without moving away from the original product and market. The product under focus is
800xA and the market being automation in Swedish oil, gas and chemicals with control and
process technologies. The aim of the BU is to increase sales and revenue with existing product to
new customers.
In light of the trend in the industry, companies operating within the OGC sector are
moving towards automation. Market dynamics and challenges are forcing changes within the
OGC industry’s approach towards technology usage. The factors influencing this are mainly due
to cost savings due to the drop-in oil prices and the industrial 4.0 era. This increasing trend to

107
digitalize the OGC industry has created more market for the Control Technologies BU in ABB.
ABB Ability, which includes the 800xA offers solutions for the Industrial 4.0 era that is present
and continue in the future.
A suggested approach for market penetration for ABB is to set short term growth policy
according to the growth of the market and the investment decisions of companies operating in
the OGC industry. There is also the importance of including After Sales care for existing
customers that can increase brand image and lead to additional sales for ABB. But currently
ABB is struggling in-terms of aftermarket as seen from interviews, when considering market
penetration strategy, it is key that it considers questions like does it have resources to meet the
objective of increasing sales. In the case of ABB, there is not enough human resource for sales.
As respondent C mentions: “Not right now when looking at the new customer side we are
working with our existing customer. In order to increase our volume and acquire new customers
we need more resources. It could be a project manager or a system engineer to support our
industry manager so he can be out and visiting existing and new customers.”
This leads to the issue of ABB being a highly-diversified company and the natural
tendency was to assign a single executive the responsibility for diverse businesses so as the
representative becomes a jack of all trades and a master of none. This is a serious issue as one
representative cannot focus on acquiring new customer and maintain relations with existing
customers and increase sales.
6.4.2. ACTMAN
The ACTMAN model which is an acronym for acquisition tactical management is a model that
breaks down the process of acquisition into six critical elements. With the help of this ABB can
manage the process of customer acquisition more efficiently. When looking at the elements in
regards to how ABB is currently handling new customer acquisition:
Targeting - The BU currently has one person who targets, identifies and recognizes customers'
needs for the firm’s offerings. The set of customers that have yet to be identified so that they
could benefit from the offerings could be difficult to acquire as ABB will need to help the
company recognize the need. There are three methods to target customer according to
ACTMAN: first-degree, second-degree and third-degree. First-degree targeting is when there is
108
data like demographic, behavior or psychological data regarding potential customers that is
individual customer targeting, ABB currently uses similar data which it gains from other
divisions like contact information, EBIT and KPI’s to get customers. Other people from different
divisions help and provide information about customers that is given to the industry manager that
contacts and executes the sale. Third-degree targeting is used by ABB, where it showcases its
products at marketing fairs and customers realize needs on their own. But since it uses direct
sales with representative and also with limited number of customers, this makes it somewhat
effective.
Creating Awareness and Positioning - When ABB has identified a potential customer, it makes
sure that the customer is aware of its products and services. It uses direct marketing
communication to create awareness with product trial. It positions the product with an image and
meaning of distinct competitive advantage, where it included the 800xA in its line of ABB
Ability. As mentioned by Philip Kotler, positioning is when the company designs its offerings
and image so that it occupies the customers mind in a meaningful and distinctive way that makes
ABB seen competitive.
It is important for ABB to carefully position its offering in line with products ability so that the
benefits are delivered as promised or risk destroying the potential customer’s equity and any add-
on selling. It is also important to implement add-on selling to maximize customer equity.
Acquisition Pricing - As ABB Ability system 800xA is a system that could be implemented as a
whole package or individually, ABB employs penetration pricing. As customers can buy only the
system or package it accordingly to its needs it the prices are tailored accordingly. It is difficult
to compare prices, however there is potential for ABB where having a higher introductory price
may help with evolving market. The evolving market being change towards industry 4.0, OGC
firms moving towards IoT, with the current introduction of Select I/O and analyzing Big Data.
Acquisition price of 800xA could also be lower if customer has existing system that can support
the 800xA platform without additional products.
Product trial - During marketing events, ABB allows potential customers to try its products. In
Vasteras at the 800xA development center, potential customers can try the 800xA system which

109
is setup according to the industry and potential customers can see how it can add value and also
if they have existing system in place, how it can be implemented on the existing system and
modified accordingly. This provides an excellent opportunity to showcase the versatility of the
product.
Product design – 800xA is a product that is developed and ready to help customers transition to
industry 4.0. The product is innovative and can be co-created according to customer needs as
mentioned earlier. Additionally, with the introduction of Select I/O, there is not new possibilities
for customers in-terms of cost savings in the project design and could be undertaken parallel. But
as mentioned in the interviews, currently ABB is facing issues delivering the project on time and
has to collaborate with Norway and Denmark to implement large projects.
User experience and Satisfaction - The firm’s ability to meet customer’s expectation in-terms
of function, delivery time and after sales service is crucial. When implementing the project for
the customer, ABB is currently facing trouble implementing it. This could mean delays in
delivering the product that can lead to dissatisfaction. Even if 800xA is a superior product
compared to competitors, if delivering the product of implementing the product package for the
customer can lead to disappointment and the customer is likely to repeat purchase.
6.4.3. Sales Funnel
Currently Salesforce is used to document visits of existing customers and for any additional sales
transaction that has occurred with customers. The data is entered by the industry manager that
includes information about product, when initial contact was made with the customer and who
was contacted to initiate the sale. ABB has customized Salesforce accordingly within its
customers buying path after initial meeting: Awareness, where the customer is made aware of the
need with products/services offered by ABB; Discovery, where different areas are discovered for
customers and product trials occur; Explore, where the customer might look at other products by
competitors; Tendering, where a price is quoted by ABB and submitted to the customer and
finally Buying, where the customer buys from ABB.
Within Salesforce, ABB can use the option of defining sales funnel where it can explore
best leads and have a clear understanding of where the prospective customer’s journey begins

110
and make the acquisition cost-effective. As seen in the literature, there are six stages in the
acquisition funnel. The first being prospect, where the company using KPI's seeks prospective
customers that can invest in its product/service. The next stage is approach, where the company
will approach the prospected customer and make it aware of the need to buy its product/service.
After this the company presents an offer in the form of a bid. after presenting the offer, there is
process of objections, where the customer will negotiate the price or the quantity of products and
the length of service. After the negotiations are completed, the deal is closed where the company
becomes a supplier. The final stage is crucial in recent times where the aim is to gain feedback
about the product/service, so that there is a good relation between the customer in the sense of
aftersales service or even gathering feedback if the product/service was delivered on time and if
it lives up to its expectation. To get an idea of the process, an example is provided is below:
Figure 34 – Acquisition funnel example
By defining each stage of the sales funnel process from an open top, where customers
that have basic awareness and curiosity of the firm and its product/service are located. Currently
ABB does this as using KPI's as respondent A mentions: “We have categorized customer as A, B
or C customers depending on their potential looking at revenues and EBITA and so on and thus
identify interesting customers. This is still a bit special for the chemical market here in Sweden
as the competitors are quite few and we have already established contact with most of them and
only small players that we have no contact with. We still have these key performance indexes and
a plan to establish new contacts”. But as respondent C mentions that it is currently not as
efficient as the single industry manager does not have enough support and resources to

111
accomplish this single handed. As the funnel narrows, prospective customers will become full-
fledged customers and ABB can align its marketing and sales accordingly. By understanding the
funnel, ABB can tailor its marketing strategy and can succeed in marketing and sales. By doing
so, the BU can also be an active player in the acquisition process as compared to current situation
where there is no such process occurring. The focus currently is on existing customers as
respondent C mentions in interviews that right now there is no focus on new customer
acquisition for the BU and are working with existing customers. The respondent further goes on
the mention that to increase sales volume and acquire new customers, the BU requires additional
resources. This could be a project manager or a system engineer who will support the existing
industry manager.
The potential gains when utilizing salesforce to its full potential are enormous. But implementing
this system in an established incumbent with thousands of employees is no easy task.
Communication problems between different business units in large organization is nothing new,
but successful implementation of a strong CRM system like Salesforce can help to mitigate this
risk. As of today, the implementation seems to be far from complete at ABB and maybe it is a
never-ending task. As respondent C mentions: "But it is a new tool and a little hard to
understand". ABB is facing some problems in communicating with customers as a single
cohesive organization and are often seen as many different companies by the customer,
depending on which product and/or service the customer is after, instead of a cohesive unit
which acts as one. Also, currently Salesforce is used only when executing a project and not for
customer acquisition, although the acquisition processes do exist within the software they are
currently not being utilized by the BU. As stated earlier, making a big organization streamlined
is no easy task but with increased implementation efforts of different features of salesforce it
should be possible fix some of the ongoing issues.

112
7. Conclusions and Recommendations
The chapter’s aim is to explicate conclusion of the master’s thesis to ABB, to help expand its
customer base in the Swedish Oil & Gas and Chemicals market with its current product. General
conclusions, limitations and theoretical contribution are presented along with recommendations
for ABB and suggestions for future research.
The aim of this research was to analyze how ABB can expand its customer base with its existing
product in an existing market. The following research questions were thus constructed after the
BU’s needs had been identified during a meeting with its staff:
Main research question: How can ABB, expand their customer base in the Oil & Gas and
Chemical industry in Sweden using existing products?
Sub-question 1: How can ABB retain their current customers within this segment?
Sub-question 2: How can ABB acquire new customers within this segment?
Both sub-questions will be answered in the recommendations later in this chapter. First a
summary of what has been done in this research is presented along with brief text on the market
analysis and the connection between the literature and the empirics. After recommendations,
theoretical contribution, limitations and suggested future research are presented.
What has been done?
Before constructing the methodological framework, certain delimitations had to be identified. In
collaboration with ABB, it was decided that the focus should be on using existing products
within existing market. This means that literature on expanding customer base through new
product development and/or new market entry was left out and the focus adjusted accordingly.
Single case study was then conducted employing a qualitative research strategy emphasizing
inductive approach. Both primary and secondary data were collected. Primary data in the form of
semi structured interviews with ABB personnel and secondary data included systematic literature

113
review and market data gathered from various reports. All the data collected was then analyzed
and differences between literature and current processes currently utilized by ABB brought to
light before recommendations were made.
Market overview
The market analysis shows that after a significant drop in oil and gas prices in recent years, the
future looks positive as prices are forecasted to increase. This will affect the chemicals market as
well as chemicals in Sweden is dependent on the Oil & Gas market. With the government’s aims
and policies aimed at sustainable environmental policy, stability and competitiveness, the aim for
firms operating in the OGC market is to comply to the laws and shift to technology that will help
achieve these goals set by government. The 800xA offered by ABB is a product that will help
achieve these goals. Similarly, the automation market is forecasted to grow in coming years with
a projection of 4% CAGR (ARC Advisory Group, 2016a). The goal in the Swedish market for
ABB is to become a preferred supplier and to achieve this, ABB needs to focus on building its
project team to execute large projects as currently it is facing issues and depending on Norway
and Denmark. Also with the increase in investments by firms in the OGC sector, to provide value
and have a competitive edge, ABB needs to develop and build its aftermarket sales.
Connection between literature and empirics
The literature review was mainly focused around the two research sub-questions on how to retain
current customers and how to acquire new customers. When comparing the literature to the
interviews conducted at ABB, we can see how the BU’s activities regarding customer retention
is mostly in line with the literature. Strong relationships are being formed with core customers
which according to the literature is a critical factor and indicates that ABB is creating value for
its customers. ABB is setting up an account master plan, where its collaboration plan with each
customer can be utilized and plan is formed regarding deepening the relationship, this is in line
with the literature review conducted. The main discrepancy between the literature on customer
retention and ABB’s current activities is the lack of focus on smaller customers as ABB simply
does not have enough human resources to cater to them efficiently. Furthermore, the conversion

114
model suggests tapping into the knowledge of current customers regarding the product offering
which seems like ABB is not utilizing currently.
There is more discrepancy between the literature surrounding customer acquisition and
ABB’s current activities. According to Ansoff’s growth matrix, the theory on market penetration
says that emphasis on increasing market share is by using promotions, effective marketing and
creating more value for customers. But from the interviews revealed that ABB is currently
lacking social media marketing which other firms operating in the industry are utilizing. ABB
also currently is not focusing on its aftermarket care which adds value to customers. But in terms
of marketing, it has exhibitions, fairs and information on website where customers can get more
information about its product/service. When looking at the ACTMAN model, ABB currently is
not effectively utilizing second degree targeting where customers are segmented and looked into
further. This is due to the fact that there is no team in place that can help the industry manager to
achieve this. Also, the post-purchase service is not efficient as they would like it to be,
improving this process can add considerable value. Since there is no acquisition team and the
acquisition strategy that exists is not being utilized, ABB cannot follow the customer acquisition
process effectively or utilizing the acquisition funnel which could help ABB break down
customers and capture them.
Regarding the business model
ABB Sweden and specifically the BU needs to tweak its Business Model to improve its customer
relationship, channels, resources and value addition blocks so as to excel in acquiring new
customers in the Swedish market. As mentioned earlier, customer relationships where it needs to
enhance its aftermarket care and utilize its red/green card customer feedback function better, so
that it can work on issues identified from customer feedback. Channels, where ABB Sweden
needs to embrace social media marketing as currently it is not focusing in the age of IoT and
social media, resources where ABB needs to add additional human resource that can help with
acquisition strategies and forming a team that can lighten the workload of the lone industry
manager and finally value proposition where it needs to develop a team so that large projects are
delivered on time and in the long run it does not need to depend on Denmark or Norway for
execution.

115
7.1. Recommendations
7.1.1. Sub-question 1: How can ABB retain their current customers within this
segment?
Overall this study has shown that currently ABB is doing a fairly good job in regard to their
customer development activities. The existence of an account master plan where one of the plan
aims at deepening their relationship with their customers is currently being developed. Other
activities such as customer visits, product services and marketing events are also being carried
out effectively by the organization.
As covered in the analysis earlier, there seem to be a lack of focus on smaller customers.
According to the data collected from the interviews this seems to be due to lack of human
resources and also omitted due to KPI assessment during prospecting customers. It is important
for ABB to be able to cater to all of their customers and for the industry manager to have time to
visit broader range of customers in order to deepen their relations. One recommendation is thus
to hire additional human resource to support the industry manager in these activities. The
researchers believe this to be imperative as if ABB is unable to carry out and keep their
relationships, a negative view of ABB can emerge among certain customers. Negative
experiences tend to reach other organizations which in turn can hinder ABB’s future acquisition
activities. By adding additional human resource for retaining or even helping with aftermarket
care can greatly assist in negating this possible negative image.
Additionally, the reason for the existence of this thesis is that ABB wants to expand its current
customer base by acquiring new customers. If ABB were to be successful and manage to acquire
new customers it is uncertain that they would be able to provide adequate service and support for
given customer currently due to lack of resources, either that or their current level of engagement
with other customers would suffer. Both options are undesirable for ABB as it is imperative for
ABB to retain their current core customers as argued earlier.
The conversion model was introduced in the literature review and further discussed in the
analysis. Customer feedback is always a critical element in relationship building and currently
ABB is utilizing feedback tools, being the green card/red card function and the NPS. As pointed
out in the analysis, the conversion model works in a similar fashion as it seeks to map current
customers and evaluate how committed they are to you as a supplier. The model suffers some

116
shortcomings like any other model, the main one being how hard it is to measure the term
“commitment”. Despite this difficulty, the model offers a more engaging alternative as it
encourages the user to not only focusing on what it is that he as a supplier is doing right and
wrong but also what are his competitors are doing right. It has been noted that customers do
research potential suppliers extensively and ABB’s customers are not different in that regard. An
argument can be made that in many cases the customer has better knowledge of what the
suppliers’ competitors are offering than the supplier himself. ABB can tap into this knowledge
while also potentially securing their current customer simply by asking them if there are other
products out there that appeals to the customer and why and then react and the necessary steps to
cater to the customer and align their offering to their needs. It is thus recommended that ABB
incorporates this chain of questioning as it is likely to identify, not only what their current
customers are seeking, but also what potential customers are looking for in a supplier. In short,
customer feedback should not be entirely focused on ABB’s activities, but combined with the
suppliers thought of other offerings. Furthermore, this kind of questioning is better to conduct
face-to-face rather than through questionnaire as the customer would be more likely to discuss
the matter in depth face-to-face.
7.1.2. Sub-question 2: How can ABB acquire new customers within this segment?
From the literature, semi-structured interviews and analysing with the literature, it can be seen
that even though there is a process in place for acquisition, the issue of lacking human resource is
holding back ABB from acquiring new customer in the Swedish market. Looking at the market,
the customer base available for ABB is rather limited and this leads to moderate supplier power.
Currently there is a marketing budget allotted for the BU, but this is not used for customer
acquisition activities. As mentioned in the literature, to excel in customer acquisition, the key
variable is budget for acquisition activities. Without having this variable, firms cannot excel in
customer acquisition. Budget can be allotted for new human resource that can help the existing
industry manager in identifying potential leads, documentation or other strategies that concern
with customer acquisition.
From the ACTMAN model, ABB can also include second-degree targeting where it can
utilize data regarding segment. This can include readily available data from income statements,

117
government data and etc. similar to first-degree targeting, it uses statistical model where ABB
can look at if OGC companies increase import of crude oil, then this can imply companies
operating will need to expand its operations. But this can take place when there is a customer
acquisition team with additional human resource that can gather data and create strategies.
The most efficient targeting method for ABB to acquire customers is using individual
scoring where it currently scores customers to target based on economic payout which is
currently implemented according to Respondent A. Additionally, ABB needs to adopt using
second-degree targeting where by adding additional human resource can assist in segmenting and
identifying customers early and reducing the workload of one sales representative present for the
BU.
Another crucial factor is aftermarket sales. ABB needs to focus on aftermarket sales so it
can provide support for customers and increase satisfaction that can improve sales with the
customer. Currently there is not an efficient aftermarket service in place as respondent A
mentions in the interviews. This needs to be addressed so that it can add value to its customers
and lead to new customer acquisition. In the current age, service plays an important part, and if
there is a strong aftermarket or post-purchase service in place, it would make ABB a preferred
supplier for the companies operating in OGC industry in Sweden.
Looking at the current channels used by ABB in its business model, it is missing to
access customer through the use of internet. In this age where internet and social media plays an
important role, a way that ABB can get access to new customers is embracing social media
marketing and sales channel. The world recently has become connected due to social media,
which have become a powerful platform for companies to engage and communicate with
customers. It should be noted that ABB needs to present its product/services generates value to
the prospective customer, so as customers see it cares and values what ABB provides. However,
ABB needs to note that adopting social marketing and sales requires time to establish trust and
credibility, but it will be rewarded with qualified leads, higher conversion and loyal customer
base.
More and more B2B marketers use automation in marketing to generate leads. Nearly
80% of the companies conduct research online before buying a product or service and this is true
in B2B as well. Platforms similar to Dustin.se could prove useful and powerful for ABB to
access new customers. For the case of 800xA platform this might not be viable at present as it is
118
a system and is packaged according to customer needs. But in the future, as firms are digitizing,
it can prove useful to embrace digital sales and marketing tools. As respondent A mentions in
interviews that ABB Sweden is currently working with numerous activities over the web.
However, the business unit could take more action regarding this. One reason mention by the
respondent was that as ABB is a big organization and on occasions it is slow in adopting new
technology and the process in evolving and still developing web communications with its
customers. There is currently a better version of the web, yet it could be better with addition of
making it an interactive process where new customers in the Swedish market can connect with
the groups and twitter accounts that are present. The respondent acknowledges that there is a
huge opportunity in working with this channel to communicate with its customers
To acquire customers that are limited in number in the Swedish market, ABB mainly
needs to increase its human resource. The reason behind this is so that to acquire new customers
there needs to be a customer acquisition strategy with a team. from the data collected, because of
this limitation in human resource, ABB is currently unable to acquire new customers and is only
able to maintain good relations with existing customers. The existing industry manager who is
engaged in both customer acquisition and retention activities cannot engage in both due to time
constraints. A single person cannot conquer the world but it takes a team and a strategy.
7.2. Theoretical contribution
There is very limited amount of research conducted for the DCS market in Swedish context.
Although this is a single case study with the aim of expanding the customer base of ABB, it still
offers some value to the field as it investigates a company maneuvering within the market.
Further research on DCS markets are still needed in order to identify what contributes to a
success and/or failure for organizations supplying these systems.
There is also a lack of research on customer acquisition in the context of using current
products and operating within the current market. By presenting how ABB can utilize the
presented models in order to acquire new customers using their 800xA system within their
current market the authors hope to contribute to this theoretical base where with the emergence
of Industry 4.0, acquiring new customers in this small market is challenging.

119
7.3. Limitations
The findings in this research cannot be generalized to a bigger population due to the excessive
focus on the case of ABB and the inward focus of the research. This means that other suppliers
in the market, being ABB’s competitors, were not analyzed which would have offered a different
perspective. Still, as mentioned in the methodology, this research could offer some value to
similar organizations operating within similar industry and facing problems in expanding their
customer base. Replicability is not high for this research given the qualitative nature of it.
Replicating semi-structured interviews and analysis of them is next to impossible. That being
said, certain steps have been taken in order to try to increase the replicability, being detailed
description of each step of the research. Another limitation is the lack of primary data. This
occurred due to the fact that the BU under investigation is small and only a handful of people can
contribute relevant information about its operations. Additionally, the initial plan was to
interview key customers of ABB to map what it is that customers operating within this market
are looking for in a supplier. Due to time and contact constraints, interview with customers were
not conducted.
7.4. Future Research
From the data collected, there are several suggestions for future research. Looking into the future
in terms of the divide between research and practise that is in new customer acquisition, from the
research it can be noted that models like ACTMAN, Ansoff’s growth matrix and conversion
model can be utilised by ABB to acquire customers in the Swedish market. According to
researchers like Levitte (1986) and Ang & Buttle (2002), they have presented ways to acquire
new customers and covered the core means to do so. But in a market, that has limited number of
customer with supplier power being moderate, a possible way to investigate acquiring new
customers can be by using multiple case studies. A possible example is considering Emerson,
Honeywell and ABB in the Swedish market with the products that serve the automation in OGC
market.
Since the research was limited to only investigating how to acquire new customers and
retaining existing, during the research, there were few observations that surfaced being creating
new customer value, new business models and efficiency of the value chain. Additionally,
exploring the option of using the product for renewable sources like bio-gas can be explored in

120
future research as government aims and policies for 2030 aim at phasing out fossil fuels and also
Volvo cars recently mentioned it will stop developing new diesel engines as cost of reducing
emissions is expensive (Reuters UK, 2017). ABB uses a matrix structure; the roles are unclear
and this could also be investigated in the future if this is hindering the process of expanding their
customer base.

121
8. References
ABB (2017). ABB Ability™ System 800xA single channel I/O for a fast and cost-saving project
execution. [online]Available at:
http://www.abb.com/cawp/seitp202/f90f64d32ea9f1d7c12580e30065ce2a.aspx [Accessed 29
May 2017].
Akcura, M. Tolga and Kannan Srinivasan (2005): Research Note: Customer Intimacy and Cross-
Selling Strategy, Management Science, 51 (6), 1007-1012.
Akzonobel.com. (2017). [online] Available at:
https://www.akzonobel.com/polymer/aboutus/iso_certificates/stenungsund_sweden.aspx
[Accessed 17 Mar. 2017].
Anderson, E. & Mittal, V., 2000. Strengthening the satisfaction-profit chain. Journal of Service
Research: JSR, 3(2), pp.107–120.
Anderson, Eugene W., Claes Fornell, and Donald R. Lehmann. (1994). "Customer Satisfaction,
Market Share, And Profitability: Findings From Sweden". Journal of Marketing 58.3: 53-66.
Print.
Anderson, H, Havila, V & Salmi, A 2001, 'Can you buy a business relationship?On the
importance of customer and supplier relationships in acquisitions' Industrial Marketing
Management, vol 30, no. 7, pp. 575-586.
Ang, L., & Buttle, F. (2006). Managing for Successful Customer Acquisition: An Exploration.
Journal of Marketing Management, 22(3-4), 295-317.
Ang, L., & Buttle, F. (2002). "ROI in CRM: a customer journey approach". In: Proceedings of
the Industrial Marketing andPurcliasing Conference, Perth, Australia, Decembe
ARC Advisory Group (2016a). Distributed Control Systems for Electrical Power Generation.
Global Market Research Study - Market Analysis and Forecast Through 2020. ARC Advisory
Group.

122
ARC Advisory Group (2016b). Distributed Control Systems, Global Market Research Study.
Market Analysis and Forecast through 2020. ARC Advisory Group.
Atradiuscollections.com. (2017). Natural gas prices reached a turning point | Atradius. [online]
Available at: https://atradiuscollections.com/global/reports/natural-gas-prices-have-reached-a-
turning-point.html [Accessed 25 Feb. 2017].
Berry, L.L. (2002). Relationship Marketing of Services Perspectives from 1983 and 2000.
Journal of Relationship Marketing, 1(1), pp.59–77.
Blattberg, Robert C, Getz, Gary and Thomas, Jacqueline S. (2001), Customer equity: building
and managing relationships as valuable assets, Boston, Harvard Business School Press
Blombäck, A. (2005). Supplier brand image - a catalyst for choice. PhD. Jönköping International
Business School.
Blythe, J. (2009). Principles and practice of marketing. Hampshire: Cengage Lerning.
Bolton, R.N., (1998). A Dynamic Model of the Duration of the Customer's Relationship with a
Continuous Service Provider: The Role of Satisfaction. Marketing Science, 17(1), pp.45–65.
Bolton, Ruth N. et al., (2006). The effect of service experiences over time on a supplier's
retention of business customers. Management Science, 52(12), pp.1811–1823.
Borealisgroup.com. (2017). Borealis Stenungsund | Borealis. [online] Available at:
http://www.borealisgroup.com/sv/stenungsund/ [Accessed 20 Mar. 2017].
BP (2017). BP Energy Outlook. 2017 edition. [online] BP. Available at:
https://www.bp.com/content/dam/bp/pdf/energy-economics/energy-outlook-2017/bp-energy-
outlook-2017.pdf [Accessed 25 May 2017].
Bryman, A. and Bell, E. (2011). Business research methods. 3rd ed. New York: Oxford
University Press.
Bryman, A., (2012). Social research methods 4. ed., Oxford: Oxford University Press.

123
Buttle, F. (2009). Introduction to customer relationship management. In Customer relationship
management: concepts and technologies (2nd ed., pp. 1-23). London: Taylor & Francis.
Buttle, Francis, and Stan Maklan., (2015). Customer Relationship Management. 3rd ed. London:
Routledge, Print.
Charms I/O Cards Deal Straight (Signals) for Users. (2017). Control. [online] Available at:
http://www.controlglobal.com/articles/2009/emex09-21/ [Accessed 30 May 2017].
Christopher, Martin, Payne, Adrian and Ballantyne, David (1991), Relationship Marketing,
Oxford, Butterworth-Heineman
Credit Suisse (2012). Global Industrial Automation. Credit Suisse.
Credit Suisse (2013). ABB. Switzerland: Credit Suisse.
David Ford, (2004). Guest editorial: The IMP Group and international marketing. International
Marketing Review, 21(2), pp.139–141.
De Chernatony, L. & McDonald, M. (1998). Creating Powerful Brands in Consumer, Service
and Industrial Markets. Butterworth Heinemann.
Deloitte (2016b). Price Forecast - Resource evaluation & Advisory. [online] Deloitte, p.17.
Available at: https://www2.deloitte.com/content/dam/Deloitte/ca/Documents/energy-
resources/ca-en-rea_forecast_2016_12_EN_AODA.PDF [Accessed 26 Feb. 2017].
Deloitte, (2016a). The balancing act: A look at oil market fundamentals over the next five years.
[online] Deloitte. Available at: https://www2.deloitte.com/ru/en/pages/energy-and-
resources/articles/2016/future-of-oil-markets-next-five-years-marketpoint.html [Accessed 26
Feb. 2017].
Ding, M. and J. Eliashberg (2002): Structuring the New Product Development Pipeline,
Management Science, 48 (3), 343-363.

124
Dowling, Graeme (2002), "Customer relationship management: in B2C markets, often less is
more", Califomia Management Review, Spring, Volume 44, No. 3, pp.87-104
Doyle, Charles. (2011) "Ansoff matrix." A Dictionary of Marketing. : Oxford University Press.
Oxford Reference. 2011. Date Accessed 30 Mar. 2017
<http://www.oxfordreference.com.ezproxy.ub.gu.se/view/10.1093/acref/9780199590230.001.00
01/acref-9780199590230-e-0082>.
Drucker, Peter F. (1973), Management: tasks, responsibilities, practices. Harper and Row, p.61
Dwyer, Sean, John Hill and Warren Martin (2000): An Empirical Investigation of Critical
Success Factors in the Personal Selling Process for Homogenous Goods, Journal of Personal
Selling & Sales Management, 20 (3), 151-159.
Ec.europa.eu. (2016). Oil and petroleum products - a statistical overview - Statistics Explained.
[online] Available at: http://ec.europa.eu/eurostat/statistics-
explained/index.php/Oil_and_petroleum_products_-_a_statistical_overview [Accessed 12 May
2017].
Ec.europa.eu. (2017). Supply, transformation and consumption of gas - annual data - Eurostat.
[online] Available at: http://ec.europa.eu/eurostat/web/products-datasets/-/nrg_103a [Accessed 3
Mar. 2017].
Egan, C., & Shipley, D., & Howard, P. (1992). The importance of Brand Names in Industrial
Markets. In Baker, M.J. Ed. Perspectives on Marketing Management, 2, p. 307-324.
Energimarknads inspektionen, (2016). The Swedish Electricity and Natural Gas Market 2015.
[online] Esklistuna: Swedish Energy Markets Inspectorate, pp.46-62. Available at:
http://www.energimarknadsinspektionen.se/Documents/Publikationer/rapporter_och_pm/Rappor
ter%202016/Ei_R2016_10.pdf [Accessed 27 Feb. 2017].
Energimyndigheten, (2016). Energy Indicators in figures 2016 - Follow-up of Sweden´s energy
policy goals. [online] Available at: http://www.energimyndigheten.se/en/news/2016/energy-

125
indicators-in-figures-2016---follow-up-of-swedens-energy-policy-goals/ [Accessed 15 Mar.
2017].
Energymarknadsinspektionen, (2013). The Swedish Electricity and Natural Gas markets 2012.
[online] Eskilstuna: The Swedish Energy Markets Inspectorate, p.58. Available at:
http://ei.se/Documents/Publikationer/rapporter_och_pm/Rapporter%202013/Ei_R2013_14.pdf
[Accessed 10 Mar. 2017].
European Commission, (2014). Sweden Country Report. [online] European Commission, pp.215-
221. Available at:
https://ec.europa.eu/energy/sites/ener/files/documents/2014_countryreports_sweden.pdf
[Accessed 8 Mar. 2017].
Ey.com. (2016). Chemicals in Europe: the way forward. [online] Available at:
Gallo, Amy. (2014). "The Value of Keeping The Right Customers". Harvard Business Review:
n. pag. Web. 24 Mar. 2017.
GEFC secretariat (2017). Global gas outlook 2040. [online] Doha, Qatar: GEFC. Available at:
https://www.gecf.org/_resources/files/events/gecf-global-gas-outlook-2040---synopsis/gecf-
global-gas-outlook-2040---synopsis.pdf [Accessed 27 Feb. 2017].
Goodwin, Ross and Ball, Brad (2003), "What marketing wants the CEO to know". Marketing
Management, Volume 12, No. 5, pp.18-23
Gounaris, S.P., (2005). Trust and commitment influences on customer retention: insights from
business-to-business services. Journal of Business Research, 58(2), pp.126–140.
Gummesson, E., (2002). Relationship Marketing in the New Economy. Journal of Relationship
Marketing, 1(1), pp.37–57.
Gupta, S. & Lehmann, D., (2004). Valuing Customers. JMR, Journal of Marketing Research,
41(1), pp.7–18.

126
Gupta, Sunil, Donald R. Lehmann and Jennifer Ames Stuart (2004): Valuing Customers, Journal
of Marketing Research, 41 (1), 7-18.
Gurjeet Kaur, R.D. Sharma & Neha Mahajan, (2012). Exploring customer switching intentions
through relationship marketing paradigm. International Journal of Bank Marketing, 30(4),
pp.280–302.
Growthmarkets-oil.com. (2017). Continuous Control Solutions - Think outside the black box -
Oil & Gas Agenda. [online] Available at: http://www.growthmarkets-
oil.com/contractors/controls-consoles-and-panels/continuous-control-solutions1/ [Accessed 25
May 2017].
Håkansson, H., (1982). International marketing and purchasing of industrial goods: an
interaction approach, Chichester: Wiley.
Hennig-Thurau, T. & Klee, A., (1997). The Impact of Customer Satisfaction and Relationship
Quality on Customer Retention: A Critical Reassessment and Model Development. Psychology
& Marketing (1986-1998), 14(18), p.737.
Hennig-Thurau, T., (2000). Relationship Quality and Customer Retention through Strategic
Communication of Customer Skills. Journal of Marketing Management, 16(1-3), pp.55–79.
http://www.ey.com/nl/nl/industries/netherlands-sectors/chemicals/ey-chemicals-in-europe
[Accessed 18 Feb. 2017].
International Energy Agency, (2013). Energy Policies of IEA Countries. International Energy
Agency, pp.26-28.
International Energy Agency, (2014). Energy Supply Security, Emergency Response for IEA
Countries. [online] Paris: International Energy Agency, pp.418-431. Available at:
https://www.iea.org/publications/freepublications/publication/ENERGYSUPPLYSECURITY20
14.pdf [Accessed 21 Feb. 2017].

127
International Energy Agency, (2014). Energy Supply Security, Emergency Response for IEA
Countries 2014. Paris: International Energy Agency, pp.140-154.
International Energy Agency, (2016). Natural Gas Information 2016 edition. [online]
International Energy Agency, p.60. Available at:
http://wds.iea.org/wds/pdf/Gas_documentation.pdf [Accessed 7 Mar. 2017].
Jackson, T. W. (2005). CRM: From "art to science." Journal of Database Marketing & Customer
Strategy Management, 13, 76-92.
Johnston, Mark W. and Greg W. Marshall (2006): Churchill/ Ford/ Walker's Sales Force
Management, 8. ed., Boston.
Johnston, W.J., & Lewin, J.E. (1996). Organizational Buying Behaviour: Toward an Integrative
Framework. Journal of Business Research. 35, p. 1-15.
Keller, K.L. (2003). Building, Measuring, and Managing Brand Equity. New Jersey: Prentice
Hall Inc.
Kemira. (2017). Om oss. [online] Available at: http://www.kemira.com/se/about-
us/pages/default.aspx [Accessed 20 Mar. 2017].
KPMG. (2014). Global Auto Executive Summary. Retrieved 2017-01-04, at:
https://home.kpmg.com/xx/en/home.html
Krug, J.A. & Aguilera, Ruth V, (2005). Top management team turnover in mergers &
acquisitions. Advances in mergers and acquisitions, pp.121–149.
Levitt, Theodore (1986), Vte marketing imagination. New York, Free Press
Louise Young & Sara Denize, (1995). A concept of commitment: alternative views of relational
continuity in business service relationships. Journal of Business & Industrial Marketing, 10(5),
pp.22–37.
Lundin Petroleum (2017). Corporate Presentation. Lundin Petroleum.

128
Malaval, P. (2001). Strategy and Management of Industrial Brands. Kluwer Academic
Publishers.
MarketLine, (2014). Chemicals in Sweden. MarketLine.
MarketLine, (2016). Global Oil & Gas - January 2016. MarketLine.
moga.saoga.org.za (n.d.). Oil & Gas Value chains. [online] http://moga.saoga.org.za. Available
at:
http://moga.saoga.org.za/sites/default/files/managed/files/resources/O%26G%20Value%20Chain
.pdf [Accessed 17 Apr. 2017].
Moncrief, & Marshall. (2005). The evolution of the seven steps of selling. Industrial Marketing
Management, 34(1), 13-22.
Moncrief, William C. and Greg W. Marshall (2005): The Evolution of the seven steps of selling,
Industrial Marketing Management, 34 (1), 13-22.
Moody, D. (2002). Empirical Research Method. Available at:
http://folk.uio.no/patrickr/refdoc/methods.pdf
New.abb.com. (2017). Industrial Automation division. [online] Available at:
http://new.abb.com/about/our-businesses/industrial-automation-division [Accessed 15 Mar.
2017].
Ngai, E. W. T., Xiu, L., & Chau, D. C. K. (2009). Application of data mining techniques in
customer relationship management: A literature review and classification. Expert Systems with
Applications, 36, 2592-2602.
Nynas AB (2017). Annual Report 2016. [online] Stockholm: Nynas AB. Available at:
https://www.nynas.com/globalassets/investor-relations/nynas-annual-report-2016.pdf [Accessed
30 May 2017].

129
Nynas.com. (2017). About us. [online] Available at: https://www.nynas.com/en/about/ [Accessed
20 Mar. 2017].
Orbis (2016). University of Gothenburg. [online] Available at: https://orbis-bvdinfo-
com.ezproxy.ub.gu.se/version-
2017510/Report.serv?_CID=1218&context=SIHWDU0UY70BJFS&SeqNr=0 [Accessed 15
Apr. 2017].
Osterwalder A. & Pigneur Y., (2010), Business model Generation: A Handbook for Visionaries,
Game Changers and Challengers striving 1st ed. New Jersey: John Wiley.
Peppers, Don and Martha Rogers (1999): Growing Revenues with Cross-Selling, Sales &
Marketing Management, 151 (6), 24.
Perstorp.com. (2017). Site Stenungsund. [online] Available at:
https://www.perstorp.com/en/about/site_stenungsund/ [Accessed 17 Mar. 2017].
Preem (2016). 2015, Annual report. [online] Preem. Available at:
https://www.preem.se/globalassets/om-preem/finansiell-
info/arsredovisningar/2015/preem_annual-report_2015_financial-report.pdf [Accessed 22 Mar.
2017].
Psac.ca. (n.d.). Industry Overview | PSAC. [online] Available at:
http://www.psac.ca/business/industry-overview/ [Accessed 14 Mar. 2017].
Quandl, (2017). Brent Crude Futures, Continuous Contract. [online] Quandl.com. Available at:
https://www.quandl.com/data/CHRIS/ICE_B1-Brent-Crude-Futures-Continuous-Contract-1-B1-
Front-Month [Accessed 21 Feb. 2017].
Quotes.wsj.com. (2017). LUPE.SE Company Profile & Executives - Lundin Petroleum AB - Wall
Street Journal. [online] Available at: http://quotes.wsj.com/SE/XSTO/LUPE/company-people
[Accessed 10 Mar. 2017].

130
Regeringskansliet. (2015). Strategy for a non-toxic environment. [online] Available at:
http://www.government.se/articles/2015/08/strategy-for-a-non-toxic-environment/ [Accessed 5
Mar. 2017].
Reichheld, F.F. & Teal, T., (1996). The loyalty effect: the hidden force behind growth, profits,
and lasting value, Boston, Mass.: Harvard Business School Press.
Reichheld, F.F. and W.E. Jr. Sasser (1990), "Zero Defections; Quality Comes to Services,"
Harvard Business Review, 68 (September-October), 105-111
Reuters UK. (2017). Volvo Cars to stop developing new diesel engines -CEO. [online] Available
at: http://uk.reuters.com/article/volvocars-diesel-idUKL8N1IJ1AI [Accessed 22 May 2017].
Reuters. (2017). ${Instrument_CompanyName} ${Instrument_Ric} Company Profile |
Reuters.com. [online] Available at:
http://www.reuters.com/finance/stocks/companyProfile?symbol=LUPE.ST [Accessed 15 Mar.
2017].
Richards, K. A. & Jones, E. (2008). Customer relationship management: Finding value drivers.
Industrial Marketing Management, 37, 120-130.
Riezebos, R. (2003). Brand Management – A Theoretical and Practical Approach. Harlow,
England: Pearson Education.
Robinson, P.J., Faris, C.W. & Wind, Y. (1967). Industrial Buying and Creative Marketing.
Boston: Allyn & Bacon, Inc.
Ruiz Díaz, Gonzalo. (2017). "The Influence of Satisfaction On Customer Retention In Mobile
Phone Market". Journal of Retailing and Consumer Services 36: 75-85. Web. 23.Mar. 2017.
Rust & Zahorik, (1993). Customer satisfaction, customer retention, and market share. Journal of
Retailing, 69(2), pp.193–215.

131
Shajahan, S. (2004). Relationship marketing. 1st ed. New Delhi: Tata McGraw-Hill p. 83.
Shankar, V. and Carpenter, G. (2017). The Second-Mover Advantage. [online] Kellogg Insight.
Available at: https://insight.kellogg.northwestern.edu/article/the_second_mover_advantage
[Accessed 20 May 2017].
Shapiro, Benson P. (1974): Manage the customer, not just the sales force, Harvard Business
Review, 52 (5), 127.
Simister., (2011). Ansoff Growth Matrix – Four Ways To Grow A Business. [online]
Differentiateyourbusiness.co.uk. Available at:
http://www.differentiateyourbusiness.co.uk/ansoff-growth-matrix-four-ways-to-grow-a-business
[Accessed 30 Mar. 2017].
Sjoberg, O., (1994). Book Reviews: Networks : Bjorn Axelsson and Geoffrey Easton (eds.):
Industrial Networks: a New View of Reality. London: Routledge, 1992. Acta Sociologica, 37(4),
pp.423–426.
Sohnchen, F. & Albers, S. (2010). Pipeline management for the acquisition of industrial projects.
Industrial Marketing Management, 39, 1356-1364.
St1 Group (2017). Annual Report 2015. [online] St1 Group OY. Available at:
http://www.st1.eu/files/16166/St1+Group+Oy+Annual+Report+2015+in+English.pdf [Accessed
14 Mar. 2017].
Statistikdatabasen. (2017a). Imports and exports of goods by commodity group SPIN 2007,
adjusted for non-response, confidential data excluded. Year 2000 - 2016-Statistikdatabasen.
[online] Available at:
http://www.statistikdatabasen.scb.se/pxweb/en/ssd/START__HA__HA0201__HA0201E/ImpEx
pSPIN2007TotAr/table/tableViewLayout1/?rxid=7aa73e59-59e7-4b74-aee3-d067e6e91be3
[Accessed 23 Feb. 2017].
Statistikdatabasen. (2017b). Imports and exports of goods by trading partner and commodity
groups according to SITC rev3/rev4, not adjusted for non-response, confidential data excluded.

132
Year 1995 - 2016-Statistikdatabasen. [online] Available at:
http://www.statistikdatabasen.scb.se/pxweb/en/ssd/START__HA__HA0201__HA0201D/OImpE
xpSITC4Ar/?rxid=249b51ae-0e64-4c9d-b9d3-008e7c330334 [Accessed 5 Mar. 2017].
Statistikdatabasen. (2017c). Statistical database - Select table. [online] Available at:
http://www.statistikdatabasen.scb.se/pxweb/en/ssd/?rxid=3651859c-8b35-4ed4-9511-
e0a56739d44a [Accessed 20 Feb. 2017].
Swedish Energy Agency, (2015). Energy in Sweden 2015. Swedish Energy Agency, pp.57-69.
System 800xA Solutions Handbook. (n.d.). 1st ed. Västerås: ABB.
Tethysoil.com. (2017). About Tethys Oil | Tethys Oil. [online] Available at:
https://www.tethysoil.com/en/about-tethys-oi [Accessed 16 Mar. 2017].
ThaeMin Lee & JongKun Jun, (2007). Contextual perceived value? Investigating the role of
contextual marketing for customer relationship management in a mobile commerce context.
Business Process Management Journal, 13(6), pp.798–814.
The vision for 2025 and beyond. (2004). The European Technology Platform for Sustainable
Chemistry, pp.5-7
Tikkurilagroup.com. (2017). Tikkurila Group - Om företaget. [online] Available at:
https://www.tikkurilagroup.com/countries/sweden/om_foretaget [Accessed 12 May 2017].
U.S. Energy Information Administration, (2017). Short-Term Energy Outlook (STEO) - January
2017. [online] U.S. Energy Information Administration. Available at:
https://www.eia.gov/outlooks/steo/archives/Jan17.pdf [Accessed 28 Feb. 2017].
US Energy information administration (2017). Short-term energy outlook. Natural gas. [online]
US Energy information administration, pp.1-9. Available at:
https://www.eia.gov/outlooks/steo/pdf/steo_text.pdf [Accessed 2 Mar. 2017].

133
Villanueva, J., Yoo, S., & Hanssens, D. M. (2008). The impact of marketing-induced versus
word-of- mouth customer acquisition on customer equity growth. Journal of marketing Research,
45(1), 48-59.
VINNOVA, (2016). Chemical Industry Companies in Sweden. VINNOVA.
World Bank (2017). Commodities Market Outlook. [online] Commodities Price Forecast: World
Bank, p.1. Available at: http://pubdocs.worldbank.org/en/926111485188873241/CMO-January-
2017-Forecasts.pdf [Accessed 3 Mar. 2017].
World Bank, (2017). Commodity Markets Outlook - Investment Weakness in Commodity
Exporters. [online] World Bank. Available at:
http://pubdocs.worldbank.org/en/820161485188875433/CMO-January-2017-Full-Report.pdf
[Accessed 25 Feb. 2017].
Www3.kemi.se. (2013). Sectors using largest quantities of chemicals in Sweden - Swedish
Chemicals Agency. [online] Available at: http://www3.kemi.se/en/Content/Statistics/Statistics-in-
brief/Summary-tables-and-diagrams/Sectors-using-largest-quantities-of-chemicals-in-Sweden/
[Accessed 21 Feb. 2017].
Www3.kemi.se. (2013). The ten most used substances in chemical products - Swedish Chemicals
Agency. [online] Available at: http://www3.kemi.se/en/Content/Statistics/Statistics-in-
brief/Summary-tables-and-diagrams/The-ten-most-used-substances-in-chemical-products/
[Accessed 25 Feb. 2017].
YIN, R. K. (1994) Case Study Research: Design Methods. Second Edition, Sage Publications,
San Francisco
Yin, R.K., (2009). Case study research: design and methods 4. ed., London: SAGE.
Zeithaml, Valarie A., Berry, Leonard L. & Parasuraman, A., 1996. The behavioral consequences
of service quality. (includes appendix). Journal of Marketing, 60(2), p.31.

134

135
Appendix
Interview guide for ABB employees (internal interviews)
About the person
• Position
• Day to day activities
• Responsibilities
• How long have you worked at ABB? How long in your current position?
• Team? Members in sales?
View about ABB
• According to you what are the strengths, weaknesses, opportunities & threats for this
division?
Customer retention and development
• Is there any plan in place and/or guidelines regarding customer development?
• Do you feel like the current customer development efforts are sufficient?
• How many people are in charge of sales and marketing for Oil, Gas & Chemicals?
• Is that enough in your opinion?
• Through which channels do you contact customers?
• Do you believe the shift over to Salesforce was a good move?
• In what way has this change affected you?
• Overall, regarding customer development and retention for the division, what do you feel
are your strengths and what is lacking?
Customer acquisition
• Is customer acquisition part of your job description duties?
• How much time is dedicated for new customers acquisition by you? Do you feel your
personal resources are sufficient for acquiring new customers?
• How does ABB currently acquire new customers and is there a process?
• How do you feel about the current acquisition process?
o Is there something lacking in your opinion?

136
o What is good about the current process?
• Are the current set of products and services sufficient to serve the current market?
• Identifying new projects and/or a new player in the market is important as the Oil & Gas
market in Sweden is rather confined, do you feel like ABB has the capabilities to identify
these opportunities early and efficiently enough?
• Your opinion about prospecting and contacting new customers?
• Is there any set budget for acquiring new customers?
• Is there a department or person assigned for new customer acquisition by ABB?
• Overall, regarding customer acquisition for the division, what do you feel are your
strengths and what is lacking?